Surfactant effect on the multiscale structure of bubbly flows · Fig. 1 Multiscale structure of...
14
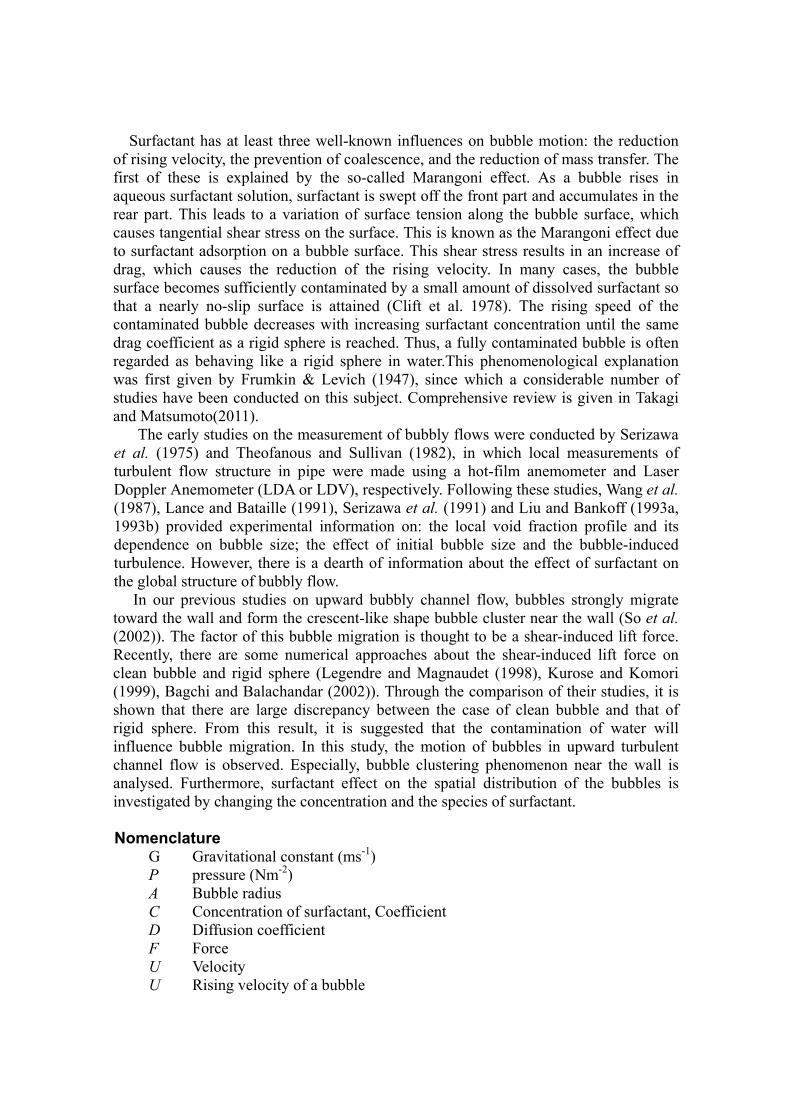
Surfactant effect on the multiscale structure of bubbly flows Shu TAKAGI, Department of Mechanical Engineering, The University of Tokyo Abstract Small amounts of surfactant can drastically change bubble behavior. For example, a bubble in aqueous surfactant solution rises much slower than one in purified water. This phenomenon is explained by the so-called Marangoni effect caused by a nonuniform concentration distribution of surfactant along the bubble surface. In other words, a tangential shear stress appears on the bubble surface due to the surface tension variation caused by the surface concentration distribution, which results in the reduction of the rising velocity of the bubble. More interestingly, this Marangoni effect influences not only the rising velocity, but also the lateral migration in the presence of mean shear. Furthermore, these phenomena influence the multiscale nature of bubbly flows and cause a drastic change in the bubbly flow structure. In this article, we review the recent studies related to these interesting behaviors of bubbles caused by the surfactant adsorption/desorption on the bubble surface. Introduction Bubbly flows are encountered in many industrial and environmental processes, such as chemical reactors, heat exchangers and aeration systems for water purification, They are also utilized to reduce the frictional drag of a moving body in water by injecting bubbles in the turbulent boundary layer, which has recently attracted much attention from many researchers (see Sugiyama et al. 2008 and Ceccio 2010 for a comprehensive review). In these bubbly flows, small amounts of surfactant can cause dramatic changes in the flow structures through the multiscale effects of the flows. Figure 1 represents the idea of the multiscale structure of bubbly flows in aqueous surfactant solutions. Small amounts of surfactant dissolved in the water adsorb onto the bubble surface, greatly affecting the bubble rising motion. Likewise affected are bubble-bubble interactions; the coalescence of small bubbles hardly occurs in the presence of surfactant. These factors are coupled and can dramatically change the whole bubbly flow structure. For example, because of this structural change of bubbly flow and also the influence of the adsorbed surfactant on mass transfer, the total mass transfer through a bubbly plume in an aeration tank can be quite different with and without surfactant. Fig. 1 Multiscale structure of bubbly flows in aqueous surfactant solution Surfactant adsorption on the gas‐liquid interface Marangoni effect Bubble‐bubble interaction Bubble suspension Bubbly plume in aeration tank Large Small SCALE Large Small SCALE
Transcript of Surfactant effect on the multiscale structure of bubbly flows · Fig. 1 Multiscale structure of...

Surfactant effect on the multiscale structure of bubbly flows
Shu TAKAGI,
Department of Mechanical Engineering,
The University of Tokyo
Abstract Small amounts of surfactant can drastically change bubble behavior. For example, a bubble in aqueous
surfactant solution rises much slower than one in purified water. This phenomenon is explained by the so-called Marangoni effect caused by a nonuniform concentration distribution of surfactant along the bubble surface. In other words, a tangential shear stress appears on the bubble surface due to the surface tension variation caused by the surface concentration distribution, which results in the reduction of the rising velocity of the bubble. More interestingly, this Marangoni effect influences not only the rising velocity, but also the lateral migration in the presence of mean shear. Furthermore, these phenomena influence the multiscale nature of bubbly flows and cause a drastic change in the bubbly flow structure. In this article, we review the recent studies related to these interesting behaviors of bubbles caused by the surfactant adsorption/desorption on the bubble surface.
Introduction
Bubbly flows are encountered in many industrial and environmental processes, such as chemical reactors, heat exchangers and aeration systems for water purification, They are also utilized to reduce the frictional drag of a moving body in water by injecting bubbles in the turbulent boundary layer, which has recently attracted much attention from many researchers (see Sugiyama et al. 2008 and Ceccio 2010 for a comprehensive review). In these bubbly flows, small amounts of surfactant can cause dramatic changes in the flow structures through the multiscale effects of the flows. Figure 1 represents the idea of the multiscale structure of bubbly flows in aqueous surfactant solutions. Small amounts of surfactant dissolved in the water adsorb onto the bubble surface, greatly affecting the bubble rising motion. Likewise affected are bubble-bubble interactions; the coalescence of small bubbles hardly occurs in the presence of surfactant. These factors are coupled and can dramatically change the whole bubbly flow structure. For example, because of this structural change of bubbly flow and also the influence of the adsorbed surfactant on mass transfer, the total mass transfer through a bubbly plume in an aeration tank can be quite different with and without surfactant.
Fig. 1 Multiscale structure of bubbly flows in aqueous surfactant solution
Surfactant adsorption on the gas‐liquid interface
Marangoni effect Bubble‐bubble interaction
Bubble suspension Bubbly plume in aeration tank
LargeSmall SCALE LargeSmall SCALE
Surfactant has at least three well-known influences on bubble motion: the reduction of rising velocity, the prevention of coalescence, and the reduction of mass transfer. The first of these is explained by the so-called Marangoni effect. As a bubble rises in aqueous surfactant solution, surfactant is swept off the front part and accumulates in the rear part. This leads to a variation of surface tension along the bubble surface, which causes tangential shear stress on the surface. This is known as the Marangoni effect due to surfactant adsorption on a bubble surface. This shear stress results in an increase of drag, which causes the reduction of the rising velocity. In many cases, the bubble surface becomes sufficiently contaminated by a small amount of dissolved surfactant so that a nearly no-slip surface is attained (Clift et al. 1978). The rising speed of the contaminated bubble decreases with increasing surfactant concentration until the same drag coefficient as a rigid sphere is reached. Thus, a fully contaminated bubble is often regarded as behaving like a rigid sphere in water.This phenomenological explanation was first given by Frumkin & Levich (1947), since which a considerable number of studies have been conducted on this subject. Comprehensive review is given in Takagi and Matsumoto(2011).
The early studies on the measurement of bubbly flows were conducted by Serizawa et al. (1975) and Theofanous and Sullivan (1982), in which local measurements of turbulent flow structure in pipe were made using a hot-film anemometer and Laser Doppler Anemometer (LDA or LDV), respectively. Following these studies, Wang et al. (1987), Lance and Bataille (1991), Serizawa et al. (1991) and Liu and Bankoff (1993a, 1993b) provided experimental information on: the local void fraction profile and its dependence on bubble size; the effect of initial bubble size and the bubble-induced turbulence. However, there is a dearth of information about the effect of surfactant on the global structure of bubbly flow.
In our previous studies on upward bubbly channel flow, bubbles strongly migrate toward the wall and form the crescent-like shape bubble cluster near the wall (So et al. (2002)). The factor of this bubble migration is thought to be a shear-induced lift force. Recently, there are some numerical approaches about the shear-induced lift force on clean bubble and rigid sphere (Legendre and Magnaudet (1998), Kurose and Komori (1999), Bagchi and Balachandar (2002)). Through the comparison of their studies, it is shown that there are large discrepancy between the case of clean bubble and that of rigid sphere. From this result, it is suggested that the contamination of water will influence bubble migration. In this study, the motion of bubbles in upward turbulent channel flow is observed. Especially, bubble clustering phenomenon near the wall is analysed. Furthermore, surfactant effect on the spatial distribution of the bubbles is investigated by changing the concentration and the species of surfactant.
Nomenclature
G Gravitational constant (ms-1) P pressure (Nm-2) A Bubble radius C Concentration of surfactant, Coefficient D Diffusion coefficient F Force U Velocity U Rising velocity of a bubble

Ma Marangoni number La Langmuir number Pe Pecret Number Ha Hatta number K dimensionless adsorption length K rate constant RG Gas constant Sr dimensionless shear rate T absolute temperature Greek letters shear rate Viscosity kinematic viscosity
Density surface tension surface concentration
c cap angle Subsripts S Surface Value in the far-field Max maximum or saturated velue D Drag L Lift P Pressure contribution V Viscous contribution Ad Adsorption Des Desorption
Experimental Setup Experimental Apparatus The experimental apparatus is shown in Fig.2. The experiments were conducted in a vertical circulating water tunnel, which was operated in the upward direction in the test section. The height of 1600mm (x-direction) from the bubble generator to the test section is large enough for the void fraction profiles to be sufficiently developed in the case of bubbly flow and for single-phase turbulent channel flow to be fully developed. The test section has a thickness of 40mm (y-direction) and a width of 400mm (z-direction) with an aspect ratio of 10. The channel width is chosen in such a way that the flow in the centre of the channel is nearly two-dimensional. The bubble generator was constructed with 474 stainless steel pipes of 0.07mm inner diameter and 24mm length. It is installed above the inlet nozzle of the channel, which is located at x/H=80 downward from the test section. The coordinate x denotes the stream-wise direction; y the perpendicular direction from the wall and z span-wise direction. The bubble-clustering phenomena were analysed using image-processing technique. For recording the image of bubbles accumulating near the wall, we use high-speed digital camera (Motion Pro 10000, Redlake MASD, Inc.) with 1,280 x 1,024 pixels and 8-bit resolution.

Fig. 2 Schematic of experimental apparatus Experimental Conditions
The bulk Reynolds numbers (Reb=Ub·2H/ν), based on the characteristic length of the channel width (2H=40mm) and the mean bulk velocity of liquid phase (Ub), are 8200 for the present results.. Here, the bulk velocity of the liquid phase can be estimated in two different ways. One method is from the locally measured velocity profile by integrating the profiles across half of the channel and dividing by half of the channel width. The other method is from the globally measured liquid volumetric flux and dividing it by the cross-sectional area. There is a small difference of less than a few percentages between the values estimated using these two methods. This difference is caused by several factors, such as the effect of the sidewall, the accuracy of the measurement, two-dimensionality at the test section etc. In the present study, we employed the method using the locally measured velocity profile, because the bulk velocity calculated from the liquid volumetric flux is not very reliable due to the effect of the sidewall. Two types of surfactant, 3-Pentanol and Triton-X100 are used. The bulk concentration of 3-Pentanol and Triton-X100 are from 20ppm to 120ppm and 2ppm, respectively.
(a) without surfactant, (b) with 3-Pentanol (20ppm)
Fig.3 Photographs of bubbly flow. Reb=8200, fg=0.6%

Surfactant Effect Fig.3 shows the typical snapshots of bubbly channel flow at the bulk Reynolds number (Reb) of 8200 and the average void fraction (fg) of 0.6%. We can prevent bubbles from coalescing by the addition of small amount of surfactant into the liquid phase (see next section ‘Bubble size profiles’). 3-pentanol and Triton-X100 are used for surfactant. It is clearly observed that the bubble size and the size distribution are drastically changed by the addition of surfactant. In fig.3 (a), “without surfactant”, there are larger deformed bubbles. These bubbles rise with a zigzag leaping motion against the perpendicular wall and are distributed throughout the cross section of the channel. It is also observed that this kind of leaping motion of a bubble enhances the mixing of the fluid and seems to produce the large fluctuations in the flow. Furthermore, once the small amount of surfactant is added, the whole aspect of the flow field is changed. The bubbles start accumulating near the wall and sliding along it. It is also interesting to see that the accumulated bubbles in the vicinity of the wall formed horizontal bubble clusters of 10-40mm length in some cases with 3-Pntanol, that rise and oscillate like moving waves as shown in Fig.3 (b). These changes produce a dramatic change in the whole bubbly flow structure (So et al., 2002).
There are two well-known methods to avoid bubble coalescence. One is the addition of surfactant, and the other is that of salt. Zenit et al. (2001) added salt to the liquid phase to avoid the coalescence. In their study, in order to compare the experimental results with potential flow theories applied for bubble suspension (Sanagni and Didwania(1993), Smereka(1993)), they use salt which does not give Marangoni effects. They are trying to capture the horizontal bubble clustering which was predicted by the theory. On the other hand, in the present experiment, the liquid phase is upward flow which has a strong shear and it is also a slightly contaminated by surfactant to obtain mono-dispersed spherical bubbles by preventing the bubble coalescence. Under this condition with surfactant, the tangential stress at the gas-liquid interface resulted from Marangoni effect is not negligible and the boundary condition on the interface can be treated like intermediate state between rigid particle and clean bubble. This effect gives the smaller rising velocity and end up with more spherical shape even if the bubble size is nearly the same as that of clean bubble. Therefore, there are differences between our experiment and experiment conducted by Zenit et al. and our experimental system will not be used for the comparison with the potential flow theory.
To investigate the effect of added 3-pentanol on the fully developed turbulent channel flow, the streamwise mean velocity and turbulent fluctuations were measured for the single-phase flow by the LDV system. The mean velocity profiles in single-phase flow at Reτ=147, which corresponds to Reb=4100, both with and without 20ppm of 3-pentanol are compared. The results are also compared with the law of the wall and that of DNS (Direct Numerical Simulation) at nearly the same Reynolds number based on the wall friction velocity, which is Reτ=150 (Kasagi et al., 1992). Regardless of the addition of 3-pentanol, the present results show an excellent agreement with the law of the wall and the DNS result. The turbulent fluctuations normalized by the wall friction velocity are also in good agreement with DNS result in both x- and y-directions, regardless of the addition of 3-pentanol. Thus, the comparison with DNS data confirms that the measuring system is reliable. And through the comparison of the results with and without 3-pentanol, the effect of the added 3-pentanol to the single phase turbulence flow is negligibly small.

Numerical Method
Numrerical simulations were also conducted to investigate the effect of adsorption / desorption kinetics of surfactant to the lift force acting on bubbles. The physical model is the same as Cuenot et al.(2005). Their simulations are for axisymmetric flow. We have employed the same model for the three dimensional flows, which is the flow around a spherical bubble in a simple shear flow. Governing equations are given as follows. Equation of continuity for incompressible Newtonian fluid,
0 u , (1) The incompressible Navier-Stokes equations,
21p
u u u (2)
The concentration balance equation in liquid phase, 2c D c u , (3)
and that on bubble surface,
2s s s s
D D c u n , (4)
where, n represents the normal unit vector on surface. The second term of the right-hand side of equation (4) represents the mass flux from the liquid phase to surface. When the ad/desorption kinetics is assumed to obey the Langmuir-Hinshelwood (L-H) kinetics (Chang, & Franses 1995), the mass flux at the bubble surface can be estimated by the following L-H equation,
1ad s dessmax
D c k c k
n . (5)
Then the reduction of surface tension by the surfactant adsorption is given by the Frumkin equation,
0 ln 1Gmax
R T
, (6)
and the Marangoni stress on surface is given by,
Gs s
max
R T
t τ t t , (7)
where t is the unit vector in the tangential direction. Equation (7) means that the gradient of surface concentration gives the shear stress (Marangoni stress) on bubble surface, and it yields the decrease of surface velocity. The flow far from a bubble (r = R∞) converges to a simple shear flow as shown in Figure 4,
0 xU y u e . (8)
The dimensionless form of equations (2)-(5), (7) and (8) are written as follows using the characteristic scales U0, 2a, c∞ and max.
* * * * * *2 *1p
Re u u u , (9)
* * * *2 *1c c
Pe u , (10)
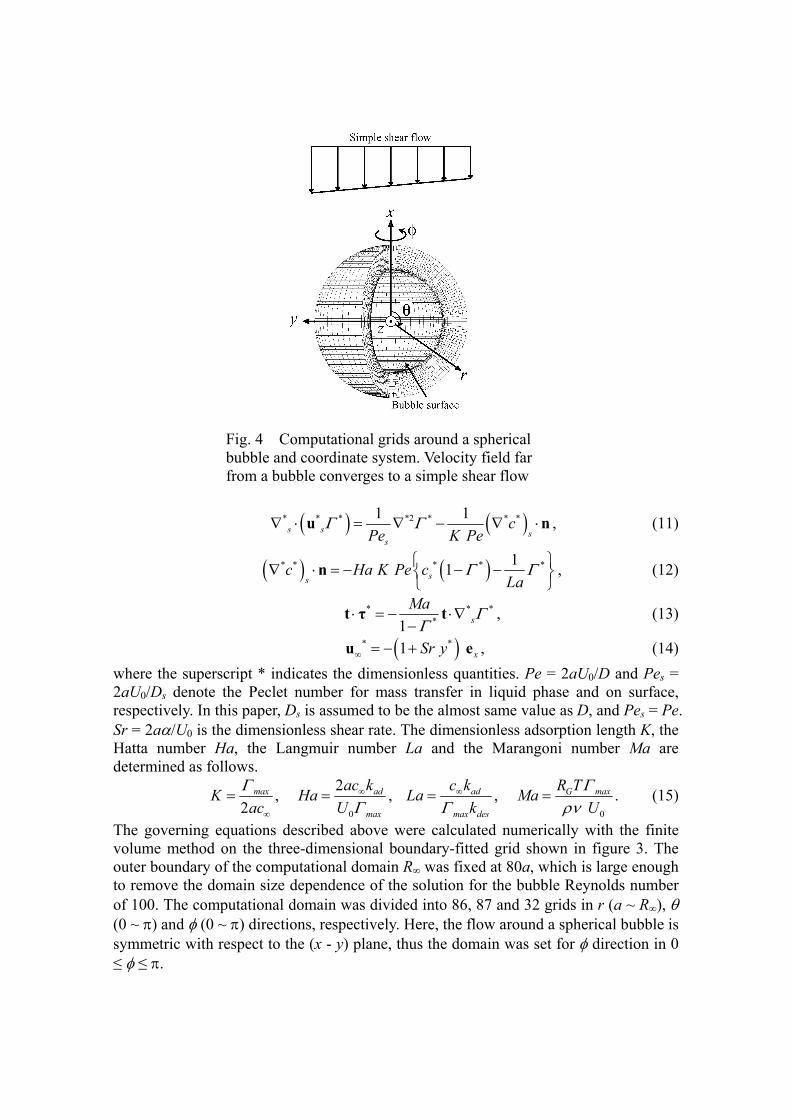
Fig. 4 Computational grids around a spherical bubble and coordinate system. Velocity field far from a bubble converges to a simple shear flow
* * * *2 * * *1 1
s s ss
cPe K Pe
u n , (11)
* * * * *1 1ss
c Ha K Pe cLa
n , (12)
* * **1 s
Ma
t τ t , (13)
* *1 xSr y u e , (14)
where the superscript * indicates the dimensionless quantities. Pe = 2aU0/D and Pes = 2aU0/Ds denote the Peclet number for mass transfer in liquid phase and on surface, respectively. In this paper, Ds is assumed to be the almost same value as D, and Pes = Pe. Sr = 2a/U0 is the dimensionless shear rate. The dimensionless adsorption length K, the Hatta number Ha, the Langmuir number La and the Marangoni number Ma are determined as follows.
0 0
2, , , .
2 max ad ad G max
max max des
ac k c k R TK Ha La Ma
ac U k U
(15)
The governing equations described above were calculated numerically with the finite volume method on the three-dimensional boundary-fitted grid shown in figure 3. The outer boundary of the computational domain R∞ was fixed at 80a, which is large enough to remove the domain size dependence of the solution for the bubble Reynolds number of 100. The computational domain was divided into 86, 87 and 32 grids in r (a ~ R∞), (0 ~ ) and (0 ~ ) directions, respectively. Here, the flow around a spherical bubble is symmetric with respect to the (x - y) plane, thus the domain was set for direction in 0 ≤ ≤ .
Results and Discussion Bubble Size Distribution The diameter of the bubbles injected from the bubble generator is measured by
means of a high speed digital camera at the test section. In the case without surfactant, shown as “tap water”, the average diameter is about 1.5mm and the standard deviation is about 0.7mm that was not good enough for our ‘mono-dispersed’ requirement. To investigate the reason why the bubble size has a large standard deviation, we observe the size history of a bubble released from the needle. It is found that bubbles coalesce several times before they reach the test section. In the cases with low 3-Pentanol concentration (21ppm ~ 32ppm), the bubble size profiles have double peaks around 0.9mm and 1.1mm. The second peak reflects coalscent bubbles and disappears in the case with high concentration (63ppm). A number of coalescent bubble is not so much in each 3-pentanol solution, the average diameter is about 0.9mm with a standard deviation of 0.1mm. In 2ppm Triton X-100 solution, generated bubble size becomes a little bit bigger compared with the case of 3-Pentanol solution and its average diameter is about 1mm with a standard deviation of 0.1mm. In this case, bubbles do not coalesce. From this result, the bubble size profile satisfies our ‘mono-dispersed’ requirement quite well by the addition of small amount of surfactant. Surfactant Effect on Bubble Clustering Behaviour Through the experiments, it is found that there is a relationship between the spatial
distribution of the bubbles and the bulk concentration and the species of the surfactant. Fig.5 shows the bubbly flow without surfactant and Fig.6 shows the dependence of the surfactant concentration. The bulk Reynolds number is 8200 and the air flux rate is fixed at 1.4 l/min (the void fraction is about 0.6%, but it differs in each case). 3-Pentanol is used as a surfactant and its volumetric concentration changes from 21ppm to 168ppm to the whole volume of the liquid-phase. The photographs on the left side are the ‘front view’ of the channel (x-z plane) and the right side are the ‘side view’ (x-y plane).
In all cases, 3-pentanol injection avoids the coalescence of bubbles and ‘mono-dispersed’ 1mm bubbles are obtained. Although, two characteristic changes can be seen with the increase of the 3-pentanol concentration. One is a change of the tendency of the bubble migration toward the wall. Under the condition of the low concentration (21ppm and 42ppm), the bubbles strongly accumulate near the wall (Fig.6 (a) (b), side view). However, further increase of the concentration made this accumulation disappear as shown in the side view of Fig.6 (c). That is to say, the tendency of the bubble migration toward the wall becomes weaker with the increase of the concentration of 3-pentanol beyond certain concentration. The other change arises on a number density of the bubbles. The number density of the bubbles gradually rises with the increase of the concentration of 3-Pentanol. This is because the rising velocity of the bubble becomes smaller due to the increase of the drag on each bubble originated in so called Marangoni effect. More details on this Marangoni effect to the bubble motion is discussed in the next section.
The relation between the bubble cluster in the vicinity of the wall and the concentration of the 3-pentanol is shown in the ‘front view’ photos. In the present study, the most notable bubble clusters are observed in the case of 42ppm. (Fig.6 (b)). Fig.7 shows the bubbly flow in 2ppm Triton-X100 solution. Triton-X100 is the surfactant

Fig.5 Photographs of bubbly flow without surfactant (Reb=8200, the average void fraction of about 0.6%). Left; front view, Right; side view.
(a) 21ppm 3-Pentanol
(b) 42ppm 3-Pentanol
(c) 168ppm 3-Pentanol
Fig.6 Photographs of bubbly flow with a variation of the surfactant concentrations (3-Pentanol, Reb=8200, air injection with the constant flux rate and the average void fraction of about 0.6%). Left; front view, Right; side view.
Fig.7 Photographs of bubbly flow with 2ppm Triton-X100. (The other conditions are the same as in the case of Fig.4 and Fig.5.) Left; front view, Right; side view.
64mm 40mm
64mm 40mm
which has heavier molecular weight compared with 3-Pentanol. It can cause a stronger Marangoni effect with the small amount of solution. It is shown that the bubbles distribute uniformly across the channel. There is no bubble cluster appeared in this case because the bubbles do not migrate and accumulate near the wall.
Surfactant Effect on Bubble Motions
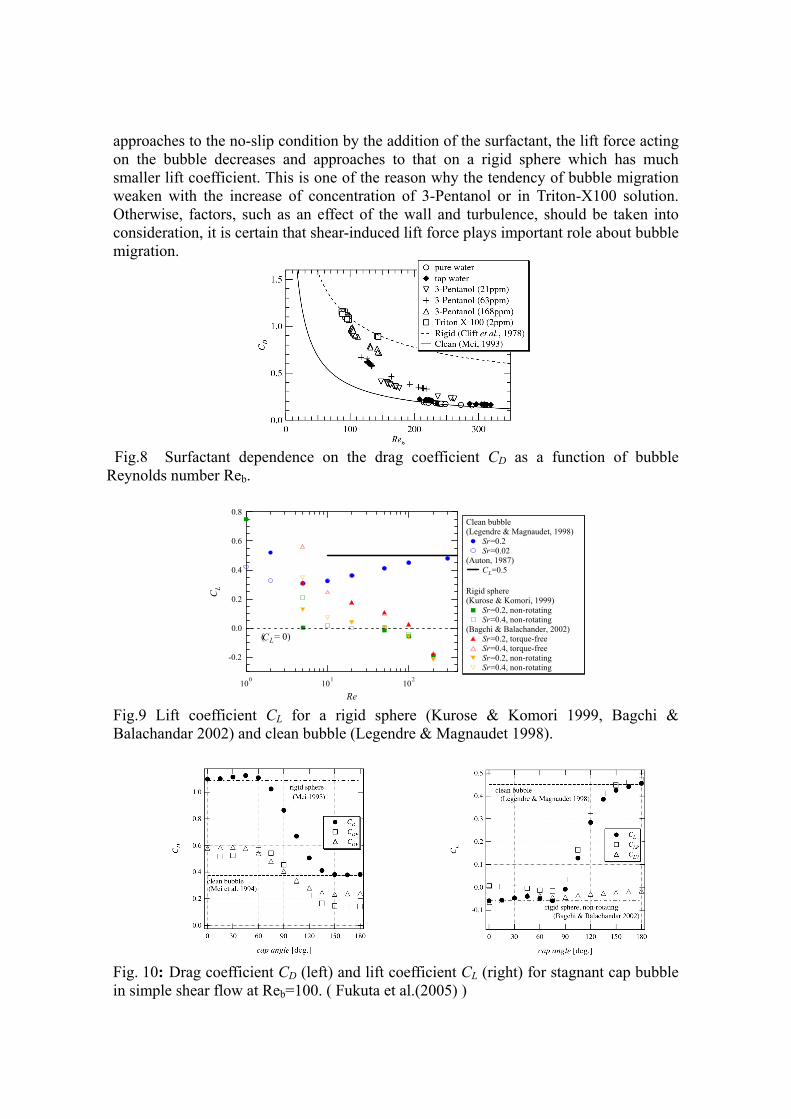
One of the most important surfactant effects on a bubble motion is Marangoni effect (levich1962), that is, the shear stress on the bubble surface is produced by the non-uniform surfactant adsorption. Regarding to this phenomenon from a continuum scale point of view, a surface velocity becomes lower and the drag on the bubble increases. That is to say, the Marangoni effect changes the boundary condition on the bubble surface from free-slip to no-slip. Fig.8 shows experimental results for the drag
coefficient( 2 21
2D DC F U a
) of a nearly spherical bubble in quiescent liquid. Reb is a
bubble Reynolds number and is defined using the bubble diameter and the relative velocity of a bubble. In 3-pentanol solution, the bubble takes the intermediate value of CD between the clean bubble and the rigid sphere. Increasing the concentration of 3-pentanol, drag coefficient increases from that of free-slip to no-slip. In the case of Triton X-100 solution of 2ppm, CD is almost the same as that of rigid sphere. Takagi et al. (2004) conducted experiment and numerical simulation of single bubble and evaluated quantitatively the surface velocity of the rising bubble in quiescent liquid with surfactant solution. It was shown that, in 3-Pentanol of 4-150 ppm solutions, the surface velocity takes an intermediate value between in the case of free-slip condition and no-slip condition. On the other hand, in Triton-X100 of only 0.9ppm solution, it was shown that the surface becomes totally no-slip and can be regarded as that of rigid particle. From these results, it is expected that the bubbles in 3-Pentanol solutions have half-slip surface and the bubble in Triton X-100 solution has almost no-slip surface in the present experiment.
Next, we discuss how this Marangoni effect can affect the lateral migration toward the wall. It is explained as follows. Numerical studies on the lift force on a spherical bubble (Legendre and Magnaudet (1998)) and on a rigid sphere ( Kurose and Komori(1999)and Bagchi and Balachandar (2002) ) in a viscous linear shear flow was
conducted. Those results are shown in Fig.9. CL is calculated as 34
3L LC F a U
,
following Auton’s expression. Sr denotes non-dimensional shear rate which is the ratio between the velocity difference across the bubble and the relative velocity.
In the present experimental conditions, bubble Reynolds number(Reb) is about 100, and the fully contaminated bubble such as the one in Triton X-100 solution can be regarded as a rigid sphere. In this condition of Reb=100, the lift force on a spherical bubble is more than 10 times larger than that on a rigid sphere. And, the lift force coefficient for rigid sphere can be a slightly negative value, which corresponds to the effect of the lateral migration toward the center. Therefore, under this condition, the lift coefficient of the rigid sphere is considerably less than that of the clean bubble. In the case of 21ppm 3-pentanol solution, it might be expected that the lift coefficient takes an intermediate value and it decreases as the surface condition approaches to the no-slip condition due to the increase of the concentration. In the case of 2ppm Triton X-100 solution, the lift coefficient may become the same as that of rigid sphere.

Related to this point, Fukuta et al.(2005) simulated the shear-induced lift force with stagnant cap model of a bubble moving in a simple shear flow. They assume the stagnant cap c , below which free-slip (tangential stress free) condition is imposed on the bubble surface and beyond which no-slip condition is imposed. Their results are shown in Fig.10 for the drag coefficient and also for lift coefficient. It is shown that, with the decrease of cap angle (free-slip region on a bubble surface), CD increases and CL decreases. This decrease of the lift coefficient seems to be the main reason why the tendency of the lateral migration of bubbles toward the wall disappears with the stronger Marangoni effect.
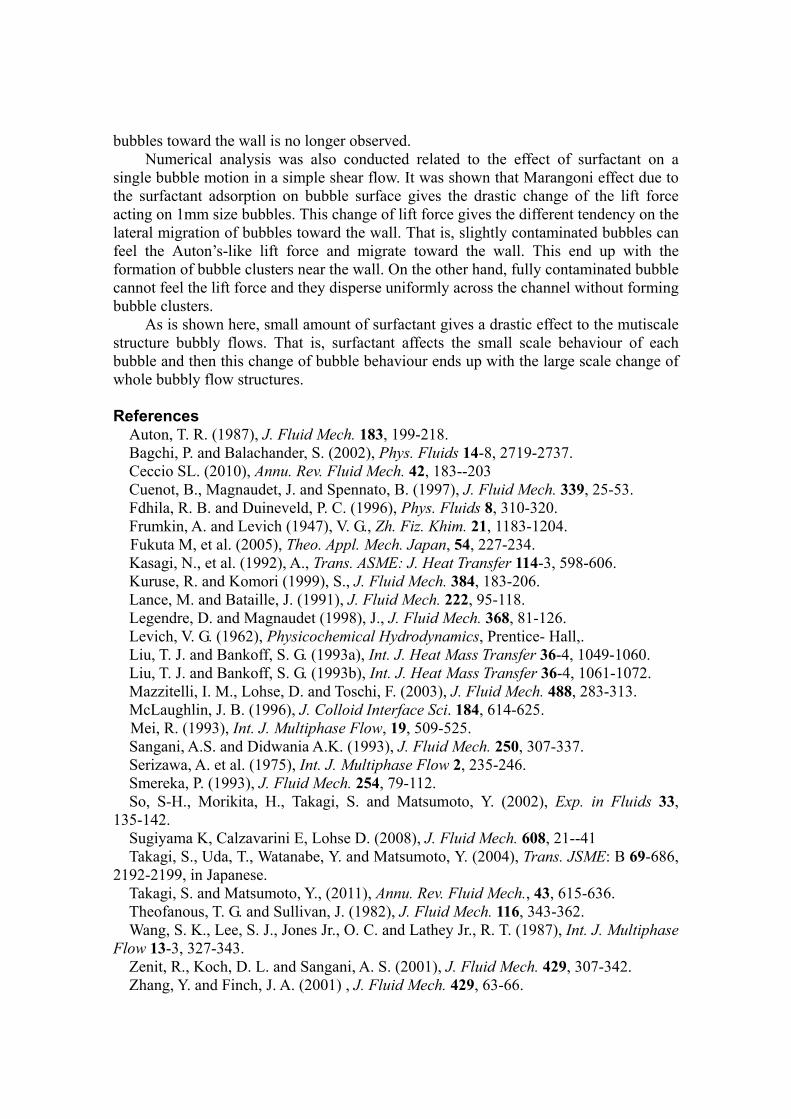
Here, we further investigate the more detail analysis with the adsorption/desorption kinetics of surfactant taken into account. Using the numerical method explained in the previous sections, we have conducted the numerical simulations of a bubble rising in a simple shear flow of surfactant aqueous solution. Fig.11 and 12 shows the result of Langmuir number dependence of CD and CL, respectively. It has been shown by Takagi et al.(2004), that the Marangoni effect is strongly related to Langmuir number. That is, if the surfactant is not easy to desorb from bubble surface, they take a larger Langmuir number and shows a stronger Marangoni effect.
From Fig. 11, it is found that CD becomes larger from the value for a clean bubble (Legendre & Magnaudet 1998) to that for a rigid sphere (Mei 1993) with the increase of La. This gives the reduction of rising speed of bubbles in surfactant solutions confirmed by previous experimental studies (Zhang & Finch 2001, Takagi et al. 2003). When La is so large (= 1.12x10⁻¹) that the bubble surface is contaminated sufficiently, CD of bubble reaches the value for the rigid particle. On the other hand, CL decreases from the value for a clean bubble calculated by Legendre & Magnaudet (1998) when La increases as shown in Fig. 8. At the numerical condition of this study, the dependency of CL on La began appearing at the region of La ~ O(10-3), and CL reached almost zero at La = 4.48x10⁻². When we set larger La, CL became negative value, CL < 0, which was already discussed in Fig.9. To analyze these changes of forces on bubbles, the contributions of pressure to the drag coefficient CDP, to the lift coefficient CLP, normal viscous stress to the drag coefficient CDV, to the lift coefficient CLV are plotted in Fig.11 and 12. Note that CDP + CDV equals CD and CLP + CLV equals CL. For the drag force on bubbles shown in Fig.11, CDP and CDV contribute comparably at each La number and show the similar dependency on La. Thus it is found that both the pressure and viscous contribution become important to the drag force. However, for the lift force shown in Fig.12, CLP contributes more significantly than CLV at low La, where the large lift force acts on the bubble. This means that the lift force on bubble is dominated by the inertia effect in the condition of this calculation. In the case of a clean bubble, Legendre & Magnaudet (1998) showed that CLP contributes to CL dominantly and the inertia effects affect significantly to the lift force in the range of Re > 50. For the viscous contribution to the lift force on a clean bubble, they displayed that CLV takes small negative value, and it contributes only a few percent to CL at high Reynolds number. In contrast, for a contaminated bubble, CLP decreases while CLV changes little with the increase of La and the contamination of the bubble surface. At high La number, where the negative lift force acts on a contaminated bubble, CLP reaches almost zero and the viscous contribution to the lift force becomes dominant at Re =100 and Sr = 0.2.
The lift force is greatly affected by the slip velocity of the gas-liquid interface, depending on the surfactant species and their amount. That is, as the free-slip condition
approaches to the no-slip condition by the addition of the surfactant, the lift force acting on the bubble decreases and approaches to that on a rigid sphere which has much smaller lift coefficient. This is one of the reason why the tendency of bubble migration weaken with the increase of concentration of 3-Pentanol or in Triton-X100 solution. Otherwise, factors, such as an effect of the wall and turbulence, should be taken into consideration, it is certain that shear-induced lift force plays important role about bubble migration.
Fig.8 Surfactant dependence on the drag coefficient CD as a function of bubble Reynolds number Reb.
0.8
0.6
0.4
0.2
0.0
-0.2
CL
100
101
102
Re
C( = 0)L
Clean bubble (Legendre & Magnaudet, 1998) Sr=0.2 Sr=0.02 (Auton, 1987) CL=0.5 Rigid sphere (Kurose & Komori, 1999) Sr=0.2, non-rotating Sr=0.4, non-rotating (Bagchi & Balachander, 2002) Sr=0.2, torque-free Sr=0.4, torque-free Sr=0.2, non-rotating Sr=0.4, non-rotating
Fig.9 Lift coefficient CL for a rigid sphere (Kurose & Komori 1999, Bagchi & Balachandar 2002) and clean bubble (Legendre & Magnaudet 1998).
Fig. 10: Drag coefficient CD (left) and lift coefficient CL (right) for stagnant cap bubble in simple shear flow at Reb=100. ( Fukuta et al.(2005) )
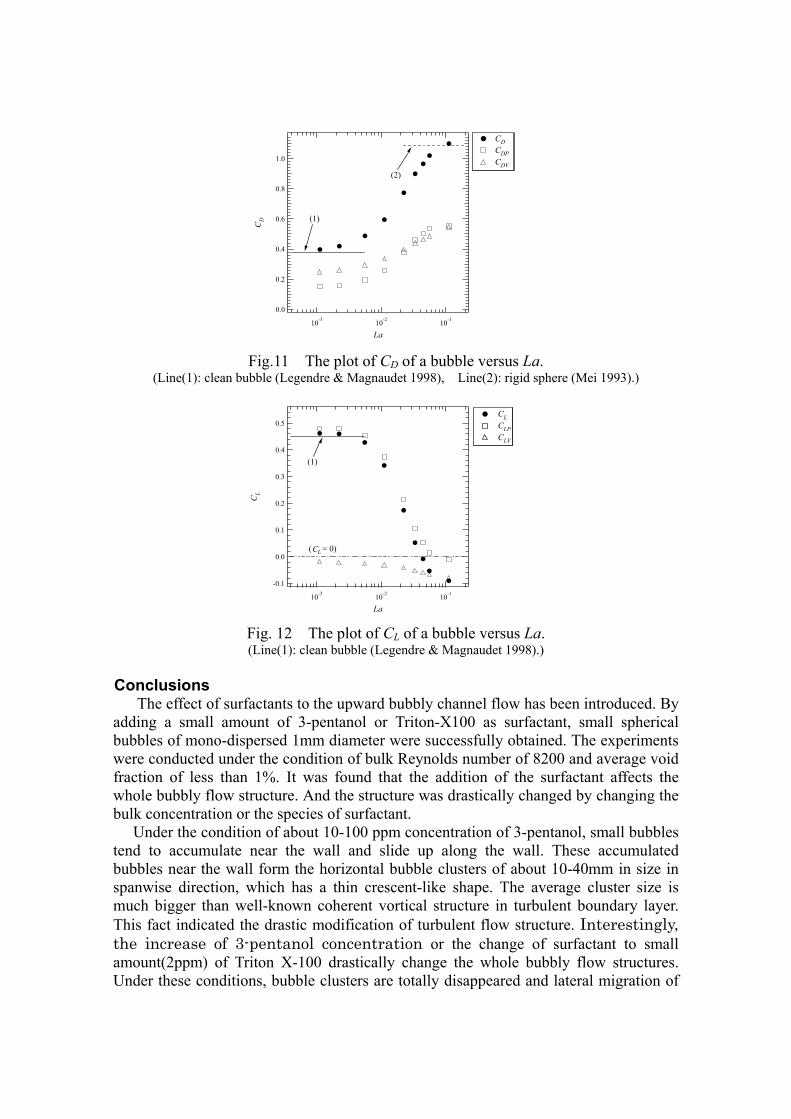
Fig.11 The plot of CD of a bubble versus La. (Line(1): clean bubble (Legendre & Magnaudet 1998), Line(2): rigid sphere (Mei 1993).)
Fig. 12 The plot of CL of a bubble versus La. (Line(1): clean bubble (Legendre & Magnaudet 1998).)
Conclusions
The effect of surfactants to the upward bubbly channel flow has been introduced. By adding a small amount of 3-pentanol or Triton-X100 as surfactant, small spherical bubbles of mono-dispersed 1mm diameter were successfully obtained. The experiments were conducted under the condition of bulk Reynolds number of 8200 and average void fraction of less than 1%. It was found that the addition of the surfactant affects the whole bubbly flow structure. And the structure was drastically changed by changing the bulk concentration or the species of surfactant.
Under the condition of about 10-100 ppm concentration of 3-pentanol, small bubbles tend to accumulate near the wall and slide up along the wall. These accumulated bubbles near the wall form the horizontal bubble clusters of about 10-40mm in size in spanwise direction, which has a thin crescent-like shape. The average cluster size is much bigger than well-known coherent vortical structure in turbulent boundary layer. This fact indicated the drastic modification of turbulent flow structure. Interestingly, the increase of 3-pentanol concentration or the change of surfactant to small amount(2ppm) of Triton X-100 drastically change the whole bubbly flow structures. Under these conditions, bubble clusters are totally disappeared and lateral migration of
1.0
0.8
0.6
0.4
0.2
0.0
CD
10-3
10-2
10-1
La
(1)
(2)
CD
CDP
CDV
0.5
0.4
0.3
0.2
0.1
0.0
-0.1
CL
10-3
10-2
10-1
La
(1)
( = 0)CL
CL
CLP
CLV
bubbles toward the wall is no longer observed. Numerical analysis was also conducted related to the effect of surfactant on a
single bubble motion in a simple shear flow. It was shown that Marangoni effect due to the surfactant adsorption on bubble surface gives the drastic change of the lift force acting on 1mm size bubbles. This change of lift force gives the different tendency on the lateral migration of bubbles toward the wall. That is, slightly contaminated bubbles can feel the Auton’s-like lift force and migrate toward the wall. This end up with the formation of bubble clusters near the wall. On the other hand, fully contaminated bubble cannot feel the lift force and they disperse uniformly across the channel without forming bubble clusters.
As is shown here, small amount of surfactant gives a drastic effect to the mutiscale structure bubbly flows. That is, surfactant affects the small scale behaviour of each bubble and then this change of bubble behaviour ends up with the large scale change of whole bubbly flow structures.
References
Auton, T. R. (1987), J. Fluid Mech. 183, 199-218. Bagchi, P. and Balachander, S. (2002), Phys. Fluids 14-8, 2719-2737. Ceccio SL. (2010), Annu. Rev. Fluid Mech. 42, 183--203 Cuenot, B., Magnaudet, J. and Spennato, B. (1997), J. Fluid Mech. 339, 25-53. Fdhila, R. B. and Duineveld, P. C. (1996), Phys. Fluids 8, 310-320. Frumkin, A. and Levich (1947), V. G., Zh. Fiz. Khim. 21, 1183-1204.
Fukuta M, et al. (2005), Theo. Appl. Mech. Japan, 54, 227-234. Kasagi, N., et al. (1992), A., Trans. ASME: J. Heat Transfer 114-3, 598-606. Kuruse, R. and Komori (1999), S., J. Fluid Mech. 384, 183-206. Lance, M. and Bataille, J. (1991), J. Fluid Mech. 222, 95-118. Legendre, D. and Magnaudet (1998), J., J. Fluid Mech. 368, 81-126. Levich, V. G. (1962), Physicochemical Hydrodynamics, Prentice- Hall,. Liu, T. J. and Bankoff, S. G. (1993a), Int. J. Heat Mass Transfer 36-4, 1049-1060. Liu, T. J. and Bankoff, S. G. (1993b), Int. J. Heat Mass Transfer 36-4, 1061-1072. Mazzitelli, I. M., Lohse, D. and Toschi, F. (2003), J. Fluid Mech. 488, 283-313. McLaughlin, J. B. (1996), J. Colloid Interface Sci. 184, 614-625. Mei, R. (1993), Int. J. Multiphase Flow, 19, 509-525. Sangani, A.S. and Didwania A.K. (1993), J. Fluid Mech. 250, 307-337. Serizawa, A. et al. (1975), Int. J. Multiphase Flow 2, 235-246. Smereka, P. (1993), J. Fluid Mech. 254, 79-112. So, S-H., Morikita, H., Takagi, S. and Matsumoto, Y. (2002), Exp. in Fluids 33,
135-142. Sugiyama K, Calzavarini E, Lohse D. (2008), J. Fluid Mech. 608, 21--41 Takagi, S., Uda, T., Watanabe, Y. and Matsumoto, Y. (2004), Trans. JSME: B 69-686,
2192-2199, in Japanese. Takagi, S. and Matsumoto, Y., (2011), Annu. Rev. Fluid Mech., 43, 615-636. Theofanous, T. G. and Sullivan, J. (1982), J. Fluid Mech. 116, 343-362. Wang, S. K., Lee, S. J., Jones Jr., O. C. and Lathey Jr., R. T. (1987), Int. J. Multiphase
Flow 13-3, 327-343. Zenit, R., Koch, D. L. and Sangani, A. S. (2001), J. Fluid Mech. 429, 307-342. Zhang, Y. and Finch, J. A. (2001) , J. Fluid Mech. 429, 63-66.