SURFACE WEIGHTED AVERAGE … Harbor RI/FS Appendix I: Surface Weighted Average Concentration...
34
PORTLAND HARBOR RI/FS APPENDIX I SURFACE WEIGHTED AVERAGE CONCENTRATION UNCERTAINTY ANALYSIS (PCBS, TOTAL PAHS, DDX) FEASIBILITY STUDY June 2016
Transcript of SURFACE WEIGHTED AVERAGE … Harbor RI/FS Appendix I: Surface Weighted Average Concentration...
PORTLAND HARBOR RI/FS
APPENDIX I
SURFACE WEIGHTED AVERAGE CONCENTRATION
UNCERTAINTY ANALYSIS
(PCBS, TOTAL PAHS, DDX)
FEASIBILITY STUDY
June 2016

This page left blank intentionally.
Portland Harbor RI/FS
Appendix I: Surface Weighted Average Concentration Uncertainty Analysis (PCBs, Total PAHs, DDx)
Feasibility Study
June 2016
I-i
TABLE OF CONTENTS
LIST OF TABLES ....................................................................................................................... I-ii
LIST OF FIGURES ..................................................................................................................... I-ii
I1. INTRODUCTION ............................................................................................................ I-1
I2. METHODS ....................................................................................................................... I-2
I2.1 Declustering Method Sensitivity................................................................................. I-2
I2.2 Future Condition ......................................................................................................... I-2 I2.2.1 Mathematical Constraints on Remedial Alternatives ............................................ I-2 I2.2.2 Conditional Simulation ......................................................................................... I-2
I3. RESULTS .......................................................................................................................... I-5
I3.1 Declustering Method Sensitivity................................................................................. I-5
I3.2 Mathematical Constraints ........................................................................................... I-5
I3.3 Conditional Simulation ............................................................................................... I-5
I4. DISCUSSION ................................................................................................................... I-7
I5. REFERENCES ................................................................................................................. I-8
Portland Harbor RI/FS
Appendix I: Surface Weighted Average Concentration Uncertainty Analysis (PCBs, Total PAHs, DDx)
Feasibility Study
June 2016
I-ii
LIST OF TABLES
Table I-1 Declustering Method Sensitivity for PCBs
Table I-2 Remedial Action Limits for Remedial Alterntives B through G for PCBs, Total
PAH, and DDx
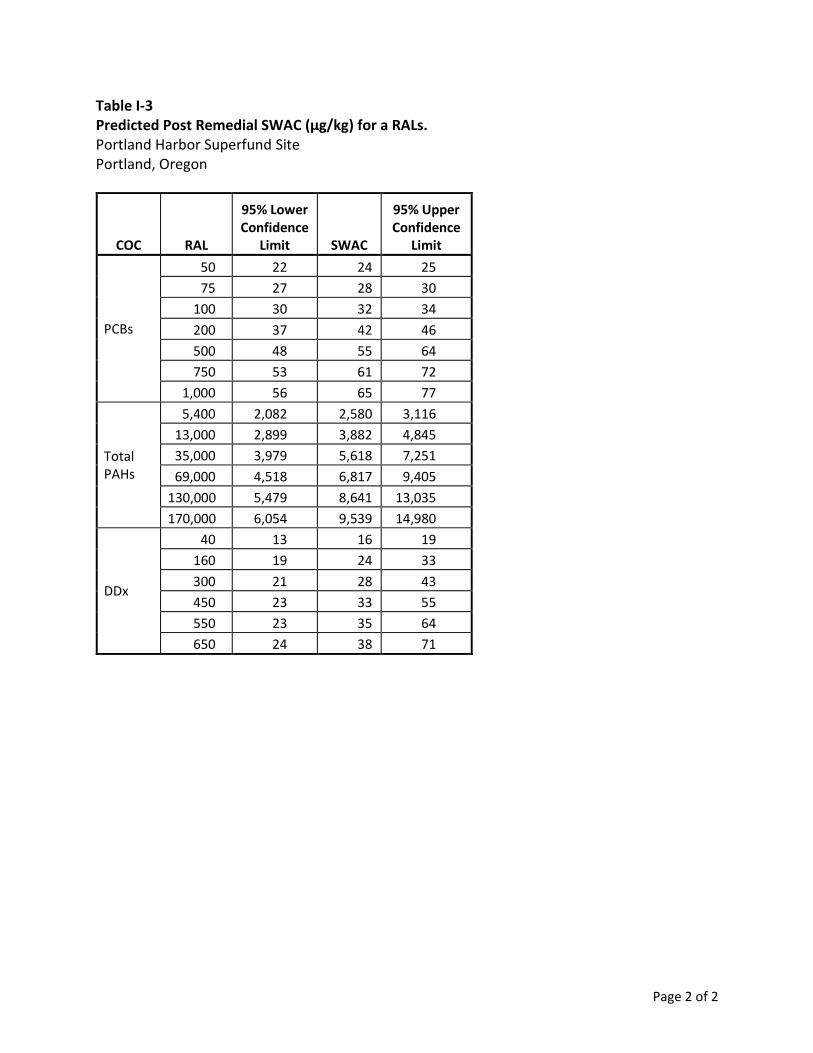
Table I-3 Predicted Post Remedial SWAC (µg/kg) for a Range of Remedial Action Limits
LIST OF FIGURES
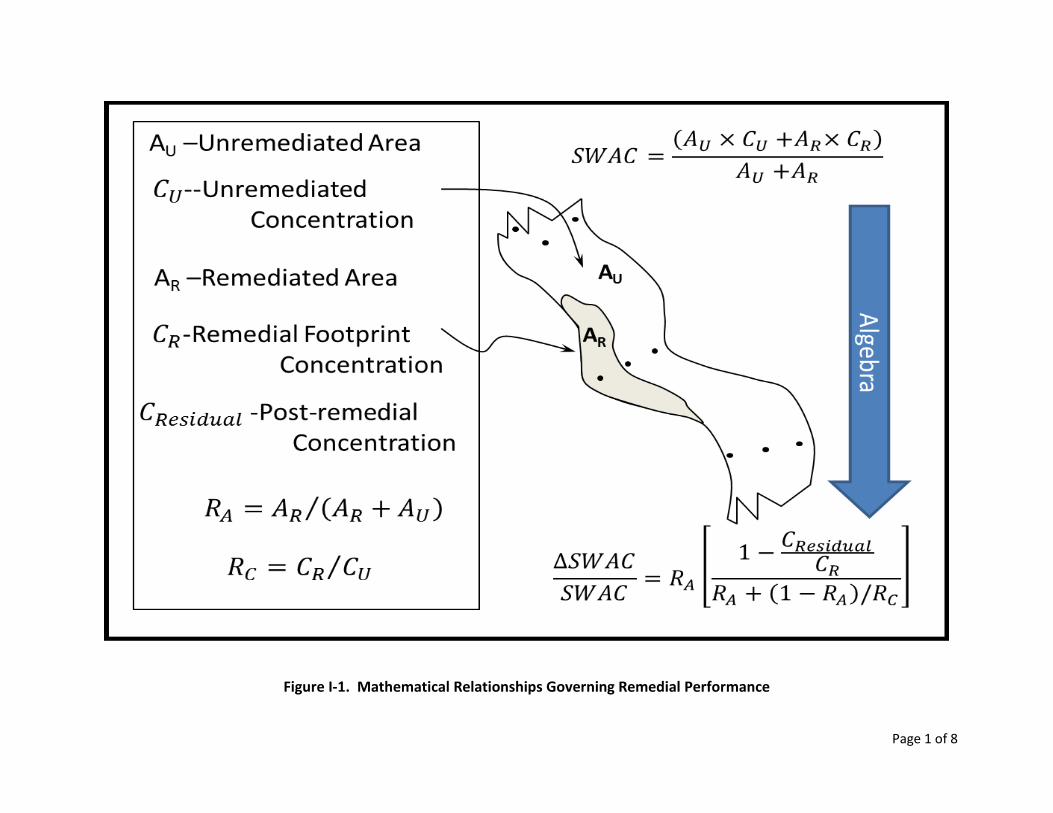
Figure I-1 Mathematical Relationships Governing Remedial Performance
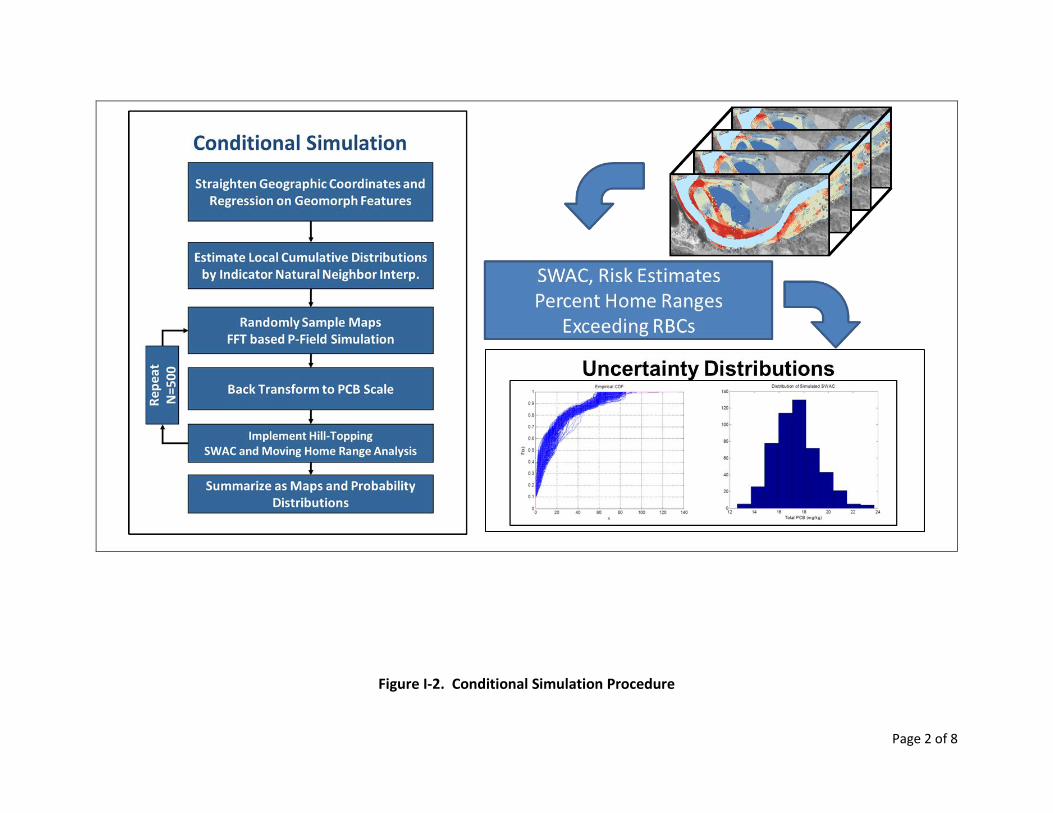
Figure I-2 Conditional Simulation Procedure
Figure I-3 Relative Change in SWAC vs Percentage Area Remediated
Figure I-4 Four Equally Likely Simulated Maps of PCBs
Figure I-5 Pre-Remedial SWAC for PCBs
Figure I-6 Surface Weighted Average Concentration for PCBs vs. RALs
Figure I-7 Surface weighted average concentration for Total PAHs vs. RALs
Figure I-8 Surface Weighted Average Concentration for DDx vs. RAL
Portland Harbor RI/FS
Appendix I: Surface Weighted Average Concentration Uncertainty Analysis (PCBs, Total PAHs, DDx)
Feasibility Study
June 2016
I-1
I1. INTRODUCTION
An evaluation of the uncertainties in predicted post-construction surface sediment COC
concentrations was conducted, consistent with the recommendation provided the joint
National Remedy Review Board/Contaminated Sediments Technical Advisory Group
Comments on the proposed remedy (EPA 2015).
Because predictions of post-construction SWACs are based on a sample from the
population of contaminated sediments, statistical uncertainties are unavoidable. In
addition, because most remedial investigation data are based on a mixture of sampling
designs, some of which are spatially biased accurate estimates of spatial averages must
generally be based on weighted averages which are intended to counter the effects of
spatially biased sampling designs. In geostatistics this is referred to as de-clustering the
data (Isaaks and Srivastava, 2005).
The Portland Harbor FS, data were declustered by first interpolating the concentrations
to a 10-foot by 10-foot regularly spaced grid, followed by averaging the values on these
grid nodes. This approach based on natural neighbor interpolation has been found to
preform reasonably well for reducing bias in SWAC estimates when they are based on a
combination of biased and unbiased sampling designs (Kern et al. 2009). The natural
neighbor interpolation was also used as a basis to forecast performance of a range of
remedial alternatives based on actions taken in areas with the highest interpolated
concentrations—referred to as hill-topping. This report documents an evaluation of the
uncertainty in these predictions of remedial effectiveness using nonparametric
geostatistical procedure known as conditional simulation using the P-field method
(Srivastava, 2005).
Portland Harbor RI/FS
Appendix I: Surface Weighted Average Concentration Uncertainty Analysis (PCBs, Total PAHs, DDx)
Feasibility Study
June 2016
I-2
I2. METHODS
I2.1 DECLUSTERING METHOD SENSITIVITY
Prior to conducting the conditional simulation analysis, four declustering techniques
were tested to gain an understanding of the sensitivity of SWAC estimates to
declustering methods. Methods that were tested included; 1) Thiessen polygons, 2)
polygonal declustering, 3) stratified sampling based methods and 4) natural neighbor
interpolation.
I2.2 FUTURE CONDITION
Uncertainty in predicted future condition was evaluated using two approaches; 1)
considering basic mathematical constraints relating percentage area remediated,
percentage reduction in SWAC and the ratio of remediated to unremediated areas, and
2) using a spatial Monte-Carlo approach to directly estimate confidence limits on post
remedial SWAC under a range of remedial action limits (RALs). The first approach is a
diagnostic providing a relative understanding of the demands that may be placed on the
resolution of the delineation of deposits relative to experiences at other Superfund Mega
Sites. The second approach provides a more direct evaluation of the expected remedial
performance, under the combination of existing circumstances, including deposit
complexity and level of sampling resolution.
I2.2.1 Mathematical Constraints on Remedial Alternatives
Future condition under selected alternative scenarios was evaluated by considering
basic mathematical constraints on the relationships between proportion reduction in post
remedial SWAC, the percentage of area remediated, and the ratio of concentrations in
remediated to unremediated areas. The constraints are based on equations in Figure I-1
and provide remedial managers with a relative understanding of the potential level of
resolution necessary to achieve remedial targets. In particular, when the remedial
footprint is small and the targeted reduction in concentration is large, the ratio of
average concentration in remediated areas must be much greater than that in un-
remediated areas. This will be feasible, only when high concentration deposits are well-
consolidated and easily delineated, or with high density sampling providing highly
resolved delineation of otherwise unconsolidated complex depositional patterns.
I2.2.2 Conditional Simulation
Conditional simulation is a computer intensive resampling method analogous to
bootstrap resampling, with the added constraint that rather than randomly selecting
individual sample values, whole concentration maps are randomly selected and
analyzed (Figure I-2). These maps can be thought of as a deck of cards, each of which
interpolates the sample data and is also consistent with the spatial variation observed in
Portland Harbor RI/FS
Appendix I: Surface Weighted Average Concentration Uncertainty Analysis (PCBs, Total PAHs, DDx)
Feasibility Study
June 2016
I-3
the sample. The analysis proceeds by randomly selecting one of many equally likely
maps to which proposed remedial strategies are applied. The results for each randomly
selected map are summarized, providing a means to propagate spatial variation and
uncertainty through complex calculations, linking uncertainty in maps with uncertainty
in SWAC predictions.
The technique takes into account the spatial uncertainty in mapped surfaces, and is
spatially scalable and also accounts for uncertainty in the delineation boundaries.
Uncertainty calculations help to quantify the effects of the situation where some
contaminant concentrations within the RAL footprint are less than the RAL, as well as
the when some concentrations outside the footprint may be greater than the RAL. These
types of errors are assumed negligible when forecasts are based purely on a single
smooth surface which can lead to inaccurate evaluations, usually biased toward
overstatement of remedial benefit. This analysis provides an assessment of how these
uncertainties accumulate in the post remedial SWAC predictions.
Detailed P-Field Simulation Procedure (Optional Reading)
The P-field simulation method involves three primary steps; 1) defining conditional
cumulative distributions for COCs at each 10 by 10 foot grid cell, 2) simulating a
spatially correlated normally distributed random variable for each grid cell, and 3)
transforming the normally distributed variable to the original COC scale by identifying
the percentile of the COC distribution with corresponding percentile of the simulated
normal random variable at each grid cell. The cumulative distributions represent
narrower ranges near sample values and wider ranges far from sample values, causing
the simulated surfaces to match measured values at the sampled locations, whereas they
may vary relatively widely in areas that are distant from sampled locations.
The conditional cumulative distribution functions were estimated using a nonparametric
approach based on natural neighbor interpolation approximating the indicator kriging
method that is typically used to estimate cumulative distribution functions. Estimating
conditional distributions requires interpolation of a range of binary (0 or 1) indicators
defined based on COC concentrations being above or below a range of threshold values
of interest. In this analysis threshold values were chosen to represent percentiles of the
COC distributions, (1, 2.5, 5, 10, 20, 30, 40, 50, 60, 70, 80, 90, 95, 97.5 and 99). For
each percentile, the sample data were coded as 1 for values below threshold and 0 for
values above threshold, and these binary values were interpolated using natural
neighbor interpolation. This process was repeated for each of the 15 threshold values,
resulting in 15 interpolated surfaces representing the probability that COC
concentrations were less than the threshold value. This series of 15 probability values
unique to each grid cell is an estimate of the conditional cumulative distribution at that
location. Traditionally this interpolation is conducted using indicator kriging. However,
using natural neighbor interpolation has two distinct advantages, there is no need to
Portland Harbor RI/FS
Appendix I: Surface Weighted Average Concentration Uncertainty Analysis (PCBs, Total PAHs, DDx)
Feasibility Study
June 2016
I-4
model 15 sets of directional indicator variograms necessary for kriging,, and the natural
neighbor method does not require any assumptions of stationarity as is assumed for
kriging. Effectively by using the natural neighbor method to interpolate the indicator
data, the resulting simulation is both non-parametric as well as accommodating spatially
nonstationary COC distributions.
Portland Harbor RI/FS
Appendix I: Surface Weighted Average Concentration Uncertainty Analysis (PCBs, Total PAHs, DDx)
Feasibility Study
June 2016
I-5
I3. RESULTS
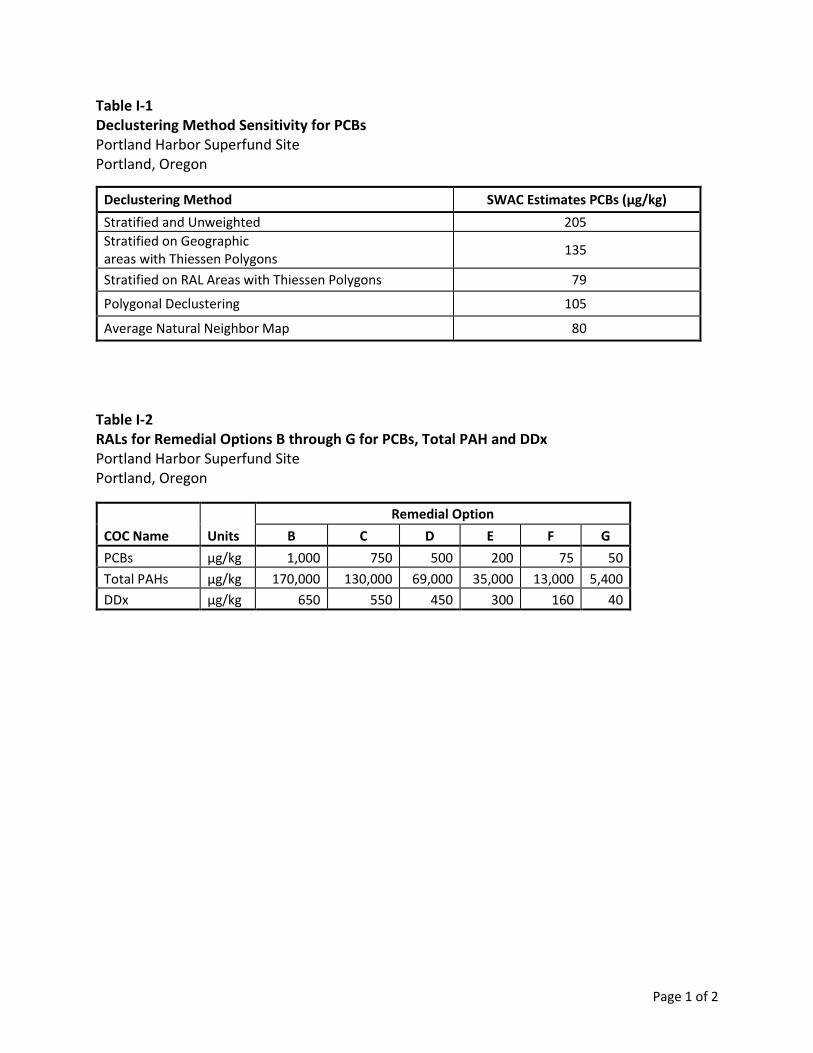
I3.1 DECLUSTERING METHOD SENSITIVITY
Estimated SWACs for PCBs based on four declustering methods ranged from 79 µg/kg
for the method stratified on RAL areas, to 205 µg/kg based on unweighted averages
within geographic strata. The stratified method based on Thiessen Polygon weighting
was 135 µg/kg, and the method stratified based on RAL areas and using Thiessen
Polygon weighting was similar to the natural neighbor method deployed in the FS. As
shown, the effects of biased sampling are substantial, with higher unweighted estimates
reflecting tendency to focus sampling on high concentration areas. This indicates that
some form of declustering is appropriate to improve the accuracy of estimates which
would otherwise be based on an unweighted average.
I3.2 MATHEMATICAL CONSTRAINTS
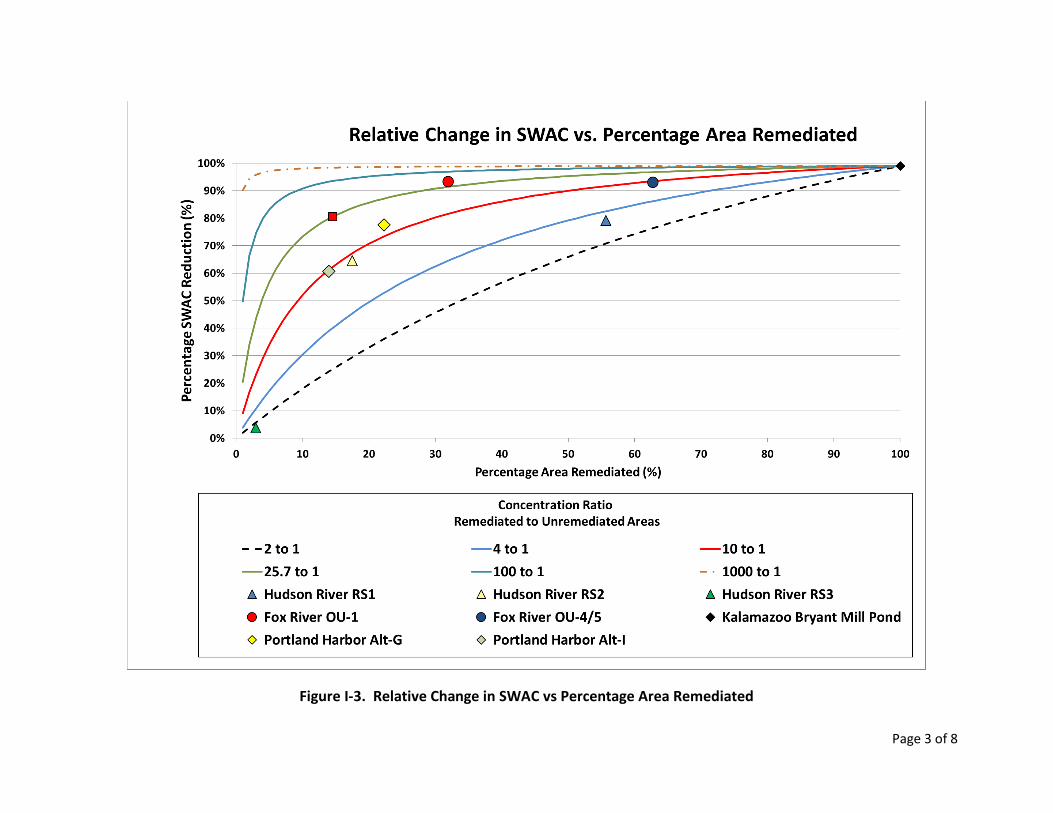
The planned percentage SWAC reduction was plotted against percentage area
remediated for PCBs to evaluate the susceptibility of remedial alternatives identified in
the FS to delineation errors, and to compare with other remedial alternatives
implemented at a number other Superfund Sites (Figure I-3). Alternatives E and G each
require that the ratio of average SWAC within remediated to unremediated areas should
be approximately a 10 to 1 ratio—both alternatives falling roughly along the red 10 to 1
curve. Other sites that have deployed similar ratios, include the Fox River OU4-5 and
River Section 2 of the Hudson River. The results at the Fox River Site are not yet
complete; however, the deposits there were relatively broadly distributed and only
mildly consolidated and ultimately substantial design sampling has been required to
achieve this goal. Conversely, deposits in River Section 2 of the Hudson River Site are
better consolidated, but not as well consolidated as is apparent in Portland Harbor, and
the desired outcome was not fully achieved there. Based on qualitative observation of
the distribution of surface COCs at Portland Harbor, it is anticipated that this 10 to 1
ratio is likely to be achievable with substantially less resolution than was required at the
Fox River Site, and potentially similar sampling densities to those deployed at the
Hudson River in River Section 2. The conditional simulation will help to test this
observation more rigorously.
I3.3 CONDITIONAL SIMULATION
Conditional simulation was used to estimate uncertainty in the SWAC vs RAL
relationship. The RAL was varied for each COC representing remedial action limits
associated with alternatives B through G described in the FS (Table I-2). The lateral
footprint for each RAL was defined by all grid cells with natural neighbor interpolated
concentrations exceeding each specified RAL.
Portland Harbor RI/FS
Appendix I: Surface Weighted Average Concentration Uncertainty Analysis (PCBs, Total PAHs, DDx)
Feasibility Study
June 2016
I-6
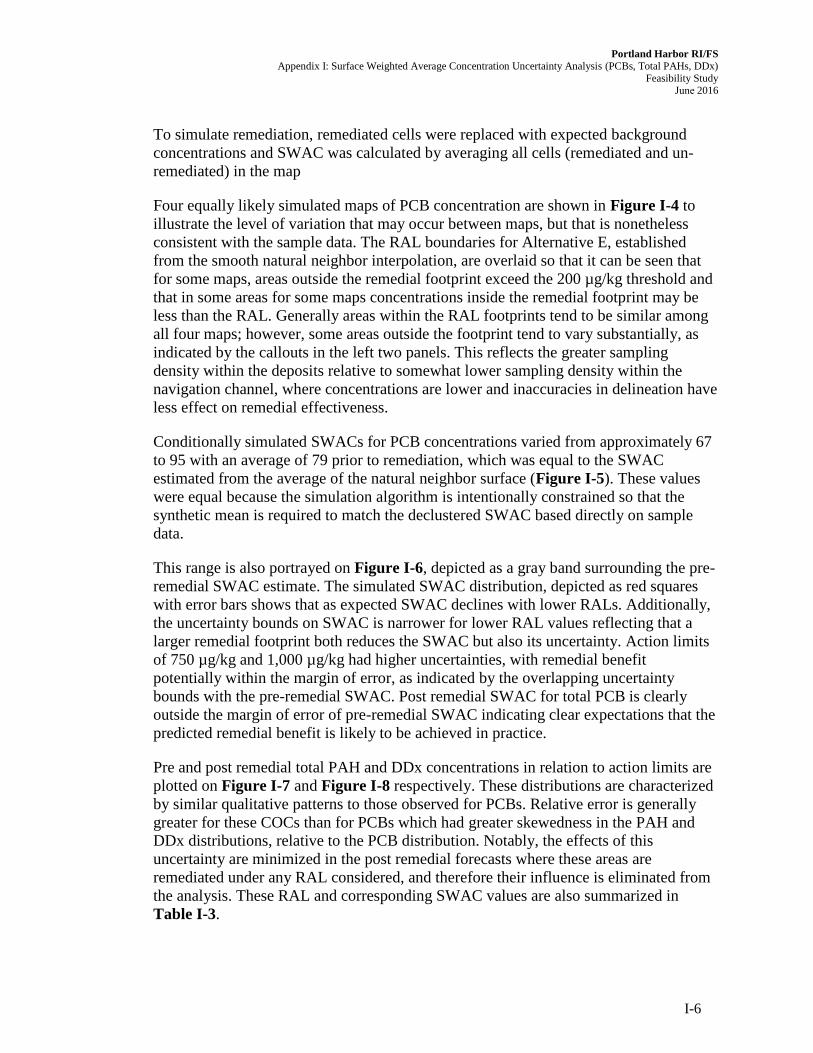
To simulate remediation, remediated cells were replaced with expected background
concentrations and SWAC was calculated by averaging all cells (remediated and un-
remediated) in the map
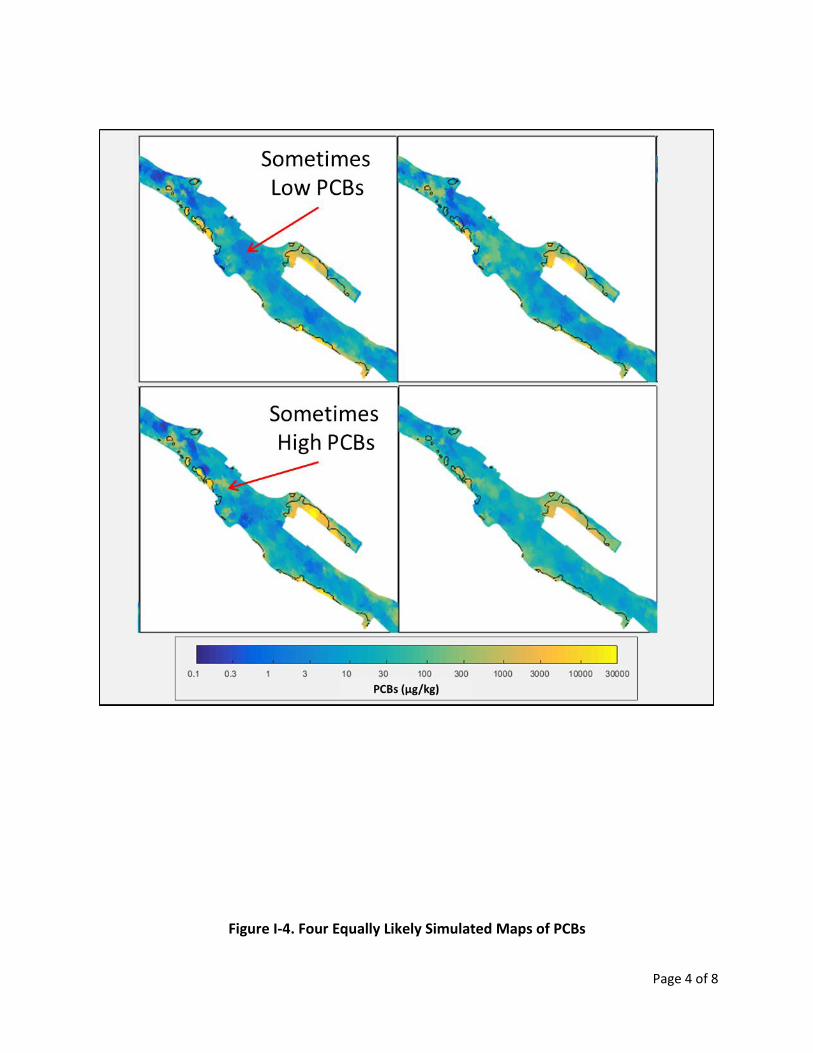
Four equally likely simulated maps of PCB concentration are shown in Figure I-4 to
illustrate the level of variation that may occur between maps, but that is nonetheless
consistent with the sample data. The RAL boundaries for Alternative E, established
from the smooth natural neighbor interpolation, are overlaid so that it can be seen that
for some maps, areas outside the remedial footprint exceed the 200 µg/kg threshold and
that in some areas for some maps concentrations inside the remedial footprint may be
less than the RAL. Generally areas within the RAL footprints tend to be similar among
all four maps; however, some areas outside the footprint tend to vary substantially, as
indicated by the callouts in the left two panels. This reflects the greater sampling
density within the deposits relative to somewhat lower sampling density within the
navigation channel, where concentrations are lower and inaccuracies in delineation have
less effect on remedial effectiveness.
Conditionally simulated SWACs for PCB concentrations varied from approximately 67
to 95 with an average of 79 prior to remediation, which was equal to the SWAC
estimated from the average of the natural neighbor surface (Figure I-5). These values
were equal because the simulation algorithm is intentionally constrained so that the
synthetic mean is required to match the declustered SWAC based directly on sample
data.
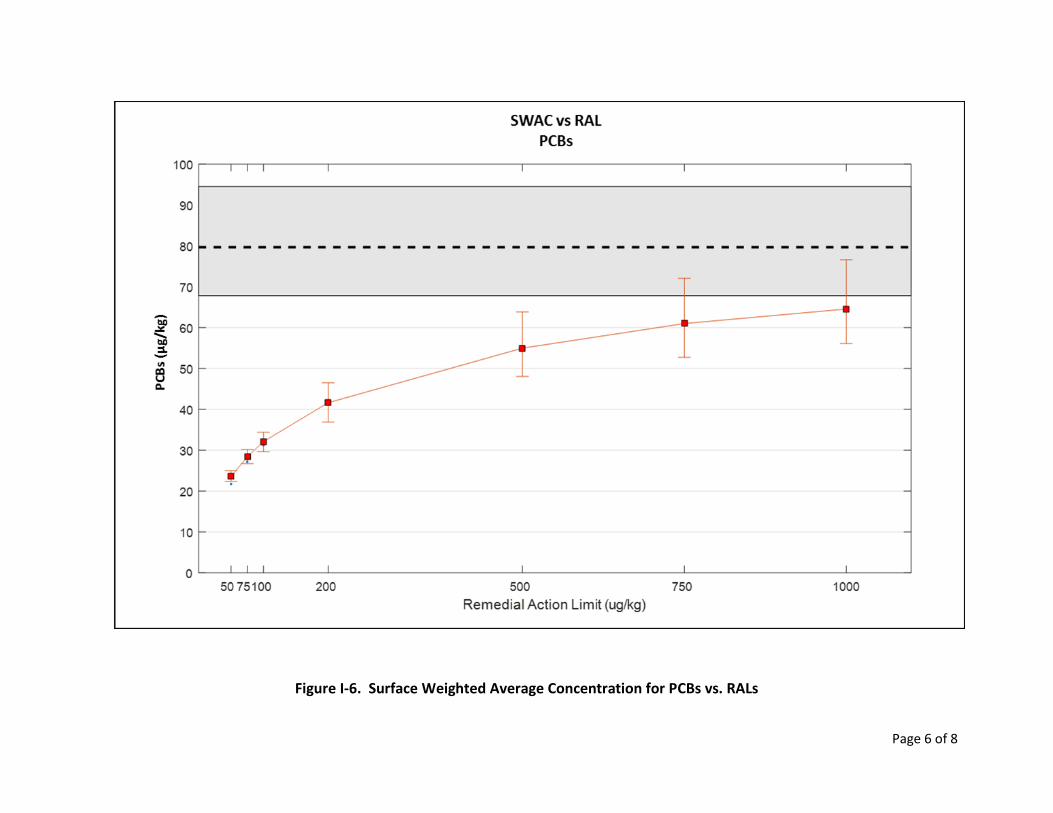
This range is also portrayed on Figure I-6, depicted as a gray band surrounding the pre-
remedial SWAC estimate. The simulated SWAC distribution, depicted as red squares
with error bars shows that as expected SWAC declines with lower RALs. Additionally,
the uncertainty bounds on SWAC is narrower for lower RAL values reflecting that a
larger remedial footprint both reduces the SWAC but also its uncertainty. Action limits
of 750 µg/kg and 1,000 µg/kg had higher uncertainties, with remedial benefit
potentially within the margin of error, as indicated by the overlapping uncertainty
bounds with the pre-remedial SWAC. Post remedial SWAC for total PCB is clearly
outside the margin of error of pre-remedial SWAC indicating clear expectations that the
predicted remedial benefit is likely to be achieved in practice.
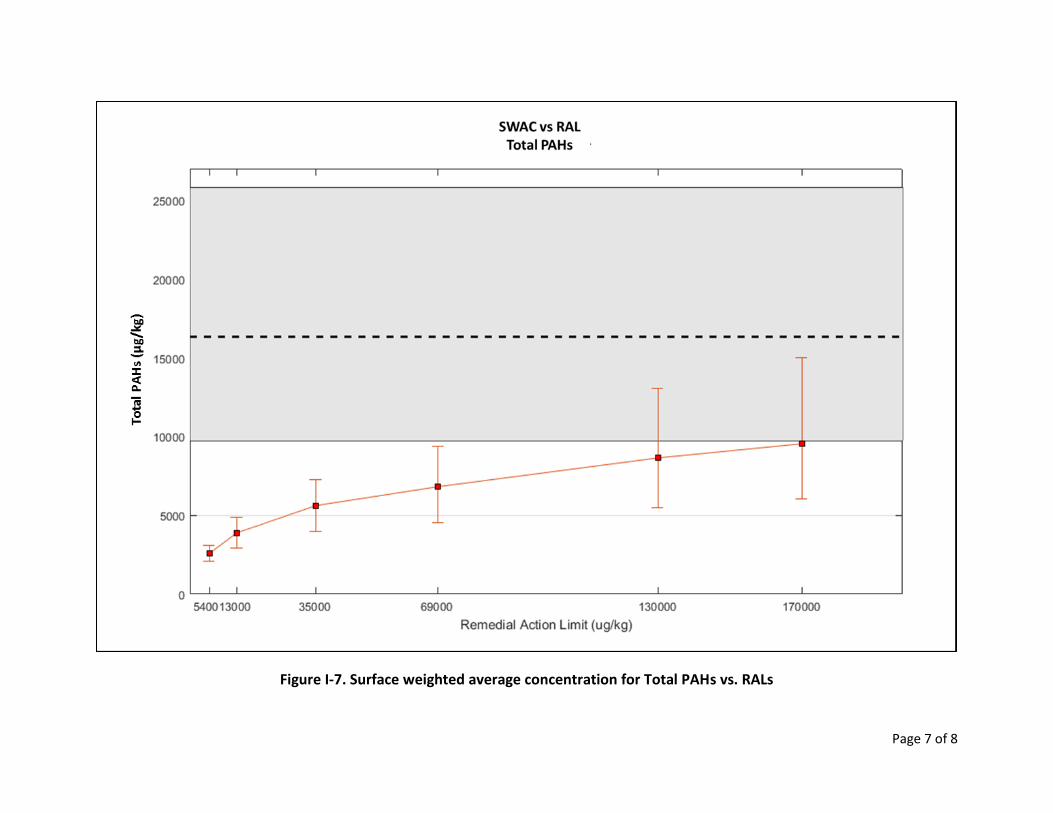
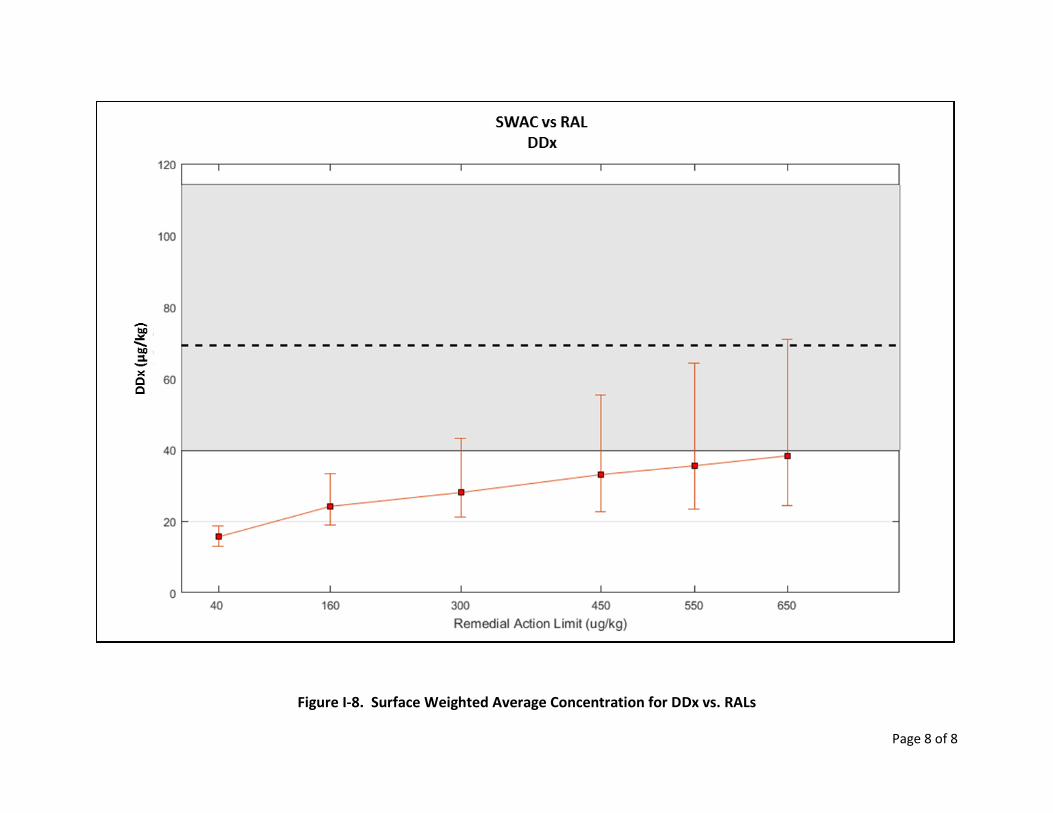
Pre and post remedial total PAH and DDx concentrations in relation to action limits are
plotted on Figure I-7 and Figure I-8 respectively. These distributions are characterized
by similar qualitative patterns to those observed for PCBs. Relative error is generally
greater for these COCs than for PCBs which had greater skewedness in the PAH and
DDx distributions, relative to the PCB distribution. Notably, the effects of this
uncertainty are minimized in the post remedial forecasts where these areas are
remediated under any RAL considered, and therefore their influence is eliminated from
the analysis. These RAL and corresponding SWAC values are also summarized in
Table I-3.
Portland Harbor RI/FS
Appendix I: Surface Weighted Average Concentration Uncertainty Analysis (PCBs, Total PAHs, DDx)
Feasibility Study
June 2016
I-7
I4. DISCUSSION
Surface weighted average concentration is an estimate exposure to receptors which may
range over large areas. If sampling were purely unbiased, standard estimation methods
for the mean and its confidence interval would be appropriate and less computationally
complex. Because the sample data are right skewed, nonparametric, as opposed to
normal theory, methods are preferred irrespective of the sampling design. If the
sampling design had been unbiased, one could select one of the bootstrap based
methods provided in ProUCL for estimating the mean and it is UCL. However, with
biased sampling prevalent at Portland Harbor it is necessary to spatially weight the data
in order reduce bias in the estimated mean and to properly characterize uncertainty
bounds. Conditional simulation, is a variant of bootstrapping for designed to
accommodate biased sampling designs and data that are spatially correlated.
The gray band on Figures I-6 through I-8 represents the 95 percent confidence interval
for the pre-remedial SWAC, and the error bars represent 95 percent prediction intervals
for the post remedial SWAC corresponding to each RAL. When these intervals do not
overlap, one can be more than 95 percent confident that the pre and post remedial
means would differ (p<0.05). When one error bar overlaps the mean there is no
difference at the 5 percent level of confidence (p>0.05) and when error bars overlap
slightly, one can conclude that there are differences but that the confidence level may be
somewhat less than 95 percent. Generally, any RAL which results in an estimated
SWAC with error bars that do not overlap the confidence limits of the pre-remedial
SWAC can be expected to reliably result in reduced post-remedial concentrations
within the range of values bounded by the confidence limits.
It should also be noted that as the RAL declines, the error bars also decline. This is
because the variance the change in SWAC is proportional to the square of the
proportion of area remediated.
varΔSWAC Proportion Re mediated varΔConcentration2
Simply, as the size of the remedial footprint grows, the chance of making delineation
mistakes declines with the area remediated. If the entire site is remediated, there is no
uncertainty.
Portland Harbor RI/FS
Appendix I: Surface Weighted Average Concentration Uncertainty Analysis (PCBs, Total PAHs, DDx)
Feasibility Study
June 2016
I-8
I5. REFERENCES
EPA, 2015. National Remedy Review Board and Contaminated Sediments Technical
Advisory Group Recommendations for the Portland Harbor Superfund Site. Office of
Solid Waste and Emergency Response. December 31, 2015
Isaaks, E. and R.M. Srivastava. 2005. Introduction to Geostatistics, Oxford University
Press. New York.
Kern, J.W. 2009. Geostatistical conditional simulation for incorporating uncertainty into
SWAC-based remedial selection. Fifth international conference on remediation of
contaminated sediments. Jacksonville, FL..
https://www.researchgate.net/publication/236585034_Geostatistical_Conditional_Simul
ation_for_Incorporating_Uncertainty_into_SWAC_Based_Remedy_Selection. Last
accessed 4/14/2016.
Srivastava, R.M. 2005. Probability field simulation: A retrospective. In: Geostatistics
Banff, 2004., 55-64. Springer, Netherlands.

Portland Harbor RI/FS
Appendix I: Surface Weighted Average Concentration Uncertainty Analysis (PCBs, Total PAHs, DDx)
Feasibility Study
June 2016
Tables

Portland Harbor RI/FS
Appendix I: Surface Weighted Average Concentration Uncertainty Analysis (PCBs, Total PAHs, DDx)
Feasibility Study
June 2016
This page left blank intentionally.
Page 1 of 2
Table I-1 Declustering Method Sensitivity for PCBs Portland Harbor Superfund Site Portland, Oregon
Table I-2 RALs for Remedial Options B through G for PCBs, Total PAH and DDx Portland Harbor Superfund Site Portland, Oregon
COC Name Units
Remedial Option
B C D E F G
PCBs µg/kg 1,000 750 500 200 75 50
Total PAHs µg/kg 170,000 130,000 69,000 35,000 13,000 5,400
DDx µg/kg 650 550 450 300 160 40
Declustering Method SWAC Estimates PCBs (µg/kg)
Stratified and Unweighted 205
Stratified on Geographic areas with Thiessen Polygons
135
Stratified on RAL Areas with Thiessen Polygons 79
Polygonal Declustering 105
Average Natural Neighbor Map 80
Page 2 of 2
Table I-3 Predicted Post Remedial SWAC (µg/kg) for a RALs. Portland Harbor Superfund Site Portland, Oregon
COC RAL
95% Lower Confidence
Limit SWAC
95% Upper Confidence
Limit
PCBs
50 22 24 25
75 27 28 30
100 30 32 34
200 37 42 46
500 48 55 64
750 53 61 72
1,000 56 65 77
Total PAHs
5,400 2,082 2,580 3,116
13,000 2,899 3,882 4,845
35,000 3,979 5,618 7,251
69,000 4,518 6,817 9,405
130,000 5,479 8,641 13,035
170,000 6,054 9,539 14,980
DDx
40 13 16 19
160 19 24 33
300 21 28 43
450 23 33 55
550 23 35 64
650 24 38 71
Portland Harbor RI/FS
Appendix I: Surface Weighted Average Concentration Uncertainty Analysis (PCBs, Total PAHs, DDx)
Feasibility Study
June 2016
Figures

Portland Harbor RI/FS
Appendix I: Surface Weighted Average Concentration Uncertainty Analysis (PCBs, Total PAHs, DDx)
Feasibility Study
June 2016
This page left blank intentionally.
Page 1 of 8
Figure I-1. Mathematical Relationships Governing Remedial Performance

This page left blank intentionally.
Page 2 of 8
Figure I-2. Conditional Simulation Procedure

This page left blank intentionally.
Page 3 of 8
Figure I-3. Relative Change in SWAC vs Percentage Area Remediated

This page left blank intentionally.
Page 4 of 8
Figure I-4. Four Equally Likely Simulated Maps of PCBs

This page left blank intentionally.

Page 5 of 8
Figure I-5. Pre-Remedial SWAC - PCBs

This page left blank intentionally.
Page 6 of 8
Figure I-6. Surface Weighted Average Concentration for PCBs vs. RALs

This page left blank intentionally.
Page 7 of 8
Figure I-7. Surface weighted average concentration for Total PAHs vs. RALs

This page left blank intentionally.
Page 8 of 8
Figure I-8. Surface Weighted Average Concentration for DDx vs. RALs

This page left blank intentionally.