Harnessing Hadoop: Understanding the Big Data Processing Options for Optimizing Analytical Workloads

Surface-Sensitive Analytical Techniques & Optimizing Fuel Cell Materials
Andrew M. Swisher Research Associate

AbstractThis is a survey that defines the operating principles and
characteristics of high resolution, surface, analytical techniques including;
SEM, TEM, STM, AFM, EDS, WDS, AES, XPS, ICP-MS, SIMS XRD, and XAS.
• Understanding of these methods is important to guide decisions about the appropriate analytical techniques to use in fuel cell analyses.
• Review of surface-sensitive analytical techniques• Composition, elemental and physical structure of
materials as well as information about the outer most atomic layers of solid surfaces.
• The objective of this work is to provide background information on the science, mathematics, operating principles with each of these analytical methods.

Objectives
• Microscopy & Imaging Techniques– STM– AFM– TEM– SEM
• Elemental Composition– EDX– WDX– SIMS– ICP-MS– ESCA– Auger
• Morphology, Crystal Structure– XRD– XAS

PART I: MICROSCOPYScanning Probe ImagingSTM, AFM
Electron MicroscopyTEM, SEM
Type Measurement Method
Resolution Magnification Destructive
TEM 2D Photo Absorption and Diffraction of
Electrons
~0.12nm 1000x to 750,000x
Yes
SEM 2D Photo Scattered Electrons and X-rays
1 nm to 20 nm 15x to 500,000x Yes
STM 3D Image Electron Tunneling ~0.1 nm laterally ~0.01 nm depth
Upwards of 1000000000x
No
AFM 3D Image Deflection Angle from Cantilever Probe
Smaller than 0.1nm
Upwards of 1000000000x
No

Imaging: Scanning Tunneling MicroscopySTM• High resolution, three-dimensional images of a sample • Measures the rate of quantum tunneling within a material• Can produce images that observe individual atoms• Images can characterize surface roughness, surface defects, and
determining the size and conformation of molecules and aggregates on a surface.
• The surface structure is studied using an extremely fine conducting probe, the tip of which is formed by a single atom
STM allows scientists to ‘see’ and manipulate individual atoms.

Imaging: Atomic Force MicroscopyAFM - 3D Surface ImagingHigh-resolution type of scanning probe microscope
The AFM consists of a cantilever with a sharp probe that is used to scan the specimen surface.
The AFM produces a very accurate nanoscale surface image in the X, Y and Z direction.
The sample requires minimal preparation. Vacuum is not used in AFM measurements.
The information during an AFM measurement is gathered by "feeling" the surface with a mechanical probe.
Single polymer chains (0.4 nm thick) recorded in aqueous media at pH 3.9 and pH 4.2

Microscopy: Transmission Electron MicroscopyTEM• Microscope images objects on the order of a few angstroms• A "light source" at the top of the TEM emits electrons which travel through a
vacuum in the column of the microscope• The electron beam is then focused to a fine probe and scanned over the thin
specimen. - The electron beam passes through a sample, which is very thin (“electron transparent”),
in order to observe the internal structure of the material.• Depending on the density of the material present, some of the electrons are
scattered off of the sample
Example TEM Images of different morphological surfaces, grains, pores.
• At the bottom of the microscope the unscattered electrons hit a fluorescent screen, which gives rise to a "shadow image" of the specimen with its different parts displayed in varied darkness according to their density

Microscopy: Scanning Electron MicroscopeSEM• The microscope images surface features of an object and its texture down to a
few nanometers. • It uses electron illumination to form images from reflected electrons. • Image is seen in 3-D but the result is a 2-D photograph. • The resulting pictures are in black and white.• High magnification and high resolution • Sample is usually coated in gold or carbon and must be dry to go under vacuum• The SEM is critical in all fields that require characterization of solid materials.
SEM Image of Fractured Surface
SEM image of Crystalline Material

PART II: ELEMENTAL COMPOSITIONCHARACTERIZATION
Electron SpectroscopyEDX, WDXMass SpectrometrySIMS, ICP-MSPhotoelectron SpectroscopyESCA, Auger

Elemental Composition: Energy Dispersive X-Rays & Wavelength Dispersive X-Rays
EDX, WDX• EDX & WDX are detectors attached to Electron
Microscope• Chemical/Elemental microanalysis techniques • The electron beam from the microscope strikes the
surface of the sample • The energy of the beam is in the range 10-20keV • This causes X-rays to be emitted from the material • The X-rays are generated from 2 microns in depth
- EDS is not a surface science technique and is considered a qualitative technique
• Analysis of each element in the sample can be acquired.
• EDX analysis takes 5-15 minutes, WDX takes hours. • Unlike the EDX technique, WDX looks at the diffraction
pattern created by the x-rays emitted from the sample.
WDX data spectrum
EDX Spectrum Elemental composition
EDX (Yellow) and WDX (Grey). MO & S lines are overlapped by EDX but resolved by WDX spectrum.
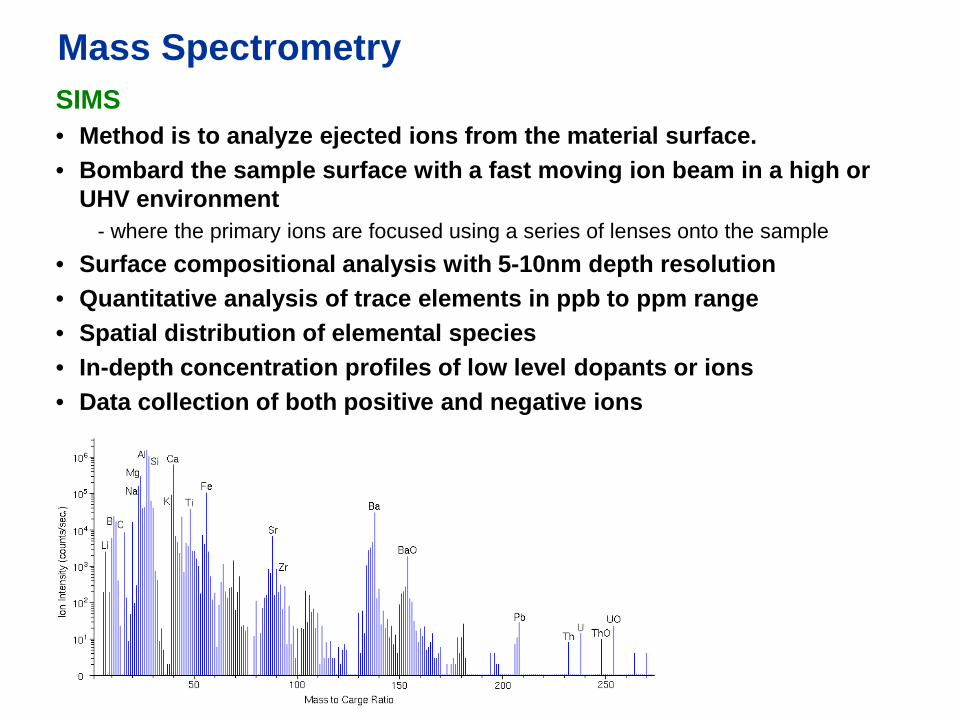
Mass SpectrometrySIMS• Method is to analyze ejected ions from the material surface. • Bombard the sample surface with a fast moving ion beam in a high or
UHV environment - where the primary ions are focused using a series of lenses onto the sample
• Surface compositional analysis with 5-10nm depth resolution• Quantitative analysis of trace elements in ppb to ppm range• Spatial distribution of elemental species• In-depth concentration profiles of low level dopants or ions • Data collection of both positive and negative ions

Inductively Coupled Plasma Mass SpectrometryICP-MS
• Sensitive type of mass spectrometry • Determine concentrations of isotope ratios below one part per trillion • ICP-MS combines an inductively coupled plasma source, an energy filter,
a magnetic sector analyzer, and multiple collectors to measure ions • Sample is introduced to a 'flame' of plasma that is electrically neutral
overall– has had a substantial fraction of its atoms ionized by high temperature – is used to atomize introduced sample molecules and to further strip the outer
electrons from those atoms

Electron Spectroscopy: XPS or ESCAX-ray photoelectron spectroscopy Electron Spectroscopy for Chemical Analysis
• Measures the elemental composition, chemical state and electronic state of the elements in a material
• Used in many different types of studies– to analyze inorganic compounds, metal alloys, semiconductors, polymers, elements,
catalysts, glasses, ceramics, paints, papers, inks, plant parts, bio-materials, viscous oils, glues, ion modified materials, etc.
• Must be done in UHV• Method
– Spectra are obtained by irradiating a material with low energy Mg or Al x-rays which are used to generate photoelectrons from the top1-10nm of the sample surface.
– The binding energies of the emitted photoelectrons are characteristic of the various elements and the different chemical states present on the sample surface.
– The energy of these photoelectrons are analyzed to obtain qualitative and quantitative information on surface composition and surface electronic states.

Electron Spectroscopy: Auger
• A widely used surface-sensitive analytical technique • Must be done in UHV• Provides elemental composition of the outer most atomic layer for a solid • Based on the Auger effect
– analysis of energetic electrons emitted from an excited atom after a series of internal relaxation events
• Method– uses an electron beam to produce an excited ion which relaxes by the emission of
a second electron of discrete energy to form a doubly ionized atom. The kinetic energy of the secondary electron is measured to yield information about the sample surface.
AES

PART III: MORPHOLOGYCRYSTAL STRUCTURE
DIFFRACTION, SCATTERINGXRDXAS

X-Ray DIFFRACTIONXRD• Used to study crystals structure
– salts, metals, minerals, semiconductors, inorganic, organic molecules.
• Determine the size of atoms, the lengths and types of chemical bonds, and the atomic-scale differences among various materials, especially minerals and alloys
• Determines the arrangement of atoms within a crystalline sample.
• Method– X-rays are generated by a cathode ray tube,
filtered to produce monochromatic radiation, and focused on sample.
– A beam of X-rays strikes a crystal and diffracts at specific angles
– Technique observes the constructive interference patterns of monochromatic X-rays diffracted from a crystalline sample
– Bragg's Law (nλ=2d sin θ). – From the angles and intensities of these
diffracted beams, a crystallographer can produce a three-dimensional picture of the density of electrons within the crystal.
Crystal structure data collected by an XRD instrument

Scattering: X-Ray Absorption SpectroscopyXAS – EXAFS & XANES• Techniques used to determine the geometric
and electronic structure of a sample through X-ray absorption
• Require synchrotron radiation source– Intense and tunable X-ray beam. – A wide range of data is collected by tuning the
photon energy over a range where core electrons can be excited
• Method– X-rays hit the sample, the oscillating electric field of
the electromagnetic radiation interacts with the electrons bound in an atom
– Either the radiation will be scattered by these electrons, or absorbed and excite the electrons when ax X-ray beam passes through a medium
• X-ray Absorption Near-Edge Structure, XANES– The pre-edge region is at energies lower than the
rising edge• Extended X-ray Absorption Fine Structure,
EXAFS– region is at energies above the rising edge, and
corresponds to the scattering of the ejected photoelectron off neighboring atoms
Transitions that contribute to XAS edges
Absorption Spectrum for XANES and EXAFS