Surface Nitriding and Oxidation of Nitinol
148
San Jose State University San Jose State University SJSU ScholarWorks SJSU ScholarWorks Master's Theses Master's Theses and Graduate Research Summer 2011 Surface Nitriding and Oxidation of Nitinol Surface Nitriding and Oxidation of Nitinol Edin Bazochaharbakhsh San Jose State University Follow this and additional works at: https://scholarworks.sjsu.edu/etd_theses Recommended Citation Recommended Citation Bazochaharbakhsh, Edin, "Surface Nitriding and Oxidation of Nitinol" (2011). Master's Theses. 4037. DOI: https://doi.org/10.31979/etd.qcdw-m2th https://scholarworks.sjsu.edu/etd_theses/4037 This Thesis is brought to you for free and open access by the Master's Theses and Graduate Research at SJSU ScholarWorks. It has been accepted for inclusion in Master's Theses by an authorized administrator of SJSU ScholarWorks. For more information, please contact [email protected].
Transcript of Surface Nitriding and Oxidation of Nitinol

San Jose State University San Jose State University
SJSU ScholarWorks SJSU ScholarWorks
Master's Theses Master's Theses and Graduate Research
Summer 2011
Surface Nitriding and Oxidation of Nitinol Surface Nitriding and Oxidation of Nitinol
Edin Bazochaharbakhsh San Jose State University
Follow this and additional works at: https://scholarworks.sjsu.edu/etd_theses
Recommended Citation Recommended Citation Bazochaharbakhsh, Edin, "Surface Nitriding and Oxidation of Nitinol" (2011). Master's Theses. 4037. DOI: https://doi.org/10.31979/etd.qcdw-m2th https://scholarworks.sjsu.edu/etd_theses/4037
This Thesis is brought to you for free and open access by the Master's Theses and Graduate Research at SJSU ScholarWorks. It has been accepted for inclusion in Master's Theses by an authorized administrator of SJSU ScholarWorks. For more information, please contact [email protected].
SURFACE NITRIDING AND OXIDATION OF NITINOL
A Thesis
Presented to
The Faculty of the Department of Chemical and Materials Engineering
San José State University
In Partial Fulfillment
of the Requirements for the Degree
Master of Science
by
Edin Bazochaharbakhsh
August 2011

© 2011
Edin Bazochaharbakhsh
ALL RIGHTS RESERVED

The Designated Thesis Committee Approves the Thesis Titled
SURFACE NITRIDING AND OXIDATION OF NITINOL
by
Edin Bazochaharbakhsh
APPROVED FOR THE DEPARTMENT OF CHEMICAL AND MATERIALS
ENGINEERING
SAN JOSÉ STATE UNIVERSITY
August 2011
Dr. Guna Selvaduray Department of Chemical and Materials Engineering
Dr. Melanie McNeil Department of Chemical and Materials Engineering
Dr. Gregory Young Department of Chemical and Materials Engineering

ABSTRACT
SURFACE NITRIDING AND OXIDATION OF NITINOL
By Edin Bazochaharbakhsh
Nitinol has been widely employed in biomedical devices due to its unique
mechanical properties such as superelasticity, shape memory, and good biocompatibility.
However, nickel ion release from the surface of the Nitinol is an issue. Surface nitriding
and oxidation was performed on the Nitinol specimens to develop a nickel-free oxide
layer on the surface. Nitinol specimens were nitrided in nitrogen + 4% hydrogen at 800 -
1000oC for 10 - 30 min and further nitrided in nitrogen + 5% ammonia at 500 - 675
oC for
0 - 30 min. The thickness and chemical composition, specifically the nickel content of
the surface layer, were determined by scanning electron microscopy (SEM) and X-ray
photoelectron spectroscopy (XPS), respectively. The effect of the nitriding time and
temperature on the thickness and chemical composition of the nitride layer was evaluated.
Nitriding temperature was found to be more effective than nitriding time on the thickness
of TiN layer. Titanium nitride, the dominant phase on the surface of the nitrided
specimens, was nickel free. The nitrided Nitinol specimens were then oxidized at 675oC
and 700oC for 30 and 60 min, respectively. The chemical composition and elemental
depth profile showed that oxidizing Nitinol specimens with a 0.4 µm thick nitride layer
on the surface did not provide a nickel-free oxide layer on the surface of the Nitinol.
However, oxidizing the Nitinol specimens with a surface nitride layer that was thicker
than 6 µm resulted in a nickel-free oxide layer.

v
ACKNOWLEDGMENTS
The author would like to thank his advisor, Dr. Guna Selvaduray, for invaluable
mentoring, guidance, and support throughout this work with his knowledge and skills in
the technical field, as well as in teaching. Special credit must also be given to Vince
Christ at Nanolab Technologies and Robert Cormia at Foothill College for providing XPS
and AFM analysis. The critical review and stewardship of Dr. Melanie McNeil and Dr.
Gregory Young are appreciated.
The support from the San Jose State University staff, particularly Neil Peters and
Craig Stauffer, is also appreciated. A big thank you goes to Yiming Shan for her help in
editing this document.
This thesis is dedicated to the author’s family, who have supported him
throughout his education.

vi
TABLE OF CONTENTS
LIST OF FIGURES x
LIST OF TABLES xvi
CHAPTER ONE INTRODUCTION 2
1.1 History and Background 2
1.2 Properties of Nitinol 2
1.3 Applications of Nitinol 4
1.4 Nickel Toxicity 6
1.5 Scope of Research 7
CHAPTER TWO LITERATURE REVIEW 9
2.1 Background 9
2.2 Mechanical Surface Treatment Methods 10
2.3 Thermal Oxidation 11
2.4 Aqueous-based Surface Treatment 24
2.5 Summary of Oxidation 27
2.6 Surface Nitriding of Nitinol 28
2.7 Summary of Nitriding 34
2.8 Summary of Literature Review 34

vii
CHAPTER THREE RESEARCH HYPOTHESIS AND OBJECTIVES 36
CHAPTER FOUR MATERIALS AND METHODS 38
4.1 Specimen Preparation 40
4.2 Tube Furnace and Gas Delivery System Setup 40
4.3 Nitriding 45
4.3.1 Nitriding in Pure Nitrogen 45
4.3.2 Nitriding in 96% N2 + 4% H2 46
4.3.3 Nitriding in 95% N2 + 5% NH3 47
4.4 Oxidation 48
4.5 Nitriding and Oxidation 48
4.6 Surface Characterization 49
4.6.1 X-ray Diffraction 49
4.6.2 X-ray Photoelectron Spectroscopy 50
4.6.3 Atomic Force Microscopy 50
4.6.4 Scanning Electron Microscopy 52
CHAPTER FIVE RESULTS 53
5.1 Untreated Specimens 53
5.1.1 Nominal Composition of Nitinol Specimens 53
5.1.2 Specimen Preparation 55

viii
5.2 Nitrided Nitinol 57
5.2.1 Nitinol Nitrided With Pure Nitrogen 58
5.2.2 Nitinol Nitrided With Nitrogen + 4% Hydrogen 58
5.2.2.1 Nitride Layer Thickness 63
5.2.2.2 Effect of the Nitriding Time and Temperature 65
5.2.3 Nitinol Nitrided With Nitrogen + 5% Ammonia 66
5.2.4 Summary of Nitriding 68
5.3 Oxidized Nitinol 69
5.4 Nitrided and Oxidized Nitinol Specimens 73
CHAPTER SIX DISSCUSSION 77
6.1 Surface Chemical Composition 77
6.1.1 Bare Nitinol 77
6.1.2 Nitrided Nitinol 78
6.1.3 Oxidized Nitinol 81
6.1.4 Nitrided and Oxidized Nitinol 82
6.2 Sources of Error and Confidence of Results 83
CHAPTER SEVEN CONCLUSIONS 85
CHAPTER EIGHT RECOMMENDATIONS FOR FUTURE WORK 87
REFERENCES 89

ix
APPENDIX A THERMODYNAMIC CALCULATIONS 93
APPENDIX B DETERMINATION OF THE ION ETCH RATE BY AFM 96
APPENDIX C XPS ANALYSIS 104
C.1 Mechanically Polished Specimens 104
C.2 Specimens Nitrided in 96% N2 + 4% H2 108
C.3 Specimens Nitrided in 95% N2 + 5% NH3 120
C.4 Oxidized Specimens 124
C.5 Nitrided and Oxidized Specimens 128

x
LIST OF FIGURES
Figure 1. Schematic diagram of shape memory effect in Nitinol [5]. 2
Figure 2. Engineering stress-strain curve of Nitinol and stainless 3
steel 316 [1].
Figure 3. Martensitic transformation of superelastic Nitinol [5]. 3
Figure 4. Standard Gibbs free energy of formation of NiO, TiO, TiO2, 12
Ti2O3, and Ti3O5 for 298 - 1700 K.
Figure 5. Schematic of the oxidation process on the surface of Nitinol 14
at oxidation temperature < 500oC.
Figure 6. Schematic of the oxidation process on the surface of Nitinol 15
oxidation temperature > 600oC.
Figure 7. Standard Gibbs free energy of formation of TiN as the 29
function of temperature.
Figure 8. Standard Gibbs free energy of formation of TiN as the 30
function of titanium activity at different temperatures.
Figure 9. An overview of surface treatment processes on the Nitinol 39
specimens.
Figure 10. Temperature profile along the tube furnace at 500 - 1100oC. 41
Figure 11. Schematic of the tube with fittings and thermocouple. 42
Figure 12. Schematic of NiTi specimen on quartz boat in tube furnace. 42
Figure 13. Image of NiTi specimen on quartz boat in tube furnace. 42
Figure 14. Schematic of tube furnace and gas delivery system set up 44
for gas nitriding with pure N2 or 96% N2 + 4% H2, followed
by oxidation.
Figure 15. Schematic diagram of tube furnace and gas delivery system 45
set up for gas nitriding with a 95% N2 + 5% NH3 mix.
Figure 16. Measurement of the ion etch rate using AFM. 51

xi
Figure 17. Energy-dispersive x-ray spectroscopy spectrum from the 54
mechanically polished Nitinol after the polishing.
Figure 18. X-ray diffraction pattern from the mechanically polished 54
Nitinol.
Figure 19. X-ray photoelectron spectroscopic elemental depth profile of 55
(a) air-dried and (b) argon-dried specimens.
Figure 20. Scanning electron microscopic images from (a) mechanically 56
polished and (b) mechanically polished and chemically
etched specimens.
Figure 21. Energy-dispersive x-ray spectroscopy spectrum from the 57
chemically etched Nitinol.
Figure 22. X-ray diffraction results from the specimen nitrided at 59
800oC for 30 min.
Figure 23. Elemental depth profile of specimens nitrided in 59
96% N2 + 4% H2 at(a) 800oC for 30 min, (b) 900
oC
for 30 min and (c) 1000oC for 30 min.
Figure 24. X-ray photoelectron spectroscopic survey scan of specimens 61
nitrided in 96% N2 + 4% H2 at (a) 800oC for 30 min,
(b) 900oC for 20 min, (c) 900
oC for 30 min, (d) 1000
oC for
10 min, (e) 1000oC for 20 min, and (f) 1000
oC for 30 min.
Figure 25. High resolution XPS spectra for Ni2p from (a) specimen 62
nitrided at 800oC for 30 min and (b) specimen nitrided
at 900oC for 30 min.
Figure 26. Scanning electron microscopic images from the transverse 64
section of specimens nitrided in 96% N2 + 4% H2.
Figure 27. Nitride layer thickness on the surface of the Nitinol as a 65
function of nitriding temperature.
Figure 28. Nitride layer thickness on the surface of the Nitinol as a 66
function of nitriding time.
Figure 29. X-ray photoelectron spectroscopic depth profile of 67
specimens nitrided in 95% N2 + 5% NH3 at (a) 500oC for 5
min and (b) 675oC for 5 min.
xii
Figure 30. Scanning electron microscopic image from the transverse 68
section of specimen nitrided in 95% N2 + 5% NH3 at 500oC
for 5 min.
Figure 31. X-ray diffraction results from the oxidized Nitinol in air 70
at 700oC for 60 min.
Figure 32. X-ray photoelectron spectroscopic depth profile of specimen 71
oxidized at 675oC for 30 min.
Figure 33. Nickel high resolution XPS scan results for specimen 71
oxidized at 675oC for 30 min.
Figure 34. X-ray photoelectron spectroscopic depth profile of specimen 72
oxidized in air at 700oC for 60 min.
Figure 35. Nickel high resolution XPS scan results for specimen 72
oxidized at 675oC for 30 min.
Figure 36. X-ray diffraction results from N-1000-20-O-700-30. 74
Figure 37. X-ray photoelectron spectroscopic depth profile of 74
N-1000-20-O-700-30.
Figure 38. X-ray photoelectron spectroscopic depth profile of 75
A-675-5-O-675-30.
Figure B-1. Topography of the surface of the nitrided specimen, ion 97
etched for 200 s.
Figure B-2. Transverse section and the measured step height from 12 98
points on the surface of nitrided specimen, ion etched for
200 s.
Figure B-3. Topography of the surface of the nitrided specimen, ion 99
etched for 700 s.
Figure B-4. Transverse section and the measured step height from 12 100
points on the surface of nitrided specimen, ion etched for
700 s.
Figure B-5. Topography of the surface of the nitrided specimen, ion 101
etched for 1100 s.

xiii
Figure B-6. Transverse section and the measured step height from 12 102
points on the surface of nitrided specimen, ion etched for
1100 s.
Figure C-1 . X-ray photoelectron spectroscopic depth profile of the 104
mechanically polished specimen, washed with DI water and
air dried.
Figure C-2. X-ray photoelectron spectroscopic high resolution scans of 105
the mechanically polished specimen, washed with DI water
and air dried.
Figure C-3. X-ray photoelectron spectroscopic depth profile of the 106
mechanically polished specimen, washed with deaerated
DI water and argon dried.
Figure C-4. X-ray photoelectron spectroscopic high resolution scans of 107
the mechanically polished specimen, washed with deaerated
DI water and argon dried.
Figure C-5. X-ray photoelectron spectroscopic depth profile of the 108
specimen nitrided in 96% N2 + 4% H2 at 800oC for 30 min.
Figure C-6. X-ray photoelectron spectroscopic high resolution scans of 109
the specimen nitrided in 96% N2 + 4% H2 at 800oC for 30 min.
Figure C-7. X-ray photoelectron spectroscopic depth profile of the 110
specimen nitrided in 96% N2 + 4% H2 at 900oC for 20 min.
Figure C-8. X-ray photoelectron spectroscopic high resolution scans of 111
the specimen nitrided in 96% N2 + 4% H2 at 900oC for 20 min.
Figure C-9. X-ray photoelectron spectroscopic depth profile of the 112
specimen nitrided in 96% N2 + 4% H2 at 900oC for 30 min.
Figure C-10. X-ray photoelectron spectroscopic high resolution scans 113
of the specimen nitrided in 96% N2 + 4% H2 at 900oC for
30 min.
Figure C-11. X-ray photoelectron spectroscopic depth profile of the 114
specimen nitrided in 96% N2 + 4% H2 at 1000oC for 10 min.
Figure C-12. X-ray photoelectron spectroscopic high resolution scans of 115
the specimen nitrided in 96% N2 + 4% H2 at 1000oC for 10 min.

xiv
Figure C-13. X-ray photoelectron spectroscopic depth profile of the 116
specimen nitrided in 96% N2 + 4% H2 at 1000oC for 20 min.
Figure C-14. X-ray photoelectron spectroscopic high resolution scans of 117
the specimen nitrided in 96% N2 + 4% H2 at 1000oC for 20 min.
Figure C-15. X-ray photoelectron spectroscopic depth profile of the 118
specimen nitrided in 96% N2 + 4% H2 at 1000oC for 30 min.
Figure C-16. X-ray photoelectron spectroscopic high resolution scans of 119
the specimen nitrided in 96% N2 + 4% H2 at 1000oC for 20 min.
Figure C-17. X-ray photoelectron spectroscopic depth profile of the 120
specimen nitrided in 95% N2 + 5% NH3 at 500oC for 5 min.
Figure C-18. X-ray photoelectron spectroscopic high resolution scans of 121
the specimen nitrided in 95% N2 + 5% NH3 at 500oC for 5 min.
Figure C-19. X-ray photoelectron spectroscopic depth profile of the 122
specimen nitrided in 95% N2 + 5% NH3 at 675oC for 5 min.
Figure C-20. X-ray photoelectron spectroscopic high resolution scans 123
of the specimen nitrided in 95% N2 + 5% NH3 at 675oC for
5 min.
Figure C-21. X-ray photoelectron spectroscopic depth profile of the 124
specimen oxidized in air at 675oC for 30 min.
Figure C-22. X-ray photoelectron spectroscopic high resolution scans of 125
the specimen oxidized in air at 675oC for 30 min.
Figure C-23. X-ray photoelectron spectroscopic depth profile of the 126
specimen oxidized in air at 700oC for 60 min.
Figure C-24. X-ray photoelectron spectroscopic high resolution scans 127
of the specimen oxidized in air at 675oC for 30 min.
Figure C-25. X-ray photoelectron spectroscopic depth profile of the 128
specimen nitrided in 95% N2 + 5% NH3 at 675oC for 5
min and oxidized in air at 675oC for 30 min.
Figure C-26. X-ray photoelectron spectroscopic high resolution scans of 129
the specimen nitrided in 95% N2 + 5% NH3 at 675oC for 5
min and oxidized in air at 675oC for 30 min.

xv
Figure C-27. X-ray photoelectron spectroscopic depth profile of the 130
specimen nitrided in 96% N2 + 4% H2 at 1000oC for 20
min and oxidized in air at 700oC for 60 min.
Figure C-28. X-ray photoelectron spectroscopic high resolution scans of 131
the specimen nitrided in 96% N2 + 4% H2 at 1000oC for 20
min and oxidized in air at 700oC for 60 min.

xvi
LIST OF TABLES
Table 1. Electropolishing parameters. 26
Table 2. Experimental design matrix and specimen numbers for 46
specimens nitrided pure N2.
Table 3. Experimental design matrix and specimen numbers for 47
specimens nitrided in 96% N2 + 4% H2.
Table 4. Experimental design matrix and specimen numbers for 48
specimens nitrided in 95% N2 + 5% NH3.
Table 5. Experimental design matrix and specimen numbers for 49
nitrided and oxidized specimens.
Table 7. Thickness of the nitride layer on the surface of the Nitinol. 63
Table A-1. Calculated
values for NiO, TiO, Ti2O3, Ti3O5, TiO2, and 94
TiN.
Table A-2. Standard Gibbs free energy of formation of TiN as a 95
function of thermodynamic activity of Ti and temp.
Table B-1. Step heights, measured by AFM. 103
Table B-2. Calculated values for ion etch rate. 103

CHAPTER ONE
INTRODUCTION
Shape memory alloys are widely used in medical devices. The most widely used
shape memory alloy today is Nitinol which has excellent biocompatibility [1].
1.1 History and Background
Nitinol is a family of equiatomic intermetallic compounds of nickel and titanium.
The term “alloy” is used loosely to describe the combination of these two elements.
“Nitinol” is an acronym for Nickel and Titanium Naval Ordnance Laboratory [2]. The
discovery of Nitinol is credited to William J. Buehler who was investigating nickel and
titanium alloys as candidate materials for the nose cone of the U.S. Navy Polaris reentry
vehicle. However, Nitinol was not found to be useful in the Polaris project. After further
research by Buehler and others, more information was gathered about Nitinol’s phase
transformation at room temperature, and this raised the interests of many researchers. A
detailed history of the discovery of Nitinol is well described by Kauffman and Mayo [2].
1.2 Properties of Nitinol
Nitinol undergoes a martensite-to-austenite phase transformation during heating
over a temperature range close to room temperature. This phase transformation in Nitinol
is the cause of its unique mechanical properties such as shape memory and superelasticity.
2
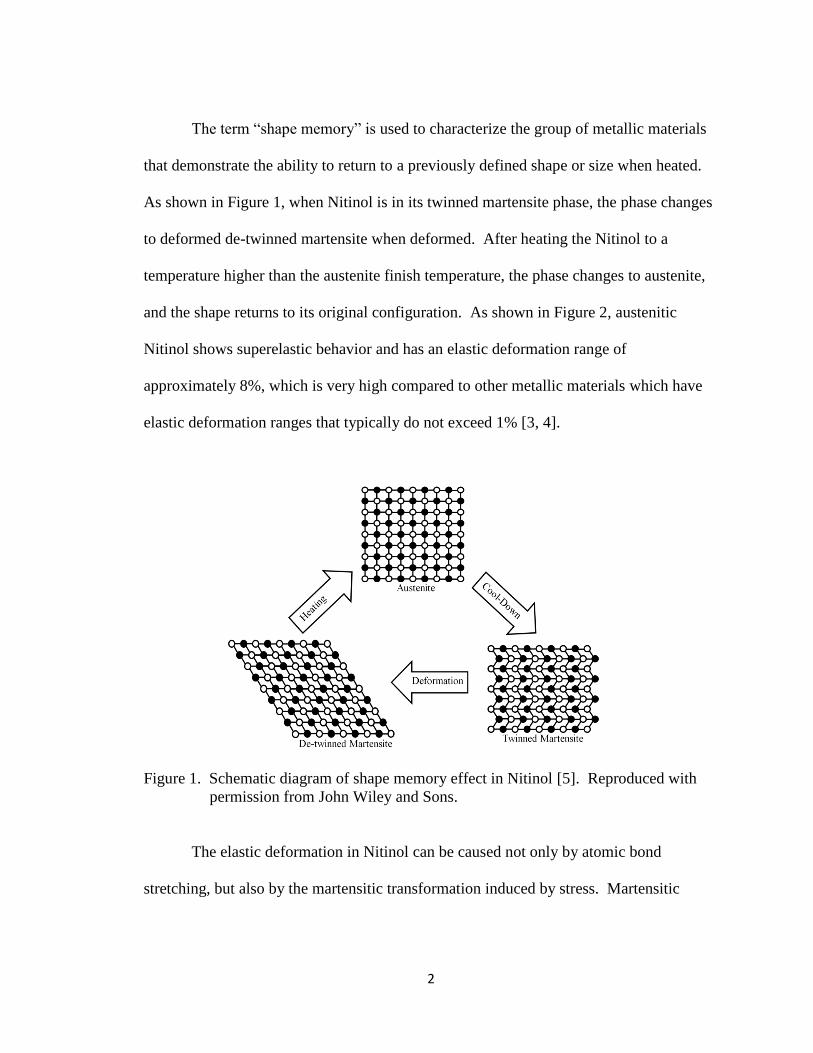
The term “shape memory” is used to characterize the group of metallic materials
that demonstrate the ability to return to a previously defined shape or size when heated.
As shown in Figure 1, when Nitinol is in its twinned martensite phase, the phase changes
to deformed de-twinned martensite when deformed. After heating the Nitinol to a
temperature higher than the austenite finish temperature, the phase changes to austenite,
and the shape returns to its original configuration. As shown in Figure 2, austenitic
Nitinol shows superelastic behavior and has an elastic deformation range of
approximately 8%, which is very high compared to other metallic materials which have
elastic deformation ranges that typically do not exceed 1% [3, 4].
Figure 1. Schematic diagram of shape memory effect in Nitinol [5]. Reproduced with
permission from John Wiley and Sons.
The elastic deformation in Nitinol can be caused not only by atomic bond
stretching, but also by the martensitic transformation induced by stress. Martensitic

3
Nitinol is more stable under applied stress. When a stress is applied to Nitinol, it changes
from austenite to martensite, and when the applied stress is removed, the phase returns to
austenite. This phenomenon is represented in Figure 3 [3, 4].
Figure 2. Engineering stress-strain curve of Nitinol and stainless steel 316 [1].
Reproduced with permission from Elsevier.
Figure 3. Martensitic transformation of superelastic Nitinol [5]. Reproduced with
permission from John Wiley and Sons.

4
Nitinol is also a corrosion resistant and biocompatible material due to the
formation of a passive oxide layer on the surface. Thermodynamically, TiO2 is a very
stable compound due to its extremely low standard Gibbs free energy of formation of
-889 kJ/mol at room temperature. Therefore, when in contact with oxygen, the titanium
in Nitinol forms a TiO2 layer on the surface. Titanium dioxide is inert in the human body
[6, 7].
1.3 Applications of Nitinol
At the time of the discovery of Nitinol, it did not receive much attention from
research institutes and manufacturers due to its unconventional properties and sensitivity
to temperature and composition; it was difficult for designers to employ Nitinol in their
designs. After further research on some specific compositions, designers found some
applications for which Nitinol’s properties could to be employed. The first successful
application of Nitinol was as a pipe coupler in U.S. Navy F-14 jet fighters [2].
The excellent corrosion resistance and biocompatibility of Nitinol made it
desirable for implanted biomedical devices. The combination of superelasticity, shape
memory, kink resistance, and lack of hysteresis during cyclic loading make Nitinol
unique; this combination is not offered by typical biomaterials like 316L stainless steel,
commercially pure (C.P.) titanium, or cobalt chromium alloys. The combination of its
unique mechanical properties, with good corrosion resistance and biocompatibility, has

5
resulted in Nitinol being an attractive choice for implantable biomedical devices such as
catheters, stents, inferior vena cava filters [1], and orthodontic arch wires [5].
Angiography is an interventional radiology procedure. A catheter (a tube) is
inserted into the body, passing through arteries and veins, to perform advanced medical
procedures such as re-establishing blood flow in blocked arteries or implanting filters to
prevent blood clots from reaching the lungs. From the insertion point to the desired
delivery point, the catheter needs to pass through very small vessels and some tortuous
regions. Superelasticity (high recoverable strain), good kink resistance, steerability, and
torquability of Nitinol make it a good candidate for this device [1].
Stents are permanently implantable metal scaffolds used to support the wall of the
blood vessel during angioplasty, a technique employed to restore blood flow in the
treatment of coronary heart diseases [1]. Conventional stents are made of Stainless Steel
316LVM™. A balloon is used to expand these stents to match the blood vessel’s
diameter. Self-expanding stents, made of Nitinol, expand to their original shape when
they reach body temperature, taking advantage of the shape memory character of Nitinol.
The lack of hysteresis in superelastic stress-strain behavior also makes it a good choice
for use in stents.
Another Nitinol application is for inferior vena cava filters (IVC) [1]. Pulmonary
embolism occurs when one or more blood clots move to the lungs. This can be fatal. In
conventional approaches, medicines such as Warfarine are employed to decrease the
clotting ability of blood. Another method is to employ IVC filters in the vein to block
blood clots before they reach the lungs. This biomedical device needs to be removed

6
after a period of time. A small insertion profile is also required during the installation of
IVC. Nitinol, due to its superelasticity, is a good candidate to be employed in IVC filters.
Nitinol is also widely used in dentistry [7]. Superelasticity makes Nitinol a good
material to be used in root canal tools. To clean and expand curved canals, Nitinol files
are used with an extremely low risk of breaking the tool. Orthodontic arch wires are also
made of Nitinol. The high spring-back property due to the superelastic behavior of
Nitinol as well as good biocompatibility and corrosion resistance make Nitinol a good
candidate to be employed in this application.
Application of Nitinol as a biomaterial is not limited to the applications listed
above, and new uses continue to be developed. However, the potential allergic reaction
to nickel, particularly in women, continues to be a problem with implantation of Nitinol
in the human body [8].
1.4 Nickel Toxicity
The presence of nickel in metallic and oxide forms on the surface layer is of
considerable concern. Nickel ion leaching from Nitinol specimens has been reported [9-
11]. Compared to nickel in the oxide form, elemental nickel leaches more easily into
body fluids. The amount and rate of the nickel ion release varies with exposure time and
surface treatments on the Nitinol specimens. Generally, the nickel ion release rate has
been found to decrease with time due to nickel depletion from the surface as a result of
the leaching. In most of the cases reported in the literature, a mechanically polished
specimen was considered as the control specimen and was compared with other

7
specimens that were surface treated with methods like thermal oxidation, electropolishing,
chemical etching, pickling and/or boiling in water. For the mechanically polished
samples, the nickel ion release rate decreased with exposure time to undetectable
amounts after 10 days [12]; however, in some cases nickel ion release was reported even
after 10 days or more of exposure in simulated body environments [13]. Surface
treatments on Nitinol samples decreased the amount of released nickel ions, with the
decrease varying with the surface treatment method [9-13]. To eliminate the presence of
nickel on the surface, different surface treatments have been studied and/or are under
investigation.
1.5 Scope of Research
The widespread use of Nitinol in biomedical devices, due to its unique
mechanical properties such as shape memory and superelasticity, as well as good
biocompatibility and corrosion resistance of Nitinol, coupled with the requirement of a
surface treatment to eliminate the nickel ion release, led to this research effort. Therefore,
the objective of this research was to study the effects of surface nitriding and oxidation,
separately and sequentially, on the surface chemistry of Nitinol, and evaluate the ability
of this surface treatment to form a nickel-free oxide layer on the surface.
Previous studies on different surface treatment methods such as thermal oxidation,
mechanical surface treatment, aqueous surface treatment methods and surface nitriding
are reviewed and presented in Chapter Two. In Chapter Three the research objectives of
this work are described. The experimental procedures and the research approaches to

8
fulfill the research objective are described in Chapter Four. The results of the
experiments are in Chapter Five, followed by the discussion of these results in Chapter
Six. Chapter Seven contains the conclusion of this research and recommendations for
future work are in Chapter Eight.
9
CHAPTER TWO
LITERATURE REVIEW
2.1 Background
Previous studies on different surface treatment techniques on Nitinol were
reviewed and are presented in this chapter. The surface treatment methods reviewed
were all related to reducing nickel ion release and improving corrosion resistance.
Surface treatments of Nitinol include mechanical polishing, electropolishing, chemical
etching, boiling in water, thermal oxidation, laser surface melting and ion implantation.
A combination of two or more of the techniques listed above could potentially be
employed to form a nickel depleted TiO2 layer on the surface. Methods to form a TiN
layer on the Nitinol’s surface, such as thermal nitriding, laser nitriding, and PIRAC
nitriding (Powder Immersion Reaction Assisted Coating) have also been studied. After
surface treatments, the surface of the Nitinol samples have been characterized by
different surface characterization methods like X-ray Photoelectron Spectroscopy (XPS),
Auger Electron Spectroscopy (AES), Scanning Electron Microscopy (SEM) and Atomic
Force Microscopy (AFM) to obtain data on the thickness of the surface layer as well as
its chemical composition.
The most appropriate surface treatment method is usually selected according to
the performance expectation of Nitinol, as well as the cost of the part and the process [7].
For each surface treatment process, there are many different variables affecting the

10
outcome of the treatment. For nitriding and oxidizing the important process factors are
temperature, time and the surface treatment atmosphere [7].
The nickel content of the passive film on the surface determines the nickel release
rate of the part during service [14].
2.2 Mechanical Surface Treatment Methods
Mechanically polished Nitinol has been used in biological studies. In most cases
mechanically polished specimens were used as the base-case and were compared with
specimens treated with other techniques. Mechanical polishing has also been used as a
specimen preparation step before other surface treatment and/or coating methods.
Mechanically polished Nitinol specimens have poor corrosion resistance [15, 16].
One reason for the low corrosion resistance is surface damage during polishing,
which increases the risk of pitting corrosion. Another cause of the corrosion is the stored
energy on the surface in plastically deformed micro-zones [15]. Contaminants absorbed
from polishing particles and/or during handling and cleaning also potentially decrease the
corrosion resistance. The surface elemental composition of the mechanically polished
Nitinol depends on polishing method and materials, cleaning technique and the drying
and handling process of the specimen. The presence of different surface contaminants
such as Ca, Cl, P, Si, Mg and Na has been reported. The concentrations of these
contaminants on the surface were 1 – 8% (at.%) [17].
While the surface of the mechanically polished Nitinol is predominantly TiO2, the
presence of significant amounts of nickel in metallic and/or oxide forms has been

11
reported [15, 18]. The nickel concentration on the surface was not consistent and
different values varying from 0.9 - 20% (at.%) has been reported. This inconsistency was
most probably due to the presence of the surface defects, formed during the mechanical
polishing procedures [19, 20]. The amount of the released nickel has also been reported.
It was 200 µg l-1
cm-2
from a mechanically polished sample after five days immersion in
simulated body fluid, which was high compared to 50 µg l-1
cm-2
from electropolished
specimens and 15 µg l-1
cm-2
from specimens oxidized at 600oC with an oxygen partial
pressure of 1 atmosphere [21]. Sources of the released nickel are nickel concentration on
the surface and corrosion sites.
2.3 Thermal Oxidation
When in contact with oxygen, TiO2 forms on the surface of Nitinol due to the
high thermodynamic stability of TiO2. The standard Gibbs free energy of formation for
TiO2 is lower than that for nickel oxides. As shown in Figure 4, titanium in different
oxidation states is more stable than nickel oxide, over the temperature range of 298 K
(25oC) to 1800 K (1527
oC) . At room temperature the standard Gibbs free energy of
formation for TiO2 is -889 kJ/mol, lower than the value for NiO which is -212 kJ/mol [6].
Titanium dioxide is therefore the dominant phase on the surface of Nitinol. The TiO2
layer thickness increases with increase in the oxidation temperature, which facilitates the
diffusion of oxygen into the Nitinol surface and diffusion of titanium from the bulk
toward the outer surface. The presence of nickel in elemental and oxide forms on, and
nickel ion release from, the surface of thermally oxidized Nitinol has been reported [7].

12
Figure 4. Standard Gibbs free energy of formation of NiO, TiO, TiO2, Ti2O3 and Ti3O5
for 298 K to 1700 K, Data from [6].
The standard Gibbs free energy of formation of TiO2 from TiO, Ti2O3, Ti3O5 and
oxygen is negative; therefore, when in contact with oxygen all forms of titanium oxide
tend to form TiO2 [6]. At higher oxidation temperatures diffusion of oxygen into the
Nitinol surface layer and titanium migration from the Nitinol bulk toward the outer
surface become easier; therefore, the oxide layer on the surface of the Nitinol becomes
thicker with an increase in oxidation temperature. Increase in the oxidation time also
increases the thickness of the oxide layer on the surface of Nitinol.
The kinetics of formation of TiO2 on the surface of the Nitinol has also been
studied [22]. The oxide layer thickness increases with increase in oxidation temperature
and time; however, oxidation temperature was found to be more controlling than
oxidation time. There was a change in the oxidation behavior of Nitinol at temperatures
close to 600oC. In the temperature range of 600 to 1000
oC the growth rate of the oxide
-1000
-900
-800
-700
-600
-500
-400
-300
-200
-100
0
NiO
TiO
Ti2O3
Ti3O5
TiO2
Temperature (K)
Sta
nd
ard
Gib
bs
Fre
e E
ner
gy o
f
Fo
rmat
ion (
kJ/
mo
l)NiO
TiO
Ti2O3
Ti3O5
TiO2

13
layer on the surface of the Nitinol was parabolic with an activation energy of 203 kJ/mol.
However, in the temperature range of 400 to 600oC the oxide layer thickness fits a
logarithmic growth rate, for which the activation energy value is 22 kJ/mol. This change
in the surface oxidation behavior of Nitinol has also been reported by others [18]. At
oxidation temperatures below 500oC an inward growth of the TiO2 on the surface of
Nitinol has been reported.
When oxidized at 400oC for 30 min TiO2 formed, based on the diffusion of the
oxygen into the surface of Nitinol. This conclusion was based on the observation that
there was practically no change in the Ti/Ni ratio after oxidation. If the titanium had
diffused out toward the surface, then the Ti/Ni ratio would have changed, with the
titanium concentration being greater than what was started with. In contrast, at higher
oxidation temperatures, like 500 and 600oC, the nickel content in the TiO2 dropped
significantly. This was interpreted as evidence of the outward diffusion of titanium
toward the surface/atmosphere interface.
As shown in Figure 5, at low oxidation temperatures like 400oC where only
inward diffusion of oxygen occurs (not outward titanium diffusion), oxygen can diffuse
into the surface of the Nitinol, react with titanium and form TiO2. Insufficient amounts
of oxygen can lead to the formation of other titanium oxides like TiO, Ti2O3 and Ti3O5 in
the inner layers; nevertheless, the nickel from the Nitinol is still present in the TiO2 layer.
When in contact with oxygen where there is no titanium available, nickel can oxidize and
form NiO and other oxides such as NiTiO3 [23]. Some elemental nickel can be expected
to be present in the oxide layer. At higher oxidation temperatures such as 600oC,

14
titanium diffuses toward the outermost surface, reacts with oxygen and forms TiO2. As
shown in Figure 6, under the TiO2 layer a nickel rich zone forms. The dominant phase in
this zone is reported as being Ni3Ti [22-24]. Also, at oxidation temperature above 600oC
nickel was present on the outermost surface and in the TiO2 layer in the form of particles
of Ni and NiO [19, 20, 22]. These particles most probably are formed during the outward
diffusion of titanium. It is possible that the nickel was trapped on the surface and/or in
the middle of the TiO2 layer. It is also possible that the nickel diffuses into the oxide
layer after completion of the surface oxidation, due to the thermodynamic activity
difference between the nickel in the nickel-rich zone and the nickel in the nickel-free
oxide layer.
Figure 5. Schematic of the oxidation process on the surface of Nitinol at oxidation
temperature < 500oC.

15
Figure 6. Schematic of the oxidation process on the surface of Nitinol oxidation
temperature > 600oC.
The presence of the nickel-rich zone under a thick TiO2 layer can lead to
problems such as high nickel release rates and low corrosion resistance. Titanium
dioxide is brittle and it can break during deformation or fabrication [25]. If the oxide
layer on the surface of the Nitinol breaks, the nickel rich zone will be exposed to the
environment. This phenomenon is considered as a potential cause for nickel ion release.
Also, due to the difference in the electrochemical potential of the TiO2 and the nickel-rich
zone, corrosion may happen. Low corrosion resistance and high nickel ion release rate in
thermally oxidized Nitinol samples is also caused by the presence of voids in the oxide
layer on the surface. Voids and/or pores were detected close to the oxide-metal interface
with the suggestion that these voids and pores are created due to the Kirkendall effect

16
[24]. Many studies were performed on the surface modification of the Nitinol with
thermal oxidation, and some of them are described in more detail in this review. In most
of the thermal oxidation processes, the shape setting process conditions were mimicked.
The oxidation of the Nitinol specimens was performed in the temperature range of 400oC
to 600oC, for different lengths of time.
In 2002 Firstov et al. [23] studied the effect of the oxidation temperature on
Nitinol, using 1.5 mm x 1.5 mm x 5 mm samples, which were polished with emery paper
to a mirror surface. The samples were first ultrasonically cleaned in DI water and ethanol
and then isothermally oxidized at several temperatures between 300oC to 800
oC for 30
min, with 50 ml/min air flow. To prevent oxidation during heating, an argon flow of 50
ml/min was used. The samples were studied with SEM, XRD, XPS, Raman spectroscopy
and thermogravimetry. Samples oxidized at temperatures below 500oC had a smooth
oxide (TiO2) layer. Oxidization at temperatures above 600oC resulted in a rough final
surface for the oxide (TiO2). Using an XPS depth profile, Firstov found that the oxide
layer thickness increased with the increase of the oxidation temperature. Firstov used
changes in sputtering time versus concentration to obtain the depth profile. The
concentration of the oxygen dropped to ½ of its maximum value after approximately
3,000 s of ion etch for the specimen oxidized at 500oC for 30 min, but it took about
13,000 s for the ion etching to reach this region for the specimen oxidized at 600oC for 30
min.
Firstov et al. did not clarify their sample size and number of runs for each
condition. The temperature gap between processes was 100oC and for a wide range of

17
temperatures (300oC to 800
oC) it is a good choice. Thermogravimetry results indicated
that the oxidation rate increased with an increase in oxidation temperature, but isothermal
data was presented only for oxidation at 300oC and 800
oC. The XPS depth profile was
presented in terms of sputtering time versus concentration and the interpretation for the
actual depths was not presented.
Michiardi et al. [26] studied the effects of different oxidizing methods on the
nickel concentration on the surface, as well as nickel ion release. Michiardi investigated
the effects of oxidizing of Nitinol’s surface at 400oC, with an air pressure of 3 x 10
-2
mbar for 150 min. The samples were 8 mm diameter and 2 mm thick discs. Specimens
were annealed and mechanically polished with 1 µm alumina to a mirror-like surface.
On the surface of the heat treated sample there was no metallic nickel present. X-
ray photoelectron spectroscopy detected approximately 2% (at.%) of Ni2+
on the surface
of the heat treated sample. Michiardi did not report the type of nickel oxide that was
present on the surface of the heat treated sample. The Ti/Ni ratio, obtained from the XPS,
was 14. For the mechanically polished sample the Ti/Ni ratio was one. Metallic nickel
was observed on the mechanically polished sample. For the oxidized sample 100% of the
titanium on the surface was TiO2 (Ti4+
). At a depth of 6 nm from the surface 63% of the
titanium was Ti3+
and the rest was Ti4+
. Argon ion beam with a 4 keV energy source was
used for the purpose of sputtering the surface. A standard TiO2 sample was used to
calibrate the instrument. There were no clear data for nickel and its oxides on the surface.
Leaching tests showed that the oxidation process decreased the amount of nickel released
from the surface of the Nitinol from 100 ng/cm2 for the mechanically polished specimen

18
to 32 ng/cm2 after 30 days of exposure to simulated body fluid. During the first hour
nickel release from the thermally oxidized sample was 27% of the nickel release from the
mechanically polished sample. The nickel ion release test was performed in simulated
body fluid (SBF) [26]. Michiardi did not investigate heat treatments at other
temperatures and different times. It was not clarified why 400oC was chosen for
oxidation of Nitinol.
To activate the shape memory property of Nitinol, the part needs to be “Shape-Set”
using a mandrel, at moderate temperatures of approximately 500oC for 10 min. Vojtech
et al. [27] studied the effects of surface oxidation under similar conditions. The surface
oxidizing process was performed on 0.2 mm diameter Nitinol wires which were
chemically etched in a solution of 30 ml HF (30 ml), HCl (20 ml), HNO3 (20 ml) and
H2O (100 ml) for 30 min to remove surface impurities from previous processes, then
washed with DI water and dried. The samples were then oxidized at 480oC and 530
oC
for 10 min. This group of researchers also performed a similar process at 530oC, 580
oC,
600oC and 650
oC for up to 240 min in air [27]. The oxidation of the Nitinol surface as a
result of cyclic heat treatment was also studied. For the cyclic oxidation and isothermal
oxidation the heating and cooling rate was 250oC /min. The cyclic oxidized specimens
were held at the dwell temperature for 30 min and then cooled down to room temperature.
The second cycle was 210 min at dwell temperature before cooling the specimens down
to room temperature. Cyclic oxidation did not lead to a big difference in oxidation
kinetics compared to isothermal oxidation and after 240 min of oxidation at 600oC. The
19
oxide layer thickness changed from 1.2 µm for the isothermally oxidized Nitinol to 1.1
µm for the cyclically oxidized Nitinol.
Plant, Grant and Leach [28] also studied the effects of oxidizing the surface at
300oC, 400
oC and 600
oC, for 30 min. The atmosphere of the oxidization furnace was air
at one atmosphere pressure. The surface of the oxidized specimen was mainly TiO2.
However, on the surface of the specimens oxidized at 300oC and 400
oC for 30 min minor
amounts of elemental Ti, Ni and NiO were detected, based on XPS analysis, but the
surface of the specimen oxidized at 600oC for 30 min was nickel-free and all of the
titanium was oxidized. The authors state that at the oxidation temperature of 600oC
titanium diffuses from the bulk toward the outermost surface, but at 300oC and 400
oC
there is only inward diffusion of oxygen. As a result there was a nickel-free TiO2 oxide
layer observed on the surface of the specimen oxidized at 600oC for 30 min, but on the
surface of the specimens oxidized at 300oC and 400
oC there was some nickel detected.
Zhu et al. [24] investigated the oxidation process using a wider range of time and
temperature. Three millimeter diameter Nitinol wire samples were annealed at 1000oC
for thirty min. The atmosphere of the annealing process was not indicated. Then the
oxide layer was removed by polishing. The details of the polishing procedure were not
reported. After mechanical polishing, the specimens were electropolished, but there is no
detailed description about the electropolishing process. The heat treatment was
performed in air. Heat treatment temperatures were 400oC to 1000
oC in 100
oC
increments. The heat treatment times were 3, 10, 30, 100 and 300 min. Using AES, the
oxide layer thickness was measured, which was the distance from the surface to the depth

20
at which the oxygen concentration drops to one half of its maximum value. Several voids
were observed inside the oxide layer. These voids increased in size and/or quantity with
increase in oxidation temperature and/or time, implying that a thicker oxide layer is more
porous.
In all of the studies reviewed above, thermal oxidation formed a titanium oxide
layer on the surface, with TiO2 being the dominant phase. However, in some cases minor
amounts of nickel was detected in the oxide layer in either elemental and/or oxide forms.
Nickel release from the surface of the Nitinol decreased after thermal oxidation, and it
was lower than that for mechanically polished specimens, but it was still observed. To
obtain complete nickel depletion in the oxide layer, different oxidation atmospheres have
been studied. These studies were based on thermodynamic reasoning and selective
oxidation of titanium, with the expectation that nickel can thus be removed.
Hassel et al. [29] studied the effects of thermal oxidation at 600oC to 800
oC in a
mixture of argon and HCl vapor. The partial pressure of the HCl was 7.5 x 10⁻³
atmospheres. Impurities in the gas were used as the source of the oxygen. After
mechanically polishing and cleaning the specimens, thermal oxidation was carried out in
the HCl and Ar mixture. It was claimed that the presence of chlorine in the atmosphere
forms NiCl2, and by evaporation of NiCl2 the oxide layer would be nickel depleted. Due
to the lower standard Gibbs free energy of formation, TiCl4 is more stable than NiCl2.
For example, the standard Gibbs free energy of formation of NiCl2 at 298 K is -259
kJ/mol which is higher than -736 kJ/mol for TiCl4. However, since TiO2 is more stable
than TiCl4, there will be no titanium available to form TiCl4, and the chlorine will be

21
consumed to form NiCl2. The standard Gibbs free energy of formation of NiCl2 is lower
than that for NiO; for example, at room temperature the standard Gibbs free energy of
formation of NiCl2 is -260 kJ/mol which is lower than -212 kJ/mol for NiO. Therefore,
the formation of NiO would not be favored due to the lower standard Gibbs free energy
of formation of NiCl2 compared to that for NiO. Based on this theory, TiO2 can form on
the surface of Nitinol, and nickel will be depleted from the oxide layer by evaporation of
NiCl2. However, Hassel et al. [29] did not provide evidence of the presence of a nickel-
free TiO2 layer on the surface. Also, nickel leaching tests were not performed to prove
the depletion of nickel on the surface.
Another thermodynamics-based selective oxidation study was reported by
Hessing et al. [21]. In this research, thermal oxidation was performed at 600oC in an
environment where the oxygen partial pressure was below 3.58 x 10⁻³³
atmosphere. At
600oC and oxygen partial pressures below 6.61 x 10
-20 atmosphere nickel oxide is not
stable. Under this condition the Gibbs free energy of formation of NiO is not negative.
With a decrease in the oxygen partial pressure the thermodynamic activity of oxygen
decreases, resulting in the Gibbs free energy of formation of NiO increasing to zero. For
example, at 600oC the Gibbs free energy of formation of nickel oxide increases from -159
kJ/mol at an oxygen partial pressure of 1 atmosphere to zero at an oxygen partial pressure
of 3.58 x 10⁻³³
atmosphere. However, the Gibbs free energy of formation of TiO2 is
negative at an oxygen partial pressure of 3.58 x 10⁻³³
, and titanium in contact with
oxygen can form TiO2. To reach very low partial pressure values for oxygen, water was
used as the oxygen source. The partial pressure of the water vapor was kept below 2.6 x

22
10-6
atmosphere by passing the N2 gas with 3 ppm water through an alumosilicate
molecular sieve. The partial pressure of the water was calculated from the dew point* of
the gas mixture, which was 203 K. The dissociation constant of water at 600oC is 1.37 x
10-24
atmosphere. From the partial pressure of water and dissociation constant of water
the oxygen partial pressure was calculated as 3.58 x 10⁻³³
atmosphere. The oxidation
time was one min. From the XPS analysis data the Ti/Ni ratio was measured. After the
selective oxidation, the Ti/Ni ratio on the surface increased from 16 for the specimen
oxidized in dry air at 600oC to 320. An XPS spectrum from the surface of the selectively
oxidized Nitinol specimen showed a 7.5 nm thick TiO2 layer. This oxide layer was
nickel-free. Also, the selectively oxidized specimen had the lowest nickel ion release
compared to thermally oxidized, mechanically polished and electropolished samples.
With low oxygen partial pressure at 600oC, Hessing et al. were able to form a nickel-free
oxide layer on the surface [21].
Neelakantan et al. [30] performed thermal oxidation in a low oxygen partial
pressure in a reducing environment. The oxidizing gas was a mixture of 10% H2 + 90%
N2. The partial pressure of the oxygen was 1 x 10-41.9
atmosphere at 600oC and 1 x 10
-31.5
atmosphere at 800oC. The extremely low oxygen partial pressure was reached by an
approach similar to that used by Hessing et al. [21]. The heat treatment was performed at
600oC and 800
oC for 5 min. The oxygen partial pressure was controlled by using water
vapor as the source of the oxygen. The samples were 10 mm diameter and 2 mm thick
discs. They were mechanically polished, rinsed in DI water, ultrasonically cleaned in
* Dew point is the temperature at which water vapor in a humid gas will condense to
water.

23
ethanol, and dried. The specimens were heated to 600oC and 800
oC in the reducing
atmosphere. The heating and cooling rates were 300oC per min. X-ray photoelectron
spectroscopy and SEM were employed to analyze the surface. An XPS depth profile was
collected by Ar+ sputtering. The sputter rate was calibrated using a standard silicon
wafer with a known oxide layer thickness. X-ray photoelectron spectroscopy data
indicated the presence of TiO2 on the surface of the sample heat treated at 600oC.
Titanium nitride was detected on the surface of the specimen heat treated at 800oC for 5
min. It was claimed that the TiN formation on the surface of Nitinol was due to the
TiN’s lower Gibbs free energy of formation compared to TiO2 at the low oxygen partial
pressure. On the surface of the sample heat treated at 800oC, TiN was the dominant
compound. According to the XPS data the TiN layer on the surface was nickel-free.
Also, after treatment at 600oC for five min, the TiO2 layer on the surface of Nitinol was
also nickel-free. In this research the number of samples was not clarified and only two
runs were performed on Nitinol. There were no transverse section images to show if the
layer on the surface was porous or not. The thickness of the TiN layer on Nitinol’s
surface was 175 nm, but there was no depth profile showing it.
Nickel removal during surface oxidation processes can potentially form a nickel-
free oxide layer on the surface. However, nickel ion release has been reported from the
surface of the thermally oxidized Nitinol.

24
2.4 Aqueous-based Surface Treatment
Different surface treatment techniques in aqueous solutions were also studied as a
means to provide a corrosion resistant and nickel-free oxide layer on the surface. Some
of them were as simple as boiling in DI water. In these methods water was considered as
the source of oxygen and the temperature was higher than room temperature. One
advantage of these methods is simultaneous nickel removal. Since the nickel ion release
rate increases with temperature, some nickel can be expected to be removed from the
surface during the surface oxidation. Oxidation of titanium and the nickel removal rate
increase during chemical etching. Some etchants, such as HF and HNO3 aqueous
solutions, have the potential to oxidize the titanium on the surface and simultaneously
remove the nickel atoms from the surface. In some studies chemical etching was
introduced as chemical polishing and passivation. Some electrochemical methods like
electropolishing have also been employed to provide a smooth and homogenous surface
on Nitinol. After the completion of passivation, there should be no elemental titanium
and/or nickel present on the surface of the Nitinol.
Michiardi et al. [26] investigated the effects of boiling Nitinol in water. Nitinol
specimens were polished with SiC paper and alumina to a mirror surface (1µm finish).
Then they were ultrasonically cleaned in DI water, IPA and acetone followed by surface
treatment in boiling water for 30 min. X-ray photoelectron spectroscopy data showed a
three nanometer thick oxide layer on the surface. The Ti/Ni ratio was 4.0. The nickel
concentration on the surface was lower than that for mechanically polished specimens.
Michiardi et al. also studied the effect of autoclaving at 121oC for 30 min. The humidity

25
and the pressure of the autoclave were not specified. The titanium on the surface was
present in the form of Ti2O3. The oxide layer thickness was 2.4 nm, and the Ti/Ni ratio
was 1.6, which was low compared to chemically etched specimens.
Chemical etching in HF + HNO3 has also been studied and in some cases has
been considered as a specimen preparation method prior to other surface treatment
methods, like boiling in water, thermal oxidation, and electropolishing [11, 20, 25, 31].
To remove defects from the surface the chemical etch solution was 10% HF + 40%
HNO3 + 50% H2O, for 30 min. It also removes the nickel from the surface and oxidizes
the titanium on the surface, at room temperature. Nickel removal was proved by the
color of the etchant changing to green. Also, some carbon removal and cleaning of the
surface was reported. The presence of 4% [26], 6% [32], 9% [21] and 11% [15] nickel
on the surface of the chemically etched Nitinol was reported; these values decreased to
0.4% after boiling in water for 30 min and 1.3% after steam autoclaving for 2 h [31]. The
high roughness on the surface is caused by material removal from the surface during
chemical etching. Selective oxidation of titanium and removal of nickel forms a
disordered oxide layer on the surface. A rough surface on the chemically etched Nitinol
can result in low corrosion resistance and high nickel release. To form a smooth surface,
electropolishing has been studied.
Electropolishing is the dominant treatment to modify the surface of Nitinol. This
technique also has been used to treat other metallic biomaterials like stainless steel 316
and cobalt-chromium alloys [32, 33]. Different electrolytes, times, temperatures, and DC
voltages have been used. These are summarized in Table 1.

26
Electropolishing with 4.7% acetic acid and 95.3% perchloric acid at room
temperature for 2 min and 15 s with a 30 volts DC potential formed a 6 nm thick oxide
layer on the surface of mechanically polished Nitinol. The Ti/Ni ratio was 12.3 which
was higher than the Ti/Ni ratio for the water boiled Nitinol specimen (4) and the
autoclaved Nitinol (1.6), and it was lower than that for Nitinol thermally oxidized at
400oC in air (14) [26].
Table 1. Electropolishing parameters.
Method
# Electrolyte
Electropolishing
Time (min)
Electropolishing
Temperature
(C)
DC
Voltage
(V)
Reference
1 10% Perchloric
Acid +
90% Acetic Acid 6
Room
Temperature 20 [11, 25]
2 70% Methanol +
30% Nitric Acid 6 -45 20 [11]
3
4.7% Acetic Acid
+
95.3% Perchloric
Acid
2.25 Room
Temperature 30 [26]
Electropolishing at room temperature in 10% perchloric acid + 90% acetic acid
for 6 min resulted in a smooth surface on a Nitinol specimen, which was in its austenite
phase; however, electropolishing at -45oC in methanol and nitric acid solution formed a
surface with a higher roughness. The Nitinol specimen was in its martensite phase during
the electropolishing process, but transformed to austenite at room temperature, and this
increased the roughness on the surface [11]. The nickel concentration was 2.5% (at.%)
27
on the outer surface of the Nitinol electropolished in 10% perchloric acid + 90% acetic
acid. This value was lower than that for mechanically polished Nitinol (3%) and Nitinol
heat treated at 520oC for 15 min in air (8.2%). Also, the Ti/Ni ratio was 6 on the outer
surface of the electropolished specimen, higher than that for mechanically polished
Nitinol (3.4) and Nitinol heat treated at 520oC for 15 min in air (2.2).
2.5 Summary of Oxidation
Different oxidation methods and their effects on the surface of the Nitinol are
based on the high thermodynamic stability of the TiO2. The nickel concentration on the
surface, the TiO2 layer thickness and its chemical composition, the surface roughness and
presence of voids and pores are the properties of the surface of Nitinol which are of
interest. Nickel ion release in biological solutions, and the presence of nickel in oxide
and elemental form on the surface of the Nitinol is of particular interest. By using
different surface treatment techniques, the properties of the oxide layer on the surface of
the Nitinol can be changed.
In all of these studies, the main purpose was to form a nickel-free TiO2 layer on
the surface. For thermal oxidation all reviewed articles agreed that the oxide layer
thickness on Nitinol increases with oxidation time and/or temperature, but the thickness
was more dependent on the oxidation temperature rather than time. At oxidation
temperatures over 500oC, the oxide layer’s roughness increased. The oxide layer’s
porosity, detected by SEM images from the transverse section of specimens, also
increased in this temperature range. At lower temperatures the oxide layer had a

28
smoother surface compared to Nitinol oxidized at temperatures over 500oC. X-ray
photoelectron spectroscopy and AES depth profiles showed that the oxide layer was
relatively thin and the nickel concentration, close to the surface, was relatively high.
Also, Neelakantan et al. [30] proved that with heat treatment at 800oC for 5 min in a
nitrogen-containing reducing atmosphere, a TiN layer formed on the surface of the
Nitinol. Thermodynamically, nickel oxide is less stable than TiO2, but it can exist, and
its presence on the surface of the oxidized Nitinol has been reported.
2.6 Surface Nitriding of Nitinol
Because nickel cannot form a nitride compound, nitriding is another possible
surface treatment method that removes the nickel from the surface. It is a promising
surface treatment method to form a protective and wear resistant TiN layer on the surface
of Nitinol. An advantage of nitriding is the formation of a nickel depleted surface.
Thermodynamically nickel does not form a nitride [6]. Therefore, the formation of a TiN
that is nickel-free can be expected.
As shown in Figure 7, over the temperature range of 298 K (25oC) to 1773 K
(1500oC) TiN is thermodynamically stable due to its negative standard Gibbs free energy
of formation [6]. Values for the standard Gibbs free energy of formation are applicable
when pure titanium is exposed to nitrogen at one atmosphere partial pressure, but there
are various factors that can affect the reaction conditions. Only 50% of Nitinol is
titanium and the remaining is nickel, so the thermodynamic activity of titanium is less
than one. According to Equation 1, a decrease in the thermodynamic activity of titanium

29
increases the Gibbs free energy of reaction. However, as shown in Figure 8, the Gibbs
free energy of formation of TiN is negative for titanium activities above 0.00001, in the
temperature range of 400 K (127oC) to 1400 K (1127
oC), and TiN is thermodynamically
stable [6, 34].
Equation 1. [34]
Figure 7. Standard Gibbs free energy of formation of TiN as a function of temperature
[6].
A problem associated with the nitriding of the titanium in Nitinol is its sensitivity
to the presence of oxygen. Residual oxygen during the process and the presence of an
oxide layer on the surface of Nitinol from specimen preparation can affect the formation
of TiN. To prevent the formation of TiO2, oxygen should be removed from the system.
This means the oxygen partial pressure should be low enough to increase the Gibbs free
energy of formation of TiO2 to values higher than Gibbs free energy for formation of TiN.
-350
-300
-250
-200
-150
-100
-50
0
Sta
ndar
dG
ibbs
Fre
e E
ner
gy o
f
Form
atio
n (k
J/m
ol)
Temperature (K)

30
Figure 8. Gibbs free energy of formation of TiN as the function of titanium activity at
different temperatures [6].
Surface nitriding of Nitinol has been reported by various investigators. The
source of the nitrogen varied from pure N2 [35, 36] to a partially reducing atmosphere
consisting of 90% N2 and 10% H2 [29], or nitrogen in a monoatomic state, formed by
Powder Immersion Reaction Assisted Coating (PIRAC nitriding) [37-39]. Plasma Gas
Nitriding (PGN) is another method that has been used to form TiN on the surface of the
Nitinol [40, 41]. An important factor about the nitrogen source is the concentration of the
monoatomic nitrogen content.
Neelakantan et al. [30] has reported the formation a nickel-free TiN layer on the
surface of Nitinol after annealing at 800oC for 300 s, with an atmosphere of N2+10%
H2,as discussed in Section 2.4.
-350
-300
-250
-200
-150
-100
-50
0
0 0.2 0.4 0.6 0.8 1 1.2
T=400 K
T=600 K
T=800 K
T=1000 K
T=1200 K
T=1400 K
Thermodynamic Activity
Gib
bs
Fre
e E
ner
gy o
f F
orm
atio
n
(kJ/
mol)

31
Surface nitriding of Nitinol in an atmosphere of pure nitrogen has also been
reported. Gil et al. [35, 36] investigated the effects of nitriding time and temperature,
using Nitinol wires. The Nitinol samples were introduced into a tubular furnace having a
pure nitrogen environment. It was not clear if there was any surface treatment performed
on the wires before heat treatment. The samples were heat treated at 800oC, 900
oC and
1000oC for 5, 7, 10, 15, 20, 25, and 30 min. Leaching tests in artificial saliva were then
performed at 37oC. Nickel release was found to decrease after nitriding the sample.
After the initial release of nickel, which was approximately 60 ppb, no nickel release was
observed for up to 200 h. X-ray diffraction was performed, but no data were presented,
so there were no data for the composition of the surface. A nanohardness test was
performed on the Nitinol wires with a 1 gram load for 15 s. The procedure explaining
how the nanohardness test was performed on wires was not reported. The hardness
increased with increase of the TiN layer thickness. In this research Gil et al. used Nitinol
with a composition of 56% nickel and 44% titanium. According to the Ni-Ti phase
diagram there will be some nickel rich zones present in the bulk [42]. This high nickel
concentration changes some properties such as the austenite and martensite start and
finish temperatures. Nickel release would be higher in this combination compared to
other combinations of nickel and titanium with lower nickel concentrations. Pure
nitrogen, which is primarily N2, was used. Since the N-N bond in N2 is very strong, the
probability of the presence of atomic nitrogen on the surface of the Nitinol is relatively
low.

32
To increase the amount on monoatomic nitrogen on the surface of Nitinol,
different methods have been studied. Powder Immersion Reaction Assisted Coating
(PIRAC) was used to provide nitrogen in the monoatomic form. In this method, nitrogen
atoms were supplied from unstable nitride powders or by selective diffusion of the
atmospheric nitrogen through a high chromium stainless steel foil. During the diffusion
of air through the foil oxygen atoms will form chromium oxide. However, nitrogen in
the monoatomic form will diffuse throughout the stainless steel foil without reacting with
chromium, nickel and/or iron. Nitinol specimens were thermally nitrided, in contact with
monoatomic nitrogen, at temperatures of 850oC to 1100
oC for up to 24 h.
Starosvetsky and Gotman [37, 38] performed the PIRAC nitriding at 850oC to
1100oC on mechanically polished and cleaned Nitinol coupons. The method of providing
the monoatomic nitrogen was the selective diffusion of atmospheric nitrogen. Nitinol
specimens were placed in sealed containers which were made of high chromium stainless
steel foils. The presence of TiN was detected by the golden color of the surface of the
specimen as well as by XRD. Also, a titanium-rich layer under the TiN layer was
detected by XRD. The dominant phase in this layer was NiTi2. The presence of the
NiTi2 layer, under the TiN layer has been reported elsewhere as well [30]. The thickness
of the TiN layer on the surface was measured by SEM images of the transverse section of
specimens. The thickness of the nitride layer varied from 0.1 µm for specimens nitrided
at 900oC for 30 min to 5 µm for those nitrided at 1050
oC for 24 h. There were no data
about the nickel concentration in the TiN layer, but Zorn et al. [39] performed a similar
process and using XPS detected no nickel on the TiN layer.

33
Another method of creating a TiN layer on Nitinol’s surface is plasma gas
nitriding (PGN). A laser beam melts the surface in a nitrogen environment, and TiN
forms on the surface. The factors that affect the properties of the TiN layer include the
nitrogen gas purity and flow rate inside the chamber, the width of the laser pulses,
voltage, frequency, and laser scanning speed.
Cui et al. [40] investigated the effects of PGN on the properties of the TiN layer
formed on Nitinol. Nitinol samples were mechanically polished and rinsed with DI water.
The laser parameters were 500 W, 2 mm beam diameter, 5 mm/s for scanning speed and
50% overlap in width. The nitrogen flow rate in the chamber was not specified. A nickel
ion release test was performed in Hank’s solution at 37oC. The surface characteristics
were investigated using SEM, XRD and XPS. After the PGN process the nickel release
for the first day was reduced from 3.6 µg day-1
cm-2
for the mechanically polished
specimen to 1 µg day-1
cm-2
. The effects of nitrogen gas flow were investigated by Zhao
et al. [41]. The laser parameters were similar to the research by Cui et al. [40]. The
molten line’s overlap after each pass changed from 50% to 25%. Nitrogen gas with 99.9%
purity flowed during the PGN was at 10, 30, and 40 L per min. Using nanohardness tests,
the TiN layer thickness on the surface of Nitinol specimens was estimated. The
nanohardness increased with increase in nitrogen gas flow. This was interpreted as being
evidence of an increase in the TiN layer thickness. However, with an increase in the
nitrogen gas flow from 10 to 40 L per min TiO2 was detected by XRD, as the TiO2 peaks
became larger. This was caused by the presence of oxygen as an impurity in the nitrogen.

34
2.7 Summary of Nitriding
Surface nitriding of the Nitinol forms a protective and wear resistant TiN layer.
Titanium nitride is the only phase in this layer and there were no data indicating the
presence of other phases on the surface; so surface nitriding formed a nickel-free TiN
layer on the surface. However, TiN is very brittle and breaks if it is deformed.
Formation of cracks on the surface of the nitrided Nitinol can lead to the exposure of the
inner layers to the environment. This exposure can potentially cause nickel ion release.
Also, in contact with oxygen, titanium from the inner layers forms TiO2. More
investigations are required on the corrosion and nickel release behaviors of surface
nitrided Nitinol after deformation.
2.8 Summary of Literature Review
In contact with oxygen, a TiO2 layer can form on the surface of Nitinol. This
phenomenon can happen even at room temperature. With different surface treatment
techniques, the oxide layer’s properties like thickness, chemical composition, porosity
and roughness change. In the research reviewed the effects of different surface treatment
methods on the properties of the Nitinol’s surface were investigated.
Mechanical polishing was generally used to remove the oxide layers from the
surface of the Nitinol. This method was used to prepare a base-case to be compared with
other Nitinol specimens which are surface treated with other methods. However, due to
high nickel release and low corrosion resistance, mechanical polishing cannot be used as
the only surface treatment method for the Nitinol used in implantable devices. However,
35
mechanical polishing can be used as a surface preparation method for other surface
treatments.
All articles related to thermal oxidation agreed that the oxide layer thickness on
Nitinol increases with oxidation time and/or temperature, and it is more sensitive to the
oxidation temperature than time. At oxidation temperatures over 500oC the oxide layer’s
roughness increased, and a nickel-rich zone with Ni3Ti as the dominant phase formed
under the TiO2 layer. Also, some nickel was detected in the oxide and/or elemental
forms at the TiO2/atmosphere interface. With the presence of cracks on the surface of the
thermally oxidized Nitinol, the nickel-rich zone will be exposed to the environment and
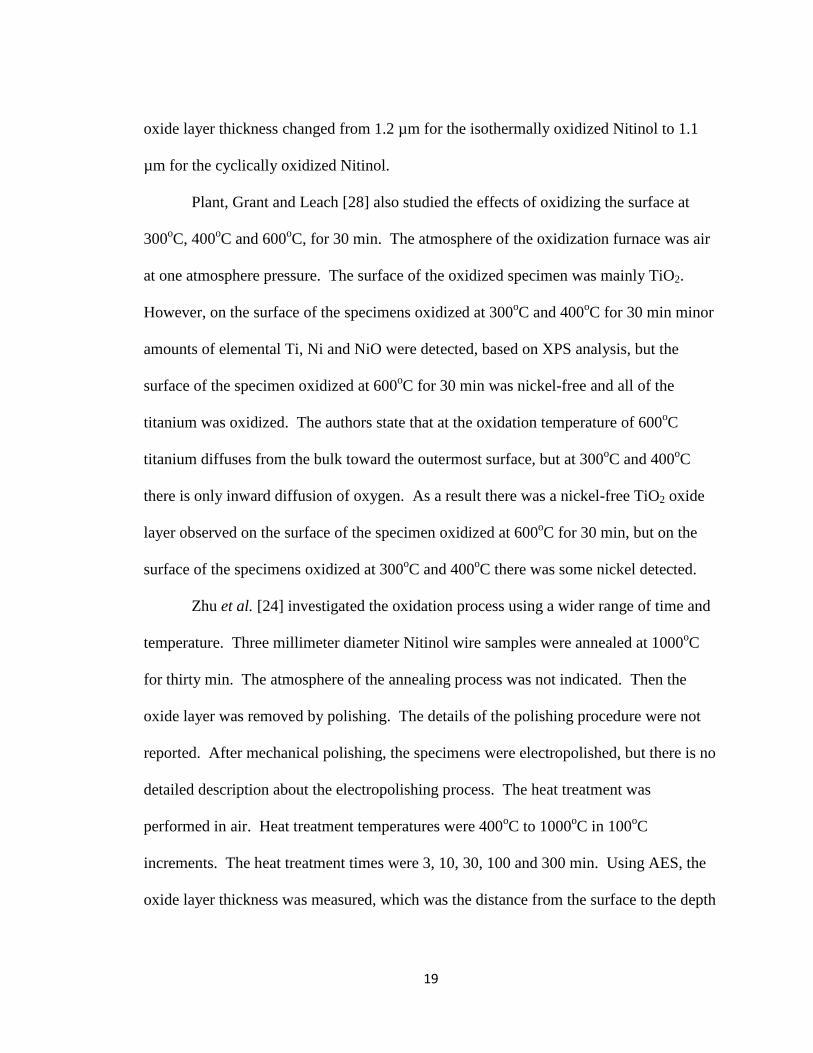
can lead to nickel ion release. At oxidation temperatures lower than 500oC, a relatively
smooth surface was reported, but the thickness of the oxide layer was significantly lower
than that for specimens oxidized at high temperatures. The oxide layer’s pores and size
and quantity of voids also increased at oxidation temperatures higher than 600oC, and
nickel content in the oxide layer was reported. Selective thermal oxidation methods lead
to very low nickel ion release.
Surface nitriding formed a protective and wear resistant TiN layer on the surface
of Nitinol. Formation of a NiTi2 layer under the TiN layer after thermal nitriding was
reported. Titanium nitride is corrosion resistant and very hard, but it is very brittle and
will break if subjected to deformation. The breakage of TiN potentially leads to nickel
release and decrease in the corrosion resistance, which is not desirable.

36
CHAPTER THREE
RESEARCH HYPOTHESIS AND OBJECTIVES
The hypothesis for this study is that thermal oxidation subsequent to nitriding the
surface of Nitinol can result in a TiO2 layer that is free of nickel. This hypothesis is
based on the fact that nickel does not form a nitride. As such, when nitrided, only the
titanium on the surface of the Nitinol will form TiN; this is expected to be nickel-free.
Subsequent oxidation of the nickel-free TiN layer is expected to result in a TiO2 layer
that is also nickel-free.
The overall objective of this research was to determine if surface nitriding,
followed by oxidation, can result in a nickel-free oxide layer on the surface. The specific
objectives of this research were:
Study the oxidation of the Nitinol as a function of time and temperature.
Study the nitriding of Nitinol in N2, 96% N2 + 4% H2, and 95% N2 + 5% NH3 as a
function of time and temperature.
Study the nitriding followed by oxidation of Nitinol as a function of time and
temperature.
Thermodynamically, TiN formation from the titanium on the surface of Nitinol
and nitrogen is spontaneous. Nickel nitride is not stable and there is no driving force for
nickel to diffuse toward the surface. Therefore, the surface of the nitrided Nitinol will be
nickel depleted TiN. Since TiO2 is thermodynamically more stable than TiN, TiN will
oxidize when in contact with oxygen, and form TiO2. By forming a nickel-free TiN layer

37
on the surface of the Nitinol as a precursor for TiO2, the surface of the Nitinol will be
nickel-free. Since TiN is being used as the precursor and oxidized right after formation,
the mechanical properties and issues associated with brittleness of TiN are not of concern.

38
CHAPTER FOUR
MATERIALS AND METHODS
An overview of the experimental conditions and processes is shown in Figure 9.
Specimens were cut from a 1.5 mm thick Nitinol sheet having a composition of 50.8% Ni
+ 49.2% Ti (at.%). The specimens were mechanically polished to a mirror-like finish.
The specimens were then washed and dried.
After surface preparation the specimens were nitrided in pure N2, 96% N2 + 4%
H2, and 95% N2 + 5% NH3. The golden color of specimens was considered as initial
evidence for the presence of TiN on the surface. The surface properties were studied
using Glancing Incidence X-ray Diffraction (GI-XRD) and X-ray Photoelectron
Spectroscopy (XPS). The thickness of the nitride layer was measured from Scanning
Electron Microscopy (SEM) images of transverse sections of specimens. One group of
specimens was oxidized at 600 - 700
oC for 30 - 60 min. This group was considered to be
the base-case and the chemical composition of the surface of these specimens was
compared with the surface of nitrided and oxidized specimens. Nitriding was followed
by oxidation under two conditions, namely nitriding in 96% N2 + 4% H2 at 1000oC for 20
min followed by oxidation in air at 700oC for 60 min and nitriding in 95% N2 + 5% NH3
at 675oC for 5 min followed by oxidation in air at 675
oC for 30 min.
Analytical methods, namely XPS, XRD, and SEM were used to analyze the nickel
concentration, elemental depth profiles, the nitride and oxide layer thickness, and
oxidation state of the elements on the surface.

39
Nitrid
ed
Sp
ecim
en
sO
xid
ize
d
Sp
ecim
en
s
in A
ir
Nitrid
ed
an
d O
xid
ize
d
Sp
ecim
en
sU
ntr
ea
ted
Sp
ecim
en
s
NiT
i S
pe
cim
en
s
80
0oC
90
0oC
10
00
oC
30
min
ute
s
20
min
ute
s
30
min
ute
s
10
min
ute
s
20
min
ute
s
30
min
ute
s
Wa
sh
ed
with
De
ae
rate
d D
I
Wa
ter,
Arg
on
Drie
d
Wa
sh
ed
with
DI
Wa
ter ,
Air D
rie
d
In
Nitro
ge
n +
4%
Hyd
rog
en
50
0oC
30
min
ute
s
67
5oC
70
0oC
60
min
ute
s
30
min
ute
s
Ch
em
ica
lly
etc
he
d in
Kro
ll
so
lutio
n fo
r 4
min
ute
s
67
5oC
5
min
ute
s5
min
ute
s
10
min
ute
s
In
Nitro
ge
n +
5%
Am
mo
nia
70
0oC
In p
ure
Nitro
ge
n
45
0oC
Nitrid
ed
in
N2 +
4%
H2 a
t
10
00
oC
fo
r 2
0 M
inu
tes /
Oxid
ize
d in
Air
at
70
0oC
fo
r 6
0
Min
ute
s
Nitrid
ed
in
N2 +
5%
NH
3 a
t
67
5oC
fo
r 5
Min
ute
s /
Oxid
ize
d
in A
ir a
t 6
75
oC
fo
r 3
0 M
inu
tes
60
min
ute
s
60
min
ute
s
At
10
00
oC
fo
r
60
min
ute
s
At 1
10
0oC
fo
r
60
min
ute
s
Fig
ure
9. A
n o
ver
vie
w o
f su
rfac
e tr
eatm
ent
pro
cess
es o
n t
he
Nit
inol
spec
imen
s.

40
4.1 Specimen Preparation
One and half millimeters thick Nitinol sheet with a composition of 50.8% (at.%)
Ni and 49.2% (at.%) Ti was obtained from Nitinol Technology Inc. (Mountain View,
CA). The composition was verified by EDS and is presented in Section 5.1.1.
Specimens (20 x 10 mm) were cut from the sheet. The surface of the specimens was
mechanically ground using 600 grit silicon carbide papers and then polished using 1 µm
Al2O3 paste, followed by 0.3 µm Al2O3 paste to a mirror finish. After polishing, the
specimens were rinsed with DI water, cleaned ultrasonically in deionized (DI) water, and
air-dried.
To study the effects of washing with deaerated DI water and argon on the removal
of the native oxide from the surface of the specimen, one set of specimens was washed
with deaerated DI water and argon dried. Argon with 99.999% purity (grade 5), was
purchased from Praxair Inc. (San Jose, CA) to dry Nitinol specimens. To deaerate the DI
water, argon gas was bubbled through it for 12 h. Another specimen, after mechanical
polishing, was washed with DI water, air dried, and chemically etched in 10% HF + 40%
HNO3 + 50% H2O (Kroll solution) at room temperature for 4 min.
4.2 Tube Furnace and Gas Delivery System Setup
The nitriding and oxidation processes were performed in a Lindberg 55035 tube
furnace with a Mullite tube of inner diameter of 1 inch. The temperature profile along
the tube furnace was measured with an R-type thermocouple in the temperature range of
500 - 1100oC in 100
oC increments. As shown in Figure 10, the temperature at the two
41
ends of the tube was approximately 400oC lower than at the center of the tube. However,
at the middle of the tube (6 inches from two ends), the temperature was similar to the
nominal temperature from the temperature controller. Because the thermocouple
connected to the temperature controller was in the middle of the tube, there was no
difference between the actual temperature in the middle of the tube and the temperature
displayed by the temperature controller.
Figure 10. Temperature profile along the tube furnace at 500oC to 1100
oC.
The tube was sealed, with only one gas inlet and one outlet. For accurate control
of the temperature an R-type thermocouple was placed above the specimen. Figure 11 is
a schematic diagram of the transverse section of the tube with fittings made of Teflon on
both ends, a thermocouple in the middle, and a Nitinol specimen inside. The specimen
was seated on a quartz boat in the middle of the tube. A schematic and an image of the
specimen on a quartz boat in the tube are shown in Figure 12 and 13.

42
Figure 11. Schematic of the tube with fittings and thermocouple.
Figure 12. Schematic of Nitinol specimen on quartz boat in tube furnace.
Figure 13. Image of Nitinol specimen on quartz boat in tube furnace.

43
Oxidation was performed in dry air. Air was flowed into the tube furnace by an
Elite 802 aquarium pump. The flow rates of argon, air, a 96% N2 + 4% H2 mix and a 95%
N2 + 5% NH3 mix were nominally one L per min. All processes with ammonia were
performed under a laboratory fume hood, with a ¼ inch Teflon tube used for gas delivery.
All connections, valves and fittings were made of stainless steel 316 for the ammonia
experiments.
To remove residual moisture from argon, nitrogen, 96% N2 + 4% H2, and air a
moisture trap was purchased from Agilent Technologies (Santa Clara, CA).
Specifications of the moisture trap are listed below:
Removal capacity: 130 g H2O
Performance: 5 ppb
Not refillable
An oxygen trap for removal of residual oxygen in the argon, nitrogen, and 96%
N2 + 4% H2 was also purchased from Agilent Technologies Incorporated and had the
following specifications:
Removal capacity: 2400 mg O2
Performance: 1 ppb
Not refillable
Ammonia and nitrogen gas mixture was not passed through any moisture and/or
oxygen trap due to the corrosive nature of ammonia. Figure 14 is a schematic of the gas
delivery system, to the tube furnace, for nitriding with pure nitrogen, 96% N2 + 4% H2
and oxidation with air.

44
VALVE
F
FLOWMETER
GRADE 5 ARGON
MOISTURE
TRAPVALVE
TUBE FURNACE
( WITH NiTi SPECIMENS INSIDE)
VALVEOXYGEN
TRAP
N2 + 4% H2
Valve
F
Flowmeter
MOISTURE
TRAPVALVE
AQUARIUM PUMP
F
FLOWMETERAIR
Figure 14. Schematic of tube furnace and gas delivery system set up for gas nitriding
with pure N2 or 96% N2 + 4% H2, followed by oxidation.
After nitriding with ammonia, the gas was disposed of by bubbling into DI water
in a bubbling flask. The ammonium hydroxide in the bubbling flask was disposed as a
hazardous waste and was replaced with DI water. This procedure was performed after
each nitriding process with ammonia. To prevent the water being sucked back into the
tube furnace due to low pressure during furnace cool-down, an empty and sealed
container was placed between the tube furnace and the bubbling flask. Figure 15 is a
schematic diagram of the gas delivery system to the tube furnace and ammonia gas
disposal.

45
VALVE
F
FLOWMETER
GRADE 5 ARGON
MOISTURE
TRAP
VALVE
TUBE FURNACE
( WITH NiTi SPECIMENS INSIDE)
OXYGEN
TRAP
N2 + 5% NH3
VALVE
F
FLOWMETER
MOISTURE
TRAPVALVE
PUMP
F
FLOWMETERAIR
EMPTY SEALED
CONTAINER TO
PREVENT THE WATER
SUCKTION DURING THE
FURNACE COOL-DOWN
BUBBLER
Figure 15. Schematic diagram of tube furnace and gas delivery system set up for gas
nitriding with a 95% N2 + 5% NH3 mix.
4.3 Nitriding
4.3.1 Nitriding in Pure Nitrogen
Nitinol specimens were heated to 1000oC or 1100
oC for a dwell time of 60 min.
Pure N2 after passing the moisture and oxygen traps was flowed through the tube furnace
at a flow rate of 1 L per min. Grade 5 nitrogen (99.999% purity) was purchased from
Praxair Inc. (San Jose, CA). The heating ramp to the dwell temperature was 50oC/min,
and the specimens were furnace cooled to room temperature after nitriding. During heat-
up and cool-down pure argon was passed through the moisture and oxygen traps and

46
flowed through the tube furnace at a flow rate of 1 L per min. The experimental design
and values for each parameter are represented in Table 2.
Table 2. Experimental design matrix and specimen numbers for specimens nitrided in
pure N2.
Specimen
Number
Nitriding
Temperature (oC)
Nitriding Time
(min)
P-1000-60 1000 60
P-1100-30 1000 60
4.3.2 Nitriding in 96% N2 + 4% H2
Mixture of 96% N2 + 4% H2 was flowed through the tube furnace at 1 L per min
during the high temperature dwell time. Grade 4.8 gas mix of 95% N2 + 4% H2 (99.998%
purity) was purchased from Praxair Inc. (San Jose, CA). During heating and cooling
argon gas was flowed through the tube furnace. The heating ramp rate was 50oC/min.
Gas nitriding was performed at 800oC, 900
oC, and 1000
oC for dwell times of 10, 20, and
30 min, followed by furnace cooling of the specimens.
Investigation of nitriding with 96% N2 + 4% H2 was restricted to two parameters,
namely nitriding time and temperature. To test the effects of changing these factors on
the chemical composition of the surface and the nitride layer thickness, an experimental
design with three levels for each parameter was utilized. The experimental design and
values for each parameter are shown in Table 3. The values of each level were selected
base on observations from the trial tests.
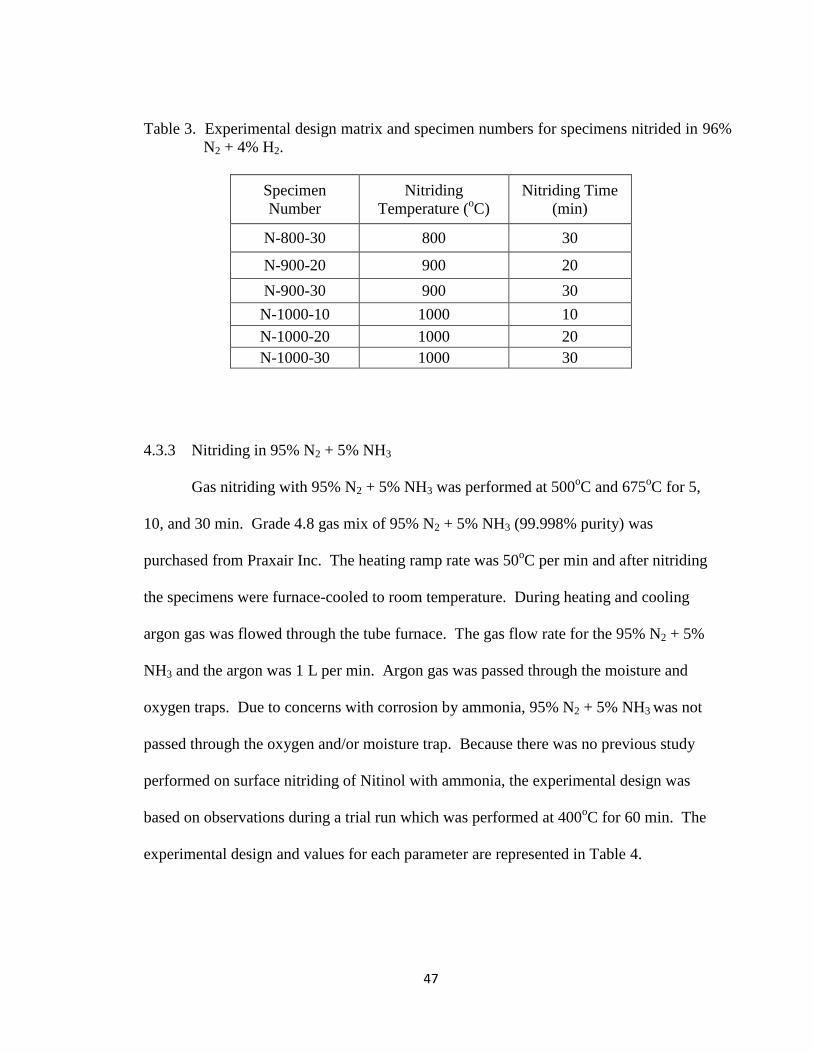
47
Table 3. Experimental design matrix and specimen numbers for specimens nitrided in 96%
N2 + 4% H2.
Specimen
Number
Nitriding
Temperature (oC)
Nitriding Time
(min)
N-800-30 800 30
N-900-20 900 20
N-900-30 900 30
N-1000-10 1000 10
N-1000-20 1000 20
N-1000-30 1000 30
4.3.3 Nitriding in 95% N2 + 5% NH3
Gas nitriding with 95% N2 + 5% NH3 was performed at 500oC and 675
oC for 5,
10, and 30 min. Grade 4.8 gas mix of 95% N2 + 5% NH3 (99.998% purity) was
purchased from Praxair Inc. The heating ramp rate was 50oC per min and after nitriding
the specimens were furnace-cooled to room temperature. During heating and cooling
argon gas was flowed through the tube furnace. The gas flow rate for the 95% N2 + 5%
NH3 and the argon was 1 L per min. Argon gas was passed through the moisture and
oxygen traps. Due to concerns with corrosion by ammonia, 95% N2 + 5% NH3 was not
passed through the oxygen and/or moisture trap. Because there was no previous study
performed on surface nitriding of Nitinol with ammonia, the experimental design was
based on observations during a trial run which was performed at 400oC for 60 min. The
experimental design and values for each parameter are represented in Table 4.

48
Table 4. Experimental design matrix and specimen numbers for specimens nitrided in 95%
N2 + 5% NH3.
Specimen
Number
Nitriding
Temperature (oC)
Nitriding Time
(min)
A-500-5 500 5
A-500-30 500 30
A-675-5 675 5
A-675-30 675 30
4.4 Oxidation
One group of specimens, after being mechanically polished to a mirror finish and
washed, was thermally oxidized in air with a flow rate of 1 L per min at 675oC for 30 min
and 700oC for 60 min.
4.5 Nitriding and Oxidation
One set of specimens were nitrided and subsequently oxidized. The values of the
parameters for the nitriding and oxidation process were based on observations from the
preceding nitriding and oxidation experiments. Completion of the oxidation of the nitride
layer first was visually evaluated from the Nitinol specimen’s color change from golden,
indicating the presence of TiN on the surface, to black which is a sign of the presence of
TiO2 on the surface. Nitriding followed by oxidation was done under two conditions,
namely, (a) nitride in 96% N2 + 4% H2 at 1000oC for 20 min, then oxidize with air at
700oC for 60 min (N-1000-20-O-700-60) and (b) nitride in 95% N2 + 5% NH3 at 675
oC

49
for 5 min, then oxidize with air at 675oC for 30 min (A-675-5-O-675-30). The
experimental design and values for each parameter are shown in Table 5.
Table 5. Experimental design matrix and specimen numbers for nitrided and oxidized
specimens.
Specimen Number Nitriding
Atmosphere
Nitridin
g Temp.
(oC)
Nitriding
Time
(min)
Oxidation
Temp.
(oC)
Oxidation
Time
(min)
A-675-5-O-675-30 95% N2 +
5% NH3 675 5 675 30
N-1000-20-O-700-60 96% N2 +
4% H2 1000 20 700 60
4.6 Surface Characterization
The surfaces of the untreated, oxidized, nitrided and nitrided and oxidized
specimens were characterized by XRD, SEM, EDS and XPS.
4.6.1 X-ray Diffraction
To characterize the phases present on the surface of the specimens, Glancing
Incidence X-ray Diffraction with Cu Kα X-rays (λ= 1.542 Å) was performed, using a
Rigaku X-ray diffractometer, model Ultima III. The grazing angle was five degrees. The
specimens characterized with XRD were:
a) An untreated specimen.
b) A specimen oxidized in air at 700oC for 60 min.

50
c) A nitrided- oxidized specimen nitrided in 96% N2 + 4% H2 at 1000oC for 20
min, followed by oxidation in air at 700oC for 60 min.
d) A specimen nitrided in 96% N2 + 4% H2 at 800oC for 30 min.
4.6.2 X-ray Photoelectron Spectroscopy
To determine the chemical composition of the surface and the depth profile,
surface analysis was performed using a Thermo Scientific K-Alpha XPS. The acceptance
angle was 60o, and the take-off angle was 90º. High resolution XPS depth profiles were
also obtained. Ion etching during the depth profiling was done using a 3 kV argon ion
etch.
4.6.3 Atomic Force Microscopy
The thickness of the nitride layers was measured from the elemental depth
profiles based on the distance from the surface to where the nitrogen concentration drops
to one half of its maximum concentration value.
Since the nitride layer thickness from the XPS depth profiles was in terms of
argon ion etching time, the ion etch rate of the nitride layer was also measured using
Atomic Force Microscope (AFM).
As shown in Figure 16, ion etching of the surface of a Nitinol specimen was
artificially blocked with silicon and the step height was measured by a Pacific
Nanotechnology model Nano-I AFM (San Jose, CA). The ion etch rate was measured at
12 points for three different ion etching times yielding a total of 36 points. The ion etch

51
rate, as shown in Appendix B, was determined to be 0.91 nm/s for 3kV argon ion etching,
with a standard deviation of 0.12 nm/s.
Figure 16. Measurement of the ion etch rate using AFM.

52
4.6.4 Scanning Electron Microscopy
To measure the nitride layer thickness, SEM images of the transverse sections of
specimens were prepared. The specimens were cold mounted and polished with 120 -
600 grit silicon carbide followed by 1 µm and 0.3 µm Al2O3 paste. An FEI Quanta 200
scanning electron microscope was used. Images from the specimens were obtained at an
accelerating voltage of 20kV, and the nitride layer thickness was measured from the
images.
Another set of SEM images were taken at the surface of specimens after
preparation and chemical etching to investigate the effect of chemical etching on the
surface roughness. The elemental composition of specimens was confirmed by Energy-
dispersive X-ray Spectroscopy (EDS) analysis of the mechanically polished specimens.

53
CHAPTER FIVE
RESULTS
In this chapter the characteristics of the surfaces resulting from the various
oxidation, nitriding and nitriding and oxidation experiments are described. The surface
characterization techniques employed were XPS, SEM, GI-XRD and AFM. Overall, the
surface oxidation of the nitrided Nitinol with a thick nitride layer was found to be capable
of forming a nickel-free TiO2 layer on the surface. However, when Nitinol specimens
with a thin nitride layer were oxidized, some nickel was found on the surface/atmosphere
interface.
5.1 Untreated Specimens
The surface composition of the mechanically polished specimen, washed and
dried specimen and chemically etched specimen are presented in this section. This
analysis was done to determine the chemical composition of the Nitinol used, and the
potential effect of sample preparation technique on the surface of the Nitinol samples,
prior to nitriding and/or oxidation.
5.1.1 Nominal Composition of Nitinol Specimens
The composition of a mechanically polished specimen was measured by EDS. As
shown in Figure 17, the composition of Nitinol specimen was 50.81% Ni and 49.19%
(at.%) Ti. As shown in Figure 18, Nitinol was the only phase detected by XRD.

54
Figure 17. Energy-dispersive X-ray spectroscopy spectrum from the mechanically
polished Nitinol after the polishing.
Figure 18. X-ray diffraction pattern from the mechanically polished Nitinol.

55
5.1.2 Specimen Preparation
In order to determine the effects of sample preparation on the oxidation state of
the surface of the Nitinol specimen, one set of specimens were washed with deaerated DI
water and dried with argon and compared with the specimens which were washed with
DI water and air-dried. As shown in Figure 19 (a), there was a peak in the oxygen
concentration on the surface of the sample that was mechanically polished, washed with
DI water and air-dried. As shown in Figure 19 (b), oxygen was detected on the surface of
the argon-dried specimen as well. Washing with deaerated DI water and argon-drying
was not effective in preventing of the formation of the oxide layer on the surface.
Figure 19. X-ray photoelectron spectroscopy elemental depth profile of (a) air-dried and
(b) argon-dried specimens.
(a) Mechanically Polished, Washed With DI Water, Air-Dried
(b) Mechanically Polished, Washed With Deaerated DI Water, Argon-Dried

56
Scanning electron microscopy images from the surface of the chemically etched
specimen, shown in Figure 20, showed a dramatic increase in the surface roughness as
compared to mechanical polishing. Chemical etching also increased the concentration of
oxygen on the specimen since 13.39% oxygen was detected by EDS, as shown in Figure
21.
Figure 20. Scanning electron microscope images from (a) mechanically polished and (b)
mechanically polished and chemically etched specimens.
As was shown in Figure 17, oxygen was not detected, by EDS, on the
mechanically polished specimen; however, 13.39% oxygen was detected on the
chemically etched specimen. Since washing with deaerated DI water and argon-drying
did not reduce the oxygen concentration on the surface, as shown in Figure 19, and
chemical etching increased the surface roughness and increased the oxygen concentration

57
on the surface, the specimen preparation was restricted to mechanical polishing and
washing with DI water, followed by air-drying.
Figure 21. Energy-dispersive X-ray spectroscopy spectrum from the chemically etched
Nitinol.
5.2 Nitrided Nitinol
After mechanical polishing, the Nitinol specimens were thermally nitrided in a
tube furnace. Three different atmospheres, pure nitrogen, nitrogen/hydrogen mixture,
and nitrogen/ammonia mixture were used. The presence of a golden color was the first
indicator of the presence of nitride on the surface of the Nitinol. After visual inspection,
the assumed presence of the TiN was confirmed with XPS and/or GIXRD. Using these
characterization methods, the chemical state, elemental depth profile, and crystal

58
structure of the surfaces were studied. The thickness of the TiN layers on the surfaces
was measured from the SEM images of the transverse sections of specimens.
5.2.1 Nitinol Nitrided With Pure Nitrogen
The color of the specimens at nitrided at 1000oC and 1100
oC for 60 min was dark
blue, indicating there was no TiN on the surface. This was most probably due to the lack
of atomic nitrogen. Since the golden color indicating formation of TiN was not observed,
these specimens were not analyzed further.
5.2.2 Nitinol Nitrided With Nitrogen + 4% Hydrogen
Nitriding in 96% N2 + 4% H2 was performed at 700oC for 60 min and 800
oC to
1000oC for 10 to 30 min. Nitriding at 700
oC for 60 min did not result in the formation of
a nitride layer on the surface. The color of the specimen remained dark blue. However,
at temperatures above 800oC the surface color of the specimens changed to golden,
indicating the presence of TiN. X-ray diffraction analysis of the specimen nitrided at
800oC for 30 min, as shown in Figure 22, indicated that the surface was primarily TiN,
with minor amounts of NiTi2. Also, as shown in Figure 23 (a) and (b), a layer with a
Ti/Ni ratio of 2 was detected at a depth of 1.2 and 2.75 µm from the surface of the
specimens nitrided at 800oC for 30 min and at 900
oC for 30 min, under the TiN layer.
This indicates that the peaks of NiTi2 detected by XRD are potentially from the layers
under the TiN layer on the surface. The presence of a NiTi2 layer under the TiN layer
after the gas nitriding has been reported elsewhere as well [37, 39].

59
Figure 22. X-ray diffraction results from the specimen nitrided at 800
oC for 30 min.
Figure 23. Elemental depth profile of specimens nitrided in 96% N2 + 4% H2 at (a)
800oC for 30 min, (b) 900
oC for 30 min and (c) 1000
oC for 30 min.

60
As shown in Figure 23 (a) and (b), for specimens nitrided at 800oC and 900
oC for
30 min (N-800-30 and N-900-30) the nickel concentration increased to almost one half of
the titanium concentration when the concentration of the nitrogen dropped to zero. The
nitrogen concentration dropped to zero at approximately 1.2 µm from the surface for
specimen nitrided at 800oC for 30 min and 2.75 µm from the surface for the specimen
nitrided at 900oC for 30 min. For the specimen nitrided at 1000
oC for 30 min (N-1000-
30), the nitride layer on the surface was very thick, and the depth profile was not able to
reach the NiTi2 zone, as a result of which the thickness of the nitride layer could not be
estimated from the XPS depth profile. Based on 0.91 nm/s ion etch rate for TiN, as
discussed in Appendix B, the TiN layer thickness on the specimen nitrided at 1000oC for
30 min was found to be greater than 2.75 µm.
Nickel was not detected in the TiN layer. As shown in Figure 24, the nickel
depletion on the outmost surface was confirmed by XPS survey spectra for the surface of
all 6 nitrided specimens. There was no peak in the range of 800 to 900 eV of binding
energy, indicating the presence of nickel and/or its compounds. In Figure 23 it can be
seen that the nickel concentration increases only at distances, from the surface, where the
nitrogen concentration starts to decrease. For example, for the specimen nitrided at
900oC for 30 min, the nitrogen concentration starts to drop at approximately 1 µm from
the surface and in this region the nickel concentration starts to rise. This indicates that
the nitriding process formed a nickel-free TiN layer on the surface. The titanium
concentration remained constant at approximately 50% (at.%).

61
Oxygen and carbon were detected on the surface. These were most probably
adsorbed on the surface during the post-nitriding handling. An increase in the oxygen
concentration was observed at a distance from the surface where the nickel concentration
starts increasing. The reasons for this were not explored further.
Figure 24. X-ray photoelectron spectroscopy survey scan of specimens nitrided in 96%
N2 + 4% H2 at (a) 800oC for 30 min, (b) 900
oC for 20 min, (c) 900
oC for 30
min, (d) 1000oC for 10 min, (e) 1000
oC for 20 min, and (f) 1000
oC for 30 min.

62
At a distance from the surface where the nickel concentration starts increasing,
nickel was in the oxide form (NiO) with a binding energy of 854 eV, as shown by the
XPS high resolution scans for the range of 845 to 865 eV in Figure 25. No peaks were
observed in the range of 852 to 853.8 eV, where the peak of elemental nickel is located.
Figure 25. High resolution XPS spectra for Ni2p from (a) specimen nitrided at 800oC for
30 min and (b) specimen nitrided at 900oC for 30 min.
(b)
(a)

63
5.2.2.1 Nitride Layer Thickness
By using the ion etch rate, determined from AFM measurements, the thickness of
the nitride layer was determined from XPS depth profiles. Measured values for the
nitride layer thickness are represented in Table 6. The nitride layers on the surfaces of
specimens nitrided at 1000oC for 20 and 30 min (N-1000-20 and N-1000-30) were very
thick, and the elemental depth profile could not reach the end of the nitride layer. Based
on the measurements taken, the TiN layer thicknesses were determined to be greater than
2.75 µm for specimens nitrided at 1000oC for 20 and 30 min.
The thickness of the nitride layer was also measured from SEM images of cross-
sections. Measured values of the TiN layer thickness are listed in Table 6. As shown in
Figure 26 there was some electron charging on the TiN layer, due to the low electrical
conductivity of TiN. At low nitride layer thicknesses the measured values for the
thickness of the nitride layer by SEM was relatively close to the values measured from
the XPS, but for specimen nitrided at 1000oC for 10 min it was not the case.
Table 6. Thickness of the nitride layer on the surface of the Nitinol.
Specimen
Number
Nitriding
Temperature
(C)
Nitriding
Time
(min)
Nitride Layer
thickness From
SEM (µ)
Nitride Layer
thickness From
XPS (µ)
N-800-30 800 30 0.69 0.82
N-900-20 900 20 1.42 1.32
N-900-30 900 30 2.52 1.70
N-1000-10 1000 10 6.11 2.60
N-1000-20 1000 20 6.43 -
N-1000-30 1000 30 6.32 -

64
Figure 26. Scanning electron microscope images from the transverse section of
specimens nitrided in 96% N2 + 4% H2.
Nitriding in 96% N2 + 4% H2 at temperatures above 800oC resulted in the
formation of nickel-free TiN layers on the surfaces of the Nitinol specimens. The nickel
concentration was zero in the nitride layer and started to increase at depth where the
nitrogen concentration started to decrease. X-ray diffraction and XPS results showed a

65
NiTi2 zone under the nitride layer after nitriding. The TiN layer thicknesses were
measured from the SEM images of the transverse section of specimens. They varied
from 0.7 µm for the specimen nitrided at 800oC for 30 min to 6.3 µm for the specimen
nitrided at 1000oC for 30 min.
5.2.2.2 Effect of the Nitriding Time and Temperature
Nitriding temperature was found to be more effective in determining the nitride
layer thickness, as compared to nitriding time. As shown in Figure 27 the thickness of
the nitride layer on the surface increased dramatically with nitriding temperature, from
less than 1 µm at 800oC to 6.2 µm at 1000
oC. This is due to the fact that diffusion of
nitrogen into the surface is faster at higher temperatures. However, the nitriding time did
not affect the nitride layer thickness. As shown in Figure 28, the nitride layer thickness at
1000oC was not statistically different for specimens nitrided for 10, 20, and 30 min.
Figure 27. Nitride layer thickness on the surface of the Nitinol as a function of nitriding
temperature.

66
Figure 28. Nitride layer thickness on the surface of the Nitinol as a function of nitriding
time.
5.2.3 Nitinol Nitrided With Nitrogen + 5% Ammonia
Nitinol specimens were nitrided in 95% N2 + 5% NH3 at 450oC for 60 min and at
500oC and 675
oC for 5 and 30 min. At the nitriding temperature of 450
oC there were no
signs of nitriding occurring. The surface was oxidized, as there was no golden color on
the surface and it was black. At nitriding temperatures of 500oC and 675
oC the surface
color turned to golden. The presence of TiN on the surface was confirmed by XPS
analysis. As shown in Figure 29 (a) and (b), the surface of both specimens, nitrided at
500oC and 675
oC for 5 min was nickel-free TiN. X-ray photoelectron spectroscopy depth
profiles also detected a nickel-rich zone under the nitride layer, with a nickel
concentration of 65% (at.%). Oxygen at relatively high concentrations was detected in
the nitride layer on the surface of both specimens. The oxygen concentration in the
nitride layer, after nitriding with 95% N2 + 5% NH3, was higher than that for specimen
nitrided in the 96% N2 + 4% H2. Oxygen was most probably present in the 95% N2 + 5%

67
NH3 as an impurity. It is also possible that the presence of oxygen in the nitride layer, at
such high levels, was potentially due to accumulation by absorbing oxygen during the
XPS analysis. With increase in the nitriding time from 5 to 30 min at 500oC and 675
oC
the surface color of the specimen became dark. It is most probably due to the absorption
of more oxygen from the 95% N2 + 5% NH3 and subsequent oxidization of the nitride
layer on the surface during the longer nitriding times.
The SEM image from the transverse section of specimens nitrided in 95% N2 + 5%
NH3 at 500oC for 5 min, as shown in Figure 30, showed a 0.52 µm thick nitride layer on
the surface.
Figure 29. X-ray photoelectron spectroscopy depth profile of specimens nitrided in 95%
N2 + 5% NH3 at (a) 500oC for 5 min and (b) 675
oC for 5 min.

68
Figure 30. Scanning electron microscope image from the transverse section of specimen
nitrided in 95% N2 + 5% NH3 at 500oC for 5 min.
5.2.4 Summary of Nitriding
Overall, nitriding in 96% N2 + 4% H2 in the temperature range of 800oC to
1000oC and in 95% N2 + 5% NH3 in the temperature range of 500
oC to 675
oC resulted in
the formation of nickel-free TiN layers on the surface of the Nitinol specimens. The
nitride layer’s crystal structure, chemical composition and thickness were studied by
XRD, XPS and SEM. The Nickel concentration was zero in the nitride layer and started
to increase at depths where the nitrogen concentration started to decrease. For example,
this distance for the specimen nitrided in a 96% N2 + 4% H2 mix at 900oC for 30 min was

69
1 µm. A nickel-rich zone with a nickel concentration of 60 to 70% (at.%) was observed
under the nitride layer, after nitriding with 95% N2 + 5% NH3. X-ray diffraction and x-
ray photoelectron spectroscopy results showed a NiTi2 zone under the nitride layer after
nitriding with the 96% N2 + 4% H2. Both nitriding processes were sensitive to the
presence of oxygen as an impurity in the gases and/or as native oxide on the surface after
specimen preparation. Based on the results two nitriding conditions were selected for
nitriding the Nitinol specimens before oxidation. These two conditions were nitriding in
a 96% N2 + 4% H2 mix at 1000oC for 20 min (N-1000-20) and nitriding in 95% N2 + 5%
NH3 at 675oC for 5 min (A-675-5). These two conditions were selected because they
were able to form a relatively thick (6.4 µm for N-1000-20 and 0.5 µm for A-675-5) and
nickel-free nitride layer on the surface.
5.3 Oxidized Nitinol
One set of Nitinol specimens was oxidized after specimen preparation. The
oxidation process was performed with a one L per min flow rate of dry air, at 675oC for
30 min (O-675-30) and 700oC for 60 min (O-700-60). After oxidation, the surface color
of the specimens changed to black; this was interpreted as evidence of the presence of
TiO2. As shown in Figure 31, GIXRD showed the presence of TiO2 (Rutile). Also, some
Ni3Ti was detected by GIXRD, presumably due to the formation of a nickel-rich zone
under the TiO2 layer. However, the major peaks were from TiO2, indicating the presence
of a thick TiO2 layer on the surface. The XPS depth profile was not able to reach the
Nitinol bulk after 3,000 s of 3 kV ion etching, so it was not possible to estimate the

70
thickness of the oxide layer. Based on 0.91 nm/s of ion etch rate, the TiO2 layer
thickness was higher than 2.75 µm.
X-ray photoelectron spectroscopy results, as shown in Figure 32, confirmed the
presence of TiO2 on the surface. On the surface of the specimen oxidized in air at 675oC
for 30 min 1.75% (at.%) of nickel was detected. High resolution XPS spectra indicated
that the nickel was in the form of NiO (Ni2p binding energy = 854.5). As shown in
Figure 33, there was no peak in the 850 to 853 eV range, which represents elemental
nickel. At approximately 0.5 µm from the outermost surface (based on 0.91 nm/s ion
etch rate), there was no nickel detected.
Figure 31. X-ray diffraction results from the oxidized Nitinol in air at 700
oC for 60 min.

71
Figure 32. X-ray photoelectron spectroscopy depth profile of specimen oxidized at
675oC for 30 min.
Figure 33. Nickel high resolution XPS scan results for specimen oxidized at 675
oC for
30 min.

72
Nickel was also detected on the outmost surface of the specimen oxidized in air at
700oC for 60 min. As shown in Figures 34 and 35, for the specimen oxidized at 700
oC
for 60 min the nickel concentration dropped to zero at a distance greater than 1.8 µm
from the surface, compared to 0.5 µm for the specimen oxidized at 675oC for 30 min.
Figure 34. X-ray photoelectron spectroscopy depth profile of specimen oxidized in air at
700oC for 60 min.
Figure 35. Nickel high resolution XPS scan results for specimen oxidized at 675oC for
30 min.

73
Oxidation in air at 675oC for 30 min and at 700
oC for 60 min formed a surface
layer with TiO2 as the dominant phase. X-ray photoelectron spectroscopy analysis
detected nickel on the surface/atmosphere interface for specimens oxidized in air at
700oC for 60 min and 675
oC for 30 min. Therefore, oxidation did not result in the
formation of a nickel-free oxide layer on the surface.
5.4 Nitrided and Oxidized Nitinol Specimens
Thermodynamically, oxidation of TiN is a spontaneous reaction. Surface
nitriding followed by oxidation was performed on Nitinol specimens under two
conditions. The first condition was nitriding in 96% N2 + 4% H2 at 1000oC for 20 min
and then oxidizing in air at 700oC for 60 min (N-1000-20-O-700-60). The second
condition was nitriding in 95% N2 + 5% NH3 at 675oC for 5 min and then oxidizing in air
at 675oC for 30 min (A-675-10-O-675-30). The values of the parameters for the nitriding
and oxidation process were selected based on the findings from earlier nitriding
experiments, the thickness of the nitride layer with undetectable amounts of nickel on the
surface, and the Nitinol specimen’s color change from gold to black, an indication of the
completion of the oxidation of the nitride layer.
X-ray diffraction analysis was performed on the specimen nitrided at 1000oC for
20 min, followed by oxidation at 700oC for 60 min (N-1000-20-O-700-60). As shown in
Figure 36, the surface was only TiO2. Other phases such as TiN and Ni3Ti were not
detected. This is evidence that the nitrided layer was completely oxidized. Also, the
oxide layer was thick enough that no Nitinol, Ni3Ti, or other phases were detected. The

74
presence of the thick oxide layer with a thickness greater than 2.75 µm (based on 0.91
nm/s of ion etch rate) on the surface was confirmed by XPS depth profiles. As shown in
Figure 37, there was a TiO2 layer on the surface, with no detectable nickel.
Figure 36. X-ray diffraction results from N-1000-20-O-700-30.
Figure 37. X-ray photoelectron spectroscopy depth profile of N-1000-20-O-700-30.

75
Nitriding in the 96% N2 + 4% H2 atmosphere formed a 6.43 µm thick TiN layer
with undetectable amounts of nickel on the surface. Oxidation of this TiN layer resulted
in the formation of a TiO2 layer with undetectable amounts of nickel on the surface. Also,
no nitrogen was detected in the oxide layer, indicating that oxidation of the nitride layer
was complete.
Nitriding in 95% N2 + 5% NH3 at 675oC for 5 min, followed by oxidation at
675oC for 30 min formed a TiO2 layer which was not nickel-free on the surface. As
shown in Figure 38, XPS results detected 0.6% (at.%) of nickel on the surface.
Figure 38. X-ray photoelectron spectroscopy depth profile of A-675-5-O-675-30.

76
Nitrided specimens were oxidized in air at 675oC for 30 min and 700
oC for 60
min. The surface oxidation of the nitrided Nitinol with a 6.4 µm thick TiN layer with
undetectable nickel was found to be capable of forming a TiO2 layer in which nickel was
undetectable. However, after oxidation of Nitinol specimens with a 0.25 µm thick nitride
layer, some nickel was found on the surface/atmosphere interface. It was most probably
caused by an outward diffusion of nickel, due to the thermodynamic activity difference of
nickel present in the nickel-rich zone and the nickel-depleted zone. Also, presence of
oxygen on the surface and the thermodynamic stability of NiO was a driving force for
nickel to diffuse toward the surface.
77
CHAPTER SIX
DISSCUSSION
6.1 Surface Chemical Composition
Based on the results in Chapter Five, surface nitriding followed by oxidation was
found to be an effective technique to form a TiO2 layer with no detectable nickel on the
surface. The nickel concentration on the outermost surface of the Nitinol specimen
dropped to zero, from about 20% (at.%) for the mechanically polished specimen and 1.5%
(at.%) for the Nitinol specimens that were oxidized only. The fundamental reason for
this drop in the nickel concentration was surface nitriding prior to oxidation. Nitriding
formed a TiN layer on the surface of the Nitinol, and by oxidation of the TiN, a TiO2
layer with no detectable nickel was formed on the surface.
6.1.1 Bare Nitinol
After specimen preparation, the surface of the Nitinol specimens was analyzed by
XPS. The nickel concentration value dropped from 50.8% (at.%) in the bulk to
approximately 20% (at.%) on the surface. By XPS 50% oxygen and 25% (at.%) titanium
was also detected. These results indicate the spontaneous oxidation of titanium and the
formation of TiO2 on the surface/atmosphere interface on the Nitinol specimen. This
oxidation occurred while titanium was in contact with atmospheric oxygen at room
temperature. According to thermodynamic data, this phenomena is predictable due to a
very low standard Gibbs free energy of formation for TiO2. The oxidation of titanium on

78
the surface of the Nitinol has been reported repeatedly in other research [16-20]. In other
work, the value of the nickel concentration on the surface varied from 0.9% to 20%
(at.%). The amount of nickel detected on the surface in this work was in this range.
6.1.2 Nitrided Nitinol
Nitinol specimens were surface nitrided in three different atmospheres, pure N2, a
96% N2 + 4% H2 mix, and a 95% N2 + 5% NH3 mix. Surface nitriding of Nitinol in pure
nitrogen and in a nitrogen/hydrogen gas mix has been reported by other researchers [30,
35, 36], and these two atmospheres were selected based on previous work. Ammonia is
also a source of nitrogen. Although there was no report for the surface nitriding of
Nitinol in a nitrogen/ammonia gas mixture, it was selected to nitride the Nitinol based on
ammonia being a source of atomic nitrogen.
Since there was no golden color observed on the surface of the Nitinol specimen
nitrided in pure nitrogen, nitriding in pure nitrogen did not result in the formation of a
TiN layer on the surface. It was most likely due to the lack of atomic nitrogen in the
atmosphere. Pure nitrogen is in the form of N2. Breaking the N-N bond is required to
provide atomic nitrogen for the nitriding reaction. The observation that the Nitinol
specimen was not nitrided was probably due to insufficient energy to break the N-N
bonds. Although nitriding of the Nitinol in pure nitrogen was reported in other research
at 800 - 1000
oC for 5 - 30 min [35, 36], in this work, nitriding with pure nitrogen was
unsuccessful for reasons that need further exploration.

79
Another technique to nitride Nitinol, adopted from previous works, was nitriding
in a 90% N2 + 10% H2 gas mix. After nitriding at 800oC for 300 s TiN was detected on
the surface of the Nitinol [30]. In this work specimens were nitrided in a 96% N2 +5%
H2 mix. The gas with a lower percentage of hydrogen was selected due to safety
concerns and availability. Based on XRD and XPS analysis, after nitriding of Nitinol in
96% N2 +5% H2, TiN was formed on the surface of the Nitinol. The effect of the
presence of 4% H2 in the nitrogen on the formation of atomic nitrogen was not
investigated in this research.
Another set of specimens were nitrided in a 96% N2 + 4% H2 mix at 700 - 1000
oC.
At nitriding temperatures below 800oC, nitriding was not observed, probably due to the
lack of energy to break N-N bonds and provide atomic nitrogen at the surface of the
Nitinol. The nitride layer thickness increased dramatically from 0.75 - 6 µm with an
increase in nitriding temperature from 800 - 1000
oC. It was most likely due to the fact
that the increase in the nitriding temperature can accelerate the diffusion of nitrogen into
the surface and titanium from the bulk toward the surface. Also, at higher nitriding
temperatures more atomic nitrogen is available due to more energy available to break the
N-N bonds. No nickel was detected in the TiN layer on the surface, and the nickel
concentration began to rise when the nitrogen concentration began to drop. Based on
thermodynamic data this was predictable. Nickel does not form a nitride, due to the
positive standard Gibbs free energy of formation; the surface will therefore be
predominantly TiN. The presence of a nickel-free TiN layer has been reported in
previous research on the nitriding of the Nitinol [30, 35-41].

80
The third atmosphere selected to nitride the Nitinol was 95% N2 + 5% NH3, with
ammonia as the source of atomic nitrogen. There was no previous study performed on
the nitriding of Nitinol in ammonia, so the nitriding conditions were selected based on the
observations from the experiments in this investigation. However, due to being corrosive
and flammable, ammonia was not deoxidized before the nitriding process, as a result of
which considerable amounts of oxygen (56 - 60%) was detected on the surface of the
Nitinol which was nitrided in the ammonia-containing atmosphere. No nickel was
detected in TiN layer on the surface of the Nitinol. The thickness of the layer on the
surface was approximately 0.25 µm which was thinner than the nitride layer on the
surface of the Nitinol specimens nitrided in a 96% N2 + 4% H2 mix. This was most
probably due to the lower nitriding temperature which limited the diffusion of the
nitrogen into the surface of the Nitinol and titanium towards the surface.
Overall, nitriding was capable of forming a TiN layer on the surface of the Nitinol
with no nickel being detected. Two nitriding conditions were selected for nitriding prior
to oxidation. They were nitriding in 96% N2 + 4% H2 at 1000oC for 20 min and nitriding
in 95% N2 + 5% NH3 at 675oC for 5 min.
These two processes were selected based on their capability of the formation of a
uniform and nickel-depleted TiN layer on the surface. After nitriding under these
conditions the specimens were oxidized in air. The oxidation conditions were selected
based on color change from gold to black, indicating the completion of the oxidation of
the TiN layer on the surface. To study the effect of the nitriding prior to the oxidation

81
process, one set of specimens were oxidized only in air to be compared with the nitrided
and oxidized specimens.
6.1.3 Oxidized Nitinol
Nitinol specimens were oxidized in air at 675oC for 30 min and 700
oC for 60 min.
These two conditions were selected to mimic the oxidation process after the nitriding for
the nitrided and oxidized specimens. After oxidation, based on the XRD results, the
dominant phase was TiO2 as expected. The formation of TiO2 after oxidation has been
reported repeatedly [19-31]. However, the TiO2 layer was not nickel-free, and based on
XPS results 1.5 to 1.7% (at.%) of nickel was detected on the outermost surface of the
oxidized specimen. The presence of nickel in the form of NiO on the surface/atmosphere
interface has also been reported by others [19, 20, 22]. Two phenomena are suggested to
be responsible for the presence of the nickel on the outermost surface of the Nitinol
specimen.
Availability of oxygen for the nickel to form NiO on the surface is a driving force
for nickel to diffuse toward the outer surface.
After completion of the surface oxidation and formation of a nickel-rich zone
under the TiO2 layer, nickel diffuses into the oxide layer toward the outermost
surface due to the thermodynamic activity difference of nickel in the nickel-rich
zone and the nickel in the nickel-free oxide layer.

82
6.1.4 Nitrided and Oxidized Nitinol
Nitriding and oxidation processes were performed on the Nitinol specimens under two
conditions:
Nitriding in a 96% N2 + 4% H2 at 1000oC for 20 min and then oxidizing in air at
700oC for 60 min (N-1000-20-O-700-60).
Nitriding in 95% N2 + 5% NH3 at 675oC for 5 min and then oxidizing in air at
675oC for 30 min (A-675-10-O-675-30).
The values of the parameters for the nitriding and oxidation process were based
on observations from the nitrided specimens, which had a relatively thick and uniform
nitride layer on the surface with no detectable nickel. Also, the completion of the
oxidation of the nitrided layer was another factor for the selection of the oxidation
parameters. The first nitriding and oxidation process, which was nitriding in a 96% N2 +
4% H2 mix at 1000oC for 20 min followed by oxidation in air at 700
oC for 60 min,
resulted in a TiO2 layer on the surface with no detectable nickel. Nitriding in 96% N2 + 4%
H2 prior to the oxidation of the Nitinol and formation of a relatively thick TiN layer (6
µm) eliminated the presence of the nickel on the outermost surface. Nitinol specimens
which were only oxidized under the similar oxidation condition (in air at 700oC for 60
min) had a nickel concentration of 1.5% (at.%) on the outermost surface of them. Based
on the observations nitriding prior to the oxidation eliminated the presence of the nickel
on the surface. However, nitriding in 95% N2 + 5% NH3 at 675oC for 5 min and then
oxidizing in air at 675oC for 30 min did not eliminate the nickel on the outermost surface

83
of the specimen. 0.62% (at.%) nickel was detected on the outermost surface of the
specimen nitrided in ammonia and then oxidized.
Based on these observations, an outward diffusion of the nickel from the nickel-
rich region, under the nickel-free region, toward the nickel-free zone on the surface is
suggested as the responsible factor for the presence of the nickel on the outermost surface
of the Nitinol. This phenomenon is most probably due to the difference of the
thermodynamic activity of the nickel in nickel-rich zone and the nickel-free zone. Also,
availability of oxygen for the nickel to form NiO on the surface is another driving force
for nickel to diffuse toward the surface. However, for the nitrided Nitinol in a 96% N2 +
4% H2 mix at 1000oC for 20 min and then oxidized in air at 700
oC for 60 min, the TiN
layer was very thick, and nickel was not able to diffuse through the TiN and/or TiO2 layer,
and a TiO2 layer with undetectable amounts of nickel was observed on the surface of this
specimen.
6.2 Sources of Error and Confidence of Results
There were at least five specimens surface treated per condition. XPS and XRD
analysis was performed only on one specimen, and were verified only in some cases.
Analysis of more samples was not possible within the scope and resources available for
this research. The fundamental purpose of this research was to test the validity of the
research hypothesis presented in Chapter Three. Since investigation of process
parameters and kinetics was not part of the scope of this research, the lack of analysis of
more than one specimen per condition does not distract from the validity of the findings.

84
The temperature in the tube furnace was calibrated, and a thermocouple was
placed right on the top of the specimens, but small variations in the temperature due to
the accuracy of the thermocouple (±1oC) and temperature difference between the surface
of the specimen and the tip of the thermocouple could be a source of error.
Another process related source of error was the gas composition. This is
considered as a source of error only for the nitriding process since the oxidation was
performed in air. The ratio of the 96% N2 + 4% H2 was considered to be 96/4, but there
was the possibility of minor changes in this ratio.
Errors in the XPS, SEM, and XRD analysis could also be sources of error. Since
TiN’s electrical conductivity is low, charging was observed during the SEM analysis.
The charging potentially can decrease the accuracy of the TiN layer thickness
measurements from the SEM images.
Interpretation of the ion etch time to the actual distance from the surface in µm
required another ion etch rate measurement experiment, using AFM. The accuracy of the
AFM as well as the accuracy of the XPS depth profile affected the accuracy of the TiN
layer thickness, as measured by XPS.
Another analysis based error is from the detection limit of XRD, which in 1%
(wt.%). This means if the concentration of a phase, for example NiO, is less than 1%
(wt.%), XRD could not detect it.

85
CHAPTER SEVEN
CONCLUSIONS
Due to its good biocompatibility, corrosion resistance, and unique mechanical
properties such as superelasticity and shape memory, Nitinol has been used in several
biomedical devices. However, Nitinol contains 50% nickel, a toxic material, which can
cause severe allergic reactions in the human body. Nickel can leach out from the surface
of Nitinol into the human body, and nickel ion release from Nitinol has been reported
repeatedly.
Different surface treatment methods like thermal oxidation, electropolishing,
passivation, and boiling in water have been used to provide a protective and nickel-free
TiO2 layer on the surface of Nitinol.
During this investigation, it was found that nitriding followed by thermal
oxidation is capable of forming an oxide layer on the surface with undetectable amounts
of nickel. Nitriding in 96% N2 + 4% H2 at 1000oC for 20 min followed by oxidation in
air at 700oC for 60 min formed a TiO2 layer on the surface, and no nickel was detected in
the TiO2 layer. The nitride layer should also be thick enough to prevent the nickel atoms
from outward diffusion due to the thermodynamic activity difference. Monitoring the
surface properties during the nitriding and oxidation process, provide these findings:
Washing with deaerated DI water and argon-drying instead of washing with DI
water and air-drying was not an effective surface preparation technique to prevent

86
Nitinol surface oxidation. Chemical etching in 10% HF + 40% HNO3 + 50% H2O
(Kroll solution) formed more oxides on the surface of Nitinol.
Nitriding in pure nitrogen at 1000oC and 1100
oC, in 96% N2+ 4% H2 at
temperatures below 800oC, and in 95% N2 + 5% NH3 at temperatures below
500oC did not form a nitride layer on the surface of Nitinol.
The nitriding process was very sensitive to the presence of oxygen, and small
amounts of oxygen as an impurity in nitrogen sources, or other gases, can cause
surface oxidation instead of nitriding.
TiN was the predominant phase on the surface of nitrided specimens.
The TiN layer thickness, on the surface of specimens which were nitrided in 96%
N2 + 4% H2 at 800oC to 1000
oC, was strongly affected by nitriding temperature
and increased dramatically at higher temperatures. However, nitriding time was
not as effective as nitriding temperature in affecting the thickness of the nitride
layer.
Nickel was present on the outmost surface of the specimens oxidized in air at
675oC for 30 min and 700
oC for 60 min.

87
CHAPTER EIGHT
RECOMMENDATIONS FOR FUTURE WORK
Biocompatibility tests, other performance tests like nickel ion leaching and
corrosion resistance, and effects of the nitriding and oxidation on the surface roughness
would be helpful to refine the data obtained from this study. Also, investigation of the
nitriding kinetics with 95% N2 + 5% NH3 and 96% N2 + 4% H2 and kinetics of oxidation
of the TiN would be helpful to control the oxidation-nitriding process. Corrosion
resistance and nickel ion release as a result of deformation is recommended to be studied
to mimic the performance of nitrided and oxidized Nitinol in its actual applications. A
broader scope with more replications is also recommended.
In this work nitriding in 96% N2 + 4% H2 at 800oC to 1000
oC for 10 to 30 min
was performed. Studies of the effects of nitriding for longer and/or shorter periods of
time are recommended. Also, measuring the nitride layer using a field emission SEM
will provide better images from the transverse sections and ultimately more accurate
measurements of the nitride layer thickness. Using data of the nitride layer thickness, the
kinetics of nitriding could be studied. Similar research on kinetics of nitriding with 95%
N2 + 5% NH3 is also recommended.
Oxidation of the nitrided surface was performed at 675oC and 700
oC for 30 and
60 min. This process needs to be investigated in greater detail, and the effects of the
oxidation time and temperature on the completion of oxidation, the nickel content on the
surface and surface morphology is recommended to be studied in greater detail.

88
The primary objective of the surface treatments on Nitinol is to reduce and ideally
eliminate the nickel ion release. Surface nitriding and oxidation formed a nickel-depleted
oxide layer on the surface, but nickel ion release is possible from cracks and/or corrosion
spots, so nickel ion release tests would provide valuable data on the effectiveness of
surface nitriding and oxidation processes. Also, studying the effects of nitriding and
oxidation on the corrosion resistance of Nitinol is recommended. Ultimately, high
corrosion resistance and low nickel ion release lead to improved biocompatibility, which
is recommended to be studied by in vitro, and ideally, in vivo research. Corrosion
resistance, nickel release and biocompatibility depend on the surface roughness; therefore,
studying the effects of nitriding and oxidation process on the surface roughness will also
be useful.
In most of the previous works, the corrosion resistance and nickel release tests
were performed on undeformed Nitinol samples. Investigations of Nitinol’s corrosion
resistance under a constant and/or variable load will provide information which is closer
to reality.
The fatigue life of a part most probably decreases dramatically with the presence
of cracks on the surface. Titanium dioxide and titanium nitride are known to be brittle, so
fatigue tests on Nitinol specimens after any type of surface treatment is recommended.
Resistance to fretting corrosion would also be a valuable evaluation tool for the
performance of Nitinol.

89
REFERENCES
[1] N.B. Morgan, “Medical shape memory alloy applications - the market and its
products,” in European Symposium on Martensitic Transformation and Shape-Memory,
A378 (1-2), 16-23, (2004).
[2] G.B. Kauffman and I. Mayo, “The Story of Nitinol: The Serendipitous Discovery of
the Memory Metal and its Application,” Chemical Educator, 2, (1997).
[3] T. Tadaki, K. Otsuka and K. Shimizu, “Shape Memory Alloys,” Annu. Rev. Mater.
Sci., 18, 25-45, (1988).
[4] M.H. Wu, X. Gong , S. Mao and X. Han, “Crystallographic Study of Superelastic
Deformation of Nitinol,” J. ASTM Int., 6, (2009).
[5] S.A. Thompson, “An Overview of Nickel–titanium Alloys Used in Dentistry,” Int.
Endod. J., 33, 297–310 (2000).
[6] O. Kubaschewski and E.L. Evans, Metallurgical Thermochemistry, 2nd
ed. (Pergamon
Press. London, England, 1958).
[7] S. Shabalovskaya, J. Anderegg and J. Van Humbeeck, “Critical Overview of Nitinol
Surfaces and Their Modifications for Medical Applications,”Acta Biomater., 4, 447-67
(2008).
[8] B. Wertman, B. Azarbal, M. Riedl and J. Tobis, “Adverse Events Associated With
Nickel Allergy in Patients Undergoing Percutaneous Atrial Septal Defect or Patent
Foramen Ovale Closure,” J. Am. Coll. Cardiol., 47, 1226-1227. (2006).
[9] M. Dinescu, V.C. Dinca, S. Soare, A. Barbalat, C.Z. Dinu, A. Moldovan and V.F.
DeStefano, “Nickel Titanium Alloy: Cytotoxicity Evaluation on Microorganism Culture,”
Appl. Surf. Sci., 252, 4619-24, (2006).
[10] Y. Xia, T. Wang, L. Bo, , G. Da, Z. Sun, Z. Qin and C. Feng, “Assessment of the
Biocompatibility of Nickel Titanium Shape Memory Alloy With Bone Marrow
Mesenchymal Stem Cell Culture In-vitro,” Chinese J. Biomed. Eng., 24, 54-8, (2005).
[11] S. Shabalovskaya, J. Anderegg, G. Rondelli, W. Vanderlinden and S. De Feyter,
“Comparative In-vitro Performances of Bare Nitinol Surfaces,” Bio. Med. Mater. Eng. 18,
1-14, (2008).

90
[12] M. Arndt, A. Bruck, T. Scully, A. Jager and C. Bourauel, “Nickel Ion Release From
Orthodontic NiTi Wires Under Simulation of Realistic In-situ Conditions,” J. Mater. Sci.,
40, 3659-67, (2005).
[13] S.A. Shabalovskaya, H. Tian, J.W. Anderegg, D.U. Schryvers, W.U. Carroll and J.V.
Humbeeck, “The Influence of Surface Oxides on the Distribution and Release of Nickel
From Nitinol Wires,” Biomaterials, 30, 468-477, (2009).
[14] S. Shabalovskaya, . “Surface, Corrosion and Biocompatibility Aspects of Nitinol as
an Implant Material,” Bio. Med. Mater. Eng., 12, 69, (2002).
[15] S. Trigwell and G. Selvaduray, “Effects of surface finish on the corrosion of NiTi
alloy for biomedical applications,” in 2nd International Conference on Shape Memory
and Superelaslic Technologies (SMS7). Pacilic Grove, 383-8, (1997).
[16] F. Villermaux, M. Tabrizian, L.H. Yahia, M. Meunier and D.L. Piron, “Excimer
laser treatment of NiTi shape memory alloy biomaterials,” in Symposium H on Laser
Processing of Surfaces and Thin Films of the 1996 E-MRS Spri. (1997).
[17] S.A. Shabalovskaya, J. Ryhanen and L. Yahia, “Bioperformance of nitinol: Surface
tendencies,” in SMST-SMM 2001, 394-395, 131-8, (2002).
[18] D.A. Armitage and D.M. Grant, “Characterisation of Surface-modified Nickel
Titanium Alloys,” Mat. Sci. Eng. A-Struct., 349, 89-97, (2003).
[19] B. O'Brien, W.M. Carroll and M.J. Kelly, “Passivation of Nitinol Wire for Vascular
Implants - A Demonstration of the Benefits,” Biomaterials, 23, 1739-1748, (2002).
[20] S.A. Shabalovskaya, J. Anderegg, F. Laab, P.A. Thiel and G. Rondelli, “Surface
Conditions of Nitinol Wires, Tubing, and As-cast Alloys. The Effect of Chemical Etching,
Aging in Boiling Water, and Heat Treatment,” J. Biomed. Mater. Res., 65B, 193, (2003).
[21] C. Hessing and M. Pohl, “Surface Modifications and Their Effect on the Nickel
Release Rate in Nickel Titanium Shape Memory Alloys,” Int. J. Mater. Res., 100, 1099-
108, (2009).
[22] A.R. Pelton, A. Mehta, , L. Zhu, , C. Trepanier, V. Imbeni, , S. Robertson, M.
Barney and A. Minor, “TiNi oxidation: Kinetics and phase transformations,” in
International Conference on Solid Solid Phase Transformations 1029-34, (2006).
[23] G.S. Firstov, R.G. Vitchev, H. Kumar, B. Blanpain and J. Van Humbeeck, “Surface
Oxidation of NiTi Shape Memory Alloy,” Biomaterials, 23(24), 4863-4871(2002).

91
[24] L. Zhu, J.M. Fino and A.R. Pelton, “Oxidation of Nitinol,” in International
Conference on Shape Memory and Superelastic Technologies, USA, 2003, pp. 357–368,
(2003).
[25] S.A. Shabalovskaya, G.C. Rondelli, A.L. Undisz, J.W. Anderegg, T.D. Burleigh and
M.E. Rettenmayr, “The Electrochemical Characteristics of Native Nitinol Surfaces,”
Biomaterials, 30, 3662-71, (2009).
[26] A. Michiardi, C. Aparicio, J.A. Planell and F.J. Gil, “New Oxidation Treatment of
NiTi Shape Memory Alloys to Obtain Ni-free Surfaces and to Improve Biocompatibility,”
J. Biomed. Mater. Res., 77, 249-256, (2006).
[27] D. Vojtech, P. Novak, M. Novak, L. Joska, T. Fabian, J. Maixner and V. Machovic,
“Cyclic and Isothermal Oxidations of Nitinol Wire at Moderate Temperatures,”
Intermetallics, 16, 424-31, (2008).
[28] S.D. Plant, D.M. Grant and L. Leach, “Behaviour of Human Endothelial Cells on
Surface Modified NiTi Alloy,” Biomaterials, 26, 5359-67, (2005).
[29] A.W. Hassel, L. Neelakantan, A. Zelenkevych, A. Ruh and M. Spiegel, “Selective
De-alloying of NiTi by Oxochloridation,” Corros. Sci., 50, 1368-75, (2008).
[30] L. Neelakantan, S. Swaminathan, M. Spiegel, G. Eggeler and A.W. Hassel,
“Selective Surface Oxidation and Nitridation of NiTi Shape Memory Alloys by Reduction
Annealing,” Corros. Sci., 51, 635-41, (2009).
[31] S.A. Shabalovskaya and J.W. Anderegg, ”Surface Spectroscopic Characterization
of TiNi Nearly Equiatomic Shape Memory Alloys for Implants,” J. Vac. Sci. Technol. A,
13, 2624-32, (1995).
[32] D. Aslanidis, G. Roebben, J. Bruninx and W. Van Moorleghem, “Electropolishing
for medical devices: Relatively new... fascinatingly diverse,” in SMST-SMM 2001, 394-
395, 169-72. (2002).
[33] H. Aihara, Surface and Biocompatibility Study of Electropolished Co-Cr Alloy L605,
Masters Thesis, San Jose State University, San Jose, California (2009).
[34] D.V. Ragone, Thermodynamics of Materials, (John Wiley & Sons, Inc. New York,
United States, Vol. 1, 0-471-30885-4, 1994).
[35] F.J. Gil, E. Solano, A. Campos, F. Boccio, I. Sáez, M.V. Alfonso and J.A. Planell.
“Improvement of the Friction Behaviour of NiTi Orthodontic Archwires by Nitrogen
Diffusion,” Bio. med. Mater. Eng., 8, 335, (1998).

92
[36] F.J. Gil, E. Solano, A. Mendoza and J. Pena, “Inhibition of Ni Release From NiTi
and NiTiCu Orthodontic Archwires by Nitrogen Diffusion Treatment,” J. Appl. Biomater.
Biom., 2, 151-155(2004).
[37] D. Starosvetsky and I. Gotman, “TiN Coating Improves the Corrosion Behavior of
Superelastic NiTi Surgical Alloy,” Surf. Coat. Tech., 148, 268-76, (2001).
[38] D. Starosvetsky and I. Gotman, “Corrosion Behavior of TiN Coated Ni-Ti Shape
Memory Surgical Alloy,” Biomaterials, 22, 1853-1859, (2001).
[39] G. Zorn, R. Adadi, R. Brener, V.A. Yakovlev, I. Gotman, E.Y. Gutmanas and C.N.
Sukenik, “Tailoring the Surface of NiTi Alloy Using PIRAC Nitriding Followed by
Anodization and Phosphonate Monolayer Deposition,” Chem. Mater., 20, (2008).
[40] Z.D. Cui, H.C. Man and X.J. Yang, “Characterization of the Laser Gas Nitrided
Surface of NiTi Shape Memory Alloy,” Appl. Surf. Sci., 208, 388-393, (2003).
[41] N.Q. Zhao, H.C. Man, Z.D. Cui and X.J. Yang, “Structure and Wear Properties of
Laser Gas Nitrided NiTi Surface,” Surf. Coat. Tech., 200, 4879-4884. (2006).
[42] J.L. Murray, “ Ni-Ti (Nickel – Titanium) Binary Phase Diagram,”ASM International.
“ASM Metals Handbook,” vol.3, pp. 1242 (1995).

93
APPENDIX A THERMODYNAMIC CALCULATIONS
Ti + 1/2 O2 TiO
(600 K < T < 2000 K)
(1150 K < T < 1264 K)
(1264 K < T < 1800 K)
Ti + 3/4 O2 ½ Ti2O3
(298 K < T < 1150 K)
(1150 K < T < 1264 K)
(1264 K < T < 1800 K)
Ti + 5/6 O2
1/3 Ti3O5
(298 K < T < 1150 K)
(1150 K < T < 1264 K)
(1264 K < T < 1800 K)
Ti + O2 TiO2
(298 K < T < 1150 K)
(1150 K < T < 1800 K)

94
Ni + 1/2 O2 NiO
(298 K < T < 525 K)
(525 K < T < 565 K)
(565 K < T < 633 K)
(633 K < T < 1725 K)
Ti + 1/2 N2 TiN
(298 K < T < 1150 K)
(1150 K < T < 1800 K)
Table A-1. Calculated
values for NiO, TiO, Ti2O3, Ti3O5, TiO2 and TiN
T (K) Standard Gibbs free energy of formation (kJ/mol)
NiO TiO Ti2O3 Ti3O5 TiO2 TiN
298 -215.19 -489.11 -711.81 -769.41 -888.68 -308.09
400 -205.14 -475.09 -698.92 -755.14 -869.85 -298.61
500 -195.29 -469.65 -686.02 -740.86 -851.86 -289.32
600 -185.43 -460.24 -673.12 -726.59 -833.87 -280.04
700 -175.58 -450.62 -660.22 -712.32 -815.67 -270.75
800 -165.73 -441.41 -647.33 -698.05 -798.1 -261.46
900 -155.87 -432.21 -634.43 -683.78 -780.53 -252.17
1000 -146.02 -423 -621.53 -669.51 -762.95 -242.88
1100 -136.17 -413.8 -608.64 -655.24 -744.75 -233.59
1200 -126.31 -404.59 -595.74 -640.97 -727.56 -224.18
1300 -116.46 -395.39 -582.84 -626.7 -709.4 -214.67
1400 -106.61 -387.02 -569.94 -612.43 -692.24 -205.16
1500 -96.755 -378.02 -557.05 -598.16 -674.46 -195.65
1600 -86.902 -369.66 -544.15 -583.88 -657.93 -186.15
1700 -77.048 -361.5 -531.25 -569.61 -640.57 -176.64
1800 -66.467 -354.59 -518.36 -555.34 -624.88 -167.13

95
Table A-2. Gibbs free energy of formation of TiN as a function of thermodynamic
activity of Ti and temperature.
Temperature
(K) 400 600 800 1000 1200 1400
Gibbs free energy of formation of TiN (kJ/mol)
Ther
modynam
ic A
ctiv
ity o
f T
i
0.0001 -245.01 -199.63 -154.25 -108.88 -63.372 -17.554
0.1001 -290.95 -268.55 -246.14 -223.74 -201.21 -178.36
0.2001 -293.26 -272.01 -250.75 -229.5 -208.12 -186.43
0.3001 -294.61 -274.03 -253.45 -232.87 -212.17 -191.15
0.4001 -295.56 -275.46 -255.36 -235.26 -215.04 -194.5
0.5001 -296.31 -276.58 -256.85 -237.12 -217.26 -197.09
0.6001 -296.91 -277.49 -258.06 -238.63 -219.08 -199.22
0.7001 -297.43 -278.26 -259.09 -239.92 -220.62 -201.01
0.8001 -297.87 -278.92 -259.97 -241.03 -221.95 -202.56
0.9001 -298.26 -279.51 -260.76 -242.01 -223.13 -203.94
1 -298.61 -280.04 -261.46 -242.88 -224.18 -205.16

96
APPENDIX B DETERMINATION OF THE ION ETCH RATE BY AFM
The ion etch rate was measured at 12 points for three different ion etching times,
200, 700, and 1,100 s of 3 kV argon ion etch on TiN, yielding a total of 36 points. The
ion etch rate was determined to be 0.91 nm/s for 3kV argon ion etching with a standard
deviation of 0.12 nm/s. Atomic force microscopy images from the surface topography
images and the transverse section images from the surface of the Nitinol specimens are
presented in Figures B-1 to B-6. The step height of the ion etched region was measured
and the average ion etch rate was determined. Step heights values and the ion etch rate
values are presented in Tables B-1 and B-2.

97
Figure B-1. Topography of the surface of the nitrided specimen, ion etched for 200 s.

98
Figure B-2. Transverse section and the measured step height from 12 points on the
surface of nitrided specimen, ion etched for 200 s.

99
Figure B-3. Topography of the surface of the nitrided specimen, ion etched for 700 s.

100
Figure B-4. Transverse section and the measured step height from 12 points on the
surface of nitrided specimen, ion etched for 700 s.
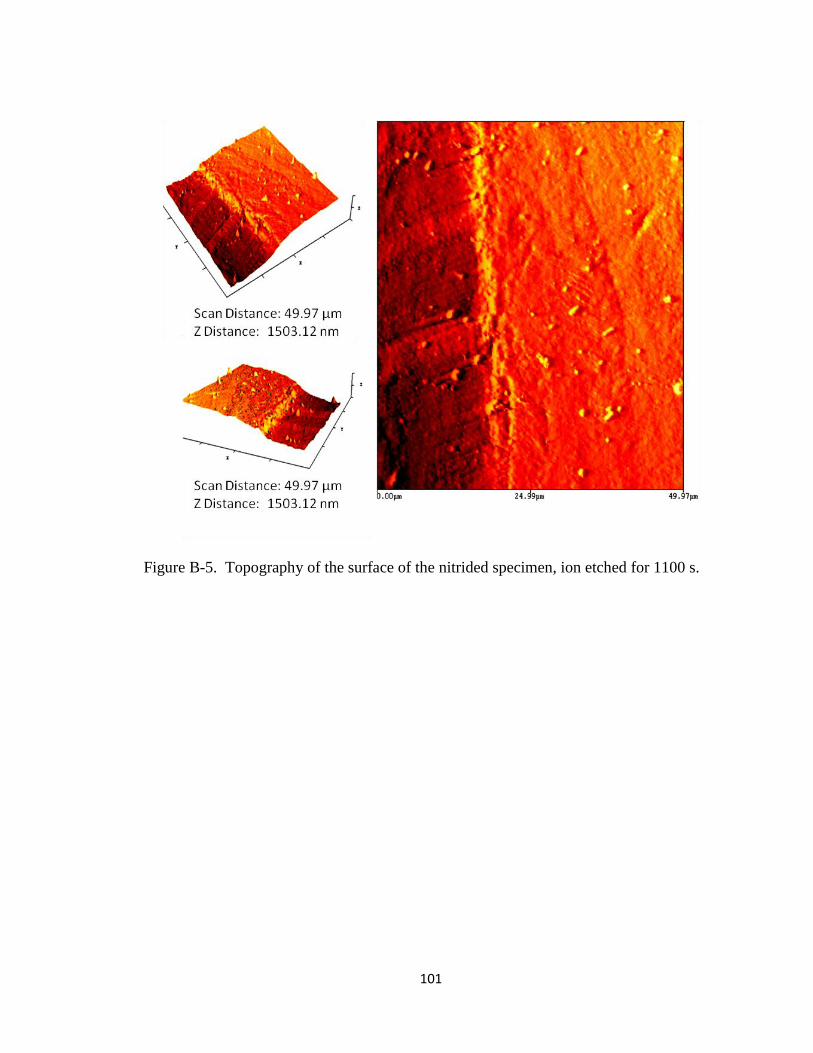
101
Figure B-5. Topography of the surface of the nitrided specimen, ion etched for 1100 s.

102
Figure B-6. Transverse section and the measured step height from 12 points on the
surface of nitrided specimen, ion etched for 1100 s.

103
Table B-1. Step heights, measured by AFM.
Step Height
Data point Data Points From
200 s of ion etch
Data Points From
700 s of ion etch
Data Points From
1100 s of ion etch
1 112.04 597.55 790.00
2 149.57 622.62 811.32
3 167.11 653.74 815.25
4 171.17 667.60 884.46
5 181.72 679.66 891.65
6 183.79 680.86 910.90
7 186.91 681.21 911.01
8 188.32 681.62 912.86
9 207.90 697.97 939.78
10 210.25 714.92 940.04
11 229.54 734.91 964.86
12 265.86 812.65 982.43
Mean 187.81 685.83 894.87
Std. dev. 40.87 57.20 64.53
Median 183.79 680.86 910.00
Table B-2. Calculated values for ion etch rate.
Ion Etch Rate (nm/s)
Data Points
From 200 s of
ion etch
Data Points
From 700 s of
ion etch
Data Points
From 1100 s of
ion etch
Average
Mean 0.94 0.98 0.81 0.91
Std. dev. 0.20 0.08 0.06 0.11
Median 0.92 0.97 0.83 0.91

104
APPENDIX C XPS ANALYSIS
C.1 Mechanically Polished Specimens
Fig
ure
C-1
. X
-ray
photo
elec
tron s
pec
trosc
opy d
epth
pro
file
of
the
mec
han
ical
ly p
oli
shed
spec
imen
,
w
ashed
wit
h D
I w
ater
and a
ir d
ried
.

105
Fig
ure
C-2
. X
-ray
photo
elec
tron s
pec
trosc
opy h
igh r
esolu
tion s
cans
of
the
mec
han
ical
ly p
oli
shed
sp
ecim
en, w
ash
ed w
ith D
I w
ater
and a
ir d
ried
.

106
Fig
ure
C-3
. X
-ray
photo
elec
tron s
pec
trosc
opy d
epth
pro
file
of
the
mec
han
ical
ly p
oli
shed
spec
imen
,
w
ashed
wit
h d
eaer
ated
DI
wat
er a
nd a
rgon d
ried
.

107
Fig
ure
C-4
. X
-ray
photo
elec
tron s
pec
trosc
opy h
igh r
esolu
tion s
cans
of
the
mec
han
ical
ly p
oli
shed
sp
ecim
en, w
ash
ed w
ith d
eaer
ated
DI
wat
er a
nd a
rgon d
ried
.

108
C.2 Specimens Nitrided in 96% N2 + 4% H2
Fig
ure
C-5
. X
-ray
photo
elec
tron s
pec
trosc
opy d
epth
pro
file
of
the
spec
imen
nit
rided
in 9
6%
N2 +
4%
H2
at
8
00
oC
for
30 m
in.

109
Fig
ure
C-6
. X
-ray
photo
elec
tron s
pec
trosc
opy h
igh r
esolu
tion s
cans
of
the
spec
imen
nit
rided
in 9
6%
N2 +
4
% H
2 a
t 80
0oC
for
30 m
in.

110
Fig
ure
C-7
. X
-ray
photo
elec
tron s
pec
trosc
opy d
epth
pro
file
of
the
spec
imen
nit
rided
in 9
6%
N2 +
4%
H
2 a
t 900
oC
for
20 m
in.

111
Fig
ure
C-8
. X
-ray
photo
elec
tron s
pec
trosc
opy h
igh r
esolu
tion s
cans
of
the
spec
imen
nit
rided
i
n 9
6%
N2 +
4%
H2
at
900
oC
for
20 m
in.

112
Fig
ure
C-9
. X
-ray
photo
elec
tron s
pec
trosc
opy d
epth
pro
file
of
the
spec
imen
nit
rided
in 9
6%
N2 +
4%
H2
at
900
oC
for
30 m
in.
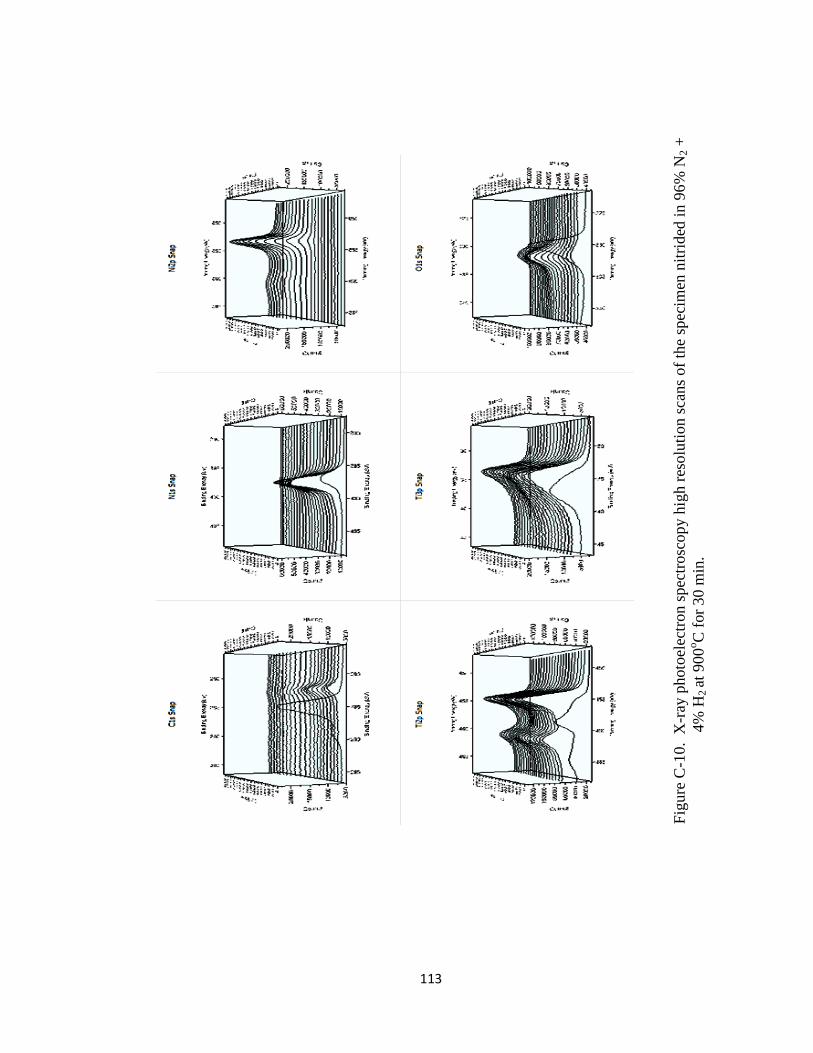
113
Fig
ure
C-1
0. X
-ray
photo
elec
tron s
pec
trosc
opy h
igh r
esolu
tion s
cans
of
the
spec
imen
nit
rided
in 9
6%
N2 +
4
% H
2 a
t 900
oC
for
30 m
in.

114
Fig
ure
C-1
1. X
-ray
photo
elec
tron s
pec
trosc
opy d
epth
pro
file
of
the
spec
imen
nit
rided
in 9
6%
N2 +
4%
H2
at
1
000
oC
for
10 m
in.

115
Fig
ure
C-1
2. X
-ray
photo
elec
tron s
pec
trosc
opy h
igh r
esolu
tion s
cans
of
the
spec
imen
nit
rided
in 9
6%
N2 +
4%
H2
at
1000
oC
for
10 m
in.

116
Fig
ure
C-1
3. X
-ray
photo
elec
tron s
pec
trosc
opy d
epth
pro
file
of
the
spec
imen
nit
rided
in 9
6%
N2 +
4%
H2
at
1
000
oC
for
20 m
in.

117
Fig
ure
C-1
4. X
-ray
photo
elec
tron s
pec
trosc
opy h
igh r
esolu
tion s
cans
of
the
spec
imen
nit
rided
in 9
6%
N2 +
4%
H
2 a
t 1000
oC
for
20 m
in.

118
Fig
ure
C-1
5. X
-ray
photo
elec
tron s
pec
trosc
opy d
epth
pro
file
of
the
spec
imen
nit
rided
in 9
6%
N2 +
4%
H2
at
1
000
oC
for
30 m
in.

119
Fig
ure
C-1
6. X
-ray
photo
elec
tron s
pec
trosc
opy h
igh r
esolu
tion s
cans
of
the
spec
imen
nit
rided
in 9
6%
N2 +
4%
H
2 a
t 1000
oC
for
20 m
in.

120
C.3 Specimens Nitrided in 95% N2 + 5% NH3
Fig
ure
C-1
7. X
-ray
photo
elec
tron s
pec
trosc
opy d
epth
pro
file
of
the
spec
imen
nit
rided
in 9
5%
N2 +
5%
NH
3 a
t
500
oC
for
5 m
in.

121
Fig
ure
C-1
8. X
-ray
photo
elec
tron s
pec
trosc
opy h
igh r
esolu
tion s
cans
of
the
spec
imen
nit
rided
in 9
5%
N2 +
5%
NH
3
at
500
oC
for
5 m
in.

122
Fig
ure
C-1
9. X
-ray
photo
elec
tron s
pec
trosc
opy d
epth
pro
file
of
the
spec
imen
nit
rided
in 9
5%
N2 +
5%
NH
3 a
t 675
oC
fo
r 5 m
in.

123
Fig
ure
C-2
0. X
-ray
photo
elec
tron s
pec
trosc
opy h
igh r
esolu
tion s
cans
of
the
spec
imen
nit
rided
in 9
5%
N2 +
5%
NH
3
a
t 675
oC
for
5 m
in.

124
C.4 Oxidized Specimens
Fig
ure
C-2
1. X
-ray
photo
elec
tron s
pec
trosc
opy d
epth
pro
file
of
the
spec
imen
oxid
ized
in a
ir a
t 67
5oC
for
30
m
in.

125
Fig
ure
C-2
2. X
-ray
photo
elec
tron s
pec
trosc
opy h
igh r
esolu
tion s
cans
of
the
spec
imen
oxid
ized
in a
ir a
t 675
oC
for
30 m
in.

126
Fig
ure
C-2
3. X
-ray
photo
elec
tron s
pec
trosc
opy d
epth
pro
file
of
the
spec
imen
oxid
ized
in a
ir a
t 70
0oC
for
60
m
in.

127
Fig
ure
C-2
4. X
-ray
photo
elec
tron s
pec
trosc
opy h
igh r
esolu
tion s
cans
of
the
spec
imen
oxid
ized
in a
ir a
t 675
oC
for
3
0 m
in.

128
C.5 Nitrided and Oxidized Specimens
Fig
ure
C-2
5. X
-ray
photo
elec
tron s
pec
trosc
opy
dep
th p
rofi
le o
f th
e sp
ecim
en n
itri
ded
in 9
5%
N2 +
5%
NH
3 a
t
675
oC
for
5 m
in a
nd o
xid
ized
in a
ir a
t 675
oC
for
30 m
in.

129
Fig
ure
C-2
6. X
-ray
photo
elec
tron s
pec
trosc
opy h
igh r
esolu
tion s
cans
of
the
spec
imen
nit
rided
in 9
5%
N2
+
5%
NH
3 a
t 675
oC
for
5 m
in a
nd o
xid
ized
in a
ir a
t 675
oC
for
30 m
in.

130
Fig
ure
C-2
7. X
-ray
photo
elec
tron s
pec
trosc
opy d
epth
pro
file
of
the
spec
imen
nit
rided
in 9
6%
N2 +
4%
H2 a
t
1000
oC
fo
r 20 m
in a
nd o
xid
ized
in a
ir a
t 700
oC
for
60 m
in.

131
Fig
ure
39. A
n o
ver
vie
w o
f su
rfac
e tr
eatm
ent
pro
cess
es o
n t
he
Nit
inol
spec
imen
s.
Fig
ure
C-2
8. X
-ray
photo
elec
tron s
pec
trosc
opy h
igh r
esolu
tion s
cans
of
the
spec
imen
nit
rided
in 9
6%
N2
+
4%
H2 a
t 1000
oC
for
20 m
in a
nd o
xid
ized
in a
ir a
t 700
oC
for
60 m
in.