Microbial Ecology and Controlling Microbial Growth Module 5.

Surface microbial ecology, food safety and horticulture production assessment of pear fruit (Pyrus communis)
By
FRANCOIS JAMES DUVENAGE
Thesis submitted in partial fulfilment of the requirements for the degree of
MASTER OF SCIENCE
In the
Department of Plant Sciences
Faculty of Natural and Agricultural Sciences
University of Pretoria
South Africa
January 2016
Supervisor: Prof. L. Korsten

i
DECLARATION
I, Francois James Duvenage, declare that the thesis, which I hereby submit for the degree Master Science: Plant Pathology at the University of Pretoria, is my own work and has not previously been submitted by me for a degree at this or any other tertiary institution.
__________________________
Francois James Duvenage
January 2016

ii
TABLE OF CONTENTS
LIST OF ABBREVIATIONS ...................................................................................... v LIST OF TABLES ....................................................................................................... vi LIST OF FIGURES .................................................................................................... vii AKNOWLEDGEMENTS ........................................................................................... ix ABSTRACT .................................................................................................................. 1 CHAPTER 1 .................................................................................................................. 2 GENERAL INTRODUCTION
REFERENCES ........................................................................................................... 4
CHAPTER 2 .................................................................................................................. 6 POSTHARVEST BACTERIAL QUALITY AND SAFETY OF PEARS
1. INTRODUCTION ............................................................................................... 6
2. MICROBIAL CONSIDERATIONS WITHIN PEAR PRODUCTION ............. 7
2.1. POTENTIAL HAZARDS ................................................................................ 9
2.2. FOODBORNE PATHOGENS ...................................................................... 10
2.3. DETECTION OF FOODBORNE PATHOGENS ......................................... 17
3. FOOD SAFETY ................................................................................................ 18
4. FOOD SAFETY MANAGEMENT SYSTEMS ............................................... 19
5. CONCLUSION ................................................................................................. 22
6. REFERENCES .................................................................................................. 22
CHAPTER 3 ................................................................................................................ 33 COLONISATION AND SURIVIVAL OF FOUR MAJOR BACTERIAL
FOODBORNE PATHOGENS ON PEAR FRUIT (cv. FORELLE) SURFACES
ABSTRACT ................................................................................................................. 33
1. INTRODUCTION ............................................................................................. 34
2. MATERIALS AND METHODS ...................................................................... 36
2.1. CULTURES ................................................................................................... 36
2.2. FRUIT ............................................................................................................ 36
2.3. INOCULATION AND STORAGE OF FRUIT ............................................ 37
2.4. METHODOLOGY FOR QUANTIFICATION OF MICROORGANISMS . 37
2.5. SCANNING ELECTRON MICROSCOPY .................................................. 37

iii
2.6. STATISTICAL ANALYSIS ......................................................................... 38
3. RESULTS .......................................................................................................... 38
3.1. PEAR FRUIT SURFACE NEGATIVE CONTROL ..................................... 38
3.2. ESCHERICHIA COLI O157:H7 .................................................................... 41
3.3. LISTERIA MONOCYTOGENES .................................................................... 41
3.4. SALMONELLA ENTERICA SUBSP. ENTERICA SEROVAR TYPHIMURIUM ...................................................................................................... 43
3.5. STAPHYLOCOCCUS AUREUS .................................................................... 43
4. DISCUSSION .................................................................................................... 43
5. CONCLUSION ................................................................................................. 47
6. REFERENCES .................................................................................................. 47
CHAPTER 4 ................................................................................................................ 53 BACTERIAL BIOMES AND DETECTION OF FOODBORNE PATHOGENS
ON PEAR (cv PACKHAM’S TRIUMPH) FRUIT IN THE SUPPLY CHAIN
ABSTRACT ................................................................................................................. 53
1. INTRODUCTION ............................................................................................. 54
2. MATERIALS AND METHODS ...................................................................... 55
2.1. SAMPLING STRATEGY ............................................................................. 55
2.2. LABORATORY STRATEGY ...................................................................... 57
3. RESULTS .......................................................................................................... 60
3.1. PEAR SURFACE TEMPERATURES AT HARVEST ................................ 60
3.2. MICROBIAL QUALITY AND SAFETY OF PEARS ................................. 60
4. DISCUSSION .................................................................................................... 65
5. CONCLUSION ................................................................................................. 69
6. REFERENCES .................................................................................................. 70
CHAPTER 5 ................................................................................................................ 76 ASSESSMENT OF FOOD SAFETY MANAGEMENT SYSTEMS ON PEAR
PRODUCTION FARMS IN THE WESTERN CAPE PROVINCE
ABSTRACT ................................................................................................................. 76
1. INTRODUCTION ............................................................................................. 77
2. METHODOLOGY ............................................................................................ 78
2.1. FARMER SURVEY AND DATA COLLECTION ...................................... 78
2.2. FOOD SAFETY MANAGEMENT SYSTEM .............................................. 78

iv
2.3. ASSESSMENT OF CONTEXT CHARACTERISTICS ............................... 79
2.4. ASSESSMENT OF CORE SAFETY CONTROL ACTIVITIES ................. 80
2.5. ASSESSMENT CORE ASSURANCE ACTIVITIES .................................. 81
2.6. ASSESSMENT OF FOOD SAFETY PERFORMANCE ............................. 82
3. RESULTS AND DISCUSSION ........................................................................ 82
3.1. ASSESSMENT OF CONTEXT CHARACTERISTICS (PART I) .............. 82
3.2. ASSESSMENT OF CORE SAFETY CONTROL ACTIVITIES (PART II) 84
3.3. ASSESSMENT OF CORE ASSURANCE ACTIVITIES (PART III) ......... 88
3.4. ASSESSMENT OF FOOD SAFETY PERFORMANCE (PART IV) .......... 90
4. CONCLUSION ................................................................................................. 94
5. REFERENCES .................................................................................................. 95
CHAPTER 6 ................................................................................................................ 97 GENERAL DISCUSSION AND CONCLUSION
REFERENCES ....................................................................................................... 100
APPENDIX 1 ............................................................................................................ 103 APPENDIX 2 ............................................................................................................ 104 APPENDIX 3 ............................................................................................................ 105

v
LIST OF ABBREVIATIONS
CA ................................ Controlled atmosphere
CDC ............................. Centres for Disease Control and Prevention
CFU ............................. Colony forming unit
CPC .............................. Crop Protection Compendium
DAFF ........................... Department of Agriculture, Forestry and Fisheries of South Africa
DoH ............................. Department of Health
EU ................................ European Union
FAO ............................. Food and Agriculture Organisation
FDA ............................. United States of America’s Food and Drug Administration
FSART ......................... Food Safety Rapid Response Team
FSI ............................... Food Safety Initiative
FSMS ........................... Food Safety Management System
GAP ............................. Good Agricultural Practices
HACCP ........................ Hazard Analysis Critical Control Point
HSMS .......................... Horticulture Safety Management System
INFOSAN .................... International Network of Food Safety Authorities
ISO ............................... International Standards Organization
MID ............................. Minimum infectious dose
PPECB ......................... Perishable Products Export Control Board
RASFF ......................... Rapid Alert System for Food and Feed
SA ................................ South Africa
SABS ........................... South African Bureau of Standards
SEM ............................. Scanning electron microscopy
USA ............................. United States of America
USA EPA ..................... United States Environmental Agency
WHO ............................ World Health Organisation

vi
LIST OF TABLES
TABLE 2.1. Top ten South African pear export destinations (2011-2013) ....................... 7
TABLE 2.2. Bacterial microorganisms typically associated with foodborne diseases ....... 11
TABLE 2.3. Global food safety standards and management systems incorporated in the
fresh food industries ..................................................................................... 20
TABLE 3.1. Escherichia coli O157:H7, Listeria monocytogenes, Salmonella enterica
subsp. enterica serovar Typhimurium and Staphylococcus aureus growth
on pear surfaces over a period of seven days in cold storage conditions
(5°C) following inoculation with a high and low concentration inoculum,
respectively .................................................................................................. 40
TABLE 4.1. Primers for specific detection of human pathogens and identification
through 16S .................................................................................................. 59
TABLE 5.1. The mean ratings of five farms on all assessments contributing to the mean
food safety risk output ................................................................................. 85

vii
LIST OF FIGURES
FIGURE 3.1. Escherichia coli O157:H7, Listeria monocytogenes, Salmonella enterica
subsp. enterica serovar Typhimurium and Staphylococcus aureus
growth trends on pear surfaces over a period of seven days in cold storage
conditions (5°C) following inoculation with a high concentration
inoculum ...................................................................................................... 39
FIGURE 3.2. Electron micrograph of the pear surfaces (x4 500 magnification). .............. 40
FIGURE 3.3. Scanning electron micrographs of Escherichia coli O157:H7 at various
time intervals ................................................................................................ 41
FIGURE 3.4. Scanning electron micrographs of Listeria monocytogenes at various time
intervals ........................................................................................................ 42
FIGURE 3.5. Scanning electron micrographs of Salmonella enterica subsp. enterica
serovar Typhimurium at various time intervals ........................................... 42
FIGURE 3.6. Scanning electron micrographs of Staphylococcus aureus at various time
intervals ........................................................................................................ 44
FIGURE 4.1. Multiple approach workflow ........................................................................ 56
FIGURE 4.2. Aerobic bacterial and coliform total viable counts on pear fruit surfaces,
over two consecutive production seasons of four farms and central
packhouse in the Western Cape Province (2013 – 2014) ............................ 61
FIGURE 4.3. Isolated dominant bacterial microorganisms identified from pear fruit
surfaces ........................................................................................................ 63
FIGURE 4.4. Phylogenetic tree based on dominant bacterial isolates’ 16S rDNA
sequences, constructed using the Neighbor-Joining methodology with
allocated bootstraps ...................................................................................... 64
FIGURE 5.1. Assessment of product and production as well as organisation and chain
characteristics from Farm 1 (A), Farm 2 (B), Farm 3 (C), Farm 4 (D) and
Farm 5 (E) The overall average assessment level of each farm and
combined farms (F). ..................................................................................... 86
FIGURE 5.2. Assessment of control activities design from Farm 1(A), Farm 2(B), Farm
3 (C), Farm 4 (D) and Farm 5 (E) The overall average assessment level
of each farm and combined farms (F). ......................................................... 87

viii
FIGURE 5.3. Assessment of control activities operation of Farm 1 (A), Farm 2 (B),
Farm 3 (C), Farm 4 (D) and Farm 5(E). The overall average assessment
level of each farm and combined farms (F). ................................................ 92
FIGURE 5.4. Assessment of food safety performance, external and internal food safety
performance indicators of Farm 1 (A), Farm 2 (B), Farm 3 (C), Farm 4
(D) and Farm 5 (E). The overall average assessment level of each farm
and combined farms (F). .............................................................................. 93

ix
AKNOWLEDGEMENTS
I would like to thank the Heavenly Father for the strength and wisdom in the planning,
execution and writing up of the study.
Furthermore I would also like to thank my family for their prayers, solid foundation, endless
love and support. Words cannot express how grateful I am to my mother and father, mother-
in-law and my father-in-law, for all of the sacrifices that they’ve made on my behalf.
I would like to thank Dr Erika du Plessis for her friendship, assistance and guidance with
this study. I would also like to thank all of my friends and colleagues who supported me
during the writing stages, and motivated me to strive towards my end goal.
I would like to express my appreciation and thanks to my advisor Professor Lise Korsten,
you have been a tremendous mentor for me. I would like to thank you for encouraging me
to do the project and for allowing me to grow as a scientist. Your advice in terms of both
research as well as on my career path have been priceless.
The research was funded and supported in part by the Department of Science and
Technology in partnership with the Fresh Produce Exporters’ Forum, Post-harvest
Innovation Programme as well as by the Water Research Commission of South Africa of the
solicited Water Research Commission research project (K5/1875/4): “An investigation into
the link between water quality and microbiological safety of fruit and vegetables from the
farming to the processing stages of production and marketing”.
At the end I would like express gratitude to my beloved wife Stacey for her love and kindness
she has shown during the time it has taken me to finalize this thesis. For the sleepless nights
and for always being my support in the moments when there was no one to answer my
queries.
To my son, Luke Alexander Duvenage,
“Consult not your fears but your hopes and your dreams. Think not about your frustrations,
but about your unfulfilled potential. Concern yourself not with what you tried and failed
in, but with what it is still possible for you to do.” - Pope John XXIII
“If a man does not know to what port he is sailing, no wind is favorable.” - Seneca

1
ABSTRACT
Title: Surface microbial ecology, food safety and horticulture production assessment
of pear fruit (Pyrus communis)
The World Health Organisation promotes increased consumption of fresh fruit and
vegetables to address global health and nutritional challenges. Pome fruit are widely
consumed and contribute to a healthy diet, therefore represent an important traded product.
The South African pear export industry is ranked as one of the top ten international exporters
of fresh fruit. The importance of retaining market access is thus important and compliance
with international food safety requirements is essential. To the authors knowledge this is
the first supply chain study that is focused on the microbial quality and safety of fresh pears
in the postharvest environment. The findings in this study aid in a better understanding of
the microbial dynamics of the fruit surface (carpoplane) and the microbial population shifts
due to postharvest practices. Current national guidelines for ready-to-eat fresh produce place
emphasis on bacterial loads and absence of selected foodborne pathogens. Escherichia coli
O157:H7, Listeria monocytogenes, Salmonella enterica subsp. enterica serovar
Typhimurium and Staphylococcus aureus were demonstrated to attach, replicate and survive
on the pear carpoplane. However, on market-ready pears these foodborne pathogens were
not detected. Analysis of the carpoplane dominant bacterial populations reflected both
harmful as well as beneficial residential bacteria that are known to either have the potential
to affect human or plant health, respectively. The study provides an overview of the pear
bacterial biome and this information can be used in future regulatory adjustments for food
safety assurance. An assessment of the current industry wide food safety management
practices reveal that not all aspects of the food safety assurance systems have been
effectively implemented at an appropriate level.
Supervisor: Prof. L. Korsten
Co supervisor: Dr. E. M. du Plessis

2
CHAPTER 1
GENERAL INTRODUCTION
South Africa export around 197 911 tons of pears annually [Perishable Products Export
Control Board (PPECB), 2013] with 28% importing market share in the Netherlands
(Department of Agriculture, Forestry and Fisheries, 2011). The South African pear export
industry is considered the sixth largest in the world (PPECB, 2013). In order to retain the
competitive edge in these international markets it is essential to assure full food safety
compliance. A report by the Centres for Disease Control and Prevention (2013) stated that
a proper risk analysis and microbial surveillance is needed, which includes determining the
microbial load, profile and naturally occurring organisms, as well as determining the
possible prevalence of human pathogens on fresh produce.
The number of foodborne disease outbreaks has been on the increase due to greater
consumption and more extensive supply chains of fresh and raw fruit and vegetables
(Beuchat, 2002; Brackett, 1999; Freshfel, 2013). South African Registry for the Food Safety
Profession conducted a country-wide survey to determine the food safety health status of
South African food. They found that in 2011 an estimated 16 million people were affected
by foodborne illnesses and of these cases, 37 000 deaths were associated with diarrheal
symptoms and waterborne pathogens (Petersen, 2011). Foodborne human pathogenic
microorganisms accounted for contamination of fruit and vegetables globally causing
outbreaks associated with Escherichia coli O157:H7, Listeria monocytogenes, Salmonella
enterica subsp. enterica serovar Typhimurium and to a lesser extent Staphylococcus aureus
(Batz et al., 2012; Buck et al., 2003; Nguyen, 2012; Olaimat & Holley, 2012).
Sources of foodborne pathogen contamination can occur at any point within the supply chain
(Brackett, 1999; De Roever, 1998), therefore increasing the probability that consumers could
be exposed to foodborne pathogenic microorganisms (Lammerding & Paoli, 1997). Supply
chain management with proper food safety systems decreases the risk of foodborne pathogen
exposure to the consumer. South Africa’s pear export industry implemented internationally
recognised good agricultural practices (GLOBAL-GAP) and has retained their certification
status for most exporters. Good management practices include appropriate control measures
to avoid contamination of the product by pathogenic (of plant and human origin) organisms
along the supply chain (Hanning et al., 2009).

3
The microbial balance on the fruit surface is characterised by a natural or residential
bacterial, fungal and yeast population. These microbes are in constant interaction and
contribute to the ecological stability of the micro environment (Leben, 1965). The constant
competition provides a protective microbial barrier for the fruit surface (carpoplane) against
foreign introduced pathogens with the potential to either cause foodborne disease outbreaks
and illness or food spoilage (Barth et al., 2010). This living carpoplane microflora
(microbiome) is constantly evolving. Janisiewicz and Buyer (2010) concluded that it is
therefore important to consider different sampling time intervals within the supply chain.
Other factors that contributes to a population shift and favour disease development should
also be kept in mind, such as favourable/unfavourable microbial environmental conditions
and/or fruit surface wounding (Barth et al., 2010).
Proper hazard assessment of fresh produce with on-farm production practices determines
and drives the establishment of adequate food safety management system (FSMS) levels.
Lunning et al. (2013) with adapted focus points by Kirezieva et al. (2013) developed a
horticulture FSMS diagnostic tool. The functionality of the diagnostic tool determines the
hazard risk levels in the overall production management, and indicate areas within the
system that could be improved to decrease the overall risk of possible produce contamination
by pathogenic microbial organisms.
The objective of this study was to define the status of a healthy pear carpoplane, through an
in depth microbial food safety analysis, bacterial ecology assessment and an overall FSMS
assessment. Firstly an inoculation experiment would determine the ability of the important
and selected foodborne pathogen’s to attachment and colonise the pear fruit surfaces. In
addition, a cold chain simulation focusses on the effect of temperature on the growth rate
and survival of the selected foodborne pathogens. A pear supply chain case study will be
done to assess the food safety assurance status within the South African pear production
industry and to determine presence or absence of foodborne pathogens within the system.
To further fill the gap in knowledge, culturable dominant bacterial species on the healthy
pear carpoplane was determined to propose the biota of a healthy fruit environment. Lastly
the assessment of the FSMS further allowed recommendations to be made to producers
allowing better implementation of food safety methods and to strengthen
international/domestic pear trade within South Africa.

4
The outcome of this study seeks to add to the current knowledge base of the bacterial
microflora status and safety of pears in the fruit chain.
REFERENCES
Barth, M., Hankinson, T. R., Zhuang, H. & Breidt, F. (2010). Microbiological spoilage of
fruits and vegetables. In Compendium of the Microbiological Spoilage of Foods and
Beverages (pp. 135-183). Springer New York.
Batz, M. B., Hoffmann, S. & Morris Jr, J. G. (2012). Ranking the disease burden of 14
pathogens in food sources in the United States using attribution data from outbreak
investigations and expert elicitation. Journal of Food Protection, 75(7), 1278-1291.
Beuchat, L. R. (2002). Ecological factors influencing survival and growth of human
pathogens on raw fruits and vegetables. Microbes and Infection, 4(4), 413-423.
Brackett, R. (1999). Incidence, contributing factors, and control of bacterial pathogens in
produce. Postharvest Biology and Technology, 15(3), 305-311.
Buck, J. W., Walcott, R. R. & Beuchat, L. R. (2003). Recent trends in microbiological safety
of fruits and vegetables. Plant Health Progress, 10, 1094.
Centres for Disease Control and Prevention. (2013). Incidence and trends of infection with
pathogens transmitted commonly through food-foodborne diseases active surveillance
network, 10 US sites, 1996-2012. MMWR. Morbidity and Mortality Weekly Report,
62(15), 283.
Department of Agriculture, Forestry and Fisheries. (2011). Report: A profile of the South
African pear market value chain. Pretoria. Available at: www.nda.agric.za.
De Roever, C. (1998). Microbiological safety evaluations and recommendations on fresh
produce. Food Control, 9(6), 321-347.
Freshfel. (2013). Freshfel Consumption Monitor. [ONLINE] Available at:
http://www.freshfel.org [Accessed 25 February 2013].
Hanning, I. B., Nutt, J. D. & Ricke, S. C. (2009). Salmonellosis outbreaks in the United
States due to fresh produce: sources and potential intervention measures. Foodborne
Pathogens and Disease, 6(6), 635-648.

5
Janisiewicz, W. J. & Buyer, J. S. (2010). Culturable bacterial microflora associated with
nectarine fruit and their potential for control of brown rot. Canadian Journal of
Microbiology, 56(6), 480-486.
Kirezieva, K., Nanyunja, J., Jacxsens, L., van der Vorst, J. G. A. J., Uyttendaele, M. &
Luning, P. A. (2013). Context factors affecting design and operation of food safety
management systems in the fresh produce chain. Trends in Food Science & Technology,
32(2), 108-127.
Lammerding, A. M. & Paoli, G. M. (1997). Quantitative risk assessment: an emerging tool
for emerging foodborne pathogens. Emerging Infectious Diseases, 3(4), 483.
Leben, C. (1965). Epiphytic microorganisms in relation to plant disease. Annual Review of
Phytopathology, 3(1), 209-230.
Luning, P. A., Chinchilla, A. C., Jacxsens, L., Kirezieva, K. & Rovira, J. (2013).
Performance of safety management systems in Spanish food service establishments in
view of their context characteristics. Food Control, 30(1), 331-340.
Nguyen-The, C. (2012). Biological hazards in processed fruits and vegetables–Risk factors
and impact of processing techniques. LWT-Food Science and Technology, 49(2), 172-
177.
Olaimat, A. N. & Holley, R. A. (2012). Factors influencing the microbial safety of fresh
produce: a review. Food Microbiology, 32(1), 1-19.
Perishable Products Export Control Board. Export Directory. (2013). 11th edition. ISBN 0-
620-31322-6. Section 2, p. 28.
Petersen, L. (2011). Food workers 'not trained in food safety'. Citizen, 23 June. 6. Ref No:
3698.
6
CHAPTER 2
POSTHARVEST BACTERIAL QUALITY AND SAFETY OF PEARS
1. INTRODUCTION
Fresh produce consumption has increased over the past 20 years due to a growing demand
for healthy nutritious alternative food sources [Centres for Disease Control and Prevention
(CDC), 2011a]. Due to this, complicated trade networks developed, which resulted in more
effective and longer distribution systems. Pome fruit (apples and pears) are the most
consumed fruit type in the European Union (EU) and second most important in the United
States of America (USA) according to the World Apple and Pear Association (2014).
Although pears are second to apples in quantity consumed, pears are highly versatile as the
product can be consumed either raw, processed into juice, canned or dried.
Pears originated from eastern Europe and Asia. In South Africa (SA) the European pear
(Pyrus communis L.) is the most favored pear species for commercial production. The pear
industry is one of the most dynamic fruit sectors in the world with major producers including
China (69%), USA (3%) and Italy (3%) [Food and Agriculture Organisation (FAO) Stat,
2015]. In 2013, South Africa was ranked as the seventh largest producer of pears in the
world (343,203 tonnes) (FAO Stat, 2015). The SA pear industry accounts for R 1.4 billion
(2009/2010) and is an important contributor to the total gross domestic product of the country
[Department of Agriculture, Forestry and Fisheries (DAFF), 2011]. Favourable climatic and
environmental conditions for the cultivation of pome fruit are found primarily in the southern
parts of the country. The majority of producers are located in the Western Cape Province
which is the centre of origin for 97% of all exported pears. The remaining 3% originate from
seven of the nine provinces (DAFF, 2011). The total planted area is estimated to cover 12
690 ha (2012). Dominant pear cultivars in SA include Packham’s Triumph (29%), Forelle
(26%), Williams Bon Chretien (10%) and Early Bon Chretien (10%) (DAFF, 2011). The
first two cultivars are not only the most planted but also most economically important in
terms of exports (DAFF, 2011). South Africa exported 182,076 tons of pears from 2011 to
2013, with destination markets being the Netherlands, United Kingdom and the United Arab
Emirates (Table 2.1) (Global Trade Atlas, 2014). The number of cartons (12kg) exported in
2013 were 3.1 million (20%) Forelle and 5.2 million (33%) Packham’s Triumph, from
January to August (Perishable Products Export Control Board, 2013).

7
Table 2.1. Top ten South African pear export destinations (2011-2013) (Global Trade Atlas,
2014)
Importing from South Africa Trade Quantity (tons)
2011 2012 2013
Global Total 182,076 181,928 202,107
Netherlands 60,109 50,520 64,685
United Kingdom 20,102 17,785 20,258
United Arab Emirates 10,035 15,457 17,665
Russian Federation 13,271 16,180 15,486
Germany 9,945 7,770 10,794
France 5,980 6,575 8,705
Italy 4,670 5,241 7,032
Malaysia 7,237 8,020 5,714
Portugal 3,236 3,816 5,395
China, Hong Kong SAR 5,390 5,137 5,311
Although the harvesting season only spans over three months, the industry can store fruit for
an extended period of time (up to nine months), ensuring consistent supply throughout the
year.
In order for SA to maintain its market share, fruit quality and safety must be ensured. This
requires expanding existing knowledge regarding the dynamic interactions between surface
microflora and foodborne pathogens. In this context the bacterial quality of pears harvested
and processed was investigated in this dissertation. The microbial flora (biota) on the pear
fruit surface (carpoplane) and the impact that various interventions will have on the
population stability is thus reviewed. In this chapter, the SA pear industry will be described
in the context of potential hazards, food safety and quality assurance systems as well as the
bacterial dynamics and quality assurance preventative control approaches.
2. MICROBIAL CONSIDERATIONS WITHIN PEAR PRODUCTION
In general, phyto-microbiomes are dynamic in composition when compared to the
environments in which they proliferate (Lebeis, 2014). The plant microflora consists of a

8
variety of microorganisms coexisting within a characteristic habitat representing an
ecological balance (Leben, 1965). Fruit surfaces harbor diverse natural residential
microorganisms (Leff & Fierer, 2013), these include epiphytes, saprophytes, plant pathogens
and human pathogens. The dominant phylogeny found on apples (pome fruit) have been
identified as Microbacteriaceae and Sphingomonadaceae, as also described on peaches (Leff
& Fierer, 2013). These authors described the impact of farming practices on the natural
protection ability of the dominant microbial populations.
The naturally occurring microorganisms impact on the diversity and presence of plant and
human pathogens (Abadias et al., 2014; Alegre et al., 2013; Alegre et al., 2012), therefore
influencing the exposure of the fruit and consumers to microorganisms possibly present. The
epiphytic microorganisms provide a protective barrier against pathogenic microorganisms
causing decay or food spoilage (Barth et al., 2010), or contribute to food safety concerns. In
an attempt to protect the fruit and the consumer from hazardous microorganisms, various
biological; and other control measures have been developed and evaluated (Janisiewicz,
2012). In this context the carpoplane biome reflects the natural microflora with the potential
to maintain an ecological balance and prevent pathogen multiplication, as illustrated by the
biopreservation effect of Pseudomonas spp. on human pathogens possibly present in this
sphere (Abadias et al., 2014; Alegre et al., 2013; Alegre et al., 2012). This knowledge can
be used to better understand the protective ability of the natural microbial community and
the potential presence of pathogens. Focusing on the bacterial dynamics will give an insight
into the likelihood of foodborne pathogens to establish, persist, compete, colonise and
survive.
To date not much research has been done on the microbial populations of the pear
carpoplane, specifically the bacterial populations with a focus on foodborne pathogens (Leff
and Fierer, 2013). Therefore the investigation of the carpoplane microbiome at different
postharvest stages will reflect on the impact of intervention strategies. Interventions such as
washing and/or chemical application to the fruit surface disrupts the natural microbial
balance, causing a population shift benefitting opportunistic organisms associated with food
spoilage, decay or food safety (Corbo et al., 2010).

9
2.1. POTENTIAL HAZARDS
Common practice in SA involves transporting harvested fruit for short distances in open
trailers from orchards to packhouses, resulting in a period of open air exposure at room
temperature. Upon arrival at the packhouse, fruit are drenched in horizontal drench baths
containing 75ppm chlorine-water mixture, in order to disinfect fruit prior to controlled
atmosphere (CA) storage, according to industry standards (South African Apple and Pear
Association, 2013). The 75ppm chlorine-water mixture is managed according to Global
Good Agricultural Practices (GAP), with the pH monitored daily. However, chlorine
treatment (180ppm) has been shown not to significantly decrease titres of aerobic bacteria
on cantaloupe (Fan et al., 2009). Wei et al. (1995), have found that 100ppm chlorine solution
failed to kill Salmonella Montevideo following a two minute treatment. In contrast, Iturriaga
& Escatín (2010) demonstrated a 5 log reduction in Salmonella Montevideo following a
200mg/l chlorine treatment of tomatoes. Beuchat (1999) found that 200ppm chlorine killed
or removed E. coli O157:H7 from lettuce at the same efficiency as deionised water. Rodgers
et al. (2004) demonstrated 4.9 log reduction in E. coli O157:H7 and L. monocytogenes titres
on fresh produce (apples, strawberries and cantaloupe) treated with chlorinated trisodium
phosphate (100-200ppm chlorine). Following chlorine drenching fruit are moved to CA
storage.
Postharvest practices differ between packhouses, some fruit are immediately packed and
other fruit are stored under CA conditions (specific for the cultivar) prior to packing (Findlay
& Combrink, 2013, Appendix 1). Fruit are stored in CA storage in order to extend shelf-life
which can be up to nine months (Appendix 1). The extreme conditions of CA storage can
cause a shift in the carpoplane population density and diversity (Corbo et al., 2010). Farber
(1991) reported that CO2 has a significant and direct antimicrobial activity due to the
alteration of the cell membrane. Listeria monocytogenes in particular is a facultative
anaerobe and psychrotrophic organism, therefore the limited O2 and cold temperature does
not have an effect on this foodborne pathogen (Berrang et al., 1989). In previous studies, it
was found that CA storage had no effect on growth of L. monocytogenes (Berrang et al.,
1989), nor on the survival of Salmonella spp. (Daş et al., 2006). Fruit are exposed to
changing environmental conditions and treatments that can have an impact on the residual
microflora. The exact effectiveness and influences that these combined production practises
such as chlorine chemical drenching and CA storage have on the microbial population

10
dynamics and survivability of the bacterial organisms and in particular the major foodborne
pathogen will be discussed in this dissertation.
2.2. FOODBORNE PATHOGENS
Demonstrating the presence of foodborne pathogens on fresh produce within the harvest
environment is factual, but the collaborative hurdle effect of processing, storage conditions
and the naturally occurring microflora place high pressure on the survivability of foodborne
organisms (Abadias et al., 2014; Alegre et al., 2013; Alegre et al., 2012). In the event that
these foodborne pathogens are able to evade this hurdle (in the case of temperature
mismanagement) these foodborne pathogens have increased potential of survival which
could result in a foodborne outbreak. The detection of foodborne pathogens on fresh produce
within the orchard is however not indicative of a looming outbreak. This is rather a sign that
control strategies and a better food safety management systems (FSMS) are required in order
to prevent foodborne disease causing organisms from establishing on the fruit. Food
products that undergo processing steps prior to consumption cannot be assessed in the
context of zero tolerance as is the case with ready-to-eat food.
Different foodborne pathogenic microorganisms have their own mode of infection and
require infectious doses to cause disease in a broad spectrum of the population. The
minimum infectious dose (MID) affects the quantitative level of risk. The concept that a
single, viable, infectious pathogenic microbial cell is able to cause disease is considered a
non-plausible argument and the MID response has been widely adopted. The MID is used
as an indicator of risk of infection and are definite with an increased exposure to more
pathogenic cells (Leggett et al., 2012). Bacterial organisms more commonly associated with
fresh produce disease outbreaks are illustrated in Table 2.2, including aspects such as the
contamination level and food source specified. This study focused on three of the most
important foodborne pathogens in terms of disease severity, impact from a health
perspective, reported outbreaks and associated recalls. The most important pathogens in this
context are discussed in the following sections.
ESCHERICHIA COLI
Escherichia coli have been identified as a potential pathogenic organism from the early 1885
(Feng et al., 2002). Strains are grouped into different types, many of which are natural flora
of the human intestine and are not considered harmful. These are noted to be environmental

11
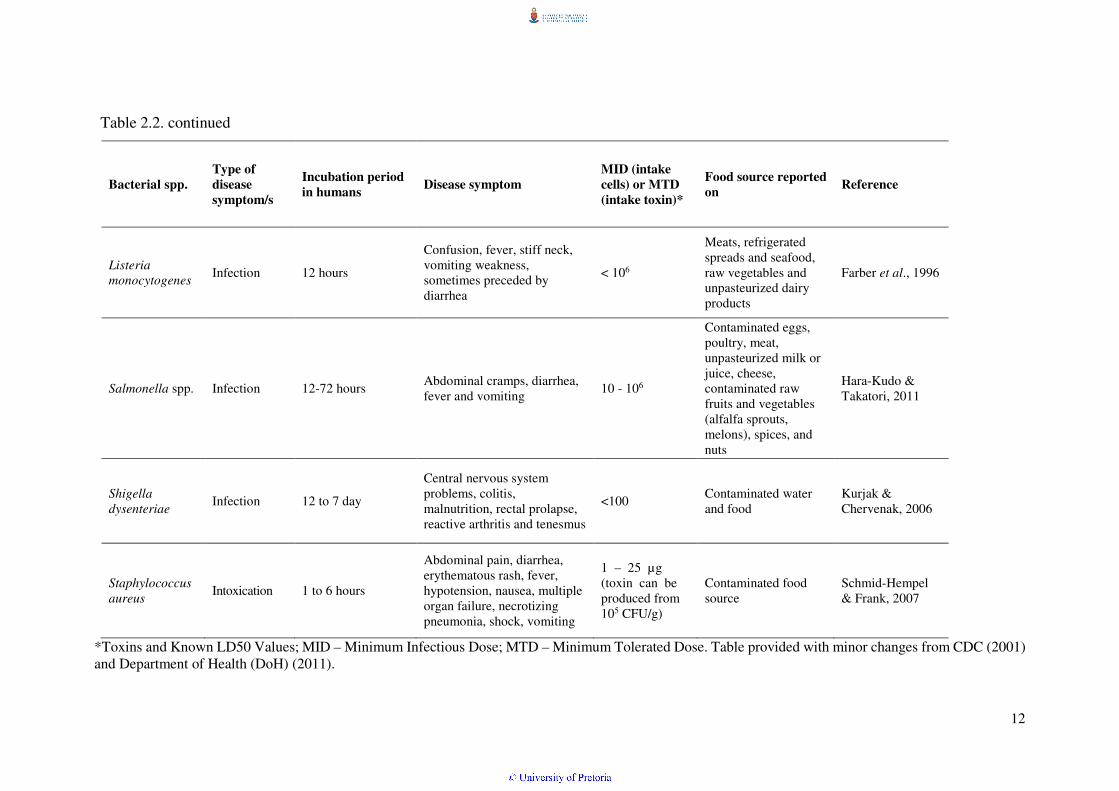
Table 2.2. Bacterial microorganisms typically associated with foodborne diseases
Bacterial spp.
Type of
disease
symptom/s
Incubation period
in humans Disease symptom
MID (intake
cells) or MTD
(intake toxin)*
Food source reported
on Reference
Bacillus cereus Infection or intoxication
1 to 24 hours Diarrhea, nausea and vomiting
> 105 CFU Rice dishes, sauces and soups, salads, fresh fruit
Kotiranta et al., 2000
Campylobacter
jejuni Infection 2 to 5 days
Abdominal pain, diarrhea, enteritis, fever, and malaise
500 CFU
Contaminated water, poultry and unpasteurized milk, Fresh fruit and vegetables
Acheson & Allos, 2001
Clostridium
botulinum Intoxication 18 to 36 hours
Abdominal cramps, constipation, double and or blurred vision, dry mouth, muscle paralysis, nausea, vomiting, slurred speech, trouble breathing, and difficulty in swallowing.
LD50 = 0.03 ng/kg ("natural product")*
Fish products, honey (infant botulism), improperly canned foods, surfaces of fruits and vegetables
Arnon et al., 2001
Diarrheagenic Escherichia coli
(non-Shiga toxin-producing) (ETEC), (EPEC), (EIEC)
Intoxication or Infection
ETEC: 1 to 3 days. EPEC: 1 to 6 days. EIEC: 12 hours to 3 days.
Watery or bloody diarrhoea, abdominal cramps, with or without fever.
ETEC: 108 EPEC: 106 EIEC: 106-1010
Warm blooded animal faeces contaminated food or water. Transmission from person-to-person may occur.
CDC, 2005; Nataro & Kaper, 1998; Public Health Agency of Canada, 2011
Escherichia coli
(Shiga toxin-producing) (EHEC), e.g. O157
Infection 24 hours to 10 days
Abdominal cramps, acute hemorrhagic diarrhoea, hemolytic uremic syndrome (HUS) and vomiting
10 – 102
Contaminated water, raw fruit and vegetables, milk, juice, undercooked meat.
Hara-Kudo & Takatori, 2011; Nataro & Kaper, 1998
12
Table 2.2. continued
Bacterial spp.
Type of
disease
symptom/s
Incubation period
in humans Disease symptom
MID (intake
cells) or MTD
(intake toxin)*
Food source reported
on Reference
Listeria
monocytogenes Infection 12 hours
Confusion, fever, stiff neck, vomiting weakness, sometimes preceded by diarrhea
< 106
Meats, refrigerated spreads and seafood, raw vegetables and unpasteurized dairy products
Farber et al., 1996
Salmonella spp. Infection 12-72 hours Abdominal cramps, diarrhea, fever and vomiting
10 - 106
Contaminated eggs, poultry, meat, unpasteurized milk or juice, cheese, contaminated raw fruits and vegetables (alfalfa sprouts, melons), spices, and nuts
Hara-Kudo & Takatori, 2011
Shigella
dysenteriae Infection 12 to 7 day
Central nervous system problems, colitis, malnutrition, rectal prolapse, reactive arthritis and tenesmus
<100 Contaminated water and food
Kurjak & Chervenak, 2006
Staphylococcus
aureus Intoxication 1 to 6 hours
Abdominal pain, diarrhea, erythematous rash, fever, hypotension, nausea, multiple organ failure, necrotizing pneumonia, shock, vomiting
1 – 25 µg (toxin can be produced from 105 CFU/g)
Contaminated food source
Schmid-Hempel & Frank, 2007
*Toxins and Known LD50 Values; MID – Minimum Infectious Dose; MTD – Minimum Tolerated Dose. Table provided with minor changes from CDC (2001) and Department of Health (DoH) (2011).

13
E. coli strains, which could have beneficial effects (Kaper et al., 2004; Rembacken et al.,
1999). Escherichia coli is typically divided into two groups, commensal E. coli and
diarrhoeagenic E. coli (Omar & Barnard, 2010). Commensal E. coli can therefore be found
in many different environments and are considered to be non-pathogenic. However, E. coli
is used as an indicator of feacal contamination, due to the fact that the organism is a
commensal inhabitant of warm blooded animals (Omar & Barnard, 2010). The spread of E.
coli is mainly by means of contaminated faecal matter near a secondary source [World
Health Organisation (WHO), 2011]. In SA, informal settlements along water catchment
areas and rivers, ineffectively managed and overflowing sewage works as well as the
contamination potential of livestock upstream have been associated with increased
contamination of water sources with E. coli (Aijuka et al., 2014; Du Plessis et al., 2014;
Olaniran et al., 2009).
Diarrhoegenic E. coli are disease causing strains and are divided into different patho-types
including enterohaemorrhagic E. coli, enteropathogenic E. coli, enteroaggregative E. coli
and enterotoxigenic E. coli (Nataro and Kaper, 1998). Enterohaemorrhagic E. coli is
considered the most serious of the patho-types due to the severity of disease caused and are
associated with most of the E. coli outbreaks. It is estimated that enterohaemorrhagic E. coli
cause 173,000 illnesses and 21 deaths annually, of which E. coli O157 causes 63,000
illnesses and 20 deaths (CDC, 2015a). All other pathotypes cause 30,000 illnesses annually
and no deaths (CDC, 2015a). Most studies focus on the presence of E. coli O157:H7, as this
serotype is responsible for the most illnesses and deaths and can be considered a
representative organism for enterohaemorrhagic E. coli (Abakpa et al., 2015; Avila-Vega et
al., 2014; Feng et al., 2015). Escherichia coli O157:H7 are able to spread between people
coming into contact or through contaminated water sources (WHO, 2011). Detection of E.
coli O157:H7 is challenging as the organism is found in low titres relative to other naturally
occurring organisms (BioControl, 2015).
The CDC recorded the following fresh produce outbreaks due to various E. coli strains, from
2006-2013.
• Escherichia coli O157:H7 (EHEC) - Ready-to-eat salads, spinach and spring mix,
Romaine lettuce, hazelnuts, fresh spinach and a melon outbreak resulting in several
deaths.

14
• Escherichia coli O121 (EHEC) - Frozen food products, including quesadillas and
other mini-snacks.
• Escherichia coli O45 (EHEC) - Shredded Romaine lettuce from a single processing
facility.
• Escherichia coli O26 (EHEC) - Raw clover sprouts
• Shiga toxin-producing E. coli O104 (EHEC) - Sprouts produced in Germany and
consumption of contaminated sprouts by travellers in Germany.
In a similar time frame, the Rapid Alert System for Food and Feed (RASFF) reported 27 E.
coli alerts in the EU (RASFF, 2014). Infections were traced back to various sources which
included; lentil-, bean-, soybean- and beetroot- sprouts, baby corn and baby spinach, lettuce,
dates, cherry tomatoes, jackfruit, spinach, sugar peas and cucumbers.
Most recent studies of fresh produce at harvest revealed that E. coli O157 was detected from
vegetables (Abakpa et al., 2015), kiwi fruit (Feng et al., 2015) and bell peppers (Avila-Vega
et al., 2014). All food recalls associated with E. coli contamination of produce were recalled
due to the presence of enterohaemorrhagic E. coli [United States Food and Drug
Administration (FDA), 2015]. A total of 12 recalls were associated with contaminated food
and of those only six were associated with fresh produce (FDA, 2015). The only fruit
associated with an E. coli recall was strawberries contaminated with E. coli O157:H7 (FDA,
2015). In the EU there were no E. coli - fresh produce related recalls (Food Recalls Europe,
2015).
LISTERIA MONOCYTOGENES
Listeria monocytogenes has been linked to food transmission since the early 1980s
(Altekruse et al., 1997). The organism causes listeriosis in humans consuming contaminated
foods (Dieterich et al., 2006), and the human pathogenic organism has a mortality rate of
20% of all infected people (BioControl, 2015). The annual estimated number of illnesses
associated with L. monocytogenes in the USA is 1,600 and 250 deaths (CDC, 2015a).
Listeria monocytogenes is commonly associated with uncooked meat and vegetables, dairy
and dairy products and cooked and processed foods (CDC, 2012). From 1998 to 2008, L.
monocytogenes was responsible for only 20 illnesses associated with plants, 52 with dairy,
four with beef, three with pork and 127 with poultry (CDC, 2013). In the last three years
there have been six major outbreaks of listeriosis in the USA, products included dairy

15
products (n=4) and fresh produce (n=2). In 2011, there was an outbreak of L. monocytogenes
which was traced back to cantaloupe that resulted in 147 illnesses and 30 deaths (CDC,
2012), the original source of contamination is unknown. The RASFF reported five alerts in
the EU of outbreaks of L. monocytogenes traced back to fresh produce in 2014 (RASFF,
2014). The most recent case of fresh produce associated L. monocytogenes outbreak in the
USA was associated with pome fruit which resulted in seven deaths (CDC, 2015b). The
source of the outbreak was pre-packaged caramel apples and the source of contamination
was traced back to the company’s apple packing facility, resulting in a voluntary recall of
commercially produced and prepacked caramel apples (CDC, 2015b).
Listeria spp. are ubiquitous to the soil and water and are able to asymptomatically survive
in animal intestines (Ramaswamy et al., 2006). Strawn et al. (2013) reported that prevalence
of L. monocytogenes in terrestrial samples in production fields under study was 9.7% (51 of
526 samples collected). The presence of L. monocytogenes is therefore expected within the
farming environment. However, in recent studies by Castro-Ibanez et al. (2015) and Avila-
Vega et al. (2014), authors found no prevalence of L. monocytogenes from 144 samples
(manure, soil, seed, water and baby spinach) and 528 bell peppers from the fresh produce
production environment, respectively. Although this organism’s prevalence within the fresh
produce production environment is not fully described, L. monocytogenes is found on
products ready for consumption as is evidenced by the number of annual recalls. Listeria
monocytogenes contaminated fresh produce have resulted in 94 recalls in the USA all dated
between 2011 and 2015 (FDA, 2015). Only 21 of those recalls were associated with L.
monocytogenes contaminated fruit including recalls on contaminated apples and apple based
products (n= 10), cantaloupe (n=7) and deciduous fruit mango (n=2) (FDA, 2015). In 2014,
there were 11 recalls due to L. monocytogenes contaminated products, only one was
associated with fresh produce (salad) (Food Recalls Europe, 2015).
SALMONELLA SPP.
Salmonella sp. was first described by Dr Salmon in 1885 and has been known to cause illness
for over 125 years (CDC, 2015c). Only during the 1980s did it emerge as an important
foodborne pathogen (Patrick et al., 2004). Today, there are over two thousand known strains
of the organism. Buzby and Roberts (2009) reported that 87% of all confirmed Salmonella
spp. cases were confirmed to be foodborne. Today, Salmonella spp. are reported to cause
the highest number of illnesses and deaths associated with food (CDC, 2015a). Annually,

16
one million illnesses and 380 deaths in the USA alone are associated with Salmonella spp.
(CDC, 2015a). The human pathogenic Salmonella spp. are also responsible for the most
diverse foodborne outbreaks covering a wide spectrum of products (CDC, 2015b; Heaton
and Jones, 2008), including most commonly eggs, meat and poultry (Foodborne Illness,
2015). Salmonella spp. outbreaks are increasing annually with a 39% increase from 2012 to
2013 (CDC, 2015d). Salmonella spp. accounted for 41 multistate foodborne disease
outbreaks in the USA over the past eight years (CDC, 2015b).
A few significant fresh produce related outbreaks accounted for these 41 multistate
outbreaks, including the November 2014 outbreak, linked to the consumption of bean
sprouts. The outbreak spread through 12 states in the USA, infecting 115 people (20% of
the people hospitalised), no deaths were recorded and the causal agent was identified as
Salmonella Enteritidis (CDC, 2015b). An earlier recorded outbreak was reported in
Saintpaul in 2013 where contaminated cucumbers resulted in 84 illnesses with 17
hospitalisations and no deaths (CDC, 2013). Two major outbreaks were recorded in 2012
caused by Salmonella Braenderup, Salmonella Typhimurium and Salmonella Newport,
resulting in 127 illnesses with 33 people hospitalised and 261 people affected resulting in
the death of three. In this case contaminated foods were mangoes and cantaloupe,
respectively (CDC, 2011). Sources of contamination were not specified and the pathogen
could be traced back to the production companies. In the EU, RASFF was alerted to 39
illness cases of Salmonella spp. associated with fresh fruit and vegetables (RASFF, 2014).
Due to the frequency of Salmonella spp. outbreaks associated with food, the FDA
recommends testing for the presence of Salmonella spp. and if detected the product should
be recalled and destroyed (FDA, 2012). Of the 308 Salmonella spp. food recalls between
2009 and 2015 in the USA, 90 were associated with fresh produce (FDA, 2015). Fruit recalls
included mangoes and mango products (n=8), cantaloupe (n=4), papayas (n=2) and other
fruit (n= 14) with a total of 28 recalls associated with Salmonella spp. contaminated fruit
(FDA, 2015). In 2014, there were eight recalls in the EU associated with Salmonella spp.
contamination. Two were associated with fresh produce, one associated with contaminated
sultanas and one with contaminated parsley and chives (Food Recalls Europe, 2015).
However, recalls deal with the presence of Salmonella spp. on fruit ready for consumption
and little is known about the presence of Salmonella spp. on fresh produce at the point of
harvest and prior to retail sale. Three recent reports have described the presence of

17
Salmonella spp. within the production environment from basil and coriander (Delbeke et al.,
2015) and bell peppers (Avila-Vega et al., 2014), however Salmonella spp. were not detected
on kiwi fruit (n=193) (Feng et al., 2014).
2.3. DETECTION OF FOODBORNE PATHOGENS
Detection of foodborne pathogens can be done through traditional methods such as viable
plate counts and using indicator systems and using molecular tools such as PCR and
sequencing (Law et al., 2015). Both traditional and molecular methods have drawbacks and
specific advantages in terms of accuracy, repeatability, sensitivity and timeliness. Viable
plate techniques include the use of specific designed chromogenic media. The media
functions to selectively allow for the growth of the targeted group of organisms. The viable
count approach is based on non-selective and selective media. Eosin methylene blue agar
specifically focuses on the suppression of Gram positive bacteria (Levine, 1918) to promote
the growth of E. coli. Oxford-Listeria medium provides a combination of chemical
substances to cause inhibition of organisms other than Listeria spp. (including Listeria
monocytogenes). Chromogenic media such as Brilliance Salmonella agar contain inhibition
properties that are able to lyse cell walls of non-targeted bacteria. The drawback of each of
these chromogenic media detections are that possible high numbers of false positives are
obtained as reported by Holfelder et al. (1998).
Multiplex PCR methodologies reported by Standing et al. (2013) uses a combination of
primers targeting specific genes for each of the three foodborne pathogens. The primers
(Chapter 4, Table 4.1) identifies, E. coli O157:H7 (Cebula et al., 1995), Listeria
monocytogenes (Thomas et al., 1991) and Salmonella Typhimurium (Standing et al., 2013).
The biggest drawback on this methodology is that genomic level detection cannot distinguish
between live and dead cells, only the presence and/or absence of targeted organisms.
Therefore after positive identification of genomic level of detection, viable cultural
methodologies should be focused on establishing whether the organism is alive in the matrix
tested. Advanced levels of detection methodologies used are done through 3M Molecular
Detection Systems where the technology uses isothermal DNA amplification and
bioluminescence detection for accurate results.

18
3. FOOD SAFETY
The current increase in number of fresh produce associated outbreaks can directly be linked
to increased consumption of raw fruits, vegetables and salads (Brackett, 1999). In the EU,
576 notifications were received by the EU RASFF in 2010, whereas 732 were received in
2014, also showing an increasing trend (RASFF, 2014). This has resulted in global food
safety awareness and effective implementation.
Due to the increasing outbreaks associated with foodborne pathogens, countries have
implemented set standards and guidelines with regard to presence of selected foodborne
pathogens. The EU and United States Environmental Agency (US EPA) have a zero
tolerance for L. monocytogenes and Salmonella spp. within a 25 gram sample size (European
Commission, 2012), whereas it is required that E. coli be absent from one gram of food
sample. Thermotolerant (faecal) coliforms should be lower than 10 CFU/g. Aerobic plate
counts of food products is set to be lower than 105 CFU/g (European Commission, 2012).
The SA Department of Health (DoH) also implemented a set of microbial food safety
guidelines for the consumption of ready-to-eat raw fruit and vegetables to prevent possible
foodborne disease outbreaks (DoH, 2006). The guideline directs the food industry towards
safer food products at the ready-to-eat stage. This microbial guideline describes total viable
limitations of microbial organisms on ready-to-eat foods including fresh produce consumed
raw. There is currently no definitive criteria for aerobic bacteria on raw fruit and vegetables.
For both E. coli and L. monocytogenes a zero tolerance level is set with food being
considered safe if samples are free of viable colonies. Coliforms have to be less than 200
CFU/g and Salmonella spp. lower that 6.25 CFU/25g raw fruit and vegetables. In
comparison to SA standards, the EU and US EPA are more stringent in terms of the presence
of Salmonella spp. and thermotolerant (faecal) coliforms (DoH, 2006; European
Commission, 2012). In order for discrepancies in standards to be addressed and to develop
commodity specific standards, the natural population densities on fresh produce which needs
to be reconsidered given the new body of evidence emerging regarding phytobiomes.
Set standards emphasise the growing importance of basic pre-requisite programmes such as
GAP and effective hygiene and sanitation systems which have become the universally
adopted minimum requirement for trade. Basic FSMS are thus not only being developed but
also universally implemented through third party certification. All participants in the food
system require some form of self-assessment going beyond self-regulatory systems. Safer

19
foods can only be assured through effective FSMS, regulatory compliance and a more
advanced level of hazard analysis, risk assessment and preventative control. In essence a
FSMS is based on ISO 22000:2005 and include more advanced systems such as Hazard
Analysis Critical Control Point (HACCP), pre-requisite programmes and regulatory
compliance. Alternative owner schemes have evolved over the past 20 years and include
standards such as Global GAP, BRC, FSSC 22000 and FAMI-QS (Table 2.3). All major
retailers require producer compliance to one of these systems and producers delivering
products to more than one supplier will often have to be certified to the different standards
or schemes. This despite the global push towards “once certified, accepted everywhere”
(Global Food Safety Initiative, 2015).
4. FOOD SAFETY MANAGEMENT SYSTEMS
Current FSMS evolved on the basic principles of HACCP (The Registrar Company, 2015).
The Codex Alimentarius Commission adopted the HACCP principles as a universal food
safety system (Hulebak & Schlosser, 2002). During the 1990’s the first production assurance
system was developed as EurepGAP (Global-GAP, 2015). Since then numerous other
private certification systems were developed (Table 2.3) all having the same basic elements
of management. As food safety systems evolve, the general criteria include additional
parameters that cover microbial, chemical and physical hazard analysis, risk assessment,
management systems, standard operational procedures, traceability and document control.
Aspects like fair trade, worker health and safety and environmental protection can also form
part of the FSMS. Clear documentation and transparency ensure food safety and retailer
requirements are met. Despite certification, the proliferation of voluntary standards and
government regulations, several high profile disease outbreaks have occurred and have been
associated with certified farms. Thus indicating the need for improvement of the system
(FDA, 2010) and following a more science based approach.
In 2013, in order to aid producers in continual improvement of their FSMS, a horticultural
safety management system (HSMS) self-assessment tool was developed (Luning et al.,
2013) and adapted for the production systems (Kirezieva et al., 2015). Therefore, some
aspects in the production system (of fruit) does not apply to the current outline and/or design
of the HSMS system (Kirezieva et al., 2013). The value of the HSMS self-assessment tool
is focused on the farmer/company and provides a better framework of understanding of
effective FSMS implementation. This HSMS self-assessment tool is considered value-

20
Table 2.3. Global food safety standards and management systems incorporated in the fresh food industries
Title
Pro
du
ctio
n
Targ
et
Criteria / Quality
management / Principles
Date
of
est.
Ownership /
Rights
Number of members/
certified firms / Auditors /
Accreditation bodies
Food Safety Elements
Global GAP - Good
Agricultural Practice
(Global GAP IFA V5)
Foo
d S
afet
y an
d tr
acea
bili
ty
All relevant aspects on product safety, documentation,
environmental impact and the health, safety and
welfare of workers and animals
1997
Euro-Retailer Produce Working
Group
50 Retail & Food Service 181 Producer & Supplier 149 Associate Members
140+ Certification bodies 5 Integrity Surveillance
Committee members Across more than 100
Countries
Management responsibility, Food safety plan
Documentation and record keeping, Worker education and training,
Sampling and Testing Traceability,
Recall program Corrective actions,
Self-audits Worker hygiene,
Agricultural chemicals and plant protection products
HACCP - Hazard
Analysis and Critical Control Points
Foo
d S
afet
y
Conduct a Hazard Analysis Define Critical Control
Points Establish: Critical Limits, Monitoring Procedures,
Corrective Actions, Verification Procedures,
Record-Keeping and Documentation Procedures
1963
None but
accepted by World Health
Organisation and adopted in Codex
Alimentarius
Codex Alimentarius Commission:
186 Codex Members 185 Member Countries 1 Member Organization
(EU) 225 Codex Observers - 52 IGOs, 157 NGOs, 16 UN.
Good Manufacturing Practices (GMPs) (relating to personnel and the food
processing environment) and HACCP plans (prevent, eliminate or reduce
potential hazards)
ISO 22000 - International Organisation
for Standardizati
on (ISO 22000:2005)
Foo
d S
afet
y m
anag
emen
t sy
stem
Quality Management System,
Augment HACCP on issues related to food
safety
2005
International Organisation for Standardisations
Member bodies (Counsel members) - 88 (15)
Correspondent members - 46
Subscriber members - 14
Interactive communication System management Prerequisite programs
HACCP principles

21
Title
Pro
du
ctio
n
Targ
et
Criteria / Quality
management / Principles
Date
of
est.
Ownership /
Rights
Number of members/
certified firms / Auditors /
Accreditation bodies
Food Safety Elements
SQF - Safe Quality Food
standard
Foo
d S
afet
y an
d Q
uali
ty
HACCP-based
2005
Administered by the Food
Marketing Institute (FMI) (developed in
Western Australia in 1990's)
30+ Certification Bodies
Company interrelationship, System management and adaptations, Information
transfer to employees, Customer complaints, Production audit, Product analysis,
Corrective actions and product withdrawal/recall.
IFS Food - International
Food Standard
Foo
d S
afet
y an
d Q
uali
ty
Establish standards with uniform evaluation
systems, comparability and transparency throughout the entire supply chain,
reduce costs and time for both manufacturers and
retailers 20
03
Hauptverband des Deutschen
Einzelhandels (HDE)
Fédération des Entreprises du
Commerce et de la Distribution
(FCD)
15 000+ Certificates (90+ countries) 800+ Auditors
100 Certification bodies
Control of critical control points; Involvement of management and employees; Tractability of product, production material
and packaging; Implementation of corrective measures
BRC - British Retail
Consortium
Foo
d S
afet
y an
d Q
uali
ty Evaluation of companies
supplying retailer branded food
provider of in-depth retail information
1992
BRC Trading Limited
22 000+ Certificated suppliers
123 Countries
Senior management commitment and Continual improvement,
Food safety plan (HACCP) Food safety and Quality management system
Production site standards, Product control Process control and documentation
Personnel training
FSSC 22000 - Food Safety
System Certification
(FSSC 22000: 2015) F
ood
Saf
ety
and
Qua
lity
Conduct a hazard analysis establish: Critical limits, Monitoring procedures,
Corrective actions, Verification procedures,
Record-keeping and Documentation procedures
1996
National Board of Experts in HACCP
106 Certification Bodies 10 000+ Certified
organisations
Process and manufacturing; Shelf life extension;
Ingredient added management; Packaging management

22
adding for farmers/companies who have evolved a higher level of awareness (Kirezieva et
al., 2013). Moreover, Kirezieva et al. (2015) reported that in depth studies should
accompany this tool to broaden the knowledge base and strengthen the tool to ensure
improved management.
5. CONCLUSION
Current information published encourages consumption of fresh fruit and vegetables. Pears
are a popular fruit consumed raw and often unprocessed. The pear carpoplane provides a
dynamic environment for microbial populations which may include foodborne pathogens,
these microorganisms thrive in a natural balance. Different production practices affect this
natural balance by disrupting the pear carpoplane microbiome. Production practices allow
fruit to be stored for extended periods of time, resulting in extensive supply chains with
increased handling of fruit, therefore increasing the associated food safety risk. Currently,
information on the presence of foodborne pathogens on pears at the point of harvest is
limited, but the impact of one pathogen contamination event may cause extensive losses to
the industry. The importance of the impact of production practices and its effects on the
natural microbial populations has been shown in other studies and can ultimately influence
the risk to the consumer. In order to manage food safety hazards in the food supply chain,
FSMS have been designed and require the implementation of control points in order to
reduce exposure of produce to various hazards. Although various standards and owner
schemes exist foodborne disease outbreaks still occur reflecting the need for a more risk and
science based approach.
6. REFERENCES
Abadias, M., Altisent, R., Usall, J., Torres, R., Oliveira, M. & Viñas, I. (2014).
Biopreservation of fresh-cut melon using the strain Pseudomonas graminis CPA-7.
Postharvest Biology and Technology, 96, 69-77.
Abakpa, G. O., Umoh, V. J., Ameh, J. B., Yakubu, S. E. & Ibekwe, A. M. (2015). Prevalence
and antimicrobial susceptibility of pathogenic Escherichia coli O157 in fresh produce
obtained from irrigated fields. Environmental Technology & Innovation, 4, 1-7.
Acheson, D. & Allos, B. M. (2001). Campylobacter jejuni infections: update on emerging
issues and trends. Clinical Infectious Diseases, 32(8), 1201-1206.

23
Aijuka, M., Charimba, G., Hugo, C. J. & Buys, E. M. (2015). Characterization of bacterial
pathogens in rural and urban irrigation water. Journal of Water and Health, 13(1), 103-
117.
Alegre, I., Viñas, I., Usall, J., Anguera, M., Altisent, R. & Abadias, M. (2013). Antagonistic
effect of Pseudomonas graminis CPA-7 against foodborne pathogens in fresh-cut
apples under simulated commercial conditions. Food Microbiology, 33(2), 139-148.
Alegre, I., Viñas, I., Usall, J., Anguera, M., Figge, M. J. & Abadias, M. (2012). An
Enterobacteriaceae species isolated from apples controls foodborne pathogens on
fresh-cut apples and peaches. Postharvest Biology and Technology, 74, 118-124.
Altekruse, S. F., Cohen, M. L. & Swerdlow, D. L. (1997). Emerging foodborne diseases.
Emerging infectious diseases, 3(3), 285.
Althaus, D., Hofer, E., Corti, S., Julmi, A. & Stephan, R. (2012). Bacteriological survey of
ready-to-eat lettuce, fresh-cut fruit, and sprouts collected from the Swiss market.
Journal of Food Protection, 75(7), 1338-1341.
Arnon, S. S., Schechter, R., Inglesby, T. V., Henderson, D. A., Bartlett, J. G., Ascher, M. S.,
Eitzen, E., Fine, A. D., Hauer, J., Layton, M., Lillibridge, S., Osterholm, M. T.,
O'Toole, T., Parker, G., Perl, T. M., Russell, P. K., Swerdlow, D. L. & Tonat, K.
(2001). Botulinum toxin as a biological weapon: medical and public health
management. Jama, 285(8), 1059-1070.
Avila-Vega, D. E., Álvarez-Mayorga, B., Arvizu-Medrano, S. M., Pacheco-Aguilar, R.,
Martínez-Peniche, R. & Hernández-Iturriaga, M. (2014). Microbiological profile and
incidence of Salmonella and Listeria monocytogenes on hydroponic bell peppers and
greenhouse cultivation environment. Journal of Food Protection, 77(11), 1904-1910.
Barth, M., Hankinson, T. R., Zhuang, H. & Breidt, F. (2010). Microbiological spoilage of
fruits and vegetables. In: Compendium of the Microbiological Spoilage of Foods and
Beverages, Springer, New York, pp. 135-183.
Berrang, M. E., Brackett, R. E. & Beuchat, L. R. (1989). Growth of Listeria monocytogenes
on fresh vegetables stored under controlled atmosphere. Journal of Food Protection,
52(10), 702-705.

24
Beuchat, L. R. (1999). Survival of enterohemorrhagic Escherichia coli O157: H7 in bovine
feces applied to lettuce and the effectiveness of chlorinated water as a disinfectant.
Journal of Food Protection, 62(8), 845-849.
BioControl (2015). Targets. [ONLINE] Available at: http://www.biocontrolsys.com/
products/targets/pathogens/. [Accessed 17 April 2015].
Brackett, R. (1999). Incidence, contributing factors, and control of bacterial pathogens in
produce. Postharvest Biology and Technology, 15(3), 305-311.
Buzby, J. C., & Roberts, T. (2009). The economics of enteric infections: human foodborne
disease costs. Gastroenterology, 136(6), 1851-1862.
Castro-Ibáñez, I., Gil, M. I., Tudela, J. A., Ivanek, R. & Allende, A. (2015). Assessment of
microbial risk factors and impact of meteorological conditions during production of
baby spinach in the Southeast of Spain. Food Microbiology, 49, 173-181.
Cebula, T. A., Payne, W. L. & Feng, P. (1995). Simultaneous identification of strains of
Escherichia coli serotype O157:H7 and their Shiga-like toxin type by mismatch
amplification mutation assay-multiplex PCR. Journal of Clinical Microbiology, 33(1),
248-250.
Centres for Disease Control and Prevention. (2001). Diagnosis and Management of
Foodborne Illness: A Primer for Physicians. Morbidity and Mortality Weekly Report,
January 2001. CDC, (Atlanta), USA.
Centres for Disease Control and Prevention. (2005). Diarrhoeagenic Escherichia coli (non-
Shiga toxin-producing E. coli). [ONLINE] Available at: http://www.cdc.gov
/ncidod/dbmd/diseaseinfo/diarrecoli_t.htm [Accessed on 30 November 2012].
Centres for Disease Control and Prevention. (2011). Strategies to prevent obesity and other
chronic disease: The CDC guide to strategies to increase the consumption of fruits and
vegetables. US Dept. Health Human Serv., Atlanta, GA.
Centres for Disease Control and Prevention. (2012). Multistate outbreak of listeriosis linked
to whole cantaloupes from Jensen Farms, Colorado. [ONLINE] Available at:
http://www.cdc.gov/listeria/outbreaks/cantaloupes-jensen-farms/082712 /index.html.
[Accessed on 30 November 2012].
Centres for Disease Control and Prevention. (2015a). Pathogens causing US foodborne
illnesses, hospitalizations, and deaths, 2000–2008. [ONLINE] Available at:

25
http://www.cdc.gov/foodborneburden/PDFs/pathogens-complete-list-01-12.pdf
[Accessed on 25 August 2015].
Centres for Disease Control and Prevention. (2015b). Multistate Outbreak of Listeriosis
Linked to Commercially Produced, Prepackaged Caramel Apples Made from Bidart
Bros. Apples (Final Update). [ONLINE] Available at: http://www.cdc.gov/listeria
/outbreaks/caramel-apples-12-14/ [Accessed 17 April 2015].
Centres for Disease Control and Prevention. (2015c). What is Salmonellosis? [ONLINE]
Available at: http://www.cdc.gov/salmonella/general/index.html [Accessed 21 August
2015].
Centres for Disease Control and Prevention. (2015d). Surveillance for foodborne disease
outbreaks United States, 2013: Annual report. [ONLINE] Available at:
http://www.cdc.gov/foodsafety/pdfs/foodborne-disease-outbreaks-annual-report-
2013-508c.pdf [Accessed 11 August 2015].
Corbo, M. R., Speranza, B., Campaniello, D., D’Amato, D. & Sinigaglia, M. (2010). Fresh-
cut fruits preservation: current status and emerging technologies. Current research,
technology and education topics in applied microbiology and microbial biotechnology.
Formatex Research Center, Badajoz, 1143-1154.
Daş, E., Gürakan, G. C. & Bayındırlı, A. (2006). Effect of controlled atmosphere storage,
modified atmosphere packaging and gaseous ozone treatment on the survival of
Salmonella Enteritidis on cherry tomatoes. Food Microbiology, 23(5), 430-438.
Delbeke, S., Ceuppens, S., Jacxsens, L. & Uyttendaele, M. (2015). Microbiological analysis
of pre-packed sweet basil (Ocimum basilicum) and coriander (Coriandrum sativum)
leaves for the presence of Salmonella spp. and Shiga toxin-producing E. coli.
International Journal of Food Microbiology, 208, 11-18.
Department of Agriculture, Forestry and Fisheries of South Africa. (2011). Report: A profile
of the South African pear market value chain. [ONLINE] Available at:
www.nda.agric.za. [Accessed 28 July 2014].
Department of Health. (2006). Guidelines for Environmental Health Officers on the
Interpretation of Microbiological Analysis Data of Food. Department of Health,
Directorate: Food Control. Annexure B Proposed Microbiological Specification to be
used as Guidelines for Foods. Pretoria, Pp. 26.

26
Department of Health. (2011). Clinical guidelines on management and control of foodborne
diseases in South Africa. p. 17. [ONLINE] Available at: www.doh.gov.za/docs/
Policies/2012 [Accessed 03 August 2014].
Dieterich, G., Kärst, U., Fischer, E., Wehland, J. & Jänsch, L. (2006). LEGER: knowledge
database and visualization tool for comparative genomics of pathogenic and non-
pathogenic Listeria species. Nucleic Acids Research, 34(suppl. 1), D402-D406.
Du Plessis, E. M., Duvenage, F. & Korsten, L. (2015). Determining the potential link
between irrigation water quality and the microbiological quality of onions by
phenotypic and genotypic characterization of Escherichia coli isolates. Journal of
Food Protection, 78(4), 643-651.
European Commission. (2012). Working Document on Microbial Contaminant Limits for
Microbial Pest Control Products. [ONLINE] Available at: http://ec.europa.eu/f
ood/plant/pesticides/guidance_documents/docs/wd_on_microbial_contaminant_limit
s_en.pdf. [Accessed 28 July 2015].
Fan, X., Annous, B. A., Keskinen, L. A. & Mattheis, J. P. (2009). Use of chemical sanitizers
to reduce microbial populations and maintain quality of whole and fresh-cut
cantaloupe. Journal of Food Protection, 72(12), 2453-2460.
Farber, J. M. (1991). Microbiological aspects of modified-atmosphere packaging
technology-a review. Journal of Food Protection, 54(1), 58-70.
Farber, J. M., Ross, W. H. & Harwig, J. (1996). Health risk assessment of Listeria
monocytogenes in Canada. International Journal of Food Microbiology, 30(1-2), 145-
156.
Feng, Y., Li, G., Lv, X., Xu, Y., Wu, Q., Shi, C., Li, Q., Yan, B., Wang, X., Xi, M. & Xia,
X. (2014). Prevalence, distribution, and diversity of Escherichia coli, Staphylococcus
aureus, and Salmonella in kiwifruit orchards and processing plants. Foodborne
Pathogens and Disease, 11(10), 782-790.
Feng, P., Weagant, S. D., Grant, M. A., Burkhardt, W., Shellfish, M. & Water, B. (2002).
BAM: Enumeration of Escherichia coli and the Coliform Bacteria. Bacteriological
Analytical Manual.
Feng, Y., Yang, Q., Wang, L., Li, G., Lv, X., Han, Q. A., Liu, X. & Xia, X. (2015). Survey
of microbial contamination and characterization of Escherichia coli in kiwifruit

27
orchards in Shaanxi, China, 2013. In Press: Foodborne Pathogens and Disease,
doi:10.1089/fpd.2015.1967.
Findlay, J. S. & Combrink, J. C. (2013). South African controlled atmosphere storage
operators manual. Published by, SA Apple and Pear Producers’ Association. First ed.
Appendix 1. P 52- 53, 97.
Food and Agriculture Organisation Stat. (2015). Food and Agricultural commodities
production, countries by commodity. [ONLINE] Available at: http://faostat3.fao.org/
browse/rankings/countries_by_commodity/E [Accessed 07 August 2015].
Food Recalls Europe. (2015). Food Recalls [ONLINE] Available at:
https://foodrecallseurope.wordpress.com/ [Accessed 23 August 2015]
Foodborne Illness. 2015. Foodborne illness, Salmonella. [ONLINE] Available at:
http://www.foodborneillness.com/salmonella_food_poisoning/ [Accessed 21 August
2015].
Global Food Safety Initiative. (2015). GFSI Standards Scheme, GFSI Certification.
[ONLINE] Available at: http://globalfoodsafetyresource.com/industry-standards/gfsi-
certification [Accessed 15 August 2015].
Global Trade Atlas. (2014). Global Trade Atlas. [ONLINE] Available at:
http://www.gtis.com/english/GTIS_GTA.html [Accessed 5 February 2015].
Global-GAP. (2015). Harmonized Produce Safety. [ONLINE] Available at:
http://www.globalgap.org/uk_en/what-we-do/globalGAP-certification/harmonized-
produce-safety/ [Accessed 5 February 2015].
Gould, L. H., Walsh, K. A., Vieira, A. R., Herman, K., Williams, I. T., Hall, A. J. & Cole,
D. (2013). Surveillance for foodborne disease outbreaks—United States, 1998–2008.
MMWR Surveillance Summary, 62(2), 1-34.
Hara-Kudo, Y. & Takatori, K. (2011). Contamination level and ingestion dose of foodborne
pathogens associated with infections. Epidemiology and Infection, 139(10), 1505-
1510.
Heaton, J. C. & Jones, K. (2008). Microbial contamination of fruit and vegetables and the
behaviour of enteropathogens in the phyllosphere: a review. Journal of Applied
Microbiology, 104(3), 613-626.

28
Holfelder, M., Betz, U., Bertsch, B. & Eigner, U. (2013). Comparative evaluation of
selective agar media, matrix-assisted laser desorption/ionisation-time of flight mass
spectrometry (MALDI-TOF MS), polymerase chain reaction (PCR) and phenotypic
methods for the detection of carbapenemase-producing Enterobacteria. Poster
Presentation. Berlin, Germany. European Society of Clinical Microbiology and
Infectious Diseases.
Hulebak, K. L. & Schlosser, W. (2002). Hazard analysis and critical control point (HACCP)
history and conceptual overview. Risk Analysis, 22(3), 547-552.
Iturriaga, M. H. & Escartin, E. F. (2010). Changes in the effectiveness of chlorine treatments
during colonization of Salmonella Montevideo on tomatoes. Journal of Food Safety,
30(2), 300-306.
ISO Standards - ISO. (2015). ISO Standards - ISO. [ONLINE] Available at:
http://www.iso.org/iso/home/standards.htm. [Accessed 18 September 2014].
ISO 22000 Food Safety Plain English Dictionary. (2015). [ONLINE] Available at:
http://www.praxiom.com/iso-22000-definitions.htm [Accessed 05 May 2015].
Janisiewicz, W. J. (2012). Biological control of postharvest diseases: hurdles, successes and
prospects. In II International Organic Fruit Symposium 1001 (pp. 273-283).
Kaper, J. B., Nataro, J. P. & Mobley, H. L. (2004). Pathogenic Escherichia coli. Nature
Reviews Microbiology, 2(2), 123-140.
Kirezieva, K., Luning, P. A., Jacxsens, L., Allende, A., Johannessen, G. S., Tondo, E. C.,
Rajkovicb, A., Uyttendaeleb, M. & van Boekel, M. A. (2015). Factors affecting the
status of food safety management systems in the global fresh produce chain. Food
Control, 52, 85-97.
Kirezieva, K., Jacxsens, L., Uyttendaele, M., Van Boekel, M. A. & Luning, P. A. (2013).
Assessment of food safety management systems in the global fresh produce chain.
Food Research International, 52(1), 230-242.
Kotiranta, A., Lounatmaa, K. & Haapasalo, M. (2000). Epidemiology and pathogenesis of
Bacillus cereus infections. Microbes and Infection, 2(2), 189-198.
Kurjak, A. & Chervenak, F. A. (Eds.). (2006). Textbook of Perinatal Medicine (2nd ed.).
United Kingdom: Informa UK Ltd.

29
Law, J. W. F., Ab Mutalib, N. S., Chan, K. G. & Lee, L. H. (2014). Rapid methods for the
detection of foodborne bacterial pathogens: principles, applications, advantages and
limitations. Frontiers in microbiology, 5.Lebeis, S. L. (2014). The potential for give
and take in plant-microbiome relationships. Frontiers in Plant Science, 5, 287, 1-6.
Lebeis, S. L. (2014). The potential for give and take in plant–microbiome relationships.
Frontiers in Plant Science, 5.
Leben, C. (1965). Epiphytic microorganisms in relation to plant disease. Annual Review of
Phytopathology, 3(1), 209-230.
Leff, J. W. & Fierer, N. (2013). Bacterial communities associated with the surfaces of fresh
fruits and vegetables. PloS one, 8(3), e59310.
Leggett, H. C., Cornwallis, C. K. & West, S. A. (2012). Mechanisms of pathogenesis,
infective dose and virulence in human parasites. PLoS pathogens, 8(2), e1002512.
Levine, M. (1918). Differentiation of B. coli and B. aerogenes on a simplified eosin-
methylene blue agar. The Journal of Infectious Diseases, 43-47.
Lunning, P. A., Chinchilla, A. C., Jaxsens, L., Kirezieva, K. & Rovira, J. (2013).
Performance of safety management systems in Spanish food service establishments in
view of their context characteristics. Food Control 30: 331-340.
Nataro, J. P. & Kaper, J. B. (1998). Diarrheagenic Escherichia coli. Clinical Microbiology
Reviews, 11(1), 142-201.
Olaniran, A. O., Naicker, K. & Pillay, B. (2009). Antibiotic profiles of Escherichia coli
isolates from river sources in Durban South Africa. World Journal of Microbiology
and Biotechnology. 25, 1743–1749.
Omar, K. B., & Barnard, T. G. (2010). The occurrence of pathogenic Escherichia coli in
South African wastewater treatment plants as detected by multiplex PCR. Water SA,
36(2), 172-176.
Patrick, M. E., Adcock, P. M., Gomez, T. M., Altekruse, S. F., Holland, B. H., Tauxe, R. V.
& Swerdlow, D. L. (2004). Salmonella Enteritidis infections, United States, 1985-
1999. Emerging infectious diseases, 10(1), 1-7.

30
Perishable Products Export Control Board. (2013). Published by the Perishable Products
Export Control Board in association with Malachite Communications. Pp.2-28, 4-30
and 4-39.
Public Health Agency of Canada. (2011). Escherichia coli. [ONLINE] Available at:
http://www.phac-aspc.gc.ca/lab-bio/res/psds-ftss/escherichia-coli-eng.php [Accessed
28 July 2015].
Rapid Alert for Food and Feed. (2015). RASFF - Food and Feed Safety Alerts. [ONLINE]
Available at: http://ec.europa.eu/food/safety/rasff/index_en.htm [Accessed 07 August
2015].
Rapid Alert for Food and Feed. (2014). RASFF for safer food, The Rapid Alert System for
Food and Feed, 2014 Annual Report. [ONLINE] Available at: http://ec.europa.eu/
food/safety/rasff/docs/rasff_annual_report_2014.pdf [Accessed 07 August 2015].
Ramaswamy, V., Cresence, V. M., Rejitha, J. S., Lekshmi, M. U., Dharsana, K. S., Prasad,
S. P. & Vijila, H. M. (2007). Listeria-review of epidemiology and pathogenesis.
Journal of Microbiology Immunology and Infection, 40(1), 4.
Rembacken, B. J., Snelling, A. M., Hawkey, P. M., Chalmers, D. M. & Axon, A. T. R.
(1999). Non-pathogenic Escherichia coli versus mesalazine for the treatment of
ulcerative colitis: a randomised trial. The Lancet, 354(9179), 635-639.
Rodgers, S. L., Cash, J. N., Siddiq, M. & Ryser, E. T. (2004). A comparison of different
chemical sanitizers for inactivating Escherichia coli O157:H7 and Listeria
monocytogenes in solution and on apples, lettuce, strawberries, and cantaloupe.
Journal of Food Protection, 67(4), 721-731.
Schmid-Hempel, P. & Frank, S. A. (2007). Pathogenesis, virulence, and infective dose. PLoS
Pathogens, 3(10).
South African Apple and Pear Association. (2013). South African Controlled Atmosphere
Storage Operator’s Manual. [ONLINE] Available at: http://www.hortgro.co.za
/?wpfb_dl=850. [Accessed 09 August 2015].
Standing, T., du Plessis, E. M, Duvenage, S. & Korsten, L. (2013). Internalisation potential
of Escherichia coli O157:H7, Listeria monocytogenes, Salmonella enterica subsp.
enterica serovar Typhimurium and Staphylococcus aureus in lettuce seedlings and
mature plants. Journal of Water and Health, 11 (2), 210-223.

31
Strawn, L. K., Gröhn, Y. T., Warchocki, S., Worobo, R. W., Bihn, E. A. & Wiedmann, M.
(2013). Risk factors associated with Salmonella and Listeria monocytogenes
contamination of produce fields. Applied and Environmental Microbiology, 79(24),
7618-7627.
The Registrar Company. (2015). HACCP. [ONLINE] Available at: http://theregistrarco.com
registration/haccp/ [Accessed 28 July 2015].
Thomas, E. J., King, R. K., Burchak, J. & Gannon, V. P. (1991) Sensitive and specific
detection of Listeria monocytogenes in milk and ground beef with the polymerase
chain reaction. Applied and Environmental Microbiology. 57, 2576–2580.
United States Food and Drug Administration. (2010). Food Bill Aims to Improve. FDA
Consumer Health Information. [ONLINE] Available at: www.fda.gov/consumer
[Accessed 28 July 2015].
United States of America Food and Drug Administration. (2012). Guidance for Industry:
Testing for Salmonella Species in Human Foods and Direct-Human-Contact Animal
Foods. [ONLINE] Available at: http://www.fda.gov/food/guidanceregulation
/guidancedocumentsregulatoryinformation/salmonella/ucm295271.htm [Accessed 10
August 2015].
United States of America Food and Drug Administration. (2013). Chapter 7: Recall
Procedures In: Regulatory Procedures Manual. Food and Drug Administration,
Maryland, USA [ONLINE] Available at: http://www.fda.gov/downloads/ICECI/
ComplianceManuals/RegulatoryProceduresManual/UCM074312.pdf [Accessed 07
August 2015].
United States of America Food and Drug Administration. (2015). Recalls, Market
Withdrawals, & Safety Alerts. [ONLINE] Available at: http://www.fda.gov/
Safety/Recalls/ [Accessed 24 August 2015].
Wei, C. I., Huang, T. S., Kim, J. M., Lin, W. F., Tamplin, M. L. & Bartz, J. A. (1995).
Growth and survival of Salmonella Montevideo on tomatoes and disinfection with
chlorinated water. Journal of Food Protection, 58(8), 829-836.
World apple and pear association. (2015) Promotion and consumption. [ONLINE] Available
at: http://www.wapa-association.org/asp/page_1.asp ?doc_id=452 [Accessed 10 July
2015].

32
World Health Organisation (WHO). (2011). Enterohaemorrhagic Escherichia coli (EHEC).
[ONLINE] Available at: http://www.who.int/mediacentre/factsheets/fs125/en/
[Accessed 20 August 2015].

33
CHAPTER 3
COLONISATION AND SURIVIVAL OF FOUR MAJOR BACTERIAL FOODBORNE
PATHOGENS ON PEAR FRUIT (cv. FORELLE) SURFACES
ABSTRACT
Foodborne pathogens associated with fresh produce disease outbreaks include Escherichia coli
O157:H7, Listeria monocytogenes, Salmonella enterica subsp. enterica serovar Typhimurium,
and to a lesser extent Staphylococcus aureus. Foodborne pathogens have been shown to
contaminate fresh produce and survive on these surfaces for extended periods of time, therefore
possibly leading to foodborne illnesses. In this study the ability of foodborne pathogens to
survive on pear fruit surfaces was investigated. Freshly harvested pear fruit, cv. Forelle, were
spot inoculated (105cfu/ml, low and 107cfu/ml, high concentration) and then stored under cold
storage (5°C) conditions for one week to simulate direct, local, trading conditions. Viable
counts on chromogenic media were used to determine the survival of the foodborne pathogens
while scanning electron microscope was used to monitor the development of attachment
structures, formation of microcolonies and colonisation. Viable counts of foodborne pathogens
on fruit inoculated with high concentrations reflected a gradual increase in pathogen titres from
immediately after inoculation to one hour later. Following cold storage conditions of 5°C after
one day all microbial titres decreased significantly. No significant trend were observed
following low concentration inoculation but there was an overall decrease in titres. Attachment
structures from the pathogens on the fruit surfaces were visible within 30 seconds of exposure
time with E. coli O157:H7 and Salmonella Typhimurium. All pathogens were able to colonise
the pear surface by forming microcolonies following longer exposure times. High artificial
inoculation studies indicated that only Salmonella Typhimurium survived at titres that would
exceed the minimum infectious dose. In contrast, following low concentration inoculation
studies, E. coli O157:H7 and Salmonella Typhimurium were able to survive at concentrations
exceeding the minimum infectious dose. In conclusion, contaminated prior to a seven day
storage period at refrigeration temperatures, only E. coli O157:H7 and Salmonella
Typhimurium have the ability to survive on the fruit. However these conclusions are based on
simulated laboratory conditions and artificial inoculum concentrations. Future studies should
investigate other environmental factors, lower inoculation loads as well as host response to the
interaction of foodborne pathogens, natural occurring biocontrol microorganisms, and host
specific plant pathogenic and residential epiphytic microorganisms on the fruit surfaces.
34
1. INTRODUCTION
Bacterial foodborne pathogens on fresh produce have become a major topic in all the food
safety related studies. The effect of human foodborne pathogen exposure and contamination of
fresh produce could potentially be life threatening, and result in major disease outbreaks. In
the United States of America (USA) alone it is estimated that 1 351 deaths occur and 55 961
people are hospitalised annually as a result of consumption of contaminated food products
(Scallan et al., 2011). The estimated number of sporadic foodborne diseases cases reported in
the USA account for 9.4 million illnesses (Scallan et al., 2011). Figures such as these are often
considered as underestimations as not all incidences are recorded or reported (Mead et al.,
1999). In developing countries foodborne illness statistics are particularly underestimated
because foodborne illness surveillance systems are not as effective and sometimes does not
even exist.
The South African Registry for the Food Safety Profession concluded through a survey done in
2011 that an estimated 16 million people are affected by foodborne illnesses annually, of these
cases 37 000 resulted in death with diarrhoeal symptoms (Petersen, 2011). No formal scientific
article could support this information but it has been reported on in local newspaper. One
example is for instance an episode of foodborne illnesses (the causal agent not released) that
occurred in April 2013 which resulted in one fatality, and 27 hospitalisations (Mthethwa, 2013).
Another example was in June 2014 through drinking of Escherichia coli contaminated river
water which led to two mortalities (Mbangeni & Lee, 2014). The Human Rights Commission
stated that16 million South Africans do not have access to clean safe water (National Institute
for Communicable Disease, 2013). A six month monitoring period recorded 423 cases of acute
poisonings in South African hospitals, where 5.4% (n=23) were foodborne related (Malangu &
Ogunbanjo, 2009).
Foodborne pathogens that can typically cause foodborne disease outbreaks on freshly consumed
fruit and vegetables are E. coli O157:H7, Listeria monocytogenes, Salmonella enterica subsp.
enterica serovar Typhimurium and to lesser extent Staphylococcus aureus (Batz et al., 2012;
Buck et al., 2003; Nguyen, 2012; Olaimat & Holley, 2012). In the USA from 2006 to 2014 a
total of 66 foodborne outbreaks were investigated, 30% of the incidences were E. coli, 6% were
cases of L. monocytogenes and 57% were cases of Salmonella spp. [Centres for Disease Control
and Prevention (CDC), 2014a; Centre for Science in the Public Interest (CSPI), 2013]. Fresh
produce were the source of the contamination in 15 Salmonella spp. outbreaks, these products

35
included cucumbers, mangoes, cantaloupe, nuts, papaya, alfalfa sprouts and tomatoes. Seven
E. coli outbreaks were associated with fresh produce which included salad mix, clover sprouts,
Romaine lettuce, hazelnuts and spinach. Only one L. monocytogenes outbreak was associated
with fresh produce (cantaloupe). Currently a significant number of outbreaks of foodborne
diseases have been linked to the increase in consumption of fresh fruits, vegetables and salads
[Brackett, 1999; Beuchat, 2002; CDC, 2015a; CDC, 2015b; CDC, 2015c; CDC, 2014b; CDC,
2013; CDC, 2012; Freshfel, 2013)].
The increase in number of foodborne pathogen outbreaks yearly are attributed to a number of
factors. These include the increase in consumption of fresh produce, increased surveillance and
consumer awareness of foodborne illnesses as well as an increase proportion of consumers
being immunocompromised. The likelihood that fresh produce can become contaminated has
lead producers, exporters and retailers to increase food safety assurance measures. Food safety
assurance can be achieved through voluntary and trade enforced food safety management
practices that ensure all the appropriate controls are in place to avoid contamination of the
product along the supply chain (Hanning et al., 2009).
Bacterial contamination of fresh produce can occur at any point along the supply chain
(Brackett, 1999; De Roever, 1998). Foodborne pathogens can be introduced to the fruit surface
and contaminate the product through the use of contaminated irrigation and pesticide water,
unpasteurised manure, the unsanitary handling of fruit, contaminated fruit wash water,
ineffective sanitation systems as well as contaminated equipment (Althaus et al., 2012,
Brackett, 1999; De Roever, 1998; James, 2006; Koo et al., 2014; Lambertz et al., 2013). A
number of previous studies have demonstrated that E. coli, L. monocytogenes, Salmonella spp.
and S. aureus are able to attach, colonise and form biofilms on the surfaces of plant tissue
(Annous et al., 2005; Bae et al. 2013; Barak et al. 2002; Brandl & Mandrell, 2002; Charkowski
et al., 2002; Cooley et al., 2003; Collignon & Korsten, 2010; Han et al., 2000; Palumbo et al.,
2005; Patel & Sharma, 2012; Richards et al., 2004; Sirinutsomboon et al., 2011; Solomon &
Matthews, 2006; Tang et al., 2012). To the authors’ knowledge no studies have investigated
the attachment, colonisation and survival of E. coli O157:H7, L. monocytogenes, Salmonella
Typhimurium and S. aureus on pear fruit surfaces.
The aim of the study was therefore to determine the ability of these foodborne pathogens to
attach, colonise and survive on pear fruit (Pyrus communis cv. Forelle) surfaces under simulated
cold chain conditions for direct marketing of fruit.

36
2. MATERIALS AND METHODS
2.1. CULTURES
American Type Culture Collection (ATCC) cultures of E. coli O157:H7 (ATCC 35150), L.
monocytogenes (ATCC 19115), S. enterica subsp. enterica serovar Typhimurium (ATCC
14028), and S. aureus (ATCC 12600) were used. All pure cultures were maintained freeze
dried and stored at -70°C. Subcultures were grown on Baird-Parker agar (BP) for S. aureus,
Oxford Listeria selective agar (OL) for L. monocytogenes, Levine eosin–methyl blue agar
(EMB) for E. coli O157:H7, and xylose lysine deoxycholate agar (XLD) for Salmonella
Typhimurium (All media were purchased from Merck, Johannesburg, South Africa) prepared
24 hours before use and culture preparations for inoculation done according to Collignon and
Korsten (2010). The final inoculum concentrations were at 7 log CFU/ml (high) and 5 log
CFU/ml (low). Titres were confirmed by serial dilution and subsequent plating in duplicate.
2.2. FRUIT
Freshly harvested physiological mature pear fruit (Pyrus communis cv. Forelle) of similar
morphological characteristics (size and weight) with no pest, disease or mechanical damage
were sourced from a commercial farm in the Western Cape Province of South Africa. Fruit
collected were placed in paper bags, transported in cooler boxes and stored at 4°C
(approximately 12 to 15 h) before processing. The cultivar was used because it is one of the
most important export cultivars (20.07 %; PPECB, 2014) and has a soft skin that is easily
perishable.
Eighty pears were inoculated for pathogen quantification and 20 fruit for scanning electron
microscopy (SEM) analysis. The fruit were divided into three sets. Set 1 and Set 2 were used
to quantify the pathogen titre. Set 1 fruit were used for high-inoculum inoculation and consisted
of 50 pears (5 replicates for 9 time intervals selected plus 5 negative controls). Set 2 were used
for low-inoculum inoculation and consisted of 30 pears (5 replicates for 5 time intervals
selected, plus 5 negative controls). Set 3 was used for SEM analysis and consisted of 20 pears
(9 time intervals with 4 pathogens per fruit and 1 negative control per time interval). Fruit for
SEM studies were surface sterilised using a 30 seconds dip treatment in 70% ethanol (Spurr,
1979) followed by air drying in the laminar flow cabinet. Fruit from Set 1 and Set 2 were
washed with 0.05% (vol/vol) sodium hypochlorite for 30 seconds, rinsed twice with sterile
distilled water, and allowed to air dry in the laminar flow cabinet.

37
2.3. INOCULATION AND STORAGE OF FRUIT
Spot inoculation of high, low concentration and SEM sample preparation was conducted as
outlined by Collignon and Korsten (2010) with the following time intervals for the SEM and
high concentration: 0, 30 and 60 seconds, 15 minutes, 1 hour, 1, 2, 5 and 7 days. The low
concentration inoculated fruit were analysed at the following time intervals: 0 seconds, 1, 2, 5
and 7 days. Inoculated fruit were stored at 5oC immediately after inoculation until the following
time intervals: 1, 2, 5 and 7 days. Cold storage up to a week was used to simulate the local pear
distribution system to the point of sale.
Following spot inoculation, the concentrations of all cultures were confirmed by serial dilution
and plating onto selective media [BP (Merck) for S. aureus, OL (Merck) for L. monocytogenes,
EMB (Merck) for E. coli O157:H7, and XLD (Merck) for Salmonella Typhimurium].
2.4. METHODOLOGY FOR QUANTIFICATION OF MICROORGANISMS
Following outlined time intervals, fruit were washed and bacterial pathogen titres were
quantified (Collignon and Korsten, 2010). Volume displacement (vd) was also recorded for
each fruit and converted to area (cm2) (De Jager, 1999) to determine a CFU/cm2:
A = 4.84 [(vd)⅓]2
Counts were converted to CFU/cm2 and transformed to log (x+1) CFU/cm2.
2.5. SCANNING ELECTRON MICROSCOPY
Set of three fruit were used for the SEM evaluation and uninoculated fruit was used as a negative
control. The excised sections were stored, critical point dried, mounted and viewed according
to Coetzee and van der Merwe (1994).
Sample analysis under the SEM started with the negative control to ensure no contaminating
microorganisms were present on the fruit surface and to become familiar with the carpoplane.
A positive control was viewed to familiarise the viewer with actual bacterial shapes and sizes.
Thereafter the later time intervals were viewed to ensure recognition of pathogenic
microorganisms followed by the rest of the samples. Viewing constituted of 15 randomly
selected areas, with a magnification set at 3000x, authors ascertain glycocalyx formation,
replication and biofilm formation based on visual observations and comparisons with previous
publications described by Yaron and Römling (2014).

38
2.6. STATISTICAL ANALYSIS
Five replicates were used throughout and the experiment was repeated once. Statistical analysis
was performed on log CFU/cm2 and log cells/cm2. Data were analysed using SAS 9.2 for
Windows (SAS Institute Inc., Cary, NC). A one-way analysis of variance was used to
determine the difference in pathogen titres on fruit surfaces. At a 5% level of significance and
by using least significant differences (using the Fisher test), means were able to be determined.
3. RESULTS
The results reflect viable counts of the bacterial pathogens over a predetermined timeframe.
The growth trend on fruit inoculated with a high concentration show a common peak at one
hour by all four pathogens tested, thereafter all pathogen titres decreased significantly (Figure
3.1 and Table 3.1). Growth of pathogens on fruit inoculated with a low concentration inoculum
had varying results. All individual results are further outlined per pathogen group.
Scanning electron microscope image results depicting survival are supported through the total
viable count data (Figure 3.3, Figure 3.4, Figure 3.5 and Figure 3.6). The uninoculated pear
surface characteristics had no epiphytic or other residential microbes present (Figure 3.2).
Attachment and colonisation could be confirmed through comparative description of similar
referenced articles as well as SEM imaging and expert assessment.
3.1. PEAR FRUIT SURFACE NEGATIVE CONTROL
Negative controls under the SEM showed that the surface was free of contamination, therefore
demonstrating that the surface disinfection was effective (Figure 3.2). Surfaces were
considered to be smooth with no trichomes and or other structures. The pear fruit surfaces were
covered with micro cracks and the occasional minor microscopic mechanical damage i.e.
ruptures of the pear skin.

39
Figure 3.1. Escherichia coli O157:H7, Listeria monocytogenes, Salmonella enterica subsp. enterica serovar Typhimurium and Staphylococcus
aureus growth trends on pear surfaces over a period of seven days in cold storage conditions (5°C) following inoculation with a high concentration
inoculum.
Area and time intervals shaded in blue indicate when fruit were stored at refrigeration temperatures (5°C).
0
0,5
1
1,5
2
2,5
3
3,5
4
4,5
0s 30s 60s 15min 1h 1d 2d 5d 7d
Mic
rob
ial
titr
es
Log
CF
U/c
m²
Time intervals
Escherichia coli O157:H7 Listeria monocytogenes Salmonella Typhimurium Staphylococcus aureus

40
Table 3.1. Escherichia coli O157:H7, Listeria monocytogenes, Salmonella enterica subsp.
enterica serovar Typhimurium and Staphylococcus aureus growth on pear surfaces over a
period of seven days in cold storage conditions (5°C) following inoculation with a high and low
concentration inoculum, respectively
Time
Interval
Escherichia
coli O157:H7
Listeria
monocytogenes
Salmonella
Typhimurium
Staphylococcus
aureus
Hig
h I
no
culu
m
con
cen
trati
on
(7 l
og
CF
U/m
l)
0s 3.14 bc 2.68 b * 4. 38 a
30s 3.29 bc 3.10 ab 2.54 de 2.73 c
60s 3.49 abc 2.50 b 3.14 bc 3.18 bc
15min 3.83 ab 3.36 ab 3.42 b 2.80 c
1h 4.37 a 4.08 a 4.15 a 4.35 a
1d 2.60 cd 0.59 c 2.03 ef 3.96 ab
2d 2.62 cd 1.11 c 1.71 fg 3.52 abc
5d 2.57 cd 0.89 c 1.86 fg 3.91 ab
7d 1.71 d 0.57 c 1.43 g 3.87 ab
Lo
w I
no
culu
m
con
cen
trati
on
(5 l
og
CF
U/m
l) 0s 2.71 a 0.85 b 1.52 a 2.45 a
1d 2.41 a 1.60 a 1.78 a 1.96 ab
2d 1.90 a 0.06 c 1.44 a 1.26 c
5d 2.26 a 0.02 c 1.70 a 1.68 bc
7d 2.08 a 0.46 bc 1.29 a 1.64 bc
Bolded small caps represent the least significant difference according to the Fischer Test (P<0.05). Values shaded in blue
indicate when fruit were stored at refrigeration temperatures (5°C).
Figure 3.2. Electron micrograph of the pear surfaces (x4 500 magnification).
(A) The pear surfaces have numerous micro cracks. (B) The rupture in the surface indicates a possible niche area
with possible flow of nutrients that may occur here, but is clear of microorganism contamination.
B A

41
3.2. ESCHERICHIA COLI O157:H7
Escherichia coli O157:H7 titres on fruit inoculated with low concentration inoculum were not
significantly different from fruit viewed immediately to seven days after inoculation, following
storage at refrigeration temperatures (Table 3.1). Titres on fruit inoculated with high
concentrations showed an overall gradual decrease from immediately to seven days after
inoculation (Figure 3.1 and Table 3.1). Titres were the highest after 60 seconds, 15 minutes
and 1 hour, thereafter titres were significantly lower at 1 day after storage at 5°C.
Attachment structures were observed following 60 seconds (Figure 3.3 A) and colonisation was
evident with the observation of replication at 2 days (Figure 3.3 B).
Figure 3.3. Scanning electron micrographs of Escherichia coli O157:H7 at various time
intervals.
Escherichia coli O157:H7 on pear fruit surfaces at 1 minute (A) and 2 days (B) where replication was observed
(A and B) taken at magnification of 4,500x and 11,000x.
3.3. LISTERIA MONOCYTOGENES
Listeria monocytogenes titres on fruit following low concentration inoculation were the highest
following one day storage at refrigeration temperatures (Table 3.1). Following one day storage
at 5°C the titres decreased significantly and remained unchanged to the end of the cold chain.
In contrast titres on fruit following high concentration inoculation remained not significantly
different from immediately after inoculation to one hour followed by a significant decrease in
titres were observed following one day cold storage (Figure 3.1 and Table 3.1). Titres remained
A B

42
unchanged from 1 to 7 days cold storage. Replication was observed as early as 60 seconds and
further colonisation was observed following two days (Figure 3.4).
Figure 3.4. Scanning electron micrographs of Listeria monocytogenes at various time intervals
Listeria monocytogenes on pear fruit surfaces at 1 minute (A) and 1 day (B) where replication can be seen. Both
were taken at 4,500x magnification.
Figure 3.5. Scanning electron micrographs of Salmonella enterica subsp. enterica serovar
Typhimurium at various time intervals.
Salmonella enterica subsp. enterica serovar Typhimurium on pear fruit surfaces at 1 minute (A) and 15 minutes
(B), where attachment (A) structures and replication (B) were observed. Figure A was taken at a magnification of
9,000x and B were taken at 5,000x magnification.
A B
A B

43
3.4. SALMONELLA ENTERICA SUBSP. ENTERICA SEROVAR TYPHIMURIUM
Analysis of the low concentration Salmonella Typhimurium had no significant difference from
immediately post-inoculation to the end of the simulated cold chain (Table 3.1). High
concentration inoculation demonstrated that Salmonella Typhimurium titres had a constant
significant increase peaking after 1 hour (Figure 3.1 and Table 3.1). A further decrease in titre
was observed from 1 hour to the end of the cold storage period.
Extensive attachment structures were observed under the SEM as early as 1 minute (Figure 3.5
A) and replication was observed as early as 30 seconds (data not shown). At 15 minutes (Figure
3.5 B) colonisation starts taking place with attachment structures beginning to form more
expansive structures and replication was observed to be active.
3.5. STAPHYLOCOCCUS AUREUS
There was a significant decrease in low inoculum inoculation titres after 48 hours storage at
refrigeration temperatures, and there after populations remained consistent showing no further
growth or significant increase in numbers (Table 3.1). Staphylococcus aureus titres regained
original titres as were observed immediately after inoculation at 1 hour and thereafter did not
change significantly until the completion of the cold storage period after inoculation with high
concentration inoculums (Figure 3.6 and Table 3.1). Prior to 1 hour titres fluctuated in the
following manner: from immediately after inoculation to 30 seconds there was a significant
decrease, from 30 seconds to 15 minutes there was no significant difference and from 15
minutes to 1 hour there was a significant increase. Colonisation was observed through cell
replication and colony formation as early as 1 minute and 10 minutes, respectively (Figure 3.6).
4. DISCUSSION
Human pathogens may be introduced into the food chain from the production environment and
can survive up to the point of consumption by the consumer possibly resulting in foodborne
illness outbreaks (Todd et al., 2009). In this study the effect of a simulated cold chain and the
response of foodborne pathogenic microorganisms after high and low inoculum exposure on
pear fruit surfaces has been the main focus area. This aspect of food safety has to the authors
knowledge not yet been investigated and is important to provide a better understanding of
contact time, cross contamination potential and ability to survive under cold storage conditions.
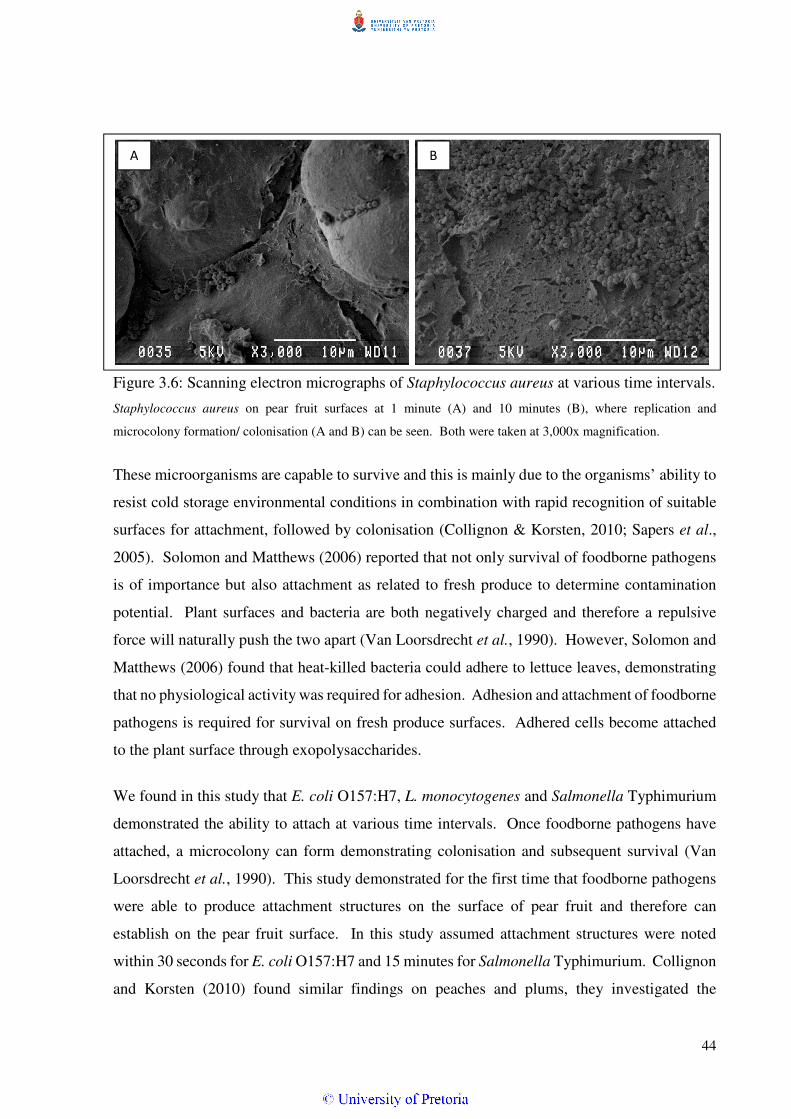
44
Figure 3.6: Scanning electron micrographs of Staphylococcus aureus at various time intervals.
Staphylococcus aureus on pear fruit surfaces at 1 minute (A) and 10 minutes (B), where replication and
microcolony formation/ colonisation (A and B) can be seen. Both were taken at 3,000x magnification.
These microorganisms are capable to survive and this is mainly due to the organisms’ ability to
resist cold storage environmental conditions in combination with rapid recognition of suitable
surfaces for attachment, followed by colonisation (Collignon & Korsten, 2010; Sapers et al.,
2005). Solomon and Matthews (2006) reported that not only survival of foodborne pathogens
is of importance but also attachment as related to fresh produce to determine contamination
potential. Plant surfaces and bacteria are both negatively charged and therefore a repulsive
force will naturally push the two apart (Van Loorsdrecht et al., 1990). However, Solomon and
Matthews (2006) found that heat-killed bacteria could adhere to lettuce leaves, demonstrating
that no physiological activity was required for adhesion. Adhesion and attachment of foodborne
pathogens is required for survival on fresh produce surfaces. Adhered cells become attached
to the plant surface through exopolysaccharides.
We found in this study that E. coli O157:H7, L. monocytogenes and Salmonella Typhimurium
demonstrated the ability to attach at various time intervals. Once foodborne pathogens have
attached, a microcolony can form demonstrating colonisation and subsequent survival (Van
Loorsdrecht et al., 1990). This study demonstrated for the first time that foodborne pathogens
were able to produce attachment structures on the surface of pear fruit and therefore can
establish on the pear fruit surface. In this study assumed attachment structures were noted
within 30 seconds for E. coli O157:H7 and 15 minutes for Salmonella Typhimurium. Collignon
and Korsten (2010) found similar findings on peaches and plums, they investigated the
A B

45
attachment, colonisation and survival of these four pathogens on plum and peach surfaces. The
authors found that E. coli O157:H7, L. monocytogenes and Salmonella Typhimurium were able
to produce exopolysaccharides on the surfaces and all four pathogens were able to produce
microcolonies. Furthermore the host–pathogen interactions of foodborne pathogens were not
only observed in this study but also on other fruit and vegetables (Berger et al., 2010; Collignon
& Korsten, 2010; Ziuzina et al., 2014). Future studies should confirm the production of
attachment structures using confocal microscopy.
Low E. coli attachment levels observed by Ziuzina et al. (2014) in a study done on cherry
tomatoes and strawberries were focussed on determining the residential epiphytic bacteria.
Therefore both in this study and that of Collignon and Korsten (2010) surface sterilisation were
applied in order to determine the full potential of the pathogenic bacteria without external
factors such as epiphytic microorganisms. External factors that could also influence attachment
levels (Ziuzina et al., 2014) include, fruit and vegetable surface morphology, epithelial
chemical excretions and microbe surface recognition (Keeratipibul et al., 2011). In this study
the pear surface was found to be non-corrugated, smooth surfaced with wax scales and without
trichomes making it a relative easy surface to colonise.
All foodborne pathogens in this study demonstrated the ability to form microcolonies.
Collignon and Korsten (2010) also observed that E. coli O157:H7, L. monocytogenes,
Salmonella Typhimurium and S. aureus were able to produce microcolonies on peach and plum
surfaces. Brandl and Matthews (2002) demonstrated that Salmonella enterica was able to
colonise the surface of cilantro leaves. Annous et al. (2005), Brandl and Mandrell (2002),
Charkowski et al. (2002) and Collignon and Korsten (2010) all similarly demonstrated that
foodborne pathogens are able to form microcolonies on plant tissues.
Staphylococcus aureus are naturally well known to survive nutrient poor surfaces for long
periods of time (Neely & Maley, 2000). Results reported by Neely and Maley (2000) show that
S. aureus are able to survive in hospital settings on plastics and fabrics exceeding 90 days.
Staphylococcus aureus have survived up to seven day cold storage under adverse cold storage
conditions at 5ºC. Similar results were found after a 10 day simulation of temperature
fluctuations imitating consumer handling of cold cuts (Røssvoll et al., 2014). A common
growth trend for all pathogens was observed in this study, with the growth peaking after one
hour at room temperature. Room temperature is close to the optimal temperature for all four
pathogens. However E. coli O157:H7, Salmonella Typhimurium and L. monocytogenes when

46
inoculated with high concentration showed a significant decrease after the beginning of cold
storage. Interestingly, titres of L. monocytogenes a known psychrotroph showed a significant
increase when inoculated using the low concentration inoculum but the same was not observed
for the high concentration inoculum. Low inoculation concentrations of Salmonella
Typhimurium indicated the highest survival and concentration rate followed by E. coli
O157:H7, S. aureus with L. monocytogenes surviving at the lowest titres. Listeria
monocytogenes is a psychrotrophic organism that is not only able to survive at refrigeration
temperatures but can proliferate. Listeria monocytogenes was not able to proliferate on the
surface of pears under cold conditions within seven day study period. In contrast a study done
by Beuchat and Brackett (1990) after eight days showed that Listeria significantly increase at
refrigerated temperatures on lettuce.
All four foodborne pathogens are capable of contaminating different food sources (CDC, 2014).
Therefore it is important to determine how the bacterial foodborne pathogens interact and
survive on fruit and vegetable surfaces in order to implement the appropriate control steps
required within the production and transport environments. This is the first report of the
survival of foodborne pathogens on pear surfaces. Following the cold storage of pears that were
artificially contaminated with unrealistically high concentrations of foodborne pathogens, only
Salmonella Typhimurium was able to survive at titres that could potentially lead to foodborne
illnesses since the minimal infectious dose of Salmonella is 101 cells [USA Food and Drug
Administration (FDA), 2009]. If fruit were contaminated with high concentration of foodborne
pathogens and consumed seven days after cold storage it may represent a hazard, provided the
organisms’ growth followed the same trend. The fruit inoculated with the low concentration of
E. coli O157:H7 and Salmonella Typhimurium could also affect consumer health even if
consumed within a week after cold storage since final titres exceeded the minimum infectious
dose (FDA, 2009). Staphylococcus aureus was the organism which best survived cold storage
conditions. However the toxin producing minimum titre of S. aureus is log 5 and in this study
that value was not achieved under these cold storage conditions (FDA, 2009).
Even though these foodborne pathogens have the capability to rapidly attach, multiply and
colonise on the pear fruit surface, the detection of these organisms are limited due to sample
size and the hurdle technologies within the supply chain system (Chapter 4). Foodborne
pathogen detection in the supply chain of four pear production farms over two consecutive
seasons showed that no E. coli O157:H7 were found throughout the study but Salmonella

47
Typhimurium and L. monocytogenes were detected on orchard pear samples (Chapter 4).
Therefore consumers of fresh pear fruit have a low probability to be exposed to foodborne
pathogens due to production storage and packing practices (Chapter 4).
5. CONCLUSION
Under more realistic conditions (inoculum load of 104 CFU/fruit), E. coli O157:H7, L.
monocytogenes and Salmonella Typhimurium did not change significantly in concentration
throughout the simulated cold chain. Staphylococcus aureus had a significant overall decrease
in titres from point of inoculation to the simulated local market point of sale. It was observed
that all of the pathogens were capable of colonising and surviving on the pear fruit surfaces.
Escherichia coli O157:H7 and Salmonella Typhimurium were able to survive at a high enough
titre that exceeded the pathogens theoretical infectious dose. Survival of a pathogen at such a
threshold level could potentially lead to food poisoning. Foodborne pathogens were detected
early in the pear supply chain but following postharvest handling of chemical drenching and
controlled atmosphere storage none of the above mentioned foodborne pathogenic microbial
bacteria detected (Chapter 4). Therefore effective food safety management practices should
ensure that contamination must be prevented, and survival of foodborne pathogens are
impaired. Future studies should investigate other environmental factors that influence the
survival of foodborne pathogens on pear surfaces as well as lower inoculation loads and longer
cold chain conditions. Other aspects such as host response to the interaction of foodborne
pathogens, natural occurring biocontrol microorganisms, host specific plant pathogenic and
residential epiphytic microorganisms on the fruit surfaces can contribute to a better
understanding of plant health.
6. REFERENCES
Althaus, D., Hofer, E., Corti, S., Julmi, A. & Stephan, R. (2012). Bacteriological Survey of
Ready-to-Eat Lettuce, Fresh-Cut Fruit, and Sprouts Collected from the Swiss Market.
Journal of Food Protection, 75, 1338-1341.
Annous, B. A., Solomon, E. B., Cooke, P. H. & Burke, A. (2005). Biofilm formation by
Salmonella spp. on cantaloupe melons. Journal of Food Safety, 25(4), 276-287.
Bae, D., Seo, K. S., Zhang, T. & Wang, C. (2013). Characterization of a potential Listeria
monocytogenes virulence factor associated with attachment to fresh produce. Applied
and environmental microbiology, 79(22), 6855-6861.

48
Barak, J. D., Whitehand, L. C. & Charkowski, A. O. (2002). Differences in attachment of
Salmonella enterica serovars and Escherichia coli O157: H7 to alfalfa sprouts. Applied
and environmental microbiology, 68(10), 4758-4763.
Batz, M. B., Hoffmann, S. & Morris Jr, J. G. (2012). Ranking the disease burden of 14
pathogens in food sources in the United States using attribution data from outbreak
investigations and expert elicitation. Journal of Food Protection, 75(7), 1278-1291.
Berger, C. N., Sodha, S. V., Shaw, R. K., Griffin, P. M., Pink, D., Hand, P. & Frankel, G.
(2010). Fresh fruit and vegetables as vehicles for the transmission of human pathogens.
Environmental microbiology, 12(9), 2385-2397.
Beuchat, L. R. (2002). Ecological factors influencing survival and growth of human pathogens
on raw fruits and vegetables. Microbes and Infection, 4(4), 413-423.
Beuchat, L. R. & Brackett, R. E. (1990). Survival and growth of Listeria monocytogenes on
lettuce as influenced by shredding, chlorine treatment, modified atmosphere packaging
and temperature. Journal of Food Science, 55(3), 755-758.
Brackett, R. (1999). Incidence, contributing factors, and control of bacterial pathogens in
produce. Postharvest Biology and Technology, 15(3), 305-311.
Brandl, M. T. & Mandrell, R. E. (2002). Fitness of Salmonella enterica serovar Thompson in
the cilantro phyllosphere. Applied and Environmental Microbiology, 68(7), 3614-3621.
Buck, J. W., Walcott, R. R. & Beuchat, L. R. (2003). Recent trends in microbiological safety
of fruits and vegetables. Plant Health Progress, 10, 1094.
Centres for Disease Control and Prevention. (2015a). Multistate outbreak of Listeriosis linked
to commercially produced, prepackaged caramel apples made from Bidart Bros Apples
(Final Update). [ONLINE] Available at: http://www.cdc.gov/listeria/outbreaks/caramel-
apples-12-14/index.html [Accessed 13 August 2015].
Centres for Disease Control and Prevention. (2015b). Outbreak of Salmonella Newport
infections linked to cucumbers — United States, 2014. [ONLINE] Available at:
http://www.cdc.gov/mmwr/preview/mmwrhtml/mm6406a3.htm?s_cid=mm6406a3_e
[Accessed 13 August 2015].
Centres for Disease Control and Prevention. (2015c). Multistate outbreak of Salmonella
Enteritidis infections linked to bean sprouts (Final Update). [ONLINE] Available at:
http://www.cdc.gov/salmonella/enteritidis-11-14/index.html [Accessed 13 August 2015].

49
Centres for Disease Control and Prevention. (2014a). List of selected multistate foodborne
outbreak investigations. [ONLINE] Available at: http://www.cdc.gov/foodsafety/
outbreaks/multistate-outbreaks/outbreaks-list.html [Accessed 15 February 2015].
Centres for Disease Control and Prevention. (2014b). Multistate outbreak of shiga toxin-
producing Escherichia coli O121 infections linked to raw clover sprouts (Final Update).
[ONLINE] Available at: http://www.cdc.gov/ecoli/2014/O121-05-14/index.html
[Accessed 13 August 2015].
Centres for Disease Control and Prevention. (2013). Multistate outbreak of shiga toxin-
producing Escherichia coli O157:H7 infections linked to ready-to-eat salads (Final
Update). [ONLINE] Available at: http://www.cdc.gov/ecoli/2013/O157H7-11-
13/index.html [Accessed 13 August 2015].
Centres for Disease Control and Prevention. (2012). Multistate outbreak of shiga toxin-
producing Escherichia coli O157:H7 infections linked to organic spinach and spring mix
blend (Final Update) [ONLINE] Available at: http://www.cdc.gov/ecoli/ 2012/O157H7-
11-12/index.html?s_cid= [Accessed 13 August 2015].
Centre for Science in the Public Interest. (2013). Outbreaks and recalls 2013 (USA). [ONLINE]
Available at: http://www.cspinet.org [Accessed 30 July 2013].
Charkowski, A. O., Barak, J. D., Sarreal, C. Z. & Mandrell, R. E. (2002). Differences in growth
of Salmonella enterica and Escherichia coli O157: H7 on alfalfa sprouts. Applied and
Environmental Microbiology, 68(6), 3114-3120.
Coetzee, J. & Van der Merwe, C. F. (1994). Preparation of biological material for electron
microscopy. Laboratory of Microscopy and Microanalysis, University of Pretoria,
Pretoria, South Africa.
Collignon, S. & Korsten, L. (2010). Attachment and colonization by Escherichia coli O157:H7,
Listeria monocytogenes, Salmonella enterica subsp. enterica serovar Typhimurium, and
Staphylococcus aureus on stone fruit surfaces and survival through a simulated
commercial export chain. Journal of Food Protection, 73(7), 1247-1256.
Cooley, M. B., Miller, W. G. & Mandrell, R. E. (2003). Colonization of Arabidopsis thaliana
with Salmonella enterica and enterohemorrhagic Escherichia coli O157: H7 and
competition by Enterobacter asburiae. Applied and Environmental Microbiology, 69(8),
4915-4926.

50
De Jager, E. S. (1999). Microbial ecology of the mango flower, fruit and leaf surfaces. MSc
(Agric) Thesis. University of Pretoria, Pretoria.
De Roever, C. (1998). Microbiological safety evaluations and recommendations on fresh
produce. Food Control, 9(6), 321-347.
Freshfel. (2013). Freshfel Consumption Monitor [ONLINE] Available at:
http://www.freshfel.org [Accessed 25 February 2013].
Han, Y., Linton, R. H., Nielsen, S. S. & Nelson, P. E. (2000). Inactivation of Escherichia coli
O157: H7 on surface-uninjured and-injured green pepper (Capsicum annuum L.) by
chlorine dioxide gas as demonstrated by confocal laser scanning microscopy. Food
Microbiology, 17(6), 643-655.
Hanning, I. B., Nutt, J. D. & Ricke, S. C. (2009). Salmonellosis outbreaks in the United States
due to fresh produce: sources and potential intervention measures. Foodborne Pathogens
and Disease, 6(6), 635-648.
James, J. (2006). Overview of microbial hazards in fresh fruit and vegetables operations.
Microbial hazard identification in fresh fruits and vegetables. J James. John Wiley &
Sons, Hoboken, 1-36.
Keeratipibul, S., Phewpan, A. & Lursinsap, C. (2011). Prediction of coliforms and Escherichia
coli on tomato fruits and lettuce leaves after sanitizing by using artificial neural networks.
LWT-Food Science and Technology, 44(1), 130-138.
Koo, O. K., Ndahetuye, J. B., O'Bryan, C. A., Ricke, S. C. & Crandall, P. G. (2014). Influence
of Listeria innocua on the attachment of Listeria monocytogenes to stainless steel and
aluminium surfaces. Food Control, 39, 135-138.
Lambertz, S.T., Ivarsson, S., Lopez-Valladares, G., Sidstedt, M. & Lindqvist, R. (2013).
Subtyping of Listeria monocytogenes isolates recovered from retail ready-to-eat foods,
processing plants and listeriosis patients in Sweden 2010. International Journal of Food
Microbiology. 166(1), 186-192.
Malangu, N. & Ogunbanjo, G. A. (2009). A profile of acute poisoning at selected hospitals in
South Africa: original research. Southern African Journal of Epidemiology and Infection,
24(2), 14-16.
Mbangeni, L. & Lee, J. (2014). Filthy-water death devastates mom. Star, 3 June. Ref No: 1304.

51
Mead, P. S., Slutsker, L., Dietz, V., McCaig, L. F., Bresee, J. S., Shapiro, C., Griffin, P. M. &
Tauxe, R. V. (1999). Food-related illness and death in the United States. Emerging
Infectious Diseases, 5(5), 607.
Mthethwa, Z. (2013). Pupil dies from food poisoning. Sowetan, 29 April. Ref No: 1573.
National Institute for Communicable Diseases. (2013). Annual Review 2011-2012. Centre for
Enteric Diseases. P10.
Neely, A. N. & Maley, M. P. (2000). Survival of enterococci and staphylococci on hospital
fabrics and plastic. Journal of Clinical Microbiology, 38(2), 724-726.
Nguyen-The, C. (2012). Biological hazards in processed fruits and vegetables–risk factors and
impact of processing techniques. LWT-Food Science and Technology, 49(2), 172-177.
Olaimat, A. N. & Holley, R. A. (2012). Factors influencing the microbial safety of fresh
produce: a review. Food Microbiology, 32(1), 1-19.
Palumbo, J. D., Kaneko, A., Nguyen, K. D. & Gorski, L. (2005). Identification of genes induced
in Listeria monocytogenes during growth and attachment to cut cabbage, using differential
display. Applied and Environmental Microbiology, 71(9), 5236-5243.
Patel, J. & Sharma, M. (2010). Differences in attachment of Salmonella enterica serovars to
cabbage and lettuce leaves. International Journal of Food Microbiology, 139(1), 41-47.
Perishable Products Export Control Board. (2013). Pear export 2014. [ONLINE] Available at:
http://www.hortgro.co.za/wp-content/uploads/2012/07/Pears-2014.pdf [Accessed 12
July 2012].
Petersen, L. (2011). Food workers ‘not trained in food safety’. Citizen, 23 June. 6. Ref No:
3698.
Richards, G. M. & Beuchat, L. R. (2004). Attachment of Salmonella Poona to cantaloupe rind
and stem scar tissues as affected by temperature of fruit and inoculum. Journal of Food
Protection, 67(7), 1359-1364.
Røssvoll, E., Rønning, H. T., Granum, P. E., Møretrø, T., Hjerpekjøn, M. R. & Langsrud, S.
(2014). Toxin production and growth of pathogens subjected to temperature fluctuations
simulating consumer handling of cold cuts. International Journal of Food Microbiology,
185, 82–92

52
Sapers, G. M., Gorny, J. R. & Yousef, A. E. (Eds.). (2005). Microbiology of Fruits and
Vegetables. CRC Press. p52.
Scallan, E., Hoekstra, R. M., Angulo, F. J., Tauxe, R. V., Widdowson, M. A., Roy, S. L., Jones,
J. L. & Griffin, P. M. (2011). Foodborne illness acquired in the United States—major
pathogens. Emerging Infectious Diseases, 17(1).
Sirinutsomboon, B., Delwiche, M. J. & Young, G. M. (2011). Attachment of Escherichia coli
on plant surface structures built by microfabrication. Biosystems Engineering, 108(3),
244-252.
Solomon, E. B. & Matthews, K. R. (2006). Interaction of live and dead Escherichia coli
O157:H7 and fluorescent microspheres with lettuce tissue suggests bacterial processes do
not mediate adherence. Letters in Applied Microbiology, 42(2), 88-93.
Spurr, H.W. (1979). Ethanol treatment – a valuable technique for foliar biocontrol studies of
plant pathogens. Phytopathology 69, 773-776.
Tang, P. L., Pui, C. F., Wong, W. C., Noorlis, A. & Son, R. (2012). Biofilm forming ability and
time course study of growth of Salmonella Typhi on fresh produce surfaces. International
Food Research Journal, 19(1), 71-76.
Todd, E. C., Greig, J. D., Bartleson, C. A. & Michaels, B. S. (2009). Outbreaks where food
workers have been implicated in the spread of foodborne disease. Part 6. Transmission
and survival of pathogens in the food processing and preparation environment. Journal of
Food Protection, 72(1), 202-219.
United States Food and Drug Administration (FDA). (2009). Bad Bug Book (Second Edition).
[ONLINE] Available at: http://www.fda.gov/Food/FoodborneIllnessContaminants/
CausesOfIllnessBadBugBook/ [Accessed 18 June 2014].
Van Loosdrecht, M. C., Lyklema, J., Norde, W. & Zehnder, A. J. (1990). Influence of interfaces
on microbial activity. Microbiological Reviews, 54(1), 75-87.
Yaron, S. & Römling, U. (2014). Biofilm formation by enteric pathogens and its role in plant
colonization and persistence. Microbial Biotechnology, 7(6), 496-516.
Ziuzina, D., Patil, S., Cullen, P. J., Keener, K. M. & Bourke, P. (2014). Atmospheric cold
plasma inactivation of Escherichia coli, Salmonella enterica serovar Typhimurium and
Listeria monocytogenes inoculated on fresh produce. Food Microbiology, 42, 109-116.

53
CHAPTER 4
BACTERIAL BIOMES AND DETECTION OF FOODBORNE PATHOGENS ON
PEAR (cv PACKHAM’S TRIUMPH) FRUIT IN THE SUPPLY CHAIN
Submitted to the Journal of the Science of Food and Agriculture
ABSTRACT
The increased global demand for seasonal fruit to be available all year round has resulted in an
upscale in production, distribution and advanced technologies to extend shelf life for extended
trade. Safe pear fruit is essential to ensure market access. This chapter is focused on the South
African pear industry to determine the natural bacterial profile of pear fruit surfaces
(carpoplane) using the commercial export cultivar Packham’s Triumph. In this study the
bacterial load and more specifically the presence or absence of foodborne pathogens
(Escherichia coli O157:H7, Listeria monocytogenes and Salmonella enterica subsp. enterica
serovar Typhimurium) on export fruit were determined. In support of this an industry wide
food safety compliance assessment was done to determine the level of understanding and
implementation. The healthy viable microbial load was determined through serial dilutions and
subsequent plating onto standard 1 agar and 16S DNA identification to determine dominant
bacteria. Presence or absence of foodborne pathogens was done using standard selective
chromogenic media and multiplex PCR with pathogen specific primers. High false presumptive
positives were found with the selective media, whereas DNA molecular methods confirmed
pathogenic status and were accurate, reliable and less time consuming. The microbial load
indicated a decreasing trend in the first season for three of the farms, as pears went through a
drenching step and were stored under controlled atmosphere (CA) conditions. The variety of
bacterial spp. isolates were lower after CA storage with predominant organisms such as Bacillus
spp., Curtobacterium flaccumfaciens, Erwinia billingiae, Pantoea sp. and Pseudomonas spp.
No foodborne pathogens were detected after CA storage conditions. A defining statement on
the status of a healthy fruit bacterial population and absence of foodborne pathogens reflect
safety assurance.

54
1. INTRODUCTION
South Africa is the sixth largest pear exporter in the world, with 197,911 tones being shipped
per annum [Perishable Products Export Control Board (PPECB), 2013]. Retaining a dominant
profile on the export market requires a sound knowledge and effective food safety assurance
systems. To date not much research has been done on natural pear fruit surfaces and the
bacterial populations present and more specifically the component associated with known
foodborne pathogens (Leff & Fierer, 2013). Current microbial guidelines for raw fruit and
vegetables [Department of Health (DoH), 2006] stipulate the absence of Escherichia coli,
Listeria monocytogenes and Salmonella spp. at ready-to-eat products (DoH, 2006). Coliform
levels should also not exceed 200 CFU per gram on ready-to-eat fruit and vegetables. No
scientific data of healthy natural microbial loads could be found in regulatory guidelines. Fruit
that are consumed raw, like pears, pose a potential risk to consumers if not produced within a
food safety assurance framework. In order to manage the risks, proper microbial surveillance
is needed, which includes determining the microbial load and profile and assuring the absence
of human pathogens on fresh produce [Centres for Disease Control and Prevention (CDC),
2013].
Residential surface bacteria, fungi and yeast or yeast-like organisms are all part of the biological
community that contributes to an ecological balance on the living fruit surface (Leben, 1965).
The epiphytic microorganisms provide a protective barrier against pathogenic microorganisms
causing food spoilage (Barth et al., 2010), decay and food safety concerns. Interventions such
as washing and/or chemical applications to the fruit surface disrupts the natural microbial
balance, causing a population shift benefitting opportunistic organisms associated with food
spoilage, decay or food safety (Corbo et al., 2010). Foodborne pathogens such as E. coli
O157:H7, L. monocytogenes, Salmonella Typhimurium and Staphylococcus aureus are able to
attach and colonise the pear fruit surface (Chapter 3). Population shifts due to more favourable
environmental conditions and/or wounding of fruit skin favour postharvest disease
development (Barth et al., 2010). Wounded fruit have also been shown to retain E. coli
O157:H7 (Mathews et al., 2014). In addition to production driven change can be focused by
production steps while fruit move through the supply chain (Janisiewicz & Buyer, 2010).
Traditional fruit epiphytes such as, Curtobacterium spp. (Shreedhar et al., 2014), Pantoea
agglomerans (Kapetas et al., 2011), Serratia marcescens (Kumar et al., 2011) are able to
survive in acidic (low pH) conditions. In addition it has been found that E. coli O157:H7 is

55
able to survive at pH 3 (Jordan et al., 1999), in a similar study it was found that viable L.
monocytogenes were detected after seventh day at a low pH of 3.44 (Budzińska & Wroński,
2008).
The aim of the research was to fill the gap in knowledge on the culturable bacterial load and
dominant bacterial species as well as presence or absence of foodborne pathogens on the pear
fruit surfaces. This information will contribute to a better understanding of healthy safe pears
and the potential for cross contamination while the fruit is moving through the supply chain.
The study focuses on three critical aspects within the pear production chain: 1) the identification
of dominant residential bacterial spp. on pear fruit surfaces at harvest, up to and after controlled
atmosphere (CA) storage; 2) the microbial status of healthy pears; and 3) determining if human
foodborne pathogens were present on the fruit surfaces by using different detection methods.
2. MATERIALS AND METHODS
Please refer to Figure 4.1 in order to have an overview of the combined technology approach,
which is discussed in detail below.
2.1. SAMPLING STRATEGY
Site Description
Samples were collected from four farms in the Western Cape, South Africa, within a 30km
radius with the communal packhouse situated central to all the farms. A single chemical
drenching system (chlorine as active ingredient, 75 ppm) was applied before the pears were
stored in the CA facility set at industry specifications conditions (1.5% O2, 1.5% CO2 and at -
0.5°C).
Sample Collection
Two consecutive seasons of pears Pyrus communis L. cv. Packham’s Triumph pears were
collected at harvest, before and after CA storage for each of the four farms. The cultivar was
selected as it is the main cultivar planted in SA with 3 325ha which accounts for 29% of pears
(National Department of Agriculture, Forestry and Fisheries, 2012) and the most important
export cultivars with 34.22% exported annually (PPECB, 2014). All farm’s orchard blocks
were commercially harvested on the same sampling day. One orchard block was selected from
each farm. A total of 20 pear fruit per orchard block were sampled from four random rows,

56
from randomly targeted trees within each row in each orchard, therefore equating to a sample
size at each sampling stage of four replicates of five pears each.
Figure 4.1. Multiple approach workflow

57
After drenching, a total of 20 fruit were collected, five fruit each from four random crates
originating from the same four farms sampled earlier that day. The same sample practises were
used for pears after CA storage which were collected twelve weeks later. The total number of
pears analysed were 240 in total, consisting of 12 replicates, per season. At each sampling stage
the pears were placed in labelled brown paper bags kept in cold storage (±5 °C) until laboratory
analysis within 48 hours. Pear surface temperatures of all samples were datalogged as they
were collected at each sampling stage (Extech Instruments, IR Thermometer, Part # 42580).
2.2. LABORATORY STRATEGY
Sample Processing
Quarter strength Ringer’s (Merck, Johannesburg, South Africa) solution (500 ml) amended with
0.02% Tween 80 (Sigma, Johannesburg) was added to each sample (one fruit at a time) and
volume displacement was recorded. Samples were sonicated in the Ringer’s-Tween solution
in an ultrasonic bath (Labotec, Johannesburg) for 5 minutes and filtered through a sterile 0.45
µm (Sartorius Stedim, Biotech, Germany) pore size nitrocellulose membrane. This method was
optimised prior to doing the full trial (data not shown).
Microbial Analysis
After filtering the pear washwater, filters were placed into 9ml 3M Buffered Peptone Water
(BPW) (3M Food Safety, Minnesota, USA) and vortexed vigorously. Total viable bacterial and
coliform/E. coli counts were determined by plating a tenfold dilution series of each of the
samples onto Standard 1 (STD1) media (Merck) and Escherichia coli 3M petrifilm (3M Food
Safety, USA). Plates and film were incubated for three to five days at 25°C and 37°C for 24
hours, respectively (SABS ISO 4833, 1991). Counts were recorded and data was converted to
log10(x+1) CFU cm-2 (as described in section 2.4).
Selective Enrichment
Following dilution series, each of the BPW sample solutions were enriched to determine the
presence of E. coli (including E. coli O157:H7) and Salmonella spp. Samples were incubated
in 9 ml 3M PBW (3M Food Safety) containing the filter membranes at 37°C for 24 hours.
Additionally, a millilitre of the 3M PBW broth was transferred into a 9 ml of 3M Listeria
selective broth (3M Food Safety, USA) for enrichment purposes and incubated at 37°C for 24
hours. Subsequently, a loopful of each of the pear enrichment samples (3M PBW enriched)

58
were streaked onto the following: eosin methylene blue differential medium (EMB) (Merck)
for detection of typical E. coli colonies; Salmonella brilliance medium (Oxoid, Johannesburg)
for detection of typical Salmonella spp. colonies; and Listeria selective medium for detection
of typical Listeria spp. colonies.
Dominant bacterial culture were selected according to colony morphology and needed to be
present on at least 33% of the plate to be classified as dominant. Dominant cultures as well as
presumptive foodborne pathogen colonies (based on typical colony morphology) were selected
from the STD1 and selective agar plates, respectively and restreaked for purification. Pure
cultures were stored in glycerol (32.5%) at -70°C for later processing.
Molecular Detection System Analysis
The 24h 3M PBW and 3M Listeria specific enrichment broths were used in addition to
determine the presence/absence of E. coli, Salmonella spp. and Listeria spp. using the
respective 3M MDS kits according to the manufactures specifications: 3M Molecular Detection
Assay Salmonella (AOAC RI Certificate 031208, April 2012), 3M Molecular Detection Assay
E. coli O157, including H7, (AOAC RI Certificate 071202, July 2012) and 3M Molecular
Detection Assay Listeria (AOAC RI Certificate 081203, August 2012).
16S rRNA DNA Extraction and Polymerase Chain Reaction of Microbial Isolates
Purified dominant single colonies and presumptive positive foodborne pathogens were cultured
aerobically in Tryptone soy broth (Biolab, Johannesburg) for 24 hours at 37°C. The cells were
pelleted by centrifugation at 10 000x g for 5 minutes at 4°C, followed by the extraction of the
bacterial DNA using a Quick-gDNA miniprep kit (Zymo Research, California, USA). The
DNA concentration of each isolate was determined with the Qubit 2.0 Fluorometer (Lifescience
Technology, Johannesburg).
Universal 16S primers (Brosius et al., 1978) were used in identification of isolated dominant
microbial organisms (Table 4.1). The identity of each presumptive colony was further tested
using a multiplex PCR amplifying Escherichia coli O157:H7, Listeria monocytogenes and
Salmonella Typhimurium as described by Standing et al. (2013). Details of the primers used
are shown in Table 4.1. PCR analysis conditions were similar for both 16S and pathogen
detection using a T100™ Thermal Cycler (BioRad Laboratories Ltd, Johannesburg). The PCR
mixtures contained 25 ng of genomic DNA, 200 µM of each deoxynucleotidetriphoshate, 0.5

59
µM of each primer, and 1 U My Taq (Bioline, Taunton, Massachusetts, USA) in a total reaction
volume of 25 µl. The PCR conditions were as follows: 94°C for 2 min, followed by 35 cycles
of 94°C for 30 s, 58°C for 30 s, and 72°C for 90 seconds, with a final extension at 72°C for 5
min. The amplified PCR products were purified from a 2% (w/v) agarose gel using a Geneclean
kit (Zymo Research, California) and the PCR products sequenced using BigDye Terminator
v3.1 on an ABI 3500XL sequencer in forward and reverse direction (InquabaBiotec,
Johannesburg).
Table 4.1. Primers for specific detection of human pathogens and identification through 16S
Primer Specificity Sequence 5' - 3' Size (bp) Reference
UidAa (30 pmol) Escherichia coli O157:H7 GCGAAAACTGTGGAATTGGG 252 Cebula et al., 1995
UidAb (30 pmol) Escherichia coli O157:H7 CGCTTTTGACACCTTAACCC 252 Cebula et al., 1995
LMFP (20 pmol) Listeria monocytogenes AGCTCTTAGCTCCATGAGTT 450 Thomas et al., 1991
LMRP (20 pmol) Listeria monocytogenes TCGAGAATCGAGGTACTCAA 450 Thomas et al., 1991
SLDF (50 pmol) Salmonella Typhimurium CCTGTGAATGCCCTGATGAT 787 Standing et al 2013
SLDR (50 pmol) Salmonella Typhimurium GGACACTTACGGGACTACTA 787 Standing et al 2013
F 27 16 S rDNA AGAGTTTGATCMTGGCTCAG 1465 Brosius et al., 1978
R 1492 16 S rDNA CGGTTACCTTGTTACGACTT 1465 Brosius et al., 1978
A high number of false positives obtained in 2013 from the selective chromogenic media
resulted in an adaptive approach by using a DNA screening first before continuing on the
chromogenic media during the second season. Samples positively detected for foodborne
pathogens were subjected to traditional viable plating on selective chromogenic media, where
after single colonies were stored in glycerol (32.5%) at -70°C as described for further analysis.
Statistical and Phylogenetic Analysis
Pear sampling was conducted across two consecutive production seasons (2013 and 2014).
Statistical analysis was performed on log CFU cm-2. Data were analysed using SAS 9.2 for
Windows (SAS Institute Inc., Cary, NC). A one-way analysis of variance was used to
determine the difference in microbial load on fruit surfaces. Means were analysed using the
least significant difference (using the Fisher test) at a 5% level of significance. The statistical
examination focused on each farm separately over two seasons through all sample stages.
Sequences were analysed through BLAST nucleotide identification. Phylogenetic alignment
analyses were conducted using MEGA version 6 (Tamura et al., 2013). Microbial phylogenetic
trees were created with MEGA using the distance Neighbour Joining statistical algorithm

60
(Saitou and Nei, 1987). Corrected nucleotide substitutions were calculated using the Tamura-
Nei model.
3. RESULTS
3.1. PEAR SURFACE TEMPERATURES AT HARVEST
In the 2013 season temperatures of the pear fruit surfaces ranged from an average of 12.5°C at
9:00 am taken on farm 1, up to an average of 25.3°C at 13:20 pm on farm 4. The lowest recorded
pear surface temperature was 11.2°C and the highest recorded temperature was 27°C (Appendix
2, Table 1). In the 2014 season temperatures of the pear surfaces ranged from an average of
18°C on farm 2 at 11:40 am up to 23.5°C on farm 1 at 10:05 am. The lowest recorded pear
surface temperature was 17.2°C and the highest recorded temperature was 29.5°C (Appendix 2,
Table 1). The atmospheric temperatures of season 2 were considerably lower than season 1 but
reaches a peak temperature similar to that of season 1. The humidity throughout the morning
were between 10-20% less in season 2 than season 1 (Appendix 2, Figure 1).
3.2. MICROBIAL QUALITY AND SAFETY OF PEARS
Aerobic Bacterial Plate Counts
The total viable counts ranged from a minimum of 1.23 log (CFU+1)/cm2 in the orchard to a
maximum of 4.14 log (CFU+1)/cm2 before CA storages (Figure 4.2). The total viable counts
after drenching (before CA) were significantly higher than after harvest and after CA storage
(Figure 4.2). During the 2014 season on Farm 2 and Farm 3 a similar pattern was observed.
However during the 2013 the total viable counts on fruit collected from Farm 2, 3 and 4 showed
a gradual decrease in overall populations (Figure 4.2). During the 2014 season there was no
significant difference after drenching but after CA storage there was a significant increase in
total viable counts (Figure 4.2). Comparing values between the two seasons, Farm 1 (except
for 2013 season), 2, 3 and 4 (except for 2014 season) decreased at after CA storage.
Coliform Petrifilm Plate Counts
Counts ranged on average around log 2.3 (CFU+1)/cm² (Figure 4.2). Farm 2 (season 2), Farm
3 (season 1) and Farm 4 (season 1) showed significant decreases in titres through the production
stages. A single significant increase was observed at Farm 4 during season 2.

61
Fig
ure
4.2.
Aer
obic
bac
teri
al a
nd c
olif
orm
tota
l via
ble
coun
ts o
n pe
ar f
ruit
sur
face
s, o
ver
two
cons
ecut
ive
prod
ucti
on s
easo
ns o
f fo
ur f
arm
s an
d
cent
ral p
ackh
ouse
in th
e W
este
rn C
ape
Pro
vinc
e (2
013
– 20
14).
Not
e: C
apit
al le
tter
s in
dica
te th
e ae
robi
c ba
cter
ial (
smal
l let
ters
: col
ifor
ms)
leas
t sig
nifi
cant
dif
fere
nces
of
indi
vidu
al f
arm
s ac
ross
dif
fere
nt s
ampl
ing
stag
es o
ver
two
seas
ons.

62
Detection of Escherichia coli (including O157:H7), Listeria monocytogenes and
Salmonella spp. on Pear Fruit Surfaces
Initial testing during 2013 on chromogenic selective media, 17 presumptive Escherichia coli,
33 presumptive Listeria spp. and 4 presumptive Salmonella spp. were detected. Of these
only three were confirmed positive for Salmonella Typhimurium and two for L.
monocytogenes from fruit collected in the orchard of Farm 2, 3 and 4 respectively. Using
the 3M MDS, only one of the enriched PBW from the fruit tested positively for a Listeria
sp. after CA storage from Farm 4. However this was confirmed to be a non-human
pathogenic Listeria spp. Escherichia coli (including O157:H7) was not detected in any of
the samples analysed and no foodborne pathogens were detected on pears sampled during
season 2.
Identification and Relevance of Dominant Microbes
Dominant bacterial isolates identified by 16s rRNA sequencing are summarised in Figure
4.3. The dominant microbial diversities on pear surfaces before CA storage stages were
greater than that of the pears after CA storage. Several bacterial isolates were identified as
potential non-host specific plant pathogenic microorganisms including Curtobacterium spp.,
Pantoea spp., Pseudomonas spp. and Serratia marcescens. Bacillus spp. was also detected
as well as, Erwinia billingiae and Pseudomonas putida.
Clustering of other phylogeny groups included 13% Bacillaceae, 26% Enterobacteriaceae,
9% Pseudomonadaceae and 6% other families. Lactobacillus plantarum (Lactobacillaceae),
Streptomyces thermocarboxydus (Streptomycetaceae) and Chromobacterium sp.
(Neisseriaceae) clustered separately. Lactobacillus plantarum aligned under Firmicutes
grouping, closely related to Streptomyces thermocarboxydus that allocated under
Actinobacteria, whereas Serratia marcescens and Chromobacterium sp. aligned under the
Proteobacteria grouping.
Phylogenetic Analysis of Dominant Cultures
A Neighbour-Joining phylogenetic tree was constructed, based on CLUSTAL W multiple
sequence alignment from the forward and backward 16S sequences. Figure 4.4 consisted of
74 dominant bacterial isolates, the phylums separated at a single node into Actinobacteria
(including Firmicutes) (62% of dominant organisms) and Proteobacteria (38% of dominant
organisms). Multiple similar genera have been found before as well as after CA.

63
Figure 4.3. Dominant bacterial species grouped per stage (at harvest, after drenching and after
controlled atmosphere storage).
Species prefixed with # indicates presence in season one, species prefixed with * indicated presence in season
two. Species prefixed with x/x/x indicates presence in all three stages in different seasons.

64
Figure 4.4. Phylogenetic tree based on dominant bacterial isolates’ 16S rDNA sequences,
constructed using the Neighbour-Joining methodology with allocated bootstraps.
Identifications labelled with an asterisk (*) indicates dominant microbes isolated after CA storages (twelve
weeks at 1.5% O2; 1.5% CO2 and -0.5°C).
Curtobacterium sp. (1)
23 Curtobacterium sp.
Curtobacterium flaccumfaciens
Curtobacterium herbarum
Curtobacterium flaccumfaciens
Curtobacterium sp. *
Curtobacterium herbarum *
Curtobacterium flaccumfaciens *
Curtobacterium sp.
Curtobacterium sp.
Curtobacterium flaccumfaciens
Curtobacterium sp.
Curtobacterium flaccumfaciens
Curtobacterium sp.
Curtobacterium sp.
Curtobacterium sp.
Curtobacterium sp.
Curtobacterium sp.
Curtobacterium herbarum
Curtobacterium sp. *
Curtobacterium herbarum
Curtobacterium flaccumfaciens
Microbacterium esteraromaticum
Frigoribacterium sp.
Frigoribacterium sp.
Frigoribacterium sp.
Frigoribacterium sp.
Frigoribacterium sp.
Sanguibacter sp. *
Brevibacterium sp.
Micrococcus sp.
Micrococcus sp.
Arthrobacter chlorophenolicus
Arthrobacter oxydans *
Streptomyces thermocarboxydus
Bacillus cereus
Bacillus sp.
Bacillus sp.
Lactobacillus plantarum
Bacillus subtilis
Bacillus sp.
Bacillus amyloliquefaciens *
Bacillus amyloliquefaciens *
Bacillus methylotrophicus *
Bacillus amyloliquefaciens/Bacillus methylotrophicus *
Bacillus amyloliquefaciens *
Chromobacterium sp.
Pseudomonas putida *
Pseudomonas putida
Pseudomonas sp.
Pseudomonas abietaniphila *
Pseudomonas syringae
Pseudomonas syringae
Pseudomonas azotoformans *
Serratia marcenscens
Erwinia billingiae *
Erwinia billingiae
Erwinia billingiae *
29 Erwinia sp. (Erwinia billingiae)
Pantoea agglomerans
Pantoea sp.
Pantoea sp. *
Pantoea agglomerans *
Pantoea vagans
Pantoea agglomerans
Pantoea agglomerans
Pantoea agglomerans
Pantoea agglomerans
Pantoea agglomerans
Pantoea sp. (Pantoea agglomerans)
Pantoea sp.
Pantoea sp. (Pantoea agglomerans)
Pantoea sp.
Pantoea sp. (Pantoea agglomerans)
0.011
0.002
0.006
0.003
0.022
0.055
0.003
0.049
0.020
0.145
0.006
0.006
0.104
0.003
0.117
0.027
0.048
0.049
0.047
0.002
0.032
0.013
0.0030.021
0.003
0.021
0.009
0.058
0.014
0.003
0.004
0.001
0.046
0.002
0.008
0.003
0.001
0.006
0.045
0.013
0.017
0.037
0.016
0.016
0.019
0.005
0.0700.003
0.015
0.007
0.005
0.008
0.002
0.006
0.02
Actinobacteria
Firmicutes
Proteobacteria

65
4. DISCUSSION
To the authors’ knowledge this is the first study investigating the bacterial load and selected
foodborne pathogen presence or absence on pear surfaces through a supply chain approach.
Other work focussed on culture-independent methodologies to identify epiphytic microbial
organisms on other fruits such as pome fruit, apples and grapes (Leff & Fierer, 2013).
Throughout the processing stages (2013 and 2014 season) the pear fruit went through
bacterial population fluctuations. Uncontrollable factors like orchard climate changes and
weather patterns as well as controllable factors such as chemical drenching, atmosphere
modifications within the CA storage facility and lastly removal from the CA storage can all
contribute to bacterial load fluctuations on the carpoplane.
Optimum growth temperatures are unique to each individual microbial species, therefore
different environments can influence growth (Nedwell, 1999). Temperatures measured on
fruit surfaces reached an average maximum of 29°C at midmorning, the recorded
temperature fell in the optimum growth range for the dominant bacterial spp. such as
Curtobacterium flaccumfaciens (Funke et al., 2005), Pantoea agglomerans (Jung et al.,
2002), Pseudomonas azotoformans (Iizuka & Komagata, 1963), P. syringae (Young et al.,
1977) and Serratia marcescens (Hejazi & Falkiner, 1997). Microbial presence were
significantly lower in season 2 (2014) when compared to season 1 (2013), this could be
attributed amongst other differences to the recorded atmospheric temperature and relative
humidity that were also lower in season 2. Even though the temperatures recorded during
this study do not favour the optimal growth temperature of human pathogenic
microorganisms, it is still suitable for growth (Beuchat & Bracket, 1990). Both Salmonella
Typhimurium and Listeria monocytogenes were however detected during season 1 (averages
of 21.5°C, relative humidity of 77.5%) when atmospheric temperatures and humidity were
higher than in season 2 (averages of 15.5°C, relative humidity of 61.3%).
Pear fruit surfaces as well as ciders and juices all have low pHs and therefore in order for
microorganisms to persist in these environments they need to be able to adapt and survive in
these more acidic conditions. A list provided by Corbo et al. (2010) showed pH of fruit
(including pome fruit) to be between 2.9 and 3.9. The microbial load fluctuations may also
vary due to the changes in environmental conditions associated with bacterial specific
growth characteristics. The pear fruit industry in South Africa use commercial CA storage
to extend shelf life and obtain market access over extended periods of time (Gunes & Lee,

66
1997). Packham’s Triumph pears can be stored for up to 9 months at -0.5°C, with a CO2
and O2 concentration at or below 2% to retain quality. Extreme environmental conditions
can cause a shift in population density and species diversity (Corbo et al., 2010). In this
study the total viable bacterial and coliform counts decreased after CA storage. After
controlled atmosphere storage 47% less diverse dominant microorganism were found. No
previous study have described the effect of CA storage on the pear carpoplane.
The clustering of the associated bacterial species resulted in three dominant phyla, these
include Firmicutes, Actinobacteria and Proteobacteria (divided into the Beta- and
Gamaproteobacteria classes). Dominant Microbacteriaceae account to 46% of dominant
species identified, in a study done by Leff and Fierer (2013) on apple and peach surfaces
similar results with Microbacteriaceae were found. Curtobacterium spp., Pantoea
agglomerans and Pseudomonas putida were some of the significant bacterial
microorganisms that survived from the same individual farm from before CA storages (after
drenching) up to and after CA storages stages, with Curtobacterium spp. being the only
isolate from harvested pears. These bacterial species are known to have plant and non-plant
specific pathogenic properties (Braun-Kiewnick et al., 2000; Janisiewicz & Buyer, 2010;
Patten & Glick, 2002).
A known human pathogen, Serratia marcescens, was detected on orchard pears, the
pathogen is known to infect the urinary tract in humans and open wounds (Hejazi & Falkiner,
1997). Serratia marcescens not only affects humans but also vegetables, fruit and herbs
causing; corn whorl rot (Wang et al., 2015), bell pepper soft rot (Gillis et al., 2014), and
crown rots in alfalfa (Lukezic et al., 1982). Not all dominant isolates are considered harmful.
Bacillus amyloliquefaciens subsp. plantarum strain D747 has been found to be an excellent
biofungicide and has been registered and approved by the European Union for commercial
use against P. syringae pv. actinidiae (Agropages, 2014; CABI, 2014). Erwinia billingiae
and Pseudomonas putida have known beneficial characteristics in development and survival
of plants. Erwinia billingiae can be applied as a biological antagonist known to compete for
nutrients and space against E. amylovora (Jakovljevic et al., 2008). Further research on the
antagonistic properties of dominant microorganisms isolated could be significant in the
development of organic production systems through biocontrol of potential post-harvest and
foodborne pathogens.

67
Food safety on raw consumed fresh fruit and vegetables has become a concern as an increase
number of outbreaks are recorded (CDC, 2014). The inoculation study done in Chapter 3 as
well as the attachment study conducted by Collignon and Korsten (2010) showed that E. coli
O157:H7, L. monocytogenes, Salmonella Typhimurium, are able to attach within 60 seconds
(Collignon & Korsten, 2010). Badosa et al. (2008) tested fresh fruit, sampled at the market,
which included apples and pears for the detection for Salmonella spp., Listeria spp. and
Listeria monocytogenes through PCR detection methods. Their study resulted in no positive
detections of any of the named organisms on freshly harvested or market fruit. In this study
foodborne pathogens were detected on fruit in the orchards but no foodborne pathogens were
present following CA storage.
The effect of controlled atmospheric storage on L. monocytogenes were reported by Berrang
et al., (1989) to have no effect on the growth rate even though populations were found to
increase. Similarly, typical CA storage conditions do not have an inhibition effect on the
survival of Salmonella spp. (Daş et al., 2006). Detections of the foodborne pathogens also
resulted in no positive detections over two seasons, after controlled atmosphere storage in
this study. Upon investigation of the uniqueness of the dominant species in season one at
harvest it was found that Pseudomonas spp. were not present at this stage, but detectable
after drenching and after CA storage and throughout season two. Pseudomonas syringae
was found to prevent E. coli O157:H7 growth in apple wounds (Janisiewicz et al., 1999).
Pseudomonas graminis (CPA-7) has also been shown to reduce titres of Salmonella spp. and
L. monocytogenes in fresh cut melons (Abadias et al., 2014) and apples (Alegre et al., 2013a)
and reduce titres of E. coli O157:H7, Salmonella spp. and L. monocytogenes on fresh cut
apples and peaches (Alegre et al., 2013b). Presence of these species could reflect a natural
protective barrier for food safety systems. Future studies need to focus on the correlation
between presence of Pseudomonas spp. and the presence or absence of foodborne pathogens.
These findings show that even though the pathogens are able to adhere to the fruit surfaces
(Chapter 3) and Salmonella Typhimurium and L. monocytogenes were present on fruit at
harvest, the competition of possible natural antagonists, non-targeted impact of chemical
drenching, CA storage conditions and extended fruit storage periods at low temperatures
cause high pressure on foodborne pathogens and their ability to survive a range of extreme
conditions.

68
This study provides some insight into microbial load and on the presence of microorganisms
on fruit surfaces. This information can be used to develop a health and safety index for fresh
produce. The aerobic bacterial population on the pear fruit surface expressed as colony
forming units per square centimetre can provide an indication of the actual true bacterial
load on healthy fruit surfaces. The DoH does not have a standard for an acceptable level of
aerobic bacterial on raw ready- to- consume fruit and vegetable surfaces. Currently data on
fungal, yeast, coliforms and foodborne pathogens (including E. coli, Salmonella spp. and L.
monocytogenes) titres are expressed as CFU/g, which is not surface specific representation
(DoH, 2006). Microbial guidelines for fresh produce need to be developed to reflect surface
contamination and actual microbial loads.
Beuchat et al. (2003) has previously shown the variability between results presented as
CFU/g and CFU/cm2 as a result of the differences in ration variance of weight vs. surfaces
of different products. The complexities in converting data from CFU/g to CFU/cm2 is
difficult and nearly impossible to do. The review highlights this with an example by
comparing the decontamination processes between tomato and lettuce leaves. Vast
differences are seen as described by Beuchat et al. (2003). A 3-log decontamination in
CFU/g of lettuce leaves would result 0.114 log reduction in CFU/cm2, whereas the same log
decontamination expressed as CFU/cm2 results in approximately 78.9 log reductions in
CFU/g. Tomatoes resulted in the opposite, as a 3-log reduction in CFU/g result 18 log
reductions in CFU/cm2 whereas the 3 log decontamination in CFU/cm2 resulted in
approximately 0.5 log reductions in CFU/g. This study highlights the importance of proper
microbial surface microflora and microbial loads for food fit-for-purpose to represent a
healthy safe food portion. Therefore a natural aerobic bacterial load for pears can be
considered to be as high as 5 log CFU/cm2 based on this study.
The required absence of foodborne pathogens (L. monocytogenes, Salmonella spp.) indicator
organisms (E. coli, coliforms) on ready-to-eat fresh fruit is not applicable to field harvested
fruit. This study has shown that these foodborne pathogens may be present in the field but
could not be detected post controlled atmosphere storage conditions. Commercial
intervention steps are thus found to be significant to prevent foodborne pathogen
introduction into the consumer’s end product. Food products that undergo processing steps
prior to consumption are not assessed in the same manner as ready-to-eat food. In the
absence of appropriate guidelines retailers often refer to guidelines or standards developed

69
in the food industry. Fresh produce microbial criteria should therefore be developed that are
more realistic and scientifically justifiable for food safety assurance in primary products. In
food safety systems raw material used in food processing or prepared must also be acceptable
and not introduce a potential hazard in the food chain.
In the detection of foodborne pathogens, chromogenic media resulted in a high number of
presumptive positives. Further analysis by multiplex PCR and 3M MDS of the presumptive
positives identified on chromogenic selective media were in fact false positives.
Subsequently we concluded that our results show high variability and poor sensitivity when
only a selective media approach was used as reported by Holfelder et al. (1998). The
unreliability of results obtained from selective media was similar to the findings of Alvarez
et al. (2012). Arroyo and Arroyo (1995) stated that the enumeration step results in selection
against the target organism. This phenomena occurs as a result of species outcompeting one
another when present in high concentration causing difficulty in pathogen detections.
Adapting the detection approach in season 2, led to no false positives and detections were
found to be more time effective. However, DNA level detection should not be the only
detection method as dead organism’s DNA would still be present and therefore back tracing
a positive molecular result to determine viability of the organism is crucial to confirm the
presence of the hazard. Combining molecular and viable detection methods in a food safety
assessment strategy provides a clear diagnostic framework for future studies.
5. CONCLUSION
The decreasing microbial load through the supply chain suggests that external environmental
changes influences the survivability of bacteria on the pear carpoplane. The dominant
residential bacteria on Packham’s Triumph reflected both harmful and beneficial bacteria
organisms. After CA storage the bacterial diversity was found to be lower. Foodborne
pathogens (Listeria monocytogenes, Salmonella spp.) were detected at harvest but not
thereafter. A food safety management system risk assessment tool confirmed an average to
advanced-average food safety output (Chapter 5). The microbial data was therefore
supportive of the effective food safety management system. A defining statement on the
status of a healthy Packham’s Triump pear is reflected in the bacterial diversity and absence
of foodborne pathogens. Future research should focus on other cultivars and the impact of
processing technologies on the bacterial biome.

70
6. REFERENCES
Abadias, M., Altisent, R., Usall, J., Torres, R., Oliveira, M. & Viñas, I. (2014).
Biopreservation of fresh-cut melon using strain Pseudomonas graminis CPA-7.
Postharvest Biology and Technology, 96, 69-77.
Agropages. (2014). EU oks Mitsui’s biofungicide Bacillus amyloliquefaciens D747-EU,
Mitsui, biofungicide, Bacillus amyloliquefaciens subsp. plantarum strain D747,
approval. 2014. [ONLINE] Available at: http://news.agropages.com/News/
NewsDetail---13784.htm. [Accessed 23 December 2014].
Alegre, I., Viñas, I., Usall, J., Anguera, M., Altisent, R. & Abadias, M. (2013). Antagonistic
effect of Pseudomonas graminis CPA-7 against foodborne pathogens in fresh-cut
apples under simulated commercial conditions. Food Microbiology, 33, 139-148.
Alegre, I., Viñas, I., Usall, J., Anguera, M., Figge, M. J. & Abadias, M. (2012). An
Enterobacteriaceae species isolated from apples controls foodborne pathogens on
fresh-cut apples and pears. Postharvest Biology and Technology, 74, 118-124.
Alvarez, F., Castro, M., Príncipe, A., Borioli, G., Fischer, S., Mori, G. & Jofré, E. (2012).
The plant-associated Bacillus amyloliquefaciens strains MEP218 and ARP23 capable
of producing the cyclic lipopeptides iturin or surfactin and fengycin are effective in
biocontrol of sclerotinia stem rot disease. Journal of Applied Microbiology, 112, 159–
174.
Arroyo, G. & Arroyo, J. A. (1995). Efficiency of different enrichment and isolation
procedures for the detection of Salmonella serotypes in edible offal. Journal of Applied
Bacteriology, 79(4), 360-367.
Badosa, E., Trias, R., Parés, D., Pla, M. & Montesinos, E. (2008). Microbiological quality
of fresh fruit and vegetable products in Catalonia (Spain) using normalised plate‐
counting methods and real time polymerase chain reaction (QPCR). Journal of the
Science of Food and Agriculture, 88(4), 605-611.
Barth, M., Hankinson, T. R., Zhuang, H. & Breidt, F. (2010). Microbiological spoilage of
fruits and vegetables. In Compendium of the Microbiological Spoilage of Foods and
Beverages (pp. 135-183). Springer New York.

71
Berrang, M. E., Brackett, R. E. & Beuchat, L. R. (1989). Growth of Listeria monocytogenes
on fresh vegetables stored under controlled atmosphere. Journal of Food Protection,
52(10), 702-705.
Beuchat, L. R. & Brackett, R. E. (1990). Survival and growth of Listeria monocytogenes on
lettuce as influenced by shredding, chlorine treatment, modified atmosphere packaging
and temperature. Journal of Food Science, 55(3), 755-758.
Beuchat, L. R., Farber, J. N., Garrett, E. H., Harris, L. J., Parish, M. E., Suslow, T. V. &
Busta, F. F. (2003). Standardization of a Method to Determine the Efficacy of
Sanitizers in Inactivating Human Pathogenic Microorganisms on Raw Fruits and
Vegetables1. Comprehensive Reviews in Food Science and Food Safety, 2(s1), 174-
178. Braun-Kiewnick, A., Jacobsen, B. J. & Sands, D. C. (2000). Biological control of
Pseudomonas syringae pv. syringae, the causal agent of basal kernel blight of barley,
by antagonistic Pantoea agglomerans. Phytopathology, 90(4), 368-375.
Brosius, J., Palmer, M. L., Kennedy, P. J. & Noller, H. F. (1978). Complete nucleotide
sequence of a 16S ribosomal RNA gene from Escherichia coli. Proceedings of the
National Academy of Sciences, 75(10), 4801-4805.
Budzińska, K. & Wroński, G. (2008). Effect of pH on survival rate of Listeria
monocytogenes in sewage from meat processing plant. Polish Journal of
Environmental Studies, 17, 827.
CABI. (2014). Pseudomonas syringae pv. actinidiae. [ONLINE] Available at:
http://www.cabi.org/isc/datasheet/45002. [Accessed 23 December 2014].
Cebula, T. A., Payne, W. L. & Feng, P. (1995). Simultaneous identification of strains of
Escherichia coli serotype O157:H7 and their Shiga-like toxin type by mismatch
amplification mutation assay-multiplex PCR. Journal of Clinical Microbiology, 33(1),
248-250.
Centres for Disease Control and Prevention. (2013). Incidence and trends of infection with
pathogens transmitted commonly through food-foodborne diseases active surveillance
network, 10 US sites, 1996-2012. MMWR. Morbidity and Mortality Weekly Report,
62(15), 283.

72
Centres for Disease Control and Prevention. (2014). List of Selected Multistate Foodborne
Outbreak Investigations. [ONLINE] Available at: http://www.cdc.gov/foodsafety/
outbreaks/multistate-outbreaks/outbreaks-list.html. [Accessed 15 December 2014].
Collignon, S. & Korsten, L. (2010). Attachment and Colonization by Escherichia coli O157:
H7, Listeria monocytogenes, Salmonella enterica subsp. enterica serovar
Typhimurium, and Staphylococcus aureus on stone fruit surfaces and survival through
a simulated commercial export chain. Journal of Food Protection, 73(7), 1247-1256.
Corbo, M. R., Speranza, B., Campaniello, D., D’Amato, D. & Sinigaglia, M. (2010). Fresh-
cut fruits preservation: current status and emerging technologies. Current research,
technology and education topics in applied microbiology and microbial biotechnology.
Formatex Research Centre, Badajoz, 1143-1154.
Daş, E., Gürakan, G. C. & Bayındırlı, A. (2006). Effect of controlled atmosphere storage,
modified atmosphere packaging and gaseous ozone treatment on the survival of
Salmonella Enteritidis on cherry tomatoes. Food Microbiology, 23(5), 430-438.
Department of Health. (2006). Guidelines for Environmental Health Officers on the
Interpretation of Microbiological Analysis Data of Food. Department of Health,
Directorate: Food Control. Annexure B Proposed Microbiological Specification to be
used as Guidelines for Foods. Pretoria, pp. 26.
Funke, G., Aravena-Roman, M. & Frodl, R. (2005). First description of Curtobacterium spp.
isolated from human clinical specimens. Journal of Clinical Microbiology, 43(3),
1032-1036.
Gillis, A., Rodríguez, M. & Santana, M. A. (2014). Serratia marcescens associated with bell
pepper (Capsicum annuum L.) soft-rot disease under greenhouse conditions. European
Journal of Plant Pathology, 138(1), 1-8.
Gunes, G. & Lee, C. Y. (1997). Color of minimally processed potatoes as affected by
modified atmosphere packaging and antibrowning agents. Journal of Food Science,
62(3), 572-575.
Hejazi, A. & Falkiner, F. R. (1997). Serratia marcescens. Journal of Medical Microbiology,
46(11), 903-912.
Holfelder, M., Betz, U., Bertsch, B. & Eigner, U. (2013). Comparative evaluation of
selective agar media, matrix-assisted laser desorption/ionisation-time of flight mass

73
spectrometry (MALDI-TOF MS), polymerase chain reaction (PCR) and phenotypic
methods for the detection of carbapenemase-producing Enterobacteria. Poster
Presentation. Berlin, Germany. European Society of Clinical Microbiology and
Infectious Diseases.
Iizuka, H. & Komagata, K. (1963). New species of Pseudomonas belonged to fluorescent
group (Studies on the microorganisms of cereal grains. Part V). Journal of Agricultural
Chemical Society, 37, 137-141.
Jakovljevic, V., Jock, S., Du, Z. & Geider, K. (2008). Hypersensitive response and acyl‐
homoserine lactone production of the fire blight antagonists Erwinia tasmaniensis and
Erwinia billingiae. Microbial Biotechnology, 1(5), 416-424.
Janisiewicz, W. J. & Buyer, J. S. (2010). Culturable bacterial microflora associated with
nectarine fruit and their potential for control of brown rot. Canadian Journal of
Microbiology, 56(6), 480-486.
Janisiewicz, W. J., Conway, W. S. & Leverentz, B. (1999), Biological control of postharvest
decays of apple can prevent growth of Escherichia coli O157:H7 in apple wounds.
Journal of Food Protection, 62(12): 1372-1375.
Jordan, K. N., Oxford, L. & O’Byrne, C. P. (1999). Survival of low-pH stress by Escherichia
coli O157: H7: correlation between alterations in the cell envelope and increased acid
tolerance. Applied and Environmental Microbiology, 65(7), 3048-3055.
Jung, I., Park, D. H. & Park, K. (2002). A study of the growth condition and solubilization
of phosphate from hydroxyapatite by Pantoea agglomerans. Biotechnology and
Bioprocess Engineering, 7(4), 201-205.
Kapetas, L., Ngwenya, B. T., Macdonald, A. M. & Elphick, S. C. (2011). Kinetics of
bacterial potentiometric titrations: The effect of equilibration time on buffering
capacity of Pantoea agglomerans suspensions. Journal of Colloid and Interface
Science, 359(2), 481-486.
Kumar, R., Acharya, C. & Joshi, S. R. (2011). Isolation and analyses of uranium tolerant
Serratia marcescens strains and their utilization for aerobic uranium U (VI)
bioadsorption. The Journal of Microbiology, 49(4), 568-574.
Leben, C. (1965). Epiphytic microorganisms in relation to plant disease. Annual Review of
Phytopathology, 3(1), 209-230.

74
Leff, J. W. & Fierer, N. (2013). Bacterial communities associated with the surfaces of fresh
fruits and vegetables. PloS One, 8(3), e59310.
Lukezic, F. L., Hildebrand, D. C., Schroth, M. N. & Shinde, P. A. (1982). Association of
Serratia marcescens with crown rot of alfalfa in Pennsylvania. Phytopathology, 72(7),
714-718.
Mathews, S. L., Smith, R. B. & Matthysse, A. G. (2014). A comparison of the retention of
pathogenic Escherichia coli O157 by sprouts, leaves and fruits. Microbial
Biotechnology, 7(6), 570-579.
National Department of Agriculture, Forestry and Fisheries. (2012). A profile of the South
African pear market value chain. [ONLINE] Available at: http://www.nda.agric.za/
docs/AMCP/Pear2012.pdf [Accessed 12 July 2012].
Nedwell, D. B. (1999). Effect of low temperature on microbial growth: lowered affinity for
substrates limits growth at low temperature. FEMS Microbiology Ecology, 30(2), 101-
111.
Patten, C. L. & Glick, B. R. (2002). Role of Pseudomonas putida indole acetic acid in
development of the host plant root system. Applied and Environmental Microbiology,
68(8), 3795-3801.
Perishable Products Export Control Board. (2013). Export Directory, 11th edition. ISBN 0-
620-31322-6. Section 2, p. 28.
Perishable Products Export Control Board. (2014). Pear Export 2014. [ONLINE] Available
at: http://www.hortgro.co.za/wp-content/uploads/2012/07/Pears-2014.pdf [Accessed
12 July 2012]
South African Bureau of Standards/ International Standards Organization (SABS/ISO).
1991. Microbiology: guidance for enumeration of micro-organisms aerobic colony
count-colony count technique at 30˚C. SABS/ISO 4833. Pretoria.
Saitou, N. & Nei, M. (1987). The Neighbor-Joining method: a new method for
reconstructing phylogenetic trees. Molecular Biology and Evolution, 4(4), 406-425.
Shreedhar, S., Devasya, R. P., Naregundi, K., Young, C. C. & Bhagwath, A. A. (2014).
Phosphate solubilizing uranium tolerant bacteria associated with monazite sand of a
natural background radiation site in South-West coast of India. Annals of
Microbiology, 64(4), 1683-1689.

75
Standing, T., Du Plessis, E. M., Duvenage, S. & Korsten, L. (2013). Internalisation potential
of Escherichia coli O157:H7, Listeria monocytogenes, Salmonella enterica subsp.
enterica serovar Typhimurium and Staphylococcus aureus in lettuce seedlings and
mature plants. Journal of Water and Health, 11 (2), 210-223.
Tamura, K., Stecher, G., Peterson, D., Filipski, A. & Kumar, S. (2013). MEGA6: molecular
evolutionary genetics analysis version 6.0. Molecular Biology and Evolution, 30(12),
2725-2729.
Thomas, E. J., King, R. K., Burchak, J. & Gannon, V. P. (1991) Sensitive and specific
detection of Listeria monocytogenes in milk and ground beef with the polymerase
chain reaction. Applied and Environmental Microbiology, 57, 2576–2580.
Wang, X. Q., Bi, T., Li, X. D., Zhang, L. Q. & Lu, S. E. (2015). First report of corn whorl
rot caused by Serratia marcescens in China. In Press: Journal of Phytopathology. DOI:
10.1111/jph.12366.
Young, J. M., Luketina, R. C. & Marshall, A. M. (1977). The effects on temperature on
growth in vitro of Pseudomonas syringae and Xanthomonas pruni. Journal of Applied
Bacteriology, 42(3), 345-354.

76
CHAPTER 5
ASSESSMENT OF FOOD SAFETY MANAGEMENT SYSTEMS ON PEAR
PRODUCTION FARMS IN THE WESTERN CAPE PROVINCE
ABSTRACT
A total food safety management system (FSMS) consists of several principles, guidelines
and standards within a specific producer’s farm and postharvest environment. These systems
aim to assure and maintain safe consumable fresh produce through the control of chemicals,
microbiological and physical contaminants. The implementation of a complex FSMS does
not always have the desired outcome or assurance as interpretation of standards differ
between countries, industry sectors and even producers. A number of parameters contribute
to FSMS that identify areas where human error may occur due to the complexity of the
management systems. In order to assess the level of effective interpretation in the FSMS, a
horticultural safety management system (HSMS) diagnostics system has since been
developed. This tool covers all the critical control points in order to identify risky areas
where FSMS are lacking in design. The contribution to the success of the implemented
FSMS is obtained by accurate detection of the critical topics and specific identified needs of
each individual farm. The objective of this study was to evaluate a diagnostic tool to assess
the HSMS on five commercial pear production farming situations of the Western Cape
Province, South Africa. The result identifies problems in the HSMS design where
improvements can enhance the food safety output of a farm. The overall results of the
riskiness and food safety output systems were identified to be at an average to advanced
levels with variations for different farming practises. The HSMS diagnostic tool highlighted
that farms focused more on chemical residue levels when compared to microbial
contamination. The reason for this is the export oriented nature of the industry and the
effective regulatory chemical residue monitoring in the country. The value of the HSMS as
a self-assessment tool was questioned as objectivity can be influenced by personal
experience or perceptions. To conclude, the HSMS is a good tool to assess the riskiness and
food safety output of the industry and of individual companies. However, an emphasis on
microbial analysis should be realised in order to prevent possible outbreaks caused by human
pathogenic microorganisms and standard/guidelines that should be implemented through
proper testing and monitoring.

77
1. INTRODUCTION
A typical food safety management system (FSMS) include several formal food safety
guidelines and standards. Unique regulatory points are implemented to cover the overall
safety of the food product traded. These guidelines and standards are required for market
access. Transparency within the documentation system of exporting companies allows for
effective regulation and lowers trade barriers as the importing company complies with
relevant food safety standards and regulations. A number of different developed guidelines,
private schemes and standards are available for producers to include in their FSMS such as
GLOBAL-GAP, ISO 22000. Choice of the guidelines and standards vary depending on
retailer specifications. Food safety management systems are designed to lower and/or limit
the spread of infectious human pathogenic microorganisms and reduce the risk of hazardous
chemicals (Jaxsens et al., 2009a; Luning et al., 2006 and Tsalo et al., 2007). Fresh produce
industries implement several voluntary food safety systems to ensure compliance with
market access. Not all food safety management systems are compulsory, rather voluntary
but de facto compulsory. Food safety principles that have been adopted universally and have
been integrated in all FSMS are hazard analysis and critical control points (HACCP), which
focus on the prevention of physical, chemical and biological hazards.
South African markets require several different food safety compliance requirements for
trade of commodities on local as well as international markets. GLOBAL-GAP has been de
facto compulsory to all farmers exporting to retailers in European markets. A greater
demand for healthier food and an increase in production and trade has resulted in a better
food safety regulatory system (Jacxsens et al., 2009b). A FSMS diagnostic tool has thus
been developed to support compliance and adoption systems and assess food safety riskiness
of farmers (Lunning et al., 2011). The overall outcome of this FSMS diagnostic tool is to
indicate areas that could improve and decrease the risk of pathogenic microbial
contamination.
In the horticultural field, safety management systems have been implemented based on best
agricultural practices. Often these programs require practices which include prerequisite
programs such as hygiene and good agricultural practices (GAP). Therefore the horticultural
safety management systems (HSMS) diagnostic tool addresses critical aspects of the
production process in terms of microbiological and chemical standard operating procedures
and the efficacy in the HSMS. The outcome of the HSMS analysis shows areas where the

78
farmers can improve, have adopted or lacking in control systems. Since there is no single
blueprint for all scenarios on all farms, each situation should be assessed and evaluated on
its own according to those specific production practices (Semos and Kontogeorgos, 2007).
The aim of this study was to evaluate the diagnostic tool to assess the HSMS on commercial
pear production and export farms in the Western Cape Province, South Africa. The model
HSMS self-diagnosis tool (Kirezieva et al., 2013) was used to perform as an indicator of the
pear production farm industry to determine compliance levels within the industry. The result
of this case study will allow recommendations to be made to producers to more effectively
implement food safety and to strengthen international and domestic trade.
2. METHODOLOGY
2.1. FARMER SURVEY AND DATA COLLECTION
Due to the reluctance of farmers the microbial assessment was only completed successfully
by five pear producing farms in the Western Cape Province, South Africa. The assessments
were performed as an interview with the farm or quality manager based on questionnaires
(Lunning et al., 2013) during a Food Safety Workshop held in Grabouw, Western Cape
Province. All farmers that participated were voluntary and identities were kept confidential
in agreement.
2.2. FOOD SAFETY MANAGEMENT SYSTEM
The details of the full assessment are outlined in Lunning et al. (2013), for the purpose of
completeness, a summary of each section is included in this dissertation (Appendix 3). The
assessment has six basic principles. A total of five parts are included in the self-assessment
tool under which numerous questions covering essential topics have been included. The
main principles were grouped into the three core parts; the context of the farms (Part I), the
control (Part II) and assurance activities (Part III) implemented in the FSMS. Part 0 covers
an introduction section reviewing the production farm characteristics and Part IV covers the
performance of internal and external FSMS. Answers were recorded in a weight scale with
the associated responses. Each of the questions has a low, medium or high risk factor that
describes the best suited scenario to the farming practice at hand. A radar diagram was then
constructed according to specific weights selected (Figure 5.1 to 5.4).
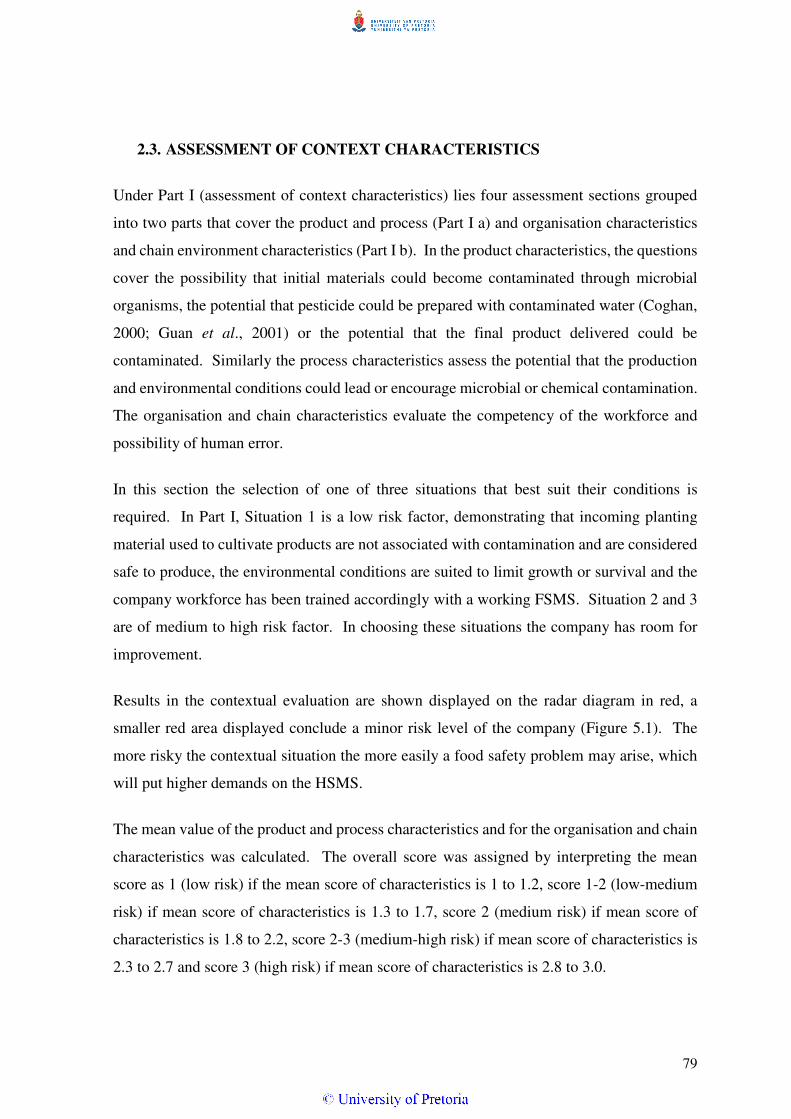
79
2.3. ASSESSMENT OF CONTEXT CHARACTERISTICS
Under Part I (assessment of context characteristics) lies four assessment sections grouped
into two parts that cover the product and process (Part I a) and organisation characteristics
and chain environment characteristics (Part I b). In the product characteristics, the questions
cover the possibility that initial materials could become contaminated through microbial
organisms, the potential that pesticide could be prepared with contaminated water (Coghan,
2000; Guan et al., 2001) or the potential that the final product delivered could be
contaminated. Similarly the process characteristics assess the potential that the production
and environmental conditions could lead or encourage microbial or chemical contamination.
The organisation and chain characteristics evaluate the competency of the workforce and
possibility of human error.
In this section the selection of one of three situations that best suit their conditions is
required. In Part I, Situation 1 is a low risk factor, demonstrating that incoming planting
material used to cultivate products are not associated with contamination and are considered
safe to produce, the environmental conditions are suited to limit growth or survival and the
company workforce has been trained accordingly with a working FSMS. Situation 2 and 3
are of medium to high risk factor. In choosing these situations the company has room for
improvement.
Results in the contextual evaluation are shown displayed on the radar diagram in red, a
smaller red area displayed conclude a minor risk level of the company (Figure 5.1). The
more risky the contextual situation the more easily a food safety problem may arise, which
will put higher demands on the HSMS.
The mean value of the product and process characteristics and for the organisation and chain
characteristics was calculated. The overall score was assigned by interpreting the mean
score as 1 (low risk) if the mean score of characteristics is 1 to 1.2, score 1-2 (low-medium
risk) if mean score of characteristics is 1.3 to 1.7, score 2 (medium risk) if mean score of
characteristics is 1.8 to 2.2, score 2-3 (medium-high risk) if mean score of characteristics is
2.3 to 2.7 and score 3 (high risk) if mean score of characteristics is 2.8 to 3.0.

80
2.4. ASSESSMENT OF CORE SAFETY CONTROL ACTIVITIES
Core safety control activities are those activities that contribute to the realisation of a safe
product by evaluation of the performance of both technological and human processes and
taking corrective actions when necessary. Core safety control activities consist of four
critical aspects covering the designs of 1) preventative measures, 2) intervention processes
and 3) monitoring designs as well as 4) the operation of the designed preventative measures,
intervention processes and monitoring systems. Part II (core safety control activities)
analyse the FSMS applied in the limiting of cross contamination through direct contact of
workers, equipment, and the appropriate FSMS instated. The actual control activities focus
on the performance of the management systems on equipment, production practices and
decision making.
In Part II one of four case scenarios are selected that best describe the core activity followed
within their production plan. The preventative and processes focus on aspects regarding
how the company have set requirements with regards to the condition of the equipment,
storage facilities and the handling of initial material received. It also covers detailing how
and when sanitation and farming processes are done. The manner in how and when
processes are completed is also covered within this section. Close relationship with
stakeholders are key to the success of the farm. Assessing of operation at preventive
measures, intervention process and monitoring systems describes the confidence level
between the producer and stakeholder. The transparency between these two partners is
assessed through the monitoring systems and clear paper trail of the production practices.
A choice of four different situations is presented at each of the core safety activities
questioned. Each of the four situations represents the functionality of the systems design
and of the monitoring system. Situation 1, low level monitoring and design would typically
describe of the company has a limited plan or facilities available for proper food safety
management. Situation 2 asses a basic level of systems that is known with little to no in-
depth background, normally reactive. Workers with no experience on the management
system design or no knowhow of proper monitoring systems will fall in this situation.
Situation 3 can be considered as the advanced level, where topics related to in-depth
knowledge and which are managed according to proper food safety management

81
specifications. Typically the design of the systems would also be proposed from an expert
point of view. Situation 4, highly advanced level is associated with accreditation of
methodologies, certification and implementation of systems, management of workers as
experts in the field with extended experience in problem solving and adaptation.
Results for Part II are displayed as a radar diagram, the performance scale represented by a
larger green area indicating good core safety control activities. To rate the core safety control
activities, overall levels were assigned by averaging the activity levels. The overall level
that was assigned was interpreted by the mean score, level 1 (basic) if mean score of
activities is 1 to 2.2, level 1-2 (basic-average) if mean of score of activities is 2.3 to 2.7, level
2 (average) if mean score of activities is 2.8 to 3.2, level 2-3 (average-advanced) if mean
score of activities is 3.3 to 3.7 and level 3 (advanced) if mean score of activities is 3.8 to 4.0.
2.5. ASSESSMENT CORE ASSURANCE ACTIVITIES
The assessment validates and verifies the efficacy of systems designed and processes
implemented. The company/farm should be flexible enough to change according to
feedback from the validation and verification processes and accommodate the changes from
unforeseen external inputs. Proper observations, recordkeeping and scientific backing will
ensure a fluent flow within the company/farm.
Scoring in the questionnaire of Part III (core assurance activities) is similar to Part II with
four scenarios to choose from that suit the company’s profile. Situation 1 indicates that
nothing has been done to the question or topic at hand. The company would typically have
no set processes; no recordkeeping and low performance throughout. Situation 4 suggests
that the company is highly advanced in evaluating the FSMS using specific criteria and that
improvements are not necessary. The food safety risk at this level would be extremely low
as constant changes and testing within the company is conducted, as a result leading to safer
foods being sold. The weight scales in Part III are similarly represented as in Part II. Again,
to rate the core assurance control activities, overall levels were assigned by averaging the
activity levels. The overall level that was assigned was interpreted by the mean score as in
Part II.

82
2.6. ASSESSMENT OF FOOD SAFETY PERFORMANCE
Inspection services, audits and accreditation of internal and external performances on food
safety within the company are analysed in Part IV (food safety performance). The company
would want to have a low risk factor as this covers the global status of the company. With
regular and proper third party audits the company is objectively analysed. Once the produce
and company has been analysed the product can be delivered to the market as a low food
safety risk factor. The weight scales in Part IV are represented as in Part II and III.
Therefore results in Part I should not have high scoring with little to no colour in the radar
diagram whereas Part II – IV one typically is looking for a colourful radar diagram indicating
low food safety risk factors. To obtain an overall food safety output, overall levels were
assigned by averaging the activity levels and the scores were the same as Part II.
3. RESULTS AND DISCUSSION
All farms in the study have between 10 and 49 permanent workers and between 50 and 249
temporary workers, producing, harvesting and packaging mainly deciduous fruit. The
overview of five farms from the Western Cape Province on general farming questions
concluded that all farms analysed were certified to the voluntarily standard of GLOBAL-
GAP. One of the farms where in addition to GLOBAL-GAP also certified to HACCP (SANS
10330) and British Retail Consortium (BRC) standard and the Tesco private standards
(Appendix 3).
3.1. ASSESSMENT OF CONTEXT CHARACTERISTICS (PART I)
Data collected from the self-assessment tool allowed the determination of the riskiness due
to the contextual factors which include product, production, organisation and chain
characteristics associated with the production of pears. The following questions were
answered the same for all five farms and were subsequently excluded from the radar
diagrams but were used to calculate the overall risk level. The pesticide risk of initial
material were all placed into medium risk situation, mycotoxin risk of initial materials and
microbial contamination of the production system were all placed into high risk situation.
The microbial risk of initial materials were placed into a medium risk situation, except farm
4 which was placed into a low risk situation. The following questions were placed into
situation 1 for all five farms 1) food safety information exchange, 2) inspection authorities,

83
3) specificity of external support and 4) specificity of the food safety legal framework.
Questions where one out of the five farms answered variably were also not included in the
radar diagrams. These included technical staff and information systems which were placed
into situation 2 for four farms and for Farm 4 into situation 1 also the supplier relationship
was placed into situation 3 for all four farms except for Farm 5 which was situation 1.
The combination of a higher risk product and production context with a lower risk
organisation and chain context results in a medium to high contextual risk. The overall
contextual risk result showed that Farm 1, 2, 4 and 5 were rated to be producing a medium
risk product and Farm 3 was rated as producing a high risk product (Table 5.1).
Product and production factors that lead to all farms producing a medium to high risk product
include the lack of testing for mycotoxins in the initial materials, climatic conditions with
open field cultivation increasing the risk for microbial contamination in the production
system (Figure 5.1). However risk factors like climatic conditions cannot be changed or
altered therefore would need greater emphasis on preventative and intervention measures to
ensure a reasonable food safety output score. In a recent study (Kirezieva et al., 2015) using
the self-diagnostic tool it was found that produce (including leafy greens, berries, fruit, and
other fresh produce) produced by 118 different producers from countries around the world
all resulted in medium to high risk products when the product and production characteristics
are taken into account. Similar factors as found in this study contribute to high riskiness of
the produce (Kirezieva et al., 2015).
Organisation and chain contextual factors can be controlled and influenced by each
farmer/company. The overall scoring of the organisation and chain contextual
characteristics was at low-medium risk level for Farm 4 and 5 and at a medium risk level for
Farm 1, 2 and 3 (Table 5.1). High risk organisational characteristics such as employee
involvement where operators have no involvement in the FSMS, therefore often lack
commitment and motivation to implement the FSMS and also formalisation of
communication with regards to the FSMS resulted in a more risky organisational context.
Proper food safety training of technical staff was also conducted on all farms, therefore
lowering the riskiness. Farm 4 and Farm 5 (Figure 5.1) have shown to have the best overall
organisation and chain conditions. In this section all farms indicated that there were low
supplier relationships, therefore increasing the riskiness of the chain. In order to decrease
the chain risk the importance of regulatory authorities, international quality assurance

84
requirements and legal frameworks needs to be realised for all farms (Figure 5.1).
Organisation and chain characteristics in this study are similar to Kirezieva et al. (2015)
from producers around the world. However, technical staff in this study have more specific
knowledge on food safety with some producers implementing external food safety expertise
to implement the FSMS as well as the food safety information exchange and most farms
have dedicated individuals and teams within the management position that drive the FSMS.
3.2. ASSESSMENT OF CORE SAFETY CONTROL ACTIVITIES (PART II)
Information gathered from the self-assessment tool allowed the farms to be characterised
into different levels of control. The basic assumption behind the FSMS self-assessment tool
indicated that a very risky contextual situation requires a more advanced control activity.
The following questions were answered the same for all five farms and were subsequently
excluded from the radar diagrams but were used to calculate the control activity level. The
sanitation program and personal hygiene requirements for all five farms were placed into the
average level and advanced levels were evaluated for the methods used to assess pesticides.
Questions where one out of the five farms answered variably were also not included in the
radar diagrams. Maintenance and calibration program were at the advanced level for four
of the farms and for Farm 4 were rated at the average level. Farm 4 used advanced level of
control for incoming material and the other four farms used average levels. Supplier control
and corrective action at average levels were implemented for four farms but a basic level
was implemented for Farm 5. Control of the organic fertiliser program and the risk analysis
at Farm 3 was at a basic level, where all other farms were at average levels.
The overall score of the mean control activities showed that Farm 4 and 5 have average-
advanced level of activities, Farm 2 was rated as average and Farm 1 and 3 were rated as
having basic control activities (Table 5.1). The control activity design of Farm 5 was rated
as basic-average and due to the average-advanced nature of the operation of the control
activity it results in an increased overall score (Table 5.1). Farm 4 was rated as having an
average control activity design but due to the average-advanced control activity operation it
contributed to an increased overall score (Table 5.1). In the opposite scenario for Farm 1
and Farm 3 the control activity design were rated as basic-average but due to basic rating of
the operation of the control activities, the overall score decreased (Table 5.1). Farm 2 had
average rating from the design, operation and overall mean of the control activities.

85
Table 5.1. The mean ratings of five farms on all assessments contributing to the mean food safety risk output
Mean
product and
process
Mean
organisation
and chain
Mean
contextual
Mean
control
activities
design
Mean
control
activities
operation
Mean control
activities
Mean
assurance
activities
Mean food
safety output
Farm 1 2.5 1.9 2.2 medium 2.5 1.8 2.1 basic 2.6 basic-
average 3.1 average
Farm 2 2.4 1.8 2.1 medium 3.0 3.0 3.0 average 2.2 basic 3.4 average-advanced
Farm 3 2.5 2.1 2.3 high 2.4 1.8 2.1 basic 2.6 basic-
average 3.1 average
Farm 4 2.1 1.4 1.8 medium 3.2 3.6 3.4 average-advanced
3.3 average-advanced
3.4 average-advanced
Farm 5 2.1 1.4 1.8 medium 3.1 3.4 3.3 average-advanced
3.6 average-advanced
3.9 advanced

86
A B
C
D
E F
Figure 5.1. Assessment of product and production as well as organisation and chain characteristics from Farm 1 (A), Farm 2 (B), Farm 3 (C), Farm 4 (D) and Farm 5 (E). The overall average assessment level of each farm and combined farms (F). Low (1), medium (2) and high (3) risk situations for product and process characteristics correspond to low, potential and high chance of microbiological or chemical contamination as well as correspondence to supportive, constrained and lacking administrative chain conditions or low, restricted and high dependence on other chain actors (Kirezieva et al., 2015)
0
1
2
3
Microbial risk ofproduction
Pesticide risk ofproduction
Climate conditions
Water supply
Workforce variability
Operator competences
Manangementcommitment
Employeeinvolvement
Formalisation
Stakeholderrequirements
Logistic facilitiescondition
Variability ofsuppliers for initial
materials
0
1
2
3
Microbial risk ofproduction
Pesticide risk ofproduction
Climate conditions
Water supply
Workforcevariability
Operatorcompetences
Manangementcommitment
Employeeinvolvement
Formalisation
Stakeholderrequirements
Logistic facilitiescondition
Variability ofsuppliers for initial
materials
0
1
2
3
Microbial risk ofproduction
Pesticide risk ofproduction
Climate conditions
Water supply
Workforcevariability
Operatorcompetences
Manangementcommitment
Employeeinvolvement
Formalisation
Stakeholderrequirements
Logistic facilitiescondition
Variability ofsuppliers for initial
materials
0
1
2
3
Microbial riskof production
Pesticide risk ofproduction
Climateconditions
Water supply
Workforcevariability
Operatorcompetences
Manangementcommitment
Employeeinvolvement
Formalisation
Stakeholderrequirements
Logisticfacilitiescondition
Variability ofsuppliers for
initial materials
0
1
2
3
Microbial riskof production
Pesticide risk ofproduction
Climateconditions
Water supply
Workforcevariability
Operatorcompetences
Manangementcommitment
Employeeinvolvement
Formalisation
Stakeholderrequirements
Logisticfacilitiescondition
Variability ofsuppliers for
initial materials
0
1
2
3Farm 1
Farm 2
Farm 3
Farm 4
Farm 5
OverallAverage

87
On average the design of the preventative measures, intervention methods and system design
resulted in average control activity design. Factors that decreased the scores for the control
activity design include the lack of proper microbial sampling plan decreasing the information
being contributed to improve food safety control, only two farms had a sampling plan based
on in-house knowledge and utilise the system on a spot check bases (Figure 5.2). In the EU
and other countries tested the majority of farms did not have microbial sampling plans in
place (Kirezieva et al., 2015). Microbial sampling and testing is not a requirement for fresh
produce farms.
Methods used to assess the presence of foodborne pathogens on the majority of EU and non-
EU farms were at low levels (Kirezieva et al., 2015), we found that this factor was rated as
basic to average levels on pear production farms. In this study hygienic design which only
meet basic hygiene requirements, non-specific partial physical intervention and methods to
assess equipment also contributed to a lower control activity design score.
All farms were assessed to be using highly advanced methods to assess pesticide
compliances, this was also observed on EU farms however not on non-EU farms (Kirezieva
et al., 2015). South African pear producing farms that export to the EU comply with EU
standards with regards to pesticide spraying and testing to ensure that maximum residue
level on fruit are below threshold levels in order for the product to move into the export
market, therefore this factor scores similarly to that of EU farms. Samples collected for
testing of pesticides are done so by a third party external accredited laboratory. The pesticide
program was thus considered on advanced levels on three of the five farms where the two
farms utilized advanced spraying programs based on site specific scientific background.
These two farms comply with standards focussed on application of pesticides, certified
pesticide usage and exact application (timing and amount) of sprays.
Farm 4 had the highest scoring operation of control activities with an advanced level,
followed by and Farm 5 with an average-advanced scoring operation of control activities,
then followed by Farm 2. Farm 1 and 3 had basic control activities operating levels. All
farms in this study conduct ad hoc hygiene performance of equipment and facilities. In
contract the majority of producers studied in the EU and other countries as outlined by
Kirezieva et al. (2015) had no information about on-farm hygienic performance.

88
Farms 1 and 3 showed that no stable system regarding storage and equipment performance
measurements were present. Farm 5 does not have packaging facilities therefore could not
attain high scores regarding package equipment as well as packaging capacity, therefore
further decreasing the overall score. Packaging equipment not being in place is rated the
same as not knowing the performance of the packaging equipment. In this study some farms
use a communal or a consortium packhouse, therefore this result shows a lower level of
control. Kirezieva et al. (2015) found that EU countries had stable performance of the on-
farm storage or cooling facilities, where as non-EU countries had mostly storage or cooling
facilities with little information on the performance. In this study it was evaluated that the
storage or cooling facilities on the farm had automatic conditions to control for temperature
and humidity with no analysis of deviations.
3.3. ASSESSMENT OF CORE ASSURANCE ACTIVITIES (PART III)
The following questions were answered the same for all five farms and were subsequently
excluded from the radar diagrams but were used to calculate the risk level. Compliance to
procedures, hygienic performance, documentation system and record keeping systems were
considered at the average level for all five farms. An average level of availability of
procedures was considered for all farms, except for Farm 5 where it was at the advanced
level. Farm 2 recorded basic levels for feedback information to modify HSMS whereas all
other farms were at the advanced level.
The overall rating of the core assurance activities followed the same trend as the core safety
control activities. Farm 2 was rated as having basic assurance activities, Farm 1 and 3 were
rated as having basic-average assurance activities and Farm 4 and 5 were rated as average-
advanced assurance activities (Table 5.1).
Product safety is obtained through proper system requirement activities. Due to retail chains
imposing quality and safety standard, all farms are pro-actively involved with stakeholder
requirements by implementation of proper quality assurance systems (i.e. HACCP, BRC and
ISO 22000) that should increase safety of marketable products. Typically these farms
implement the systematic use of feedback information to allow the modification of HSMS
systems as new legislation and international standards are adapted.

89
A
B
C
D
E
F
Figure 5.2. Assessment of control activities design from Farm 1 (A), Farm 2 (B), Farm 3 (C), Farm 4 (D) and Farm 5 (E). The overall average assessment level of each farm and combined farms (F). Situation levels represented by low level (1) -absent, not applicable, unknown; basic level (2) - lack of scientific evidence, use of company experience/history, variable, unknown, unpredictable, based on common materials/equipment; average level (3) - best practice knowledge/equipment, sometimes variable, not always predictable, based on generic information/guidelines for the product sector; advanced level (4) - scientifically underpinned (accurate, complete), stable, predictable, and tailored for the specific food production situation (Kirezieva et al., 2015).
0
1
2
3
4Hygienic design
Storage facilities
Packagingequipment
Pesticide program
Water control
Irrigation methods
Partial physicalintervention
Standardisation tool
Methods to assesspathogens
Methods to assessequipment
Microbial sampleplan
Pesticide sampleplan
0
1
2
3
4Hygienic design
Storage facilities
Packagingequipment
Pesticide program
Water control
Irrigation methods
Partial physicalintervention
Standardisation tool
Methods to assesspathogens
Methods to assessequipment
Microbial sampleplan
Pesticide sampleplan
0
1
2
3
4Hygienic design
Storage facilities
Packaging equipment
Pesticide program
Water control
Irrigation methods
Partial physicalintervention
Standardisation tool
Methods to assesspathogens
Methods to assessequipment
Microbial sampleplan
Pesticide sample plan
0
1
2
3
4Hygienic design
Storage facilities
Packagingequipment
Pesticide program
Water control
Irrigation methods
Partial physicalintervention
Standardisation tool
Methods to assesspathogens
Methods to assessequipment
Microbial sampleplan
Pesticide sampleplan
0
1
2
3
4Hygienic design
Storage facilities
Packagingequipment
Pesticide program
Water control
Irrigation methods
Partial physicalintervention
Standardisation tool
Methods to assesspathogens
Methods to assessequipment
Microbial sampleplan
Pesticide sampleplan
0
1
2
3
4Farm 1
Farm 2
Farm 3
Farm 4
Farm 5
Overall Average

90
Farm 5 scored the highest with regard to the core assurance activities due to a number of
factors, including the feedback information to the HSMS, prevention measures, intervention
processes validation, monitoring process validation and people related performance
validation were all scored at the advanced level, all other factors were scored as average-
advanced (Figure 5.4).
All farms in this study, as well as farms in the study conducted by Kirezieva et al. (2015)
recorded well-structured record keeping and documentation systems, which positively add
to the product safety. All core assurance activities in this study were rated similarly to EU
farms assessed by Kirezieva et al. (2015).
3.4. ASSESSMENT OF FOOD SAFETY PERFORMANCE (PART IV)
The following questions were answered the same for all five farms and were subsequently
excluded from the radar diagrams but were used to calculate the food safety output level.
Microbial complaints, product sampling to confirm use of pesticides, judgment criteria of
pesticides and non-conformities were placed into the advanced level for all the farms and
visual quality complaints were placed considered average. Farm 5 had advanced FSMS
evaluation whereas all other farms had average FSMS evaluation.
The overall food safety output indicated that Farm 5 had advanced food safety indicators,
Farm 2 and 4 had average-advanced food safety output and Farm 1 and 3 had average food
safety output (Table 5.1).
All farms have medium risk initial materials (Figure 5.1) and Farm 1 and 3 have high
pesticide production risk, Farm 2 and 4 have medium risk and Farm 5 has low pesticide
production risk (Figure 5.1). All farms have average or advanced pesticide sampling plans
that are well structured on company level and regular monitoring on a sector level.
Methodology used to assess pesticides are all at advanced levels with results being judged
on legal, external party and internal guidelines. Farm 1 and 3 have limited chemical
complaints and Farm 2, 4 and 5 have no chemical complaints. All these factors lead to
increased FSMS output. Kirezieva et al. (2015) found that the majority of companies (93 of
the 118) studied demonstrated average and advanced levels of pesticide management.

91
Farm 1 and 3 both have medium microbial risk of initial materials and the microbial risk of
production is high (Figure 5.1 A and C), these two farms do not have a microbial sampling
plan nor methods to assess microbial contamination (Figure 5.2 A and C) therefore have a
low level performance with regards to sampling and judgment of microbiological analysis
within the internal FSMS assessed (Figure 5.4 A and C). Farm 4 and Farm 5 have low and
medium initial material microbial risk, respectively, and medium microbial production risks
(Figure 5.1 D and E). Both farms have average and advanced control measures for the
microbial sampling plan and pathogen detection methodology (Figure 5.2 D and E). Farm
5 have advanced microbial judgment levels with results that are obtained being compared to
legal criteria, specifications of external parties as well as internal guidelines, therefore
leading to a better FSMS output. Farm 4 only conducts ad hoc sampling on the final product
and compares the results to legal criteria and specifications from external parties. Farm 2
has medium initial material microbial risk and high production risk (Figure 5.1 B) and does
not have a sampling plan in place and all methods used to assess microbial pathogens were
culture based in a non-certified laboratory (Figure 5.2 B). However in the analysis of the
FSMS this farm rated that structured microbial sampling is conducted on the final product
and only legal criteria are used to assess the microbial results obtained (Figure 5.4 B). For
all farms no microbiological complaints were received (Figure 5.4).
The external FSMS are evaluated by third party auditors against quality assurance standards;
this eliminates any bias results to that company (Figure 5.4). Chemical and visual
complaints are restricted or have been received, resulting in good quality FSMS
implementation. No non-conformities regarding microbiological indicators, pesticides or
mycotoxins were registered, therefore a good food safety performance can be expected
(Figure 5.4). Kirezieva et al. (2015) found that companies in the EU had restricted numbers
of non-conformities and non-EU companies in the study had no formal system in place to
register non-conformities. The findings reflected in this study have indicated that the self-
assessment of the food safety management systems can lead to bias in the farms favour,
especially with sensitive questions. This is illustrated by Farm 1, Farm 2 and Farm 3 who
rated themselves as having a highly advanced performance level for non-conformities which
indicates that no non-conformities regarding microbiological food safety, hygiene indicators
and pesticides or mycotoxins were received but none of these farms test for mycotoxins and
only some indicated that microbiological assessment was done. Further development of the

92
A
B
C
D
E
F
Figure 5.3. Assessment of control activities operation of Farm 1 (A), Farm 2 (B), Farm 3 (C), Farm 4 (D) and Farm 5 (E). The overall average assessment level of each farm and combined farms (F). Situation levels represented by low level (1) -absent, not applicable, unknown; basic level (2) - lack of scientific evidence, use of company experience/history, variable, unknown, unpredictable, based on common
materials/equipment; average level (3) - best practice knowledge/equipment, sometimes variable, not always predictable, based on generic information/guidelines for the product sector; advanced level (4) - scientifically
underpinned (accurate, complete), stable, predictable, and tailored for the specific food production situation (Kirezieva et al., 2015).
0
1
2
3
4
Storage/coolingcapacity
Process capability:Physical intervention
Process capability:Packaging
Measurement ofperformance
Analytical equipmentperformance
Stakeholderrequirements into ownHSMS requirements
Preventatice measuresvalidation
Intervention processesvalidation
Monitoring processesvalidation
People relatedperformance
validation
Equipment andmethod performance
verification
0
1
2
3
4Storage/cooling capacity
Process capability:Physical intervention
Process capability:Packaging
Measurement ofperformance
Analytical equipmentperformance
Stakeholder requirementsinto own HSMS
requirements
Preventatice measuresvalidation
Intervention processesvalidation
Monitoring processesvalidation
People relatedperformance validation
Equipment and methodperformance verification
0
1
2
3
4
Storage/coolingcapacity
Process capability:Physical intervention
Process capability:Packaging
Measurement ofperformance
Analyticalequipment
performanceStakeholderrequirements into
own HSMSrequirements
Preventaticemeasures validation
Interventionprocesses validation
Monitoringprocesses validation
People relatedperformance
validation
Equipment andmethod performance
verification
0
1
2
3
4
Storage/coolingcapacity
Process capability:Physical intervention
Process capability:Packaging
Measurement ofperformance
Analytical equipmentperformanceStakeholder
requirements intoown HSMS
requirements
Preventaticemeasures validation
Interventionprocesses validation
Monitoring processesvalidation
People relatedperformance
validation
Equipment andmethod performance
verification
0
1
2
3
4Farm 1
Farm 2
Farm 3
Farm 4
Farm 5
Overall Average

93
A
B
C
D
E
F
Figure 5.4. Assessment of food safety performance, external and internal food safety performance indicators of Farm 1 (A), Farm 2 (B), Farm 3 (C), Farm 4 (D) and Farm 5 (E). The overall average assessment level of each farm and combined farms (F). Scenario levels represents (1) - absent, not applied, unknown; poor output (2) - ad-hoc sampling, minimal criteria used for evaluation, various food safety problems due to different problems in the activities; moderate
output (3) - regular sampling, several criteria used for evaluation, restricted food safety problems mainly due to one (restricted) type of problem in the activities; good output (4) - systematic evaluation, using specific
criteria, no safety problems (Kirezieva et al., 2015).
0
1
2
3
4
Seriousness ofremarks
Chemicalcomplaints
Sampling to confirmmicrobiological
performance
Judgment criteriamicrobiological
results0
1
2
3
4
Seriousness ofremarks
Chemicalcomplaints
Sampling to confirmmicrobiological
performance
Judgment criteriamicrobiological
results0
1
2
3
4
Seriousness ofremarks
Chemical complaints
Sampling to confirmmicrobiological
performance
Judgment criteriamicrobiological
results
0
1
2
3
4
Seriousness ofremarks
Chemicalcomplaints
Sampling to confirmmicrobiological
performance
Judgment criteriamicrobiological
results0
1
2
3
4
Seriousness ofremarks
Chemicalcomplaints
Sampling to confirmmicrobiological
performance
Judgment criteriamicrobiological
results0
1
2
3
4Farm 1
Farm 2
Farm 3
Farm 4
Farm 5
Overall Average

94
self-assessment tool should include microbiological, mycotoxin and pesticide non-conformities
as separate questions to improve the food safety output accuracy.
4. CONCLUSION
Application of the FSMS diagnostic tool reflect all major performance levels associated with
the production farm. The results and conclusions regarding each farm have unique
characteristics to the specific on-farm scenarios and are scored accordingly. Therefore a
uniform direct application to all the different types of farms cannot reflect the true management
system and performance level of a single given farm (Semos and Kontogeorgos, 2007). The
CDC (2013) found that ten sites monitored for over a 13 year period had no positive or negative
change in the resulted human microbial pathogenic infections after implementing a better
FSMS. The current data on outbreaks suggests that the implemented FSMS are not enough to
limit infections and spread of human pathogenic microorganisms. The need for a definite food
safety assessment is needed to cover all aspects of the applied FSMS. In this study it has been
found that in order to evaluate compliance levels of pear production systems, the self-
assessment tool needs to be adapted to suit the commodity and its final use.
Three main issues that needed to be assessed according to the tool for fresh produce include
pesticide residue levels, mycotoxin presence and microbial contamination (Kirezieva et al.
2013). In order for fruit to be exported into various global markets fruit are tested for pesticide
residue levels in compliance with international standards. Mycotoxins are only considered a
problem and a chemical hazard when fruit enter the processing arena. In this study pears were
used for whole fruit sale and therefore mycotoxin testing is not required. However, some of
this fruit will be desired for juicing and in that case the bulk shipment should be tested prior to
processing. We therefore propose that in the assessment of fresh produce product safety from
farms that contribute to whole fruit sale, mycotoxin testing should not be included. For the pear
farms in the current study removing all mycotoxin related question did not have a significant
effect on the final food safety output, however the potential does exist that this could change
the control activity level and overall food safety output from a lower to a higher level. At
primary production the FSMS is a result of the implementation of good agricultural and
hygienic practices. During the implementation of good agricultural and hygienic practices there
is no requirement for microbial testing of fresh produce. This is not a recommendation within
the EU, nor for produce produced within the USA. Most companies do not have knowledge

95
and awareness about microbiological hazards within the fresh produce production arena. On
the other hand, within the processing and trade arena the FSMS includes HACCP-based
principles, good manufacturing and hygiene practices, where microbial and mycotoxin testing
becomes important. Future work should include thorough microbial and pesticide testing in
parallel to the risk assessment to be able to make direct statements on current implemented
management systems.
5. REFERENCES
Centres for Disease Control and Prevention. (2013). Incidence and trends of infection with
pathogens transmitted commonly through food-foodborne diseases active surveillance
network, 10 US sites, 1996-2012. MMWR. Morbidity and Mortality Weekly Report, 62(15),
283.
Coghan, A. (2000). Food Poisoning Bugs Thrive in Crop Sprays. New Scientist, 168.2259,
20.
Guan, T. Y., Blank, G., Ismond, A. & Van Acker, R. (2001). Fate of foodborne bacterial
pathogens in pesticide products. Journal of the Science of Food and Agriculture, 81(5), 503-
512.
Jacxsens, L., Kussaga, J., Luning, P. A., Van der Spiegel, M., Devlieghere, F. & Uyttendaele,
M. (2009a). A microbial assessment scheme to measure microbial performance of food
safety management systems. International Journal of Food Microbiology, 134(1), 113-125.
Jacxsens, L., Uyttendaele, M. & Devlieghere, F. (2009b). Quality management systems in the
food industry. Sofia: St Kliment Ohridski University Press.
Kirezieva, K., Nanyunja, J., Jacxsens, L., van der Vorst, J. G. A. J., Uyttendaele, M. & Luning,
P. A. (2013). Context factors affecting design and operation of food safety management
systems in the fresh produce chain. Trends in Food Science & Technology, 32(2), 108-127.
Kirezieva, K., Luning, P. A., Jacxsens, L., Allende, A., Johannessen, G. S., Tondo, E. C.,
Rajkovic, A., Uyttendaele, M. & van Boekel, M. A. J. S. (2015). Factors affecting the status
of food safety management systems in the global fresh produce chain. Food Control, 52, 85-
97.

96
Luning, P. A., Chinchilla, A. C., Jacxsens, L., Kirezieva, K. & Rovira, J. (2013). Performance
of safety management systems in Spanish food service establishments in view of their
context characteristics. Food Control, 30(1), 331-340.
Luning, P. A., Marcelis, W. J., Rovira, J., Van Boekel, M. A. J. S., Uyttendaele, M. & Jacxsens,
L. (2011). A tool to diagnose context riskiness in view of food safety activities and
microbiological safety output. Trends in Food Science & Technology, 22, S67-S79.
Lunning, P.A., van der Spiegel, M. & Marcelis, W.J. (2006). Quality assurance systems and
food safety. In Safety in agri-food chains pp. 249-302.Edited by PA Lunning, F Devlieghere
and E Verhe.Wageningen Academic Publishers, Wageningen, Netherlands.
Semos, A. & Kontogeorgos, A. (2007). HACCP implementation in northern Greece: Food
companies' perception of costs and benefits. British Food Journal, 109(1), 5-19.
Tsola, E., Drosinos, E. H., & Zoiopoulos, P. (2008). Impact of poultry slaughter house
modernisation and updating of food safety management systems on the microbiological
quality and safety of products. Food Control, 19(4), 423-431.

97
CHAPTER 6
GENERAL DISCUSSION AND CONCLUSION
The South African pear industry exports 48% (181 928 tonnes) of total whole-pear fruit
produced annually (Hortgro, 2013). The fruit surface microbial ecology, food safety and
production risk assessment focused studies for pears has to the authors knowledge not been
investigated. The carpoplane microbial status interlinks public health, microbial ecology and
food safety to consumers of unprocessed fruit. In this study we described overall bacterial
diversity on pear fruit surfaces. Microbial organisms reside naturally on plant surfaces and can
be introduced through external sources. Not only natural residing organisms but also foodborne
pathogens (Escherichia coli O157:H7, Listeria monocytogenes and Salmonella enterica subsp.
enterica serovar Typhimurium) could contaminate and have been found to attach and colonise
different food sources (Centres for Disease Control and Prevention, 2014). The ability of
microorganisms to survive in a pear production chain depends highly on an organisms’ ability
to overcome host defence mechanisms and to adapt to fluctuations in environmental conditions
as well as the ability to rapidly attach and colonise the surface (Collignon & Korsten, 2010;
Sapers et al., 2005). A proper scientific evaluation of fruit surfaces is needed in order to
determine the microbial flora of a healthy pear. The microbial load and the presence of
identified microorganisms present on fruit surfaces, contributes to a better understanding of
pre- and post-harvest factors affecting microbial ecology on a healthy pear surface. A
diagnostic tool assessing the food safety management systems (FSMS) within a typical pear
production supply chain further identified the shortcomings of farming practices and
contributed to determining the potential link between food safety hazards and current
management systems for more effective risk management studies.
The influence of temperature typically controls the growth rate of microbial organisms, along
with other factors. The optimum growth temperature range residential microbes were found to
be similar to that of pear surface and atmospheric temperatures measured. Curtobacterium
flaccumfaciens (Funke et al., 2005), Pantoea agglomerans (Jung et al., 2002), Pseudomonas
azotoformans (Iizuka & Komagata, 1963), P. syringae (Young et al., 1977), Serratia
marcescens (Hejazi & Falkiner, 1997) were some of the dominant microbial organisms
identified in this study to have these optimal growth temperature ranges. The clustering of the
associated bacterial species resulted in three dominant phyla, these include Firmicutes,

98
Actinobacteria and Proteobacteria (divided into the Beta- and Gamaproteobacteria classes).
Dominant Microbacteriaceae account to 46% of dominant species identified in this study. Leff
and Fierer (2013) reported that Microbacteriaceae were dominantly present on peach surfaces
(16.4 %) though unculturable techniques were applied.
The importance of survival and the attachment mechanisms of foodborne pathogens is
described in a study by Solomon and Matthews (2006). Findings showed that even though the
pathogens were able to adhere to the fruit surfaces (Chapter 2), several factors such as, chemical
drenching, environmental and storage conditions as well as extended fruit storage periods may
reduce the survivability of foodborne pathogens through the pear production chain. The non-
corrugated, smooth surfaced with wax scales and without trichomes pear fruit surface presents
a suitable niche to be populated by the residing microbes (Chapter 2, Roszak & Colwell, 1987).
Inoculated foodborne pathogens are capable of colonising and surviving the fruit surfaces. The
capability to cause a foodborne illness does not only depend on the survivability of the
foodborne pathogen but is also influenced by the infectious dose ingested at the point of
consumption. In this study it was found that E. coli O157:H7, L. monocytogenes and
Salmonella Typhimurium but not Staphylococcus aureus were able to survive at a high enough
infectious doses to potentially cause an illness. Therefore it is important to determine how the
foodborne pathogens interact and survive on fruit and vegetable surfaces as well as where
contamination occurs along the supply chain in order to implement the appropriate control steps
required within the production and transport environments.
The high number of recorded foodborne pathogen outbreaks have been traced back to the
production stages concluding that the probability of foodborne pathogens able to survive up to
the market stages are high, resulting in foodborne illness if contaminated produce are consumed
(Todd et al., 2009). Not only in this study have E. coli O157:H7 and Salmonella Typhimurium
attachment structures been observed within a couple of minutes of pear surface exposure but
also by Collignon and Korsten (2010) on peaches and plums. Residential epiphytic bacteria
were speculated to influence E. coli resulting in low attachment in a study done on cherry
tomatoes and strawberries (Ziuzina et al., 2014). Residential microorganisms identified on pear
fruit included both bacteria that are potentially harmful to humans and plants, as well as bacteria
containing beneficial properties. Bacterial species isolated in this study has been identified to
have plant and non-plant specific pathogenic properties (Braun-Kiewnick et al., 2000;
Janisiewicz & Buyer, 2010; Patten & Glick, 2002). Knowledge of the supply chain could

99
contribute to implementation of practices to reduce post-harvest losses and contamination of
foodborne pathogens. Also early detection of foodborne pathogens reduces the potential health
risk to consumers of raw unprocessed fruit. The most common microbial contamination sources
are water, wind-blown dust, physical handling from pickers and contact surfaces within the
packhouse.
Proper food safety production management systems implemented could drastically lower the
risk of a possible foodborne disease outbreak. A diagnostic tool developed (Lunning et al.,
2011) and adapted (Kirezieva et al., 2015) has highlighted some factors within the production
system that increase and decreases the risk within a typical pear production farming system in
the Western Cape Province. The overall risk findings of four pear producing farms were found
to be on average to advanced management levels with minor variations between different
farming company practices. Findings shown that the adapted Horticulture Safety Management
System is a good tool for self-assessment to obtain an overall view of the level of riskiness of
a company and the effectiveness of its management system. The emphasis should therefore
still be focused on foodborne pathogen detection and prevention as outbreaks have led to
mortalities to consumers of contaminated products.
The South African Department of Health does not have a standard for allowable or acceptable
aerobic bacterial counts on raw consumed fruit and vegetables surfaces. Data on fungal, yeast,
coliforms and foodborne pathogens (including E. coli, Salmonella spp. and L. monocytogenes)
are expressed as CFU/g, which is not a true reflection on the total surface microbial numbers
present (Department of Health, 2006). This study has been the first to present a true
representation of the microbial status of a natural healthy pear. Concluding that the microbial
load of an unprocessed pear is defined as an aerobic bacterial concentration of less than 5 log
CFU/cm2. In addition, no foodborne pathogens should be present in order to be classified as a
healthy pear. Pears sampled after drenching (before CA) as well as after CA storage were
classified as natural healthy pears. Future studies should investigate the impact of variable
environmental factors, lower inoculation loads as well as host response to the interaction of
foodborne pathogens, natural occurring biocontrol microorganisms, and host specific plant
pathogenic and residential epiphytic microorganisms on the fruit surfaces. The combination of
molecular and viable detection methods in a food safety assessment strategy provides a clear
diagnostic framework. Other cultivars and the impact of processing technologies on the
bacterioflora should also be considered in future research.

100
Microbial ecology studies are and will be revolutionised with culture-independent studies of
the microbiome of plant surfaces. Future research should focus on the metagenomics approach
to determine the complete microbiome of pears as well as to determine the effect that different
farming practices have on the microbiome of pear fruit. In addition to investigating the culture
independent microbiome of pear fruit, one can gauge the range of foodborne pathogens and
bacterial plant pathogens found on the pear carpoplane.
REFERENCES
Braun-Kiewnick, A., Jacobsen, B. J. & Sands, D. C. (2000). Biological control of Pseudomonas
syringae pv. syringae, the causal agent of basal kernel blight of barley, by antagonistic
Pantoea agglomerans. Phytopathology, 90(4), 368-375.
Centres for Disease Control and Prevention. (2014). List of Selected Multistate Foodborne
Outbreak Investigations. [ONLINE] Available at: http://www.cdc.gov/foodsafety/
outbreaks/multistate-outbreaks/outbreaks-list.html. [Accessed 15 December 2014].
Collignon, S. & Korsten, L. (2010). Attachment and Colonization by Escherichia coli O157:
H7, Listeria monocytogenes, Salmonella enterica subsp. enterica serovar Typhimurium,
and Staphylococcus aureus on Stone Fruit Surfaces and Survival through a Simulated
Commercial Export Chain. Journal of Food Protection, 73(7), 1247-1256.
Department of Health. (2006). Guidelines for environmental health officers on the
interpretation of microbiological analysis data of food. Department of health, directorate:
Food Control. Annexure B Proposed Microbiological Specification to be used as
Guidelines for Foods. Pretoria, pp. 26.
Funke, G., Aravena-Roman, M. & Frodl, R. (2005). First description of Curtobacterium spp.
isolated from human clinical specimens. Journal of Clinical Microbiology, 43(3), 1032-
1036.
Hejazi, A. & Falkiner, F. R. (1997). Serratia marcescens. Journal of Medical Microbiology,
46(11), 903-912.
Hortgro (2013) Key Deciduous Fruit Statistics/Sagtevrugte Statistiek (2014). Chapter 5 – Pears.
[ONLINE] Available at: http://www.hortgro.co.za/market-intelligence-statistics/key-
deciduous-fruit-statistics/ [Accessed 26 December 2014].

101
Iizuka, H. & Komagata, K. (1963). New species of Pseudomonas belonged to fluorescent group
(Studies on the microorganisms of cereal grains. Part V). Journal Agricultural Chemical
Society, 37, 137-141.
Janisiewicz, W. J., & Buyer, J. S. (2010). Culturable bacterial microflora associated with
nectarine fruit and their potential for control of brown rot. Canadian Journal of
Microbiology, 56(6), 480-486.
Jung, I., Park, D. H. & Park, K. (2002). A study of the growth condition and solubilization of
phosphate from hydroxyapatite by Pantoea agglomerans. Biotechnology and Bioprocess
Engineering, 7(4), 201-205.
Kirezieva, K., Luning, P. A., Jacxsens, L., Allende, A., Johannessen, G. S., Tondo, E. C.,
Rajkovic, A., Uyttendaele, M. & van Boekel, M. A. J. S. (2015). Factors affecting the
status of food safety management systems in the global fresh produce chain. Food
Control, 52, 85-97.
Leff, J. W. & Fierer, N. (2013). Bacterial communities associated with the surfaces of fresh
fruits and vegetables. PloS one, 8(3), e59310.
Luning, P. A., Marcelis, W. J., Rovira, J., Van Boekel, M. A. J. S., Uyttendaele, M., & Jacxsens,
L. (2011). A tool to diagnose context riskiness in view of food safety activities and
microbiological safety output. Trends in food Science & technology, 22, S67-S79.
Patten, C. L. & Glick, B. R. (2002). Role of Pseudomonas putida indoleacetic acid in
development of the host plant root system. Applied and Environmental Microbiology,
68(8), 3795-3801.
Roszak, D. B. & Colwell, R. R. (1987). Survival strategies of bacteria in the natural
environment. Microbiological reviews, 51(3), 365.
Sapers, G. M., Gorny, J. R. & Yousef, A. E. (Eds.). (2005). Microbiology of fruits and
vegetables. CRC Press. p52.
Solomon, E. B. & Matthews, K. R. (2006). Interaction of live and dead Escherichia coli O157:
H7 and fluorescent microspheres with lettuce tissue suggests bacterial processes do not
mediate adherence. Letters in applied microbiology, 42(2), 88-93.
Todd, E. C., Greig, J. D., Bartleson, C. A. & Michaels, B. S. (2009). Outbreaks where food
workers have been implicated in the spread of foodborne disease. Part 6. Transmission

102
and survival of pathogens in the food processing and preparation environment. Journal of
Food Protection, 72(1), 202-219.
Young, J. M., Luketina, R. C. & Marshall, A. M. (1977). The effects on temperature on growth
in vitro of Pseudomonas syringae and Xanthomonas pruni. Journal of Applied
Bacteriology, 42(3), 345-354.
Ziuzina, D., Patil, S., Cullen, P. J., Keener, K. M. & Bourke, P. (2014). Atmospheric cold
plasma inactivation of Escherichia coli, Salmonella enterica serovar Typhimurium and
Listeria monocytogenes inoculated on fresh produce. Food Microbiology, 42, 109-116.

103
APPENDIX 1
Table 1: Controlled atmosphere storage conditions and maturity index values of five pear cultivars
(Findlay & Combrink, 2013)
Cultivar
Release Criteria Over Mature
Standard Atmospheric Conditions Storage
Period
(Months) Firmness
(kg) %TSS
Acid
%
Firmness
(kg)
Acid
%
O2
(%)
CO2
(%)
Temp
(°C)
Packham’s
Triumph 8 11.5 0.3 5 0.2
Opt.: 1,5 2,5 -0,5
9 Max 2,0 3,0 0,0
Min 1,0 1,0 -0,5
Forelle 6.8 13.5 0.3 4.5 0.2
Opt. 1,5 0,0 -
1,5 -0,5
7 Max 2,0 1,5 0,0
Min 1,0 0,0 -0,5
William
Bon
Chretien
10.5 11 0.35 7.2 0.3
Opt. 1,0 0,0 -0,5
4 Max 1,5 0,0 0,0
Min 1,0 0,0 -0,5
Beurre
Bosc 8.1 12.5 0.3 4.5 0.2
Opt. 1,5 1,5 -0,5
4 Max 2,0 2,0 0,0
Min 1,0 1,0 -0,5
Doyenne
du Comice 6.8 12 0.35 3.6 0.25
Opt. 1,0 1,0 -0,5
6 Max 1,5 1,5 0,0
Min 1,0 1,0 -0,5
*TSS – Total Soluble Solids

104
APPENDIX 2
Table 1. Pear surface temperatures of two consecutive seasons at harvest stages
Pears Harvested Farm 1
9:00 am
Farm 2
11:37 am
Farm 3
11:00 am
Farm 4
13:20 pm
Sea
son
1
(20
13)
Replicate 1 13.2 ± 0.3 18.2 ± 2.4 20.0 ± 0.9 26.9 ± 1.3
Replicate 2 11.8 ± 0.2 18.2 ± 4.1 18.9 ± 0.9 27.0 ± 0.8
Replicate 3 11.2 ± 0.5 20.1 ± 4.4 20.9 ± 2.3 22.9 ± 0.4
Replicate 4 14.0 ± 1.5 15.4 ± 1.5 17.0 ± 1.1 24.4 ± 1.0
Pears Harvested Farm 1
10:05 am
Farm 2
11:40 am
Farm 3
13:27 pm
Farm 4
14:51 pm
Sea
son
2
(20
14)
Replicate 1 29.5 ±4.6 20.3 ± 0.9 18.9 ± 0.5 20.7 ± 2.0
Replicate 2 23.1 ± 5.2 19.7 ± 0.7 17.3 ± 0.9 21.4 ± 2.7
Replicate 3 20.7 ± 1.7 19.7 ± 0.7 18.6 ± 0.2 20.6 ± 1.6
Replicate 4 20.6 ± 0.6 19.5 ± 0.7 17.6 ± 4.0 21.7 ± 2.1
Figure 1. Weather data of two consecutive seasons on harvest day (18/2/2013 and 19/5/2014).
(http://www.worldweatheronline.com/).
02:00 05:00 08:00 11:00 14:00 17:00 20:00 23:00
Season 1 Humidity 89% 92% 80% 57% 53% 63% 89% 97%
Season 2 Humidity 60% 56% 57% 46% 46% 58% 82% 88%
Season 1 Temp 22 16 17 26 28 26 19 18
Season 2 Temp 10 10 10 21 27 24 12 10
0%
10%
20%
30%
40%
50%
60%
70%
80%
90%
100%
0
5
10
15
20
25
30
Atm
osp
her
ic H
um
idit
y (
%)
Atm
osp
her
ic t
emp
era
ture
(°C
)
Time

105
APPENDIX 3
FARM 1 FARM 2 FARM 3 FARM 4 FARM 5
Part 0: Introduction and selection of Representative Production Unit (RPU)
What is the ownership of your farm (e.g. independent producer, in a cooperative, out-grower/contract farmer)?*
Independent Producer
Cooperative Independent
Producer Independent
Producer Independent
Producer
Location of your farm Elgin, Western
Cape, South Africa
Elgin, Western Cape, South
Africa
Elgin, Western Cape, South
Africa
Elgin, Western Cape, South
Africa
Grabouw, Western Cape
Total number of permanent employees in the company. 10-49 10-49 10-49 10-49 10-49 Total number of temporary employees in the company. 50-249 50-249 10-49 50-249 50-249
Products cultivated on the farm. Apples, Pears, Peaches and
Plums
Apples and Pears
Apples and Pears
Apples and Pears
Apples, Pears, Plums, Wine
Grapes What type of cultivation system do you have (e.g. greenhouse, open field)*? Open Field Open Field Open Field Open Field Open Field Are your products sold as organic production? No No No No No Do you have a combined production of cereals or animal by-products? Yes No No No No
Which Quality Assurance (QA) standards/guidelines have been implemented*? GLOBAL-GAP GLOBAL-GAP GLOBAL-GAP
GLOBAL-GAP, HACCP,
BRC, Tesco Standards,
Tesco Nurture
GLOBAL-GAP
For which QA standards is your company certified*? GLOBAL-GAP GLOBAL-GAP GLOBAL-GAP
GLOBAL-GAP, BRC,
Tesco Standards,
Tesco Nurture
GLOBAL-GAP
Did the owner/manager of the farm undergo training on food safety/quality management*? No Yes Yes Yes Yes Which specific product is made in this production unit? (e.g. lettuce, spinach, apple, berries) Pears Pears Pears Pears Pears
Who are the major customers of this specific product group? (e.g. auctions, open market, wholesalers, retailers, food processing companies, etc.)
Informal Market, Fresh Market, International
Market, Wholesalers,
Retailers, Food Processing Companies
International Market,
Wholesalers, Retailers, Food
Processing Companies
Informal Market, Fresh
Market, International
Market, Wholesalers,
Retailers, Food Processing Companies
Wholesalers, Retailers
International Market
What are the initial materials that you use for these products? (e.g. seeds, seedlings, small trees for cultivation)
Certified Small Trees
Certified Small Trees
Certified Small Trees
Certified Small Trees
Certified Small Trees

106
FARM 1 FARM 2 FARM 3 FARM 4 FARM 5
What is packaging/storage concept used for this product group? (e.g. no packaging, crates, bags, bulk containers, CA, etc.)
Packaged Boxes, Bags
Not Packed, Bulk, Crates,
Juiced
Packed in Boxes and Not
Packed
Crates, Bags, Bulk
containers, CA.
Packed in Boxes and Not
Packed What are major activities to cultivate this product (e.g. planting, fertilization, irrigation, harvesting, packaging)
All All All All All
What are major units used for this product group (e.g. cultivation area/field, packaging area, storage facility, water storage, compost storage area, etc.)
Cultivation Area, Storage Facility,
Holding Dam/Borehole,
Compost Storage Area, Pesticides
and Fertiliser Facilities
N/A
Cultivation and Storage,
Holding Dam, Borehole,
Pesticides and Fertiliser Facilities
Cultivation Area/Field, Packaging
Area, Drenching
(Post Harvest Chemical Treatment
Plant), Storage and Cold Storage
Facilities, Water Storage
Cultivation Area
What are major equipment/machines used of this product group (e.g. harvesting machine, packaging machine, weeding machine, pesticide sprayer, etc.)?
Pesticide Sprayers, Transport
Tractors, Trucks, Mowers
Weeding Machine, Pesticide Sprayer,
Transport Tractors, Trucks
Pesticide Sprayers, Transport Tractors, Trucks
Tractors, Picking Bags, Picking Bins, Contaminant
Ladders, Forklifts, Trucks,
Packshed Facility
Machine, Pesticide
Sprayer, Grass Cutting
Machine, Weed Sprayer, Snail
Pellet Spreader.
Weeding Machine, Pesticide Sprayer,
Transport Tractors, Trucks

107
FARM 1 FARM 2 FARM 3 FARM 4 FARM 5
Part I: Assessment contextual factors A. Assessment of product characteristics
In which situation would you place the initial materials in respect to microbiological contamination?
Situation 2 Situation 2 Situation 2 Situation 1 Situation 2
In which situation would you place the initial materials in respect to pesticide contamination? Situation 2 Situation 2 Situation 2 Situation 2 Situation 2 In which situation would you place the initial materials in respect to mycotoxin
contamination? Situation 3 Situation 3 Situation 3 Situation 3 Situation 3
In which situation would you place the final product in respect to microbiological contamination?
Situation 3 Situation 3 Situation 3 Situation 2 Situation 2
In which situation would you place the final product in respect to pesticide contamination? Situation 3 Situation 2 Situation 3 Situation 2 Situation 1 B. Assessment of process characteristics
In which situation would you place susceptibility for microbial contamination of the production/cultivation system?
Situation 3 Situation 3 Situation 3 Situation 3 Situation 3
In which situation would you position the climate conditions in which your RPU operates, in respect to microbiological and chemical contamination?
Situation 3 Situation 3 Situation 3 Situation 2 Situation 2
In which situation would you position the water supply in respect to microbiological and chemical contamination?
Situation 1 Situation 1 Situation 1 Situation 2 Situation 2
C. Assessment of organization characteristics In which situation would you place your company with regards technological staff? Situation 2 Situation 2 Situation 2 Situation 1 Situation 2 In which situation would you place the variability of workforce composition? Situation 1 Situation 2 Situation 3 Situation 1 Situation 1 In which situation would you place requirements on operator competences? Situation 3 Situation 2 Situation 3 Situation 1 Situation 2 In which situation would you place management commitment of your company? Situation 1 Situation 2 Situation 1 Situation 1 Situation 2 In which situation would you place employee involvement? Situation 3 Situation 2 Situation 3 Situation 3 Situation 2 In which situation would you place formalization to support decision-making in your company?
Situation 3 Situation 3 Situation 3 Situation 1 Situation 1
In which situation would you place information systems to support food safety (management system) decisions in your company?
Situation 2 Situation 2 Situation 2 Situation 1 Situation 2
D. Assessment of chain environment characteristics In which situation would you place requirements of stakeholders? Situation 2 Situation 1 Situation 2 Situation 3 Situation 2 In which situation would you place supplier relationships with respect to the major suppliers of critical materials for your RPU?
Situation 3 Situation 3 Situation 3 Situation 3 Situation 1
In which situation would you place your food safety information exchange with the major suppliers of critical materials for your RPU?
Situation 1 Situation 1 Situation 1 Situation 1 Situation 1
In which situation would you place the conditions of the logistic facilities used till the product reach the next chain actor?
Situation 3 Situation 3 Situation 3 Situation 1 Situation 1
In which situation would you place inspections of food safety authorities in your country in respect to your RPU?
Situation 1 Situation 1 Situation 1 Situation 1 Situation 1
In which situation would you place the variability of suppliers for initial materials for cultivation in your farm/company?
Situation 2 Situation 1 Situation 2 Situation 1 Situation 1
In which situation would you place the specificity of external support in respect to your RPU?
Situation 1 Situation 1 Situation 1 Situation 1 Situation 1

108
FARM 1 FARM 2 FARM 3 FARM 4 FARM 5
In which situation would you place the specificity food safety legal framework in your country in respect to your RPU?
Situation 1 Situation 1 Situation 1 Situation 1 Situation 1
PART II: Assessment core safety control activities E. Assessment of preventive measures design
At which situation would you place the hygienic design of equipment and facilities relevant for your RPU?
Situation 2 Situation 2 Situation 2 Situation 3 Situation 3
At which situation would you place your maintenance and calibration program relevant for your RPU?
Situation 4 Situation 4 Situation 4 Situation 3 Situation 4
At which situation would you place the storage facilities relevant for your RPU? Situation 2 Situation 2 Situation 2 Situation 3 Situation 4 At which situation would you place the sanitation program(s) relevant for your RPU? Situation 3 Situation 3 Situation 3 Situation 3 Situation 3 At which situation would you place the personal hygiene requirements relevant for your RPU?
Situation 3 Situation 3 Situation 3 Situation 3 Situation 3
At which situation would you place the incoming material control relevant for your RPU? Situation 3 Situation 3 Situation 3 Situation 4 Situation 3 At which situation would you place your packaging equipment relevant for your RPU? Situation 4 Situation 4 Situation 4 Situation 3 Situation 1 At which situation would you place the supplier control at your RPU? Situation 3 Situation 3 Situation 3 Situation 3 Situation 2 At which situation would you place the organic fertilizer program relevant for your RPU? Situation 3 Situation 3 Situation 2 Situation 3 Situation 3 At which situation would you place the pesticide program relevant for your RPU? Situation 4 Situation 3 Situation 4 Situation 3 Situation 3 At which situation would you place the water control relevant for your RPU? Situation 2 Situation 3 Situation 2 Situation 3 Situation 4 At which situation would you place the irrigation method relevant for your RPU? Situation 2 Situation 3 Situation 2 Situation 3 Situation 3
F. Assessment of intervention processes design At which situation would you place your partial physical intervention, relevant for your RPU?
Situation 1 Situation 3 Situation 1 Situation 3 Situation 4
G. Assessment monitoring system design At which situation would you place the analysis of CCP/CPs with respect to your RPU? Situation 3 Situation 3 Situation 2 Situation 3 Situation 3 At which situation would you place your standards and tolerances design with respect to your RPU?
Situation 3 Situation 3 Situation 2 Situation 3 Situation 4
At which situation would you place analytical methods to assess pathogens? Situation 1 Situation 3 Situation 1 Situation 4 Situation 4 At which situation would you place analytical methods to assess pesticides? Situation 4 Situation 4 Situation 4 Situation 4 Situation 4 At which situation would you place measuring equipment to monitor process/ product
status in your company/RPU? Situation 1 Situation 2 Situation 2 Situation 3 Situation 3
H. Assessment of operation of preventive measures, intervention process and monitoring
systems At which situation would you place sampling plan for microbial assessment? Situation 1 Situation 1 Situation 1 Situation 3 Situation 3 At which situation would you place sampling plan for pesticide assessment? Situation 1 Situation 4 Situation 1 Situation 4 Situation 3 At which situation would you place corrective actions? Situation 3 Situation 3 Situation 3 Situation 3 Situation 2 At which situation would you place actual availability of procedures* in your RPU? Situation 3 Situation 3 Situation 3 Situation 3 Situation 4 At which situation would you place the actual of compliance to procedures by agricultural workers in your RPU?
Situation 3 Situation 3 Situation 3 Situation 3 Situation 3
At which situation would you place actual hygienic performance of equipment and
facilities? Situation 3 Situation 3 Situation 3 Situation 3 Situation 3
At which situation would you place the actual storage/cooling capacity? Situation 1 Situation 4 Situation 1 Situation 4 Situation 4

109
FARM 1 FARM 2 FARM 3 FARM 4 FARM 5
PART III: Assessment core assurance activities I. Assessment of setting system requirements activities
At which situation would you place the actual process capability of partial physical
intervention? Situation 1 Situation 3 Situation 1 Situation 4 Situation 4
At which situation would you place the actual process capability of packaging processes? Situation 1 Situation 4 Situation 1 Situation 4 Situation 1 J. Assessment validation activities
At which situation would you place the actual performance of measuring equipment with respect to your RPU?
Situation 1 Situation 3 Situation 1 Situation 4 Situation 4
At which situation would you place the actual performance of analytical equipment (both microbiological and chemical) relevant for your RPU?
Situation 1 Situation 1 Situation 1 Situation 4 Situation 4
K. Assessment of verification activities At which situation would you place the translation of stakeholder requirements into own
HSMS requirements related to your RPU? Situation 4 Situation 2 Situation 4 Situation 4 Situation 3
At which situation would you place the systematic use of feedback information to modify
HSMS related to your RPU? Situation 4 Situation 2 Situation 4 Situation 4 Situation 4
L. Assessment of documentation and record-keeping to support food assurance At which situation would you place validation of preventive measures? Situation 3 Situation 2 Situation 3 Situation 3 Situation 4 At which situation would you place validation of intervention processes (partial physical intervention)?
Situation 1 Situation 2 Situation 1 Situation 4 Situation 4
PART IV: assessment of food safety performance M. EXTERNAL Food Safety Performance indicators
At which situation would you place validation of monitoring systems with respect to your RPU?
Situation 1 Situation 2 Situation 1 Situation 3 Situation 4
At which situation would you place verification of people related performance? Situation 2 Situation 1 Situation 2 Situation 3 Situation 4 At which situation would you place verification of equipment and methods related
performance? Situation 2 Situation 3 Situation 2 Situation 3 Situation 3
At which situation would you place documentation with respect to your company? Situation 3 Situation 3 Situation 3 Situation 3 Situation 3 At which situation would you place your record keeping system with respect to your company?
Situation 3 Situation 3 Situation 3 Situation 3 Situation 3
N. INTERNAL Food Safety Performance indicators How would you typify your Food Safety Management System evaluation? Situation 3 Situation 3 Situation 3 Situation 3 Situation 4 How would you indicate seriousness of remarks of the HSMS evaluation? Situation 4 Situation 3 Situation 4 Situation 3 Situation 4 How would you typify the hygiene related and microbiological food safety complaints of customers?
Situation 4 Situation 4 Situation 4 Situation 4 Situation 4
How would you typify the chemical safety complaints of customers? Situation 3 Situation 4 Situation 3 Situation 4 Situation 4 How would you typify the (visual) quality complaints by your customers? Situation 3 Situation 3 Situation 3 Situation 3 Situation 3 How would you typify your product sampling to confirm microbiological performance? Situation 1 Situation 3 Situation 1 Situation 2 Situation 4 Which judgment criteria are used to interpret microbiological results? Situation 1 Situation 2 Situation 1 Situation 3 Situation 4 How would you typify your product sampling to confirm use of pesticides? Situation 4 Situation 4 Situation 4 Situation 4 Situation 4 Which judgment criteria are used to interpret pesticide testing results? Situation 4 Situation 4 Situation 4 Situation 4 Situation 4 How would you typify your non-conformities? Situation 4 Situation 4 Situation 4 Situation 4 Situation 4

110