Surface crystallization and texture in cordierite …Surface crystallization and texture in...
13
Surface crystallization and texture in cordierite glasses N. Diaz-Mora a , E.D. Zanotto a, * , R. Hergt b , R. M uller c a Department of Materials Engineering – DEMa, Vitreous Materials Laboratory – LaMaV, Federal University of S~ ao Carlos – UFSCar, 13565-905 S~ ao Carlos – SP, Brazil b Institute for Physical High Technology – IPHT, P.O. Box 100 239, D-07702 Jena, Germany c Federal Institute for Materials Research and Testing, BAM Branch Adlershof, Rudower Chaussee 5, D-12489 Berlin, Germany Abstract Systematic work was carried out at 860°C T g 800°C on the crystal growth of a high-quartz solid solution phase (l-cordierite), which crystallizes on solid impurities on the surface and in the volume of the same cordierite glass sample. Crystal growth velocities were determined for three dierent growth fronts: (I) crystals that nucleated on solid inclusions existing in the glass interior and grew radially; (II) isolated crystals that nucleated on the external sample surfaces and grew with the fast axes parallel to the surface, and (III) crystals that nucleated on the external surfaces and grew towards the specimen center, spontaneously forming a textured surface layer. The crystal growth velocities of the three fronts were equal. We conclude, therefore, that the mechanisms of molecular transport at the crystal–liquid in- terface (or interfacial rearrangement) for crystal growth on the surface and in the interior of cordierite glass are similar. X-ray diraction investigations have shown that, in case (III), a fiber texture is spontaneously formed with preferential alignment of the c 0 -axis of the grains normal to the growth front. The texture dispersion angle decreases towards the interior of the glass, in accordance with evolutionary microstructural models. The apparent induction times 2h for growth of internally nucleated crystals, case (I), and 3h for the isolated surface crystals, case (II), indicate that dierent nucleation sites have caused heterogeneous nucleation on the surface and in the glass interior. The long in- duction time for growth of the textured surface layer 11 h is due to a succession of two dierent growth modes that form the texture in this glass. Ó 2000 Published by Elsevier Science B.V. All rights reserved. 1. Introduction and objectives Surface crystallization of glass is scientifically relevant and has a number of technological im- plications [1,2]. The crystal nucleation and growth kinetics of some of the crystalline phases that oc- cur on the surface of nearly stoichiometric cor- dierite glasses, 2MgO Æ 2Al 2 O 3 Æ 5SiO 2 , have been investigated recently [3–6]. This paper describes original research on the crystal growth behavior of a metastable high-quartz solid solution phase (‘l-cordierite’) that crystallizes from the surface and from impurities existing inside a cordierite glass, providing a unique opportunity to compare the growth kinetics of the same crystal phase on the surface and in the interior of the same parent glass. These findings allow us to verify whether the mo- lecular transport mechanism (or interfacial rear- rangements) controlling crystal growth in the glass interior is similar to those on the glass surface. Additionally, we perform a systematic study to test the possibility of texturing of the resulting microstructure (texture is defined as a deviation from the random orientation of an ensemble of Journal of Non-Crystalline Solids 273 (2000) 81–93 www.elsevier.com/locate/jnoncrysol * Corresponding author. Tel.: +55-16 271 4871; fax: +55-16 261 5404. E-mail address: [email protected] (E.D. Zanotto). 0022-3093/00/$ - see front matter Ó 2000 Published by Elsevier Science B.V. All rights reserved. PII: S 0 0 2 2 - 3 0 9 3 ( 0 0 ) 0 0 1 4 7 - 2
Transcript of Surface crystallization and texture in cordierite …Surface crystallization and texture in...

Surface crystallization and texture in cordierite glasses
N. Diaz-Mora a, E.D. Zanotto a,*, R. Hergt b, R. M�uller c
a Department of Materials Engineering ± DEMa, Vitreous Materials Laboratory ± LaMaV, Federal University of S~ao Carlos ± UFSCar,
13565-905 S~ao Carlos ± SP, Brazilb Institute for Physical High Technology ± IPHT, P.O. Box 100 239, D-07702 Jena, Germany
c Federal Institute for Materials Research and Testing, BAM Branch Adlershof, Rudower Chaussee 5, D-12489 Berlin, Germany
Abstract
Systematic work was carried out at 860°C �Tg � 800°C� on the crystal growth of a high-quartz solid solution phase
(l-cordierite), which crystallizes on solid impurities on the surface and in the volume of the same cordierite glass
sample. Crystal growth velocities were determined for three di�erent growth fronts: (I) crystals that nucleated on solid
inclusions existing in the glass interior and grew radially; (II) isolated crystals that nucleated on the external sample
surfaces and grew with the fast axes parallel to the surface, and (III) crystals that nucleated on the external surfaces and
grew towards the specimen center, spontaneously forming a textured surface layer. The crystal growth velocities of the
three fronts were equal. We conclude, therefore, that the mechanisms of molecular transport at the crystal±liquid in-
terface (or interfacial rearrangement) for crystal growth on the surface and in the interior of cordierite glass are similar.
X-ray di�raction investigations have shown that, in case (III), a ®ber texture is spontaneously formed with preferential
alignment of the c0-axis of the grains normal to the growth front. The texture dispersion angle decreases towards the
interior of the glass, in accordance with evolutionary microstructural models. The apparent induction times ��2 h� for
growth of internally nucleated crystals, case (I), and ��3 h� for the isolated surface crystals, case (II), indicate that
di�erent nucleation sites have caused heterogeneous nucleation on the surface and in the glass interior. The long in-
duction time for growth of the textured surface layer ��11 h� is due to a succession of two di�erent growth modes that
form the texture in this glass. Ó 2000 Published by Elsevier Science B.V. All rights reserved.
1. Introduction and objectives
Surface crystallization of glass is scienti®callyrelevant and has a number of technological im-plications [1,2]. The crystal nucleation and growthkinetics of some of the crystalline phases that oc-cur on the surface of nearly stoichiometric cor-dierite glasses, 2MgO á 2Al2O3 á 5SiO2, have beeninvestigated recently [3±6]. This paper describesoriginal research on the crystal growth behavior
of a metastable high-quartz solid solution phase(`l-cordierite') that crystallizes from the surfaceand from impurities existing inside a cordieriteglass, providing a unique opportunity to comparethe growth kinetics of the same crystal phase on thesurface and in the interior of the same parent glass.These ®ndings allow us to verify whether the mo-lecular transport mechanism (or interfacial rear-rangements) controlling crystal growth in the glassinterior is similar to those on the glass surface.
Additionally, we perform a systematic study totest the possibility of texturing of the resultingmicrostructure (texture is de®ned as a deviationfrom the random orientation of an ensemble of
Journal of Non-Crystalline Solids 273 (2000) 81±93
www.elsevier.com/locate/jnoncrysol
* Corresponding author. Tel.: +55-16 271 4871; fax: +55-16
261 5404.
E-mail address: [email protected] (E.D. Zanotto).
0022-3093/00/$ - see front matter Ó 2000 Published by Elsevier Science B.V. All rights reserved.
PII: S 0 0 2 2 - 3 0 9 3 ( 0 0 ) 0 0 1 4 7 - 2

crystallites). In the often-occurring case of ®bertexture, there is a tendency for the grains to alignparallel to a particular crystallographic axis. Mostof the properties of crystalline materials of tech-nical interest, such as mechanical, electrical, mag-netic or thermal properties, are strongly in¯uencedby texture-related anisotropy. Additionally, severalprocesses of phase formation, such as solid-stateprocesses of plastic deformation and recrystalli-zation, are accompanied by texture generation [7].One of the most successful methods to obtain ade®ned crystallographic orientation in glass-ceramics is solid-state epitaxy. Headley andLoehman [8], for instance, demonstrated that aLi2O±Al2O3±SiO2±P2O5 glass-ceramic crystallizesby epitaxial growth in the glass volume, while Liuet al. [9] and Selvaraj et al. [10] investigated therole of epitaxy on the crystallization of albite glass,NaAlSi3O8. Glass-ceramics with oriented crystalscan also be formed by extruding glasses [11±13].Oriented Li2O á 2SiO2 glass-ceramics in a temper-ature gradient and crystallization of glass ®berswere produced by Engel and Frischat [14].
It is also known that spontaneous preferentialgrowth from the external glass surfaces may occurin certain situations, leading to textured micro-structures and yielding properties that are peculiarto some glass-ceramics. For example, texturedLi2O á 2SiO2 glass-ceramics present interesting py-roelectric properties [15]. However, there is apaucity of information on spontaneous preferredorientation of crystals formed by devitri®cation.Thus, another goal of this research is to investigatethe possible spontaneous orientation of the crys-tallized layer to aid in the interpretation of thecrystal growth behavior of the distinct growthfronts in cordierite glass.
Finally, we present and discuss a peculiar aspectof the behavior of the induction times for crystalgrowth of the di�erent fronts focused on in thisstudy.
2. Materials and methods
The cordierite glass, code GM30870, used inthis study was supplied by Schott Glaswerke. Itsanalyzed composition was 52.3 wt% SiO2, 33.2
wt% Al2O3, 14.6 wt% MgO, which di�ered a littlefrom the stoichiometric composition (51.3 wt%SiO2, 35.0 wt% Al2O3, 13.7 wt% MgO). Addi-tionally, some measurements were made of a glasshaving an almost stoichiometric composition thatdeviates less than 0.5% from the ideal compositionfor each component.
The specimens were ground with SiC waterslurries on plane brass tools and polished to opti-cal grade with a CeO2 slurry (to determine thecrystal growth rate) or CeO2 and diamond paste(for texture measurements). The polished sampleswere heat-treated in air in an electric furnace witha temperature stability of �2°C. The treatmenttemperature was 860°C �Tg � 800°C� with timeperiods of up to 80 h. To examine the texture ofthe crystalline surface layer, some samples wereground with SiC and polished with CeO2 beforethermal treatments at 860°C and 910°C. Thetreated samples were cut, polished and then etchedwith a 1 vol.% HF solution and examined with ascanning electron microscope (SEM). Samplestreated at 910°C for 3 h were broken and viewedsideways in the SEM.
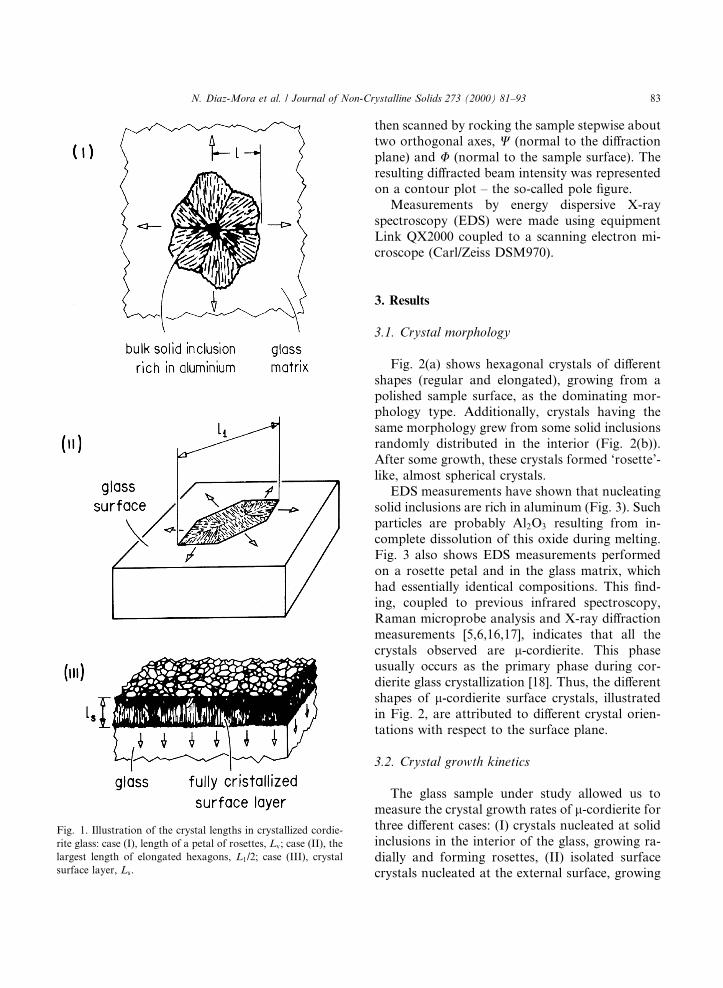
The heat-treated samples were observed in anoptical microscope (Jenapol Carl Zeiss/Jena), us-ing polarized transmitted light. In every case, a1:0.01 mm scale was photographed under identicalexperimental conditions. To describe the crystalgrowth of the internal crystals, the length of onecrystal (the largest found), Lv, was followedthroughout the series of cumulative thermaltreatments (I). For the isolated surface crystals,one-half of the maximum length, L1, of the largestcrystal found in a given set of micrographs waschosen for each measurement (II). Finally, thethickness of the compact crystalline surface layer,Ls, was measured (III). The crystal dimensionsindicated in Fig. 1 were measured with an accuracyof �1 lm.
The preferential orientation of the crystalliteson the surface and the change in texture degreewithin the crystallized surface layer were investi-gated by X-ray di�raction, using Cu-Ka radiationon a XÕPert (Philips) di�ractometer equipped withan Euler cradle. To take a pole ®gure, the detectorwas ®xed at the Bragg angle of a special set ofplanes to be investigated. The di�raction space was
82 N. Diaz-Mora et al. / Journal of Non-Crystalline Solids 273 (2000) 81±93
then scanned by rocking the sample stepwise abouttwo orthogonal axes, W (normal to the di�ractionplane) and U (normal to the sample surface). Theresulting di�racted beam intensity was representedon a contour plot ± the so-called pole ®gure.
Measurements by energy dispersive X-rayspectroscopy (EDS) were made using equipmentLink QX2000 coupled to a scanning electron mi-croscope (Carl/Zeiss DSM970).
3. Results
3.1. Crystal morphology
Fig. 2(a) shows hexagonal crystals of di�erentshapes (regular and elongated), growing from apolished sample surface, as the dominating mor-phology type. Additionally, crystals having thesame morphology grew from some solid inclusionsrandomly distributed in the interior (Fig. 2(b)).After some growth, these crystals formed `rosette'-like, almost spherical crystals.
EDS measurements have shown that nucleatingsolid inclusions are rich in aluminum (Fig. 3). Suchparticles are probably Al2O3 resulting from in-complete dissolution of this oxide during melting.Fig. 3 also shows EDS measurements performedon a rosette petal and in the glass matrix, whichhad essentially identical compositions. This ®nd-ing, coupled to previous infrared spectroscopy,Raman microprobe analysis and X-ray di�ractionmeasurements [5,6,16,17], indicates that all thecrystals observed are l-cordierite. This phaseusually occurs as the primary phase during cor-dierite glass crystallization [18]. Thus, the di�erentshapes of l-cordierite surface crystals, illustratedin Fig. 2, are attributed to di�erent crystal orien-tations with respect to the surface plane.
3.2. Crystal growth kinetics
The glass sample under study allowed us tomeasure the crystal growth rates of l-cordierite forthree di�erent cases: (I) crystals nucleated at solidinclusions in the interior of the glass, growing ra-dially and forming rosettes, (II) isolated surfacecrystals nucleated at the external surface, growing
Fig. 1. Illustration of the crystal lengths in crystallized cordie-
rite glass: case (I), length of a petal of rosettes, Lv; case (II), the
largest length of elongated hexagons, L1/2; case (III), crystal
surface layer, Ls.
N. Diaz-Mora et al. / Journal of Non-Crystalline Solids 273 (2000) 81±93 83

parallel to the surface, and (III) a compact crys-talline surface layer growing into the interior (seeFig. 1). Crystal size data are given in Fig. 4, wherethe largest radius of the rosettes, Lv (�, case I), thehalf-length (major axis) of the largest crystal onthe glass surface, L1 (�, case II), and the surfacelayer thickness, Ls (M, case III) are shown. Thecorresponding crystal growth velocities, U (�standard error) and induction periods obtained bya least-squares ®t, are shown in Table 1.
In these three cases, the crystal growth velocitieswere equal within the error limits. The average,
3� 10ÿ10 m/s (0:018 lm=min or 1.08 lm/h),agrees with previous data for the growth velocityof l-cordierite ��0:02 lm/min) at the same tem-perature in the stoichiometric glass [19].
Fig. 4 also shows intercepts on the time axis,indicating the existence of apparent `inductionperiods' for crystal growth in the GM 30870sample. There is an intriguing di�erence betweenthese induction periods: sAI � 1:7 h, sAII � 2:9 h,and sAIII � 11 h.
Fig. 5 shows a similar situation for the stoi-chiometric glass at T � 980°C. The growth rate of
Fig. 2. Typical optical micrographs (polarized transmitted light) of some morphologies observed in GM30870 cordierite glass samples:
(a) regular and elongated hexagons on the glass surface ( � 20 lm�. Thermal treatments at 890°C for 1 h 15 min and at 925°C for
15 min; (b) rosettes in the interior of the glass after thermal treatment at 910°C for 3 h ( � 50 lm�. Almost all crystals have a solid
inclusion in their center.
84 N. Diaz-Mora et al. / Journal of Non-Crystalline Solids 273 (2000) 81±93

the crystallized surface layer from a SiC-groundsurface is compared to that of a fractured surface.The crystal growth rate is about 7:8� 10ÿ7 m=s(that is 1:3 lm=min or 78 lm=h� in both cases.However, while s is almost zero for the groundsurface, s �2 h for the fractured surface.
3.3. Texture of the crystalline surface layer
3.3.1. Isolated surface crystalsTop-view observation of isolated surface crys-
tals by transmitted light microscopy indicates thatthe apparent crystal shapes consist only of regularor elongated hexagons and, therefore, crystal ori-entation is not random. The ratio of the numbersof elongated to regular hexagons, e/r, increaseswith increasing annealing temperature, e.g.,e=r � 0:1 (870°C, 3.5 h, L1 �3 lm�, e=r � 1:0(950°C, 0.5 h in vacuum, L1 �40 lm), and
Fig. 3. EDS of: (a) solid inclusions in the interior of the GM30870 cordierite glass; (b) a petal of a rosette and (c) the glass matrix.
Fig. 4. Time dependence of crystal growth in GM30870 cor-
dierite glass samples treated at 860°C: �, largest length of in-
ternally growing rosette-like crystals (case I); �, largest
hexagonal crystals on the surface (case II, L1/2); M, thickness of
the surface layer. The error bars are about equal to the symbol
sizes.
N. Diaz-Mora et al. / Journal of Non-Crystalline Solids 273 (2000) 81±93 85

e=r � 1:8 (950°C, 40 min, L1 �40 lm). Largecrystals �L1 > 50 lm�, growing from fractured orpolished sample surfaces with low-density of nu-cleation sites �Ns < 10ÿ6 lmÿ2�, have an elongatedshape in almost every case. Optical interferencesurface scans of polished and then thermallytreated sample surfaces indicate that this orienta-tion might be caused by surface tension phenom-ena [20]. As illustrated in Fig. 6(a), the regularhexagons were drawn into the sample interior,causing local depressions of the glass surface (upto 40 nm), while most elongated crystals stand out(up to 60 nm). These e�ects show that crystalorientation can change during crystal growth, de-pending on the crystal/melt interfacial energies fordi�erent crystal faces. As the crystal growth in thisstudy took place well above Tg, the viscosity (109:9
Pa s) was small enough to allow the crystal ori-entation to change with time. This observation iscon®rmed by the smooth, wavy pro®le of glasssurfaces after crystallization treatments. Thisprocess should a�ect the ratio of regular to elon-
gated crystals for surfaces having di�erent nucle-ation site densities.
X-ray di�raction patterns �h=2h scans) of as-annealed glass surfaces are shown in Fig. 7. Theglass specimens were partly devitri®ed by anneal-ing at 860°C for 80 h (�75 lm thick layer). Thesamples di�er in their pre-annealing treatment.Sample (a) was diamond-polished while sample (b)was polished with cerium oxide. A comparison ofexperimental di�raction patterns with ICDDstandard ®les show that the only crystalline phaseappearing after annealing diamond-polished sam-ples (Fig. 7(a)) is l-cordierite. The di�raction lineintensities shown in Fig. 7 deviate slightly from thetypical intensities for a random grain distribution(ICDD database). Hence, due to the X-ray pene-tration into the sample, this result does not con-®rm the preferential orientation of the outersurface layer. In the case of the CeO2-polishedsurface (Fig. 7(b)), an additional phase (`x-phase' ) 2h � 12:46° and 25.02°) appears. Pole®gures taken with the di�raction line at 12.46°show that this second phase is also textured.
3.3.2. Impingement of surface crystals and furthergrowth
During prolonged growth �t > s� of the isolatedsurface crystals, a compact layer is formed and thedegree of crystal orientation increases due to im-pingement of non-perpendicular crystals and thesurvival of perpendicular growing crystals [5±7,21]. A typical micrograph is shown in Fig. 8(a).A tendency for crystal alignment near the interfaceis observed. Fig. 8(b) shows a sample from whichthe crystallized surface layer was partly removedby grinding and polishing. The residual glass ma-trix can be observed in some regions, but the tex-ture is evident by visual inspection.
To investigate the dependence of texture for-mation on the depth, z, towards the interior, we
Fig. 5. Thickness of the compact l-cordierite surface layer in
stoichiometric glass as a function of time for T � 980°C. ,
SiC-ground glass surface, r, fractured glass surface. The error
bars are smaller than the symbol sizes.
Table 1
Crystal growth velocities and induction periods of l-cordierite in GM 30870 glass at 860°C taken from Fig. 4
Growth front Crystal growth velocity (m/s) s (h)
(I) Rosettes in the bulk Uv � �3:2� 0:2� � 10ÿ10 1.7 � 0.2
(II) Elongated hexagons on the surface U1 � �2:9� 0:2� � 10ÿ10 2.9 � 0.2
(III) Crystallized surface layer Us � �3:1� 0:1� � 10ÿ10 12 � 1
86 N. Diaz-Mora et al. / Journal of Non-Crystalline Solids 273 (2000) 81±93

removed several layers in steps of about 10 lm,followed by (pole-®gure) X-ray di�raction mea-surements. Grinding with SiC and subsequentlypolishing with diamond paste led to repeatedthinning of the surface layer. The removal of a10 lm thick layer revealed an appreciable increaseof the texture. Only a few lines remained in thedi�raction pattern, as can be seen by comparingFig. 9 with Fig. 7. Re¯ections from prism planesare absent.
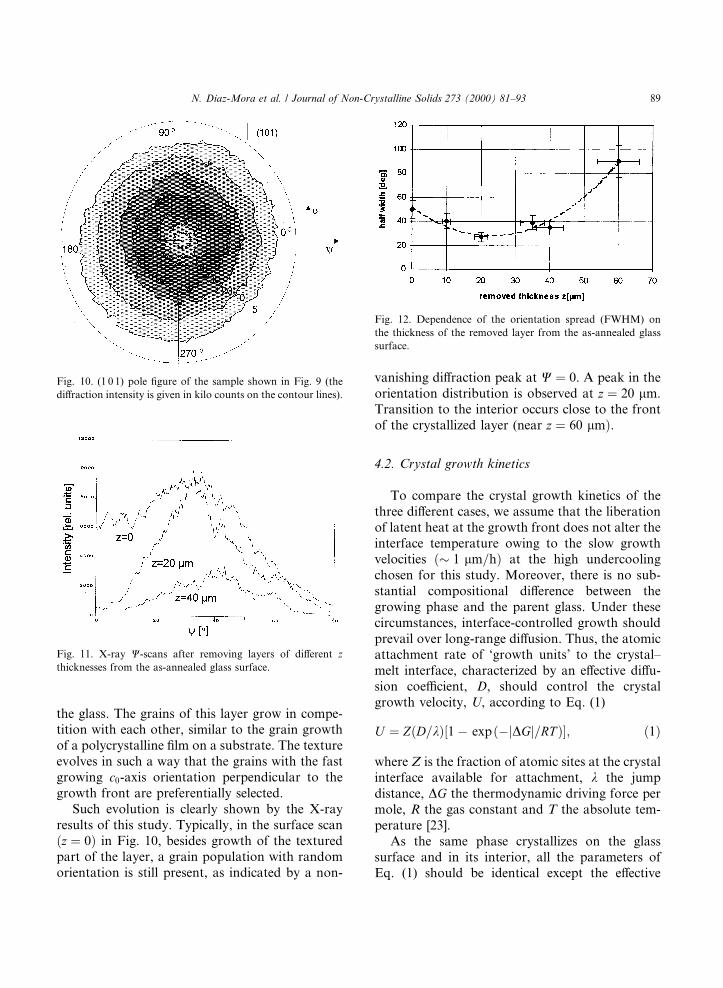
To examine the texture in more detail, pole-®gures were taken with the (1 0 1) re¯ection, theresults of which are shown in Fig. 10. In this ®gure,the intensity of the (1 0 1) re¯ection is shown bydi�erent gray areas (range of kilo counts) as a
function of U 1 and W. Fig. 10 shows a ring-shapedmaximum of the (1 0 1) intensity. No e�ect of W isevident, con®rming the observation that the elon-gated hexagons are preferentially oriented (withtheir a0-axis) in top view micrographs. However,with respect to W, a broad maximum of the (1 0 1)intensity is evident at 30° (see also Fig. 11, e.g., forz � 20 lm). This maximum indicates the preferred
Fig. 6. (a) Surface pro®le map obtained by an optical interference microscope. Stoichiometric cordierite glass surface polished and
then annealed at 950°C for 1 h, taken from [20]. (b) Transmitted light top-view micrograph showing the same sample region. The arrow
marks a dust particle appearing as a sharp peak in the surface pro®le (a).
1 U gives the rotation angle of an ideal perpendicular surface
crystal around its c-axis. The latter axis stands out on the paper
plane in Fig. 10. W gives the tipping angle of the c-axis of that
perpendicular crystal against the X-ray re¯ection plane. Wranges from zero, at the center of the pole ®gure, to 90°, the
outer circle.
N. Diaz-Mora et al. / Journal of Non-Crystalline Solids 273 (2000) 81±93 87

orientation of hexagonal c0-axes normal to thegrowth front of the crystallizing surface layer.However, there is an angular spread of grain axesof about 30° deriving from the half-width of thering in Fig. 10.
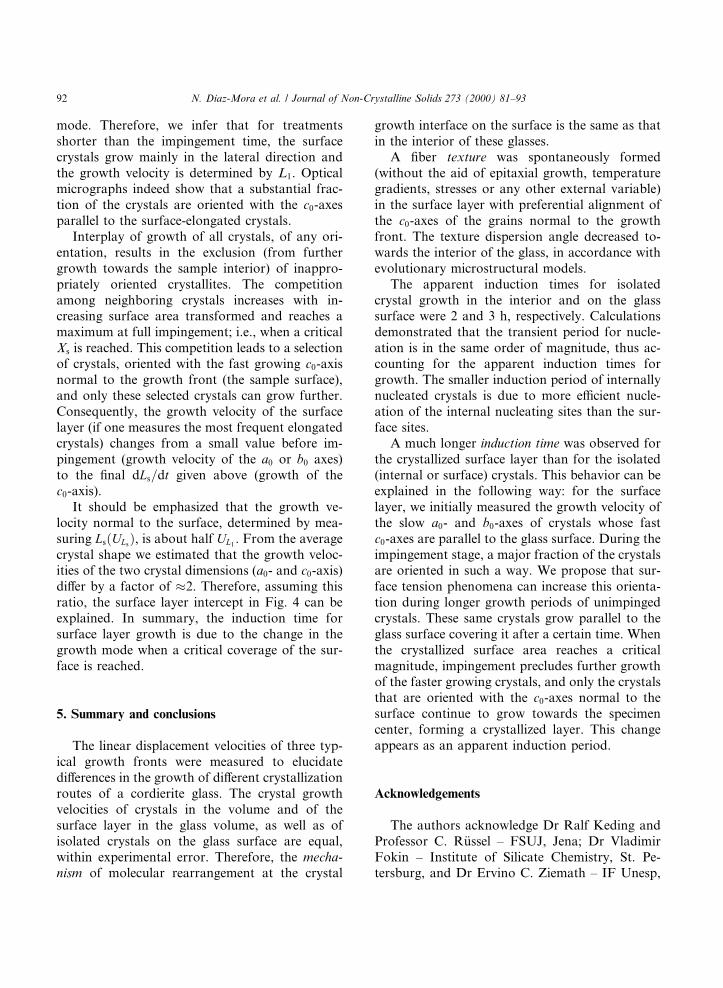
The texture of the initial surface crystal layer�z � 0� and after the removal of 20 and 40 lm iscompared by W-scans in Fig. 11. The angularwidth at half maximum intensity (after correctionfor background) is taken as a measure of texturespread and is plotted in Fig. 12, as a function ofthe depth of the removed layer. We observe thatthe texture improves with increasing depth into thesurface layer down to a critical depth, after whichit deteriorates until the bulk glass is met. Obvi-ously, the texture develops during grain growthtowards the sampleÕs interior.
4. Discussion
4.1. Texture formation on surface crystallization
It is well known from various ®lm depositionstudies that texture develops during growth ofgranular ®lms (e.g., [21,22]). The underlyingmechanism, often called `survival of the fastest',may be related to several evolutionary processes[21,22]. In the present case, a plane crystallizationfront of many crystalline grains moves inward in
Fig. 8. SEM Micrographs of the GM30870 cordierite glass
treated at 910°C for 3 h, etched with an HF 1 vol. solution: (a)
pro®le view of crystallized surface; (b) top view of a partially
removed surface layer. An internal crystal grown on a solid
inclusion is shown in the center.
Fig. 9. X-ray di�raction pattern of the sample shown in
Fig. 8(a) after removing a 10 lm thick layer.
Fig. 7. X-ray di�raction pattern of the GM30870 cordierite
glass sample, polished with (A) diamond and (B) cerium oxide,
and treated at 860°C for 80 h.
88 N. Diaz-Mora et al. / Journal of Non-Crystalline Solids 273 (2000) 81±93
the glass. The grains of this layer grow in compe-tition with each other, similar to the grain growthof a polycrystalline ®lm on a substrate. The textureevolves in such a way that the grains with the fastgrowing c0-axis orientation perpendicular to thegrowth front are preferentially selected.
Such evolution is clearly shown by the X-rayresults of this study. Typically, in the surface scan�z � 0� in Fig. 10, besides growth of the texturedpart of the layer, a grain population with randomorientation is still present, as indicated by a non-
vanishing di�raction peak at W � 0. A peak in theorientation distribution is observed at z � 20 lm.Transition to the interior occurs close to the frontof the crystallized layer (near z � 60 lm�.
4.2. Crystal growth kinetics
To compare the crystal growth kinetics of thethree di�erent cases, we assume that the liberationof latent heat at the growth front does not alter theinterface temperature owing to the slow growthvelocities �� 1 lm=h� at the high undercoolingchosen for this study. Moreover, there is no sub-stantial compositional di�erence between thegrowing phase and the parent glass. Under thesecircumstances, interface-controlled growth shouldprevail over long-range di�usion. Thus, the atomicattachment rate of `growth units' to the crystal±melt interface, characterized by an e�ective di�u-sion coe�cient, D, should control the crystalgrowth velocity, U, according to Eq. (1)
U � Z�D=k��1ÿ exp�ÿjDGj=RT ��; �1�
where Z is the fraction of atomic sites at the crystalinterface available for attachment, k the jumpdistance, DG the thermodynamic driving force permole, R the gas constant and T the absolute tem-perature [23].
As the same phase crystallizes on the glasssurface and in its interior, all the parameters ofEq. (1) should be identical except the e�ective
Fig. 12. Dependence of the orientation spread (FWHM) on
the thickness of the removed layer from the as-annealed glass
surface.
Fig. 11. X-ray W-scans after removing layers of di�erent z
thicknesses from the as-annealed glass surface.
Fig. 10. (1 0 1) pole ®gure of the sample shown in Fig. 9 (the
di�raction intensity is given in kilo counts on the contour lines).
N. Diaz-Mora et al. / Journal of Non-Crystalline Solids 273 (2000) 81±93 89

di�usion coe�cient, which could vary from surfaceto bulk di�usion. In principle, we expect thatsurface transport controls crystal growth in situa-tion (II), where the isolated crystals grow with thefast axis parallel to the surface, while bulk di�u-sion controls growth in situations (I) and (III).
It is well known that surface di�usion is fasterthan bulk di�usion in a variety of materials; thus,the growth rate could be expected to be largest insituation (II). However, the deviation of near-surface properties (e.g., composition) are known tobe restricted to a layer of the order of nanometers,e.g., [24]. Thus, the growth of any crystal of a sizedetectable by optical microscopy should be deter-mined by the bulk properties. This prediction iscon®rmed by the similar growth rates obtainedfrom Fig. 4.
Growth velocity generally depends on thecrystallographic direction of a crystal. However, asshown in the previous section, in all three caseschosen for the present study ± (I) the fastestgrowing crystal within a rosette-like aggregatearound inclusions in the glass interior, (II) thefastest elongated hexagon selected by the humanoperator, or (III) the fastest growing crystalswithin the surface layer, spontaneously selected byimpingement phenomena ± the crystal growth ratedata refer to the same crystal face and orientationand, therefore, their kinetics can be compared.
Three (apparent) induction times for crystalgrowth at 860°C, sA, are shown in Fig. 4: sAI � 2 h(rosette-like crystals in the glass interior),sAII � 3 h (isolated crystals at the surface), andsAIII � 11 h (compact crystal surface layer). Gen-erally, several time-lag e�ects can contribute to sA
sA � sb � sg � ss; �2�
sb is the time required to form a detectable numberof critical nuclei, sg the time necessary for a criticalnucleus to achieve (almost) constant growth ve-locity [25] and ss is the time required for the sur-face layer to reach steady-state growth conditions(e.g., to form a continuous layer having a texture).The time required for a growing crystal (having aconstant growth velocity) to reach a detectable sizedoes not in¯uence the extrapolated intercept of thelinear L�t� plot to t � 0.
4.3. Time lag for nucleation, sb
Crystal growth should start immediately afterthe ®rst ± or at least a detectable number of ±critical nuclei are formed, even before steady-statenucleation is established. However, this time, sb, isnot known. Hence, to a ®rst approximation wecould replace sb by its upper bound s; �s > sb�,where s gives the induction period for nucleation. scan be approximated by [26]
s � k5rN 2Ag=ZDl2; �3�
where k is the intermolecular distance, r the nu-cleus/liquid interfacial energy, NA the Avogadronumber, g the viscosity, Z < 1 the steric factor andDl is the thermodynamic driving force for crys-tallization.
Eq. (3) gives s � 1 s for T � 860°C and Z � 1 ifone uses typical physical parameters for stoichio-metric cordierite glass [27] (k � 2� 10ÿ10 m,r � 0:193 J=m2, g�860°C� � 1010 Pa s, Dl�860°C�� 21 kJ=mol). This s is negligible. However, thetime lag of nucleation calculated from the sizedistribution of l-cordierite crystals in [19,28]shows that Z � 10ÿ4 �s � 3 h� must be used toachieve the best ®t of the experimental time-lagdata. In an independent study, Z � 10ÿ4 andZ � 10ÿ2 were reported for the nucleation ofLi2O á 2SiO2 crystals in lithium aluminosilicate andLi2O á 2SiO2 melts, respectively [26]. This estimatethus shows that s has the same order of magnitude�� 2±5 h� and covers the intercepts in Fig. 4 forcase (I) and (II). The smaller s observed for thegrowth of internally nucleated crystals (rosettes,case (I)) may be caused by a greater nucleatione�ciency of the internal solid particles. In thiscase, s would be reduced to s� � sW1=2 [23], wheres is the homogeneous nucleation time lag, s� is thetime lag for heterogeneous nucleation and U is thesubstrate activity.
4.4. Time lag for constant crystal growth, sg
Despite the observed linear growth of largecrystals shown in Fig. 4, a non-linear growth is tobe expected for small (critical size) crystals. Thus,a certain period of time, sg, is required to attain an
90 N. Diaz-Mora et al. / Journal of Non-Crystalline Solids 273 (2000) 81±93

(almost) constant crystal growth velocity. Assum-ing the continuous ballistic model for nucleigrowth, which predicts a size-dependent growthvelocity, Weinberg [25] demonstrated that crystalsize is not a simple linear function of time. Instead,Eq. (4) gives an approximation
R�t� � Ut ÿ r� ln�W �=kT � ÿ r� ln�t=s�; �4�where U is the experimental crystal growth veloc-ity normally observed from optical microscopy,W� the free energy barrier to form a critical nu-cleus, r� its size and s is the transient time of nu-cleation.
To estimate the e�ect of size-dependent growth,Eq. (4) was used with real parameters for thestoichiometric cordierite glass (r� � 2� 10ÿ9 m,W � � 3:2� 10ÿ18 J, s � 105 s) calculated fromcalorimetric [27] and crystal size distributionmeasurements [19]. Additional calculations weremade for 800°C, 900°C, and 950°C using s � 105 sand s � 1 s (see Eq. (3) for s). However, no de-tectable time lag for growth could be found in anyof the cases. To obtain a detectable time lag, anunrealistically large r� must be assumed (for in-stance r� >� 100 nm). Thus, for the present case,the e�ect of size-dependent growth phenomenacan be reasonably excluded and sg can beneglected.
According to [25], sg should be negligible forW �=kT > 200. Indeed, for cordierite glass at 860°C,using W �=kT � 16pa3DHf T 2
f =3�Tf ÿ T �2:NA, witha � 0:5, DHf � 180 kJ=mol; Tf � 1623 K, one hasW �=kT � 440. Using lower bound for theseparameters yields W �=kT � 220. Therefore, thesecalculations con®rm the previous estimates of sg.
4.5. Time lag for continuous surface layer growth, ss
It is known, from previous studies [29], that thenucleation density for the polished glass surfacesunder study is about �10ÿ3 lmÿ2 (e.g., Ns �3� 10ÿ3 lmÿ2 is obtained from Fig. 2(a)). Thus,the mean next neighbor distance of surface crystals�2l � Nÿ1=2
s � is about 20 lm. Using the experi-mental crystal growth velocity (�1 lm/h at860°C), neighbor crystals will impinge after about10 h. This impingement time is close to the
observed time lag of the linear surface layergrowth, ss �11 h (Fig. 4).
The measured nucleation densities, Ns, of frac-tured surfaces have a great deal of scatter, between10ÿ3 and 10ÿ8 lmÿ2 [29]. Assuming an intermedi-ate Ns �10ÿ5 lmÿ2 (the corresponding next-neighbor distance of surface crystals of about300 lm) and the experimental growth rate (78 lm/h at 980°C), the time for crystal impingement isabout 2 h. This time is close to the time lag of layergrowth for the fractured surface, ss (Fig. 5).
In another (endorsing) experiment, the crystal-lized surface fraction, Xs, was measured immedi-ately following the apparent induction time for thesurface layer growth at 860°C and 910°C (Table 2)for unpolished, as-received, glass surfaces. Xs�ss�was about 0.5 in both cases. Since our previousspecimens (for which the crystal growth kineticswere determined) were polished by CeO2, thefractional area crystallized for unpolished samplesmay be somewhat di�erent, owing to a di�erentnumber of nucleation sites on the surface [1±5,29].However, an estimate of the crystallized surfacearea of the CeO2 polished surfaces, using theJonhson±Mehl±Avrami±Kolmogorov (JMAK)theory and the experimental Ns and U, indicatethat 0:3 < Xs < 0:7. In addition, the fact that wecould not continue to measure the growth velocityof the isolated crystals after 11 h of treatment re-inforces this (impingement) argument.
Despite uncertainty regarding the precise crys-tallized surface areas, after a certain critical frac-tion of the surface is covered by crystals,impingement triggers a change in the growth
Table 2
Apparent induction times for growth of the crystallized layer
towards the interior of GM 30870 glass, ss, and crystallized
fractional surface area, Xs, at the time t � ss for various
temperatures
T (°C) ss (h) Xs�ss�860 11 � 1 0.5 � 0.1
880a 4.2 0.3 ) 0.7a
900a 1.8 0.3 ) 0.7a
910 1.3 � 0.3 0.5 � 0.1
920 �0 0.0
a Estimated by the JMAK equation.
N. Diaz-Mora et al. / Journal of Non-Crystalline Solids 273 (2000) 81±93 91
mode. Therefore, we infer that for treatmentsshorter than the impingement time, the surfacecrystals grow mainly in the lateral direction andthe growth velocity is determined by L1. Opticalmicrographs indeed show that a substantial frac-tion of the crystals are oriented with the c0-axesparallel to the surface-elongated crystals.
Interplay of growth of all crystals, of any ori-entation, results in the exclusion (from furthergrowth towards the sample interior) of inappro-priately oriented crystallites. The competitionamong neighboring crystals increases with in-creasing surface area transformed and reaches amaximum at full impingement; i.e., when a criticalXs is reached. This competition leads to a selectionof crystals, oriented with the fast growing c0-axisnormal to the growth front (the sample surface),and only these selected crystals can grow further.Consequently, the growth velocity of the surfacelayer (if one measures the most frequent elongatedcrystals) changes from a small value before im-pingement (growth velocity of the a0 or b0 axes)to the ®nal dLs=dt given above (growth of thec0-axis).
It should be emphasized that the growth ve-locity normal to the surface, determined by mea-suring Ls�ULs
�, is about half UL1. From the average
crystal shape we estimated that the growth veloc-ities of the two crystal dimensions (a0- and c0-axis)di�er by a factor of �2. Therefore, assuming thisratio, the surface layer intercept in Fig. 4 can beexplained. In summary, the induction time forsurface layer growth is due to the change in thegrowth mode when a critical coverage of the sur-face is reached.
5. Summary and conclusions
The linear displacement velocities of three typ-ical growth fronts were measured to elucidatedi�erences in the growth of di�erent crystallizationroutes of a cordierite glass. The crystal growthvelocities of crystals in the volume and of thesurface layer in the glass volume, as well as ofisolated crystals on the glass surface are equal,within experimental error. Therefore, the mecha-nism of molecular rearrangement at the crystal
growth interface on the surface is the same as thatin the interior of these glasses.
A ®ber texture was spontaneously formed(without the aid of epitaxial growth, temperaturegradients, stresses or any other external variable)in the surface layer with preferential alignment ofthe c0-axes of the grains normal to the growthfront. The texture dispersion angle decreased to-wards the interior of the glass, in accordance withevolutionary microstructural models.
The apparent induction times for isolatedcrystal growth in the interior and on the glasssurface were 2 and 3 h, respectively. Calculationsdemonstrated that the transient period for nucle-ation is in the same order of magnitude, thus ac-counting for the apparent induction times forgrowth. The smaller induction period of internallynucleated crystals is due to more e�cient nucle-ation of the internal nucleating sites than the sur-face sites.
A much longer induction time was observed forthe crystallized surface layer than for the isolated(internal or surface) crystals. This behavior can beexplained in the following way: for the surfacelayer, we initially measured the growth velocity ofthe slow a0- and b0-axes of crystals whose fastc0-axes are parallel to the glass surface. During theimpingement stage, a major fraction of the crystalsare oriented in such a way. We propose that sur-face tension phenomena can increase this orienta-tion during longer growth periods of unimpingedcrystals. These same crystals grow parallel to theglass surface covering it after a certain time. Whenthe crystallized surface area reaches a criticalmagnitude, impingement precludes further growthof the faster growing crystals, and only the crystalsthat are oriented with the c0-axes normal to thesurface continue to grow towards the specimencenter, forming a crystallized layer. This changeappears as an apparent induction period.
Acknowledgements
The authors acknowledge Dr Ralf Keding andProfessor C. R�ussel ± FSUJ, Jena; Dr VladimirFokin ± Institute of Silicate Chemistry, St. Pe-tersburg, and Dr Ervino C. Ziemath ± IF Unesp,
92 N. Diaz-Mora et al. / Journal of Non-Crystalline Solids 273 (2000) 81±93

Rio Claro, for useful suggestions and criticalcomments. The investigation presented here is partof a cooperative e�ort of the Technical Committee7 of the ICG to advance the understanding ofsurface crystallization of glass. We also expressour appreciation of the ®nancial support of CNPq(Grant No. 521603/94-3), DAAD/CAPES Probral025/96), PRONEX (76.97.1018.00) and Fapesp(99/0871-2).
References
[1] E.D. Zanotto, Ceram. Trans. 30 (1993) 65.
[2] E.D. Zanotto, J. Non-Cryst. Solids 129 (1991) 183.
[3] K. Heide, G. V�olksch, C.H.R. Hanay, in: Proceedings of
the 16th International Congress on Glass, Madrid, Boletin
de la Sociedad Espanola de Cer�amica y Vidrio 5, 1992, p.
111.
[4] N.S. Yuritsin, V.M. Fokin, A.M. Kalinina, V.M. Filipo-
vich, Ceram. Trans. 30 (1993) 379.
[5] N. Diaz-Mora, PhD thesis, Universidade Federal de S~ao
Carlos, S~ao Carlos, SP, Brazil, 1994 (in Portuguese).
[6] E.C. Ziemath, N. Diaz-Mora, E.D. Zanotto, Phys. Chem.
Glasses 38 (1997) 1.
[7] H.J. Bunge, K.H. Punch, Z. Metallkd. 75 (1984) 124.
[8] T.J. Headley, R.E. Loehman, J. Am. Ceram. Soc. 67 (1984)
620.
[9] C.L. Liu, S. Komarneni, R. Roy, J. Am. Ceram. Soc. 75
(1992) 2665.
[10] U. Selvaraj, C.L. Liu, S. Komarneni, J. Am. Ceram. Soc.
74 (1991) 1387.
[11] K.H. Ashbee, J. Mater. Sci. 10 (1975) 911.
[12] D.I.H. Atkison, P.W. McMillan, J. Mater. Sci. 12 (1997)
443.
[13] B.R. Durschang, G. Carl, C. R�ussel, K. Marchetti, E.
Roeder, Glastech. Ber. Glass Sci. Technol. 67 (1994) 171.
[14] K. Engel, G.H. Frischat, Texture Microstruct. 24 (1995)
155.
[15] G.J. Gardopee, R.E. Newnham, A.S. Bhalla, Ferroelectrics
33 (1981) 155.
[16] T. Rudolph, D.V. Szabo, W. Pannhorst, K.L. Weisskopf,
G. Petzow, Glastech. Ber. 64 (1991) 218.
[17] M.D. Kharkhanavala, F.A. Hummel, J. Am. Ceram. Soc.
36 (1953) 389.
[18] W. Schreyer, J.F. Schairer, Z. Kristallogr. 116 (1961) 60.
[19] R. M�uller, S. Reinsch, W. Pannhorst, Glastech. Ber. Glass
Sci. Technol. 69 (1996) 11.
[20] R. M�uller, L. Weh, S. Reinsch, Glastechnische Tagung,
Halle/S 1999 (to be published).
[21] R. Hergt, H. Pfei�er, L. Fritzsch, Phys. Stat. Sol. (a) 98
(1986) 69.
[22] R. Hergt, H. Pfei�er, Phys. Stat. Sol. (a) 92 (1985) K89.
[23] I. Gutzow, J. Schmelzer, The Vitreous State, Springer,
Berlin, 1995.
[24] A.V. Gorokhovskii, et al., Glass Phys. Chem. 20 (1994)
537.
[25] M.C. Weinberg, J. Non-Cryst. Solids 170 (1994) 300.
[26] R. Pascova, I. Penkov, I. Gutzow, Boletin de la Sociedad
Espanola de Ceramica y Vidrio: 16th International Con-
gress on Glass, Madrid, 2, 189.
[27] R. M�uller, R. Naumann, S. Reinsch, Thermochim. Acta
280&281 (1996) 1919.
[28] V.M. Fokin, N.S. Yuritsin, A.M. Kalinina, V.N. Filipo-
vich, Glastech. Ber. Glass Sci. Technol. C 67 (1994) 392.
[29] R. M�uller, J. Non-Cryst. Solids 219 (1997) 110.
N. Diaz-Mora et al. / Journal of Non-Crystalline Solids 273 (2000) 81±93 93