Surface charge controlled nucleoli selective staining with ...
11
RESEARCH ARTICLE Surface charge controlled nucleoli selective staining with nanoscale carbon dots Zhijun Zhu 1☯ , Qingxuan Li 1☯ , Ping Li 1,3 , Xiaojie Xun 1,2 , Liyuan Zheng 1,2 , Dandan Ning 1,2 , Ming SuID 1,2 * 1 Department of Chemical Engineering, Northeastern University, Boston, Massachusetts, United States of America, 2 Wenzhou Institute of Biomaterials and Engineering, Wenzhou Medical University, and Chinese Academy of Science, Zhejiang, P. R. China, 3 School of Chemistry and Materials, Ningde Normal University, Ningde, Fujian, P. R. China ☯ These authors contributed equally to this work. * [email protected] Abstract Organelle selective imaging can reveal structural and functional characters of cells undergo- ing external stimuli, and is considered critical in revealing biological fundamentals, designing targeted delivery system, and screening potential drugs and therapeutics. This paper describes the nucleoli targeting ability of nanoscale carbon dots (including nanodiamond) that are hydrothermally made with controlled surface charges. The surface charges of car- bon dots are controlled in the range of -17.9 to -2.84 mV by changing the molar ratio of two precursors, citric acid (CA) and ethylenediamine (EDA). All carbon dots samples show strong fluorescence under wide excitation wavelength, and samples with both negative and positve charges show strong fluorescent contrast from stained nucleoli. The nucleoli selec- tive imaging of live cell has been confirmed with Hoechst staining and nucleoli specific stain- ing (SYTO RNA-select green), and is explained as surface charge heterogeneity on carbon dots. Carbon dots with both negative and positive charges have better ability to penetrate cell and nucleus membranes, and the charge heterogeneity helps carbon dots to bind pref- erentially to nucleoli, where the electrostatic environment is favored. Introduction Carbon dots including nanodiamond discovered as by-products of nanotubes have shown great potentials in chemical, bio-sensing, nano-medicines, catalysis, and as active components in optical and optoelectronic devices [1–12]. The unique properties of nanoscale carbon dots such as small sizes, low toxicity, photo-stability, and rich surface chemistry make them ideal for molecular imaging [13–23]. Membrane and cytoplasm imaging has been achieved with car- bon dots made from a variety of carbon sources [24–29]. Organelle selective imaging can reveal structural and functional characters of cells undergoing external stimuli, and is consid- ered critical in revealing biological fundamentals, designing targeted delivery system, and screening potential drugs and therapeutics[30–33]. The area selective imaging of cellular organelles has been achieved in carbon dots [28]. Carbon dots made from citric acid and PLOS ONE | https://doi.org/10.1371/journal.pone.0216230 May 31, 2019 1 / 11 a1111111111 a1111111111 a1111111111 a1111111111 a1111111111 OPEN ACCESS Citation: Zhu Z, Li Q, Li P, Xun X, Zheng L, Ning D, et al. (2019) Surface charge controlled nucleoli selective staining with nanoscale carbon dots. PLoS ONE 14(5): e0216230. https://doi.org/ 10.1371/journal.pone.0216230 Editor: Kai Griebenow, University of Puerto Rico, Rio Piedras Campus, PUERTO RICO Received: December 5, 2018 Accepted: April 16, 2019 Published: May 31, 2019 Copyright: © 2019 Zhu et al. This is an open access article distributed under the terms of the Creative Commons Attribution License, which permits unrestricted use, distribution, and reproduction in any medium, provided the original author and source are credited. Data Availability Statement: All relevant data are within the manuscript and its Supporting Information files. Funding: This project was supported by a Director’s New Innovator Award from National Institute of Health (no. 1DP2EB016572) to MS, a Young Teacher Specific Project from Ningde Normal University (no. 2016Q46) to PL. Competing interests: The authors have declared that no competing interests exist.
Transcript of Surface charge controlled nucleoli selective staining with ...

RESEARCH ARTICLE
Surface charge controlled nucleoli selective
staining with nanoscale carbon dots
Zhijun Zhu1☯, Qingxuan Li1☯, Ping Li1,3, Xiaojie Xun1,2, Liyuan Zheng1,2, Dandan Ning1,2,
Ming SuID1,2*
1 Department of Chemical Engineering, Northeastern University, Boston, Massachusetts, United States of
America, 2 Wenzhou Institute of Biomaterials and Engineering, Wenzhou Medical University, and Chinese
Academy of Science, Zhejiang, P. R. China, 3 School of Chemistry and Materials, Ningde Normal University,
Ningde, Fujian, P. R. China
☯ These authors contributed equally to this work.
Abstract
Organelle selective imaging can reveal structural and functional characters of cells undergo-
ing external stimuli, and is considered critical in revealing biological fundamentals, designing
targeted delivery system, and screening potential drugs and therapeutics. This paper
describes the nucleoli targeting ability of nanoscale carbon dots (including nanodiamond)
that are hydrothermally made with controlled surface charges. The surface charges of car-
bon dots are controlled in the range of -17.9 to -2.84 mV by changing the molar ratio of two
precursors, citric acid (CA) and ethylenediamine (EDA). All carbon dots samples show
strong fluorescence under wide excitation wavelength, and samples with both negative and
positve charges show strong fluorescent contrast from stained nucleoli. The nucleoli selec-
tive imaging of live cell has been confirmed with Hoechst staining and nucleoli specific stain-
ing (SYTO RNA-select green), and is explained as surface charge heterogeneity on carbon
dots. Carbon dots with both negative and positive charges have better ability to penetrate
cell and nucleus membranes, and the charge heterogeneity helps carbon dots to bind pref-
erentially to nucleoli, where the electrostatic environment is favored.
Introduction
Carbon dots including nanodiamond discovered as by-products of nanotubes have shown
great potentials in chemical, bio-sensing, nano-medicines, catalysis, and as active components
in optical and optoelectronic devices [1–12]. The unique properties of nanoscale carbon dots
such as small sizes, low toxicity, photo-stability, and rich surface chemistry make them ideal
for molecular imaging [13–23]. Membrane and cytoplasm imaging has been achieved with car-
bon dots made from a variety of carbon sources [24–29]. Organelle selective imaging can
reveal structural and functional characters of cells undergoing external stimuli, and is consid-
ered critical in revealing biological fundamentals, designing targeted delivery system, and
screening potential drugs and therapeutics[30–33]. The area selective imaging of cellular
organelles has been achieved in carbon dots [28]. Carbon dots made from citric acid and
PLOS ONE | https://doi.org/10.1371/journal.pone.0216230 May 31, 2019 1 / 11
a1111111111
a1111111111
a1111111111
a1111111111
a1111111111
OPEN ACCESS
Citation: Zhu Z, Li Q, Li P, Xun X, Zheng L, Ning D,
et al. (2019) Surface charge controlled nucleoli
selective staining with nanoscale carbon dots.
PLoS ONE 14(5): e0216230. https://doi.org/
10.1371/journal.pone.0216230
Editor: Kai Griebenow, University of Puerto Rico,
Rio Piedras Campus, PUERTO RICO
Received: December 5, 2018
Accepted: April 16, 2019
Published: May 31, 2019
Copyright: © 2019 Zhu et al. This is an open access
article distributed under the terms of the Creative
Commons Attribution License, which permits
unrestricted use, distribution, and reproduction in
any medium, provided the original author and
source are credited.
Data Availability Statement: All relevant data are
within the manuscript and its Supporting
Information files.
Funding: This project was supported by a
Director’s New Innovator Award from National
Institute of Health (no. 1DP2EB016572) to MS, a
Young Teacher Specific Project from Ningde
Normal University (no. 2016Q46) to PL.
Competing interests: The authors have declared
that no competing interests exist.
penicillamine can target Golgi body [34] and those from β-alanine and zwitterionic ligand can
target nucleuses [35]. Developing more targeted imaging probes would definitely enhance
understanding to targeted delivery, and enrich bioimaging toolkits.
Nucleoli is known for its critical roles in creation of ribosomes via ribosome biogenesis pro-
cess, in assembly of signal recognition particles, and in cell’s responses to stress [36]. Though
desired, nucleoli selective staining is rare, and existing methods are limited by high cost, and
laborious operations[37,38]. Given their nanometer sizes, carbon dots can easily penetrate cell
membranes and nucleus pores, and access to sub-cellular organizations. The rich surface
chemistry of carbon dots enables unlimited possibilities of selective staining [39–43]. Carbon
dots made from calcine of cow manure and modified with ethylenediamine (EDA) and from
refluxing polyethylene glycol showed a tendency to stain nucleoli [44]. However, these results
do not reveal the physical state of carbon dots around nucleoli, and a direct side-by-side com-
parison with a known nucleoli staining is needed to confirm nucleoli targeting ability.
Carbon dots made from citric acid (CA) and ethylenediamine (EDA) have also been stud-
ied for bioimaging [45,46]. However, the influence of surface charge to nucleoli staining ability
has not been reported. Here, CA and EDA, are used simultaneously to produce carbon dots
with controlled surface charge under hydrothermal conditions. The surface charges of carbon
dots have been tuned by adjusting the molar ratio of CA and EDA to achieve impressive nucle-
oli targeting with high selectivity. While decreasing the molar ratio of CA: EDA in precursor,
the zeta potential of carbon dots decreases accordingly, which enhances nucleoli staining. The
effects of incubation time and carbon dot concentration have been examined. The nucleoli
selective staining of these carbon dots has been observed in different cell line, and thus can be
extended to other cell lines in general.
Experimental sections
Chemicals: Citric acid (CA), and polyethylenimine (PEI) were purchased form Alfa Aesar.
Ethylenediamine (EDA), Dulbecco’s modified Eagle’s medium (DMEM, Hyclone), fetal
bovine serum (FBS), penicillin and streptomycin were obtained from Corning. SYTO RNA-
select green fluorescent cell stain and Hoechst 33342 were from ThermoFisher. Phosphate
buffer solution (PBS) was obtained from ThermoFisher. Others were from Sigma-Aldrich. All
the chemicals were used as received. Milli-Q water (Millipore) was used to make all the
solutions.
Carbon dots preparation: carbon dots were made according to literature [45] with slight
modification. Briefly, 1.6 g of CA (1 mol) was dissolved in 10 mL of water, and mixed with
0.21 (0.5 mol), 0.42 (1 mol), 0.83 (2 mol) or 1.66 mL (3 mol) of EDA, respectively, followed by
stirring to form a homogeneous solution. The mixture was transferred to a 50 mL of Teflon-
lined stainless autoclave and heated at 180˚C for 12 h. After reaction, the reactor was cooled
down to room temperature naturally. The resulting solution was subjected to dialysis with
molecular weight cut-off (MWCO) of 1000 to remove unreacted precursors, followed by
lyophilization. Two carbon dots had also been synthesized using CA as carbon resource and
PEI as a passivation agent, where the molar ratio of CA: PEI was 1:0.5 and 1:2, respectively.
The carbon dots made using CA and EDA as a single carbon resource were used as controls.
Measurement: The fluorescence spectra were measured with Cary Eclipse Fluorescence Spec-
trophotometer. Fourier-transform infrared (FTIR) spectroscopy was conducted on a Shi-
madzu IR Prestige21 spectrometer. The morphology was observed on a JEM-1010
Transmission Electron Microscope (TEM) operating at 60 kV using ultrathin carbon sup-
ported grid. A Renishaw Raman spectrometer (Invia) was operated at 532 nm excitation wave-
length to obtain Raman spectrum of each sample. Zeta potential was measured on a NANO ZS
Surface charge controlled nucleoli selective staining with nanoscale carbon dots
PLOS ONE | https://doi.org/10.1371/journal.pone.0216230 May 31, 2019 2 / 11

ZEN3600, Malvern Instruments. The photoluminescence (PL) quantum yield (QY) of the car-
bon dots with the different molar ratio of CA:EDA were derived with the following Eq (1)
[47]:
QYCDs ¼ QYRICDsARðnCDsÞ
2
IRACDsðnRÞ2
ð1Þ
where, QYCDs and QYR are the PL QY of the CDs and reference (Rhodamine 6G), the QYR of
Rhodamine 6G in water solution is 0.95[48]. ICDs and IR is the measured integrated emission
intensity of CDs and reference, respectively. ACDs and AR is the UV-vis absorption intensity of
CDs and reference, respectively. nCDs and nR is the refractive index of the solvent (1.33 for
water) for both CDs and reference.
Cell culture and viability test: HeLa (human cervical cancer) cells were cultured in 5% CO2
at 37˚C in DMEM supplemented with 10% FBS and 1% mixed solution of penicillin and strep-
tomycin. For cell viability test, 8,000 HeLa cells were seeded in 96 well plates overnight.
Desired amounts of carbon dots were added to the media, and the cells were incubated with
another 24 h. The cells were washed thrice with PBS (pH 7.4), and then the viability of the cells
were tested with MTT method.
Cell staining and imaging: 100,000 cells were seeded in 12-well plate and incubated over-
night with carbon dots at certain concentration. After certain time, the cells were washed with
PBS twice and fixed with 4% formaldehyde for 15 min in an incubator. 1 mL of DMEM that
contains 16.2 μM of Hoechst 33342 and 0.5 μM of RNA-select green fluorescent cell stain was
applied on the cells and incubated for another 20 min in dark. After removing the solution, the
cells were rinsed twice with fresh DMEM, and the cells were rest for 5 minutes in medium at
37˚C. The coverslip was taken out and inversely placed on a glass slide pre-dropped with
mounting medium (a mixture of 30% 2×PBS and 70% glycerin) and the cells were ready for
imaging.
Results and discussions
The hydrothermal method has been used to make carbon dots from various carbon sources
Fourier transform infrared spectroscopy (FTIR) provides abundant information of the surface
groups of carbon dots (Fig 1A1–1A4), where the broad peaks centered at 3440 cm-1 corre-
spond to the stretching vibration of O-H and N-H bonds, respectively. Both O-H and N-H
bonds improve the hydrophilicity and stability of carbon dots in an aqueous solution. The
strong peaks at 1700 and 1200 cm-1 are attributed to the stretching vibration of C = O and C-N
bonds, while that at 1600 cm-1 to the bending vibration of N-H bond. With the decrease of
CA: EDA, the signal intensity of N-H bond increases relative to that of C = O bond, which
indication that relatively more EDAs are involved. The FTIR results also indicate that these as-
made carbon dots possess abundant hydroxyl and carboxylic groups, which ensure their good
biocompatibility.
The surface charges around carbon dots enable excellent dispersion in aqueous solution.
Fig 1B1–1B4 inset shows the aqueous solutions of four carbon dots emit bright blue light
under ultraviolet excitation (365 nm) and also the PL spectra of the four aqueous solutions of
carbon dots with excitation wavelength from 320 to 420 nm. The emission spectra of carbon
dots synthesized from CA and EDA exhibit excitation-wavelength dependence, and the nar-
row emission peak reflects narrow size distribution of carbon dots. At the same CA: EDA
molar ratio, the emission peak shifts to long wavelength (red shift) at long excitation wave-
length, and the peak intensity decreases sharply when excitation wavelength is above 400 nm.
Unlike a simple organic fluorophore that has one excitation level in visible region, carbon dots
Surface charge controlled nucleoli selective staining with nanoscale carbon dots
PLOS ONE | https://doi.org/10.1371/journal.pone.0216230 May 31, 2019 3 / 11

have multiple excitation levels in the visible region, and show excitation dependent emission
[49].
Fig 1C shows transmission electron microscopy (TEM) images of carbon dots deposited on
ultrathin carbon films supported on copper grid. The carbon dots made from different molar
ratio of CA: EDA show a uniform size distribution (Fig 1C1–1C4) with diameter of carbon
dots increasing from 10 to 15 nm. The samples have been tested for their Raman characteris-
tics under 532 nm excitation. The fourth sample with less amount of negative charges shows
strong sp3 diamond peak at 1332 cm-1, while the other three samples with more negative char-
ges do not show the peak (Figure not shown). This formation of crystalline diamond structure
could also be indicated from the higher electron contrast in TEM image (Fig 1C4) than other
three samples. The PL QY of carbon dots made from different molar ratio of CA: EDA were
calculated, the QY of CA: EDA(1:0.5), CA: EDA(1:1), CA: EDA(1:2) and CA: EDA(1:3) was
around 0.87, 0.84, 0.89 and 0.84, respectively. These four carbon dots exhibit high PL QY.
Fig 1. FTIR spectrum (A), fluorescent emission spectra at the same concentration (B), and TEM (C) of carbon dots made from different molar ratio of CA:
EDA. The Raman spectrum of one sample is also included as inset in C4.
https://doi.org/10.1371/journal.pone.0216230.g001
Surface charge controlled nucleoli selective staining with nanoscale carbon dots
PLOS ONE | https://doi.org/10.1371/journal.pone.0216230 May 31, 2019 4 / 11

Fig 2A–2D shows cell outlines observed using carbon dots of different CA: EDA, where a
trend of strong image contrast can be seen when the CA: EDA ratio increases from 1:0.5 (Fig
2A), 1:1 (Fig 2B), 1:2 (Fig 2C) and 1:3 (Fig 2D), respectively. Since fluorescent intensity of car-
bon dots from different molar ratios show the same according to PL spectra in Fig 1B, the best
local selective staining ability, which can be seen from Fig 2C and 2D, indicates more carbon
dots aggregated in the centre of nucleus. The selective staining ability is quantified by image
according to intensity differences between nucleoli and cytoplasm, which shows higher inten-
sity difference in Fig 2C (24) and 2D (18) than that in Fig 2A (0) and 2B (8), proving the possi-
ble ability of selectivity. The following nucleoli staining test was practiced at CA: EDA molar
ratio of 1:2 rather than 1:3 to achieve sufficient contrast while avoiding heavily staining which
may alter cellular functions. The Table in Fig 2E shows the Zeta potentials of carbon dots with
different molar ratio of CA: EDA, where the zeta potential increased with the molar ratio of
CA: EDA decreased, meaning more amine groups are presented on the surface of carbon dots.
Figures of Zeta potential are presented in S1 Fig. Compared Zeta potential and staining ability
among these four samples, the increasing trend of Zeta potential is correlated to the ability of
staining nucleoli due to cell uptake affinity of positive or neutral species[50]. The in vitro cellu-
lar toxicity of the carbon dots was examined with MTT method. Fig 2F shows that cells
exposed to four different carbon dots showed good viability over a large concentration range
after 24 h incubation, where no evident toxicity was observed at 800 μg/mL of carbon dots,
and over 80% of cells remain alive at 1,500 μg/mL of carbon dots, indicating excellent biocom-
patibility of carbon dots. The concentration of carbon dots in the staining solution was thus
determined to be 400 μg/mL.
Cell incubated with 400 μg/mL of carbon dots at CA: EDA ratio of 1:2 for different time
was investigated to determine the suitable incubation time for selective staining ability. Fig 3
shows the gradual enrichment of carbon dots around nucleoli during a 24 h period of time,
Fig 2. Fluorescent images of HeLa cells incubated with 400 μg/mL of carbon dots with the molar ratio of CA: EDA at 1:0.5(A), 1:1 (B), 1:2 (C), 1:3 (D) for 24 h
(under blue light excitation). Table of the Zeta potentials of carbon dots with different molar ratio of CA: EDA (E). Viability of HeLa cells incubated with
various carbon dots with different concentrations for 24 h (F).
https://doi.org/10.1371/journal.pone.0216230.g002
Surface charge controlled nucleoli selective staining with nanoscale carbon dots
PLOS ONE | https://doi.org/10.1371/journal.pone.0216230 May 31, 2019 5 / 11

where the nucleoli become brighter and clearer as the incubation time increases. No obvious
nucleoli image can be recognized before (Fig 3A) and after incubation for 1 h (Fig 3B); vague
outline of nucleoli with weak contrast can be seen after staining for 2 h (Fig 3C); clear nucleoli
with strong contrast can be seen after staining for 4 h and 8 h (Fig 3D and 3E). Since exposure
to 400 μg/mL of carbon dots for 24 h does not lead to significant higher contrast of nucleoli
and nucleus (Fig 3F), staining for 4 h is determined to be appropriate for the further
experiments.
In order to specific determine the location of carbon dots inside cells, cells are co-stained
with carbon dots (CA: EDA molar ratio of 1:2), and nucleus selective dye that tends to bind
A-T rich regions of DNA (Hoechst 33342), and commercial RNA selective dye (SYTO RNA-
select green fluorescent cell stain) that has been known the capability of RNA staining is pro-
vided as a comparison. Fig 4A–4C shows fluorescent images of cells co-stained with carbon
dots from CA: EDA 1:2 and Hoechst 33342.
Fig 4A shows that cells emit bright green fluorescence upon blue excitation due to presence
of carbon dots. Fig 4B shows the same cells emit blue fluorescence of Hoechst 33342, which
shows void spots in nucleus as nucleoli (indicated by green arrows) because there is not
enough DNAs in nucleoli region. The bright green spots in the nucleus match void regions
perfectly, suggesting that carbon dots are selective staining agents for live cell nucleoli. Since
nucleolus is composed of proteins, ribosomal RNA (rRNA) and rDNA, cells were stained with
commercial RNA selective dye (SYTO RNA-select green fluorescent cell stain) to further con-
firm that carbon dots have high selectivity to nucleoli. The fact shown in Fig 4D that the fluo-
rescence image of cells stained with SYTO dye is virtually non-distinguishable from those of
carbon dots, confirming that the carbon dots have a strong affinity to cell nucleoli. The above
nucleoli staining with carbon dots suggests that carbon dots with less negative charge (lower
CA: EDA ratio) provide better selectivity. To clarify the cause, CA and EDA were used to
Fig 3. The fluorescent images of HeLa cells incubated with 400 μg/mL of carbon dots from CA: EDA 1:2 for 0 h (A), 1 h (B), 2 h (C), 4 h (D), 8 h (E) and 24 h
(F), respectively (under blue excitation).
https://doi.org/10.1371/journal.pone.0216230.g003
Surface charge controlled nucleoli selective staining with nanoscale carbon dots
PLOS ONE | https://doi.org/10.1371/journal.pone.0216230 May 31, 2019 6 / 11
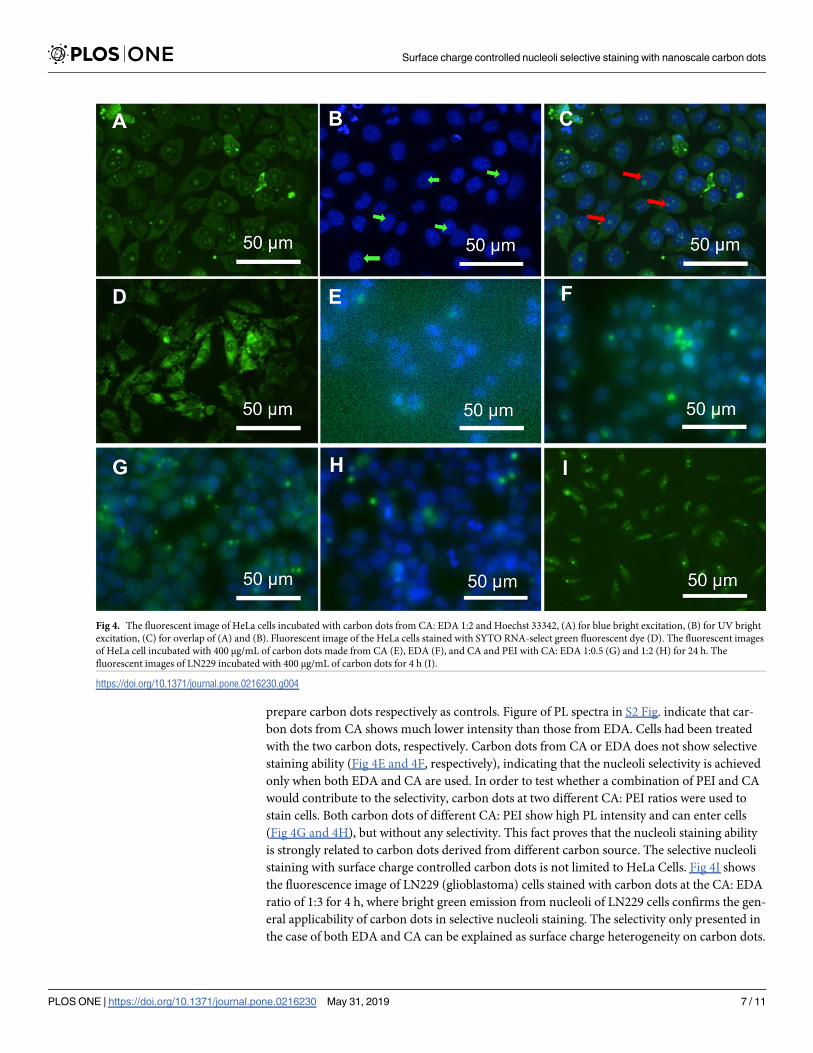
prepare carbon dots respectively as controls. Figure of PL spectra in S2 Fig. indicate that car-
bon dots from CA shows much lower intensity than those from EDA. Cells had been treated
with the two carbon dots, respectively. Carbon dots from CA or EDA does not show selective
staining ability (Fig 4E and 4F, respectively), indicating that the nucleoli selectivity is achieved
only when both EDA and CA are used. In order to test whether a combination of PEI and CA
would contribute to the selectivity, carbon dots at two different CA: PEI ratios were used to
stain cells. Both carbon dots of different CA: PEI show high PL intensity and can enter cells
(Fig 4G and 4H), but without any selectivity. This fact proves that the nucleoli staining ability
is strongly related to carbon dots derived from different carbon source. The selective nucleoli
staining with surface charge controlled carbon dots is not limited to HeLa Cells. Fig 4I shows
the fluorescence image of LN229 (glioblastoma) cells stained with carbon dots at the CA: EDA
ratio of 1:3 for 4 h, where bright green emission from nucleoli of LN229 cells confirms the gen-
eral applicability of carbon dots in selective nucleoli staining. The selectivity only presented in
the case of both EDA and CA can be explained as surface charge heterogeneity on carbon dots.
Fig 4. The fluorescent image of HeLa cells incubated with carbon dots from CA: EDA 1:2 and Hoechst 33342, (A) for blue bright excitation, (B) for UV bright
excitation, (C) for overlap of (A) and (B). Fluorescent image of the HeLa cells stained with SYTO RNA-select green fluorescent dye (D). The fluorescent images
of HeLa cell incubated with 400 μg/mL of carbon dots made from CA (E), EDA (F), and CA and PEI with CA: EDA 1:0.5 (G) and 1:2 (H) for 24 h. The
fluorescent images of LN229 incubated with 400 μg/mL of carbon dots for 4 h (I).
https://doi.org/10.1371/journal.pone.0216230.g004
Surface charge controlled nucleoli selective staining with nanoscale carbon dots
PLOS ONE | https://doi.org/10.1371/journal.pone.0216230 May 31, 2019 7 / 11

Given appropriate sizes, nanoparticles with both negative and positive surface charges may
have better ability to penetrate cell and nucleus membranes. The charge heterogeneity also
helps carbon dots to bind preferentially to nucleoli regions, where the electrostatic environ-
ment is favoured.
Conclusions
Surface charge of carbon dots plays a significant role in selective nucleoli staining and imaging.
Fluorescence carbon dots were made using CA as carbon source and EDA as surface modifica-
tion under hydrothermal conditions. The surface charges of carbon dots are controlled in the
range of -17.9 to -2.84 mV by changing the molar ratio of two precursors. All carbon dots sam-
ples show strong fluorescence and excitation-dependent photoluminescence, and samples
with less negative charge show characteristic Raman peaks of nano-diamond. Remarkable
selective nucleoli staining of HeLa and LN229 cell lines is found when both negative and posi-
tive charges are presented on carbon dots. The selective nucleoli staining has been confirmed
by co-staining with carbon dots, Hoechst dye and RNA specific dye. In contrast, carbon dots
made from citric acid and urea with more negative charge do not show selective nucleoli imag-
ing ability. In addition, carbon dots of different surface charge have shown low toxicity and
good cell compatibility.
Supporting information
S1 Fig. Zeta potentials of carbon dots with different molar ratio of CA: EDA at pH 7.0 at
25˚C.
(TIF)
S2 Fig. The emission spectra of different carbon dots under 349 nm of excitation wave-
length.
(TIF)
Acknowledgments
This project was supported by a Director’s New Innovator Award from National Institute of
Health (No. 1DP2EB016572) to MS, a Young Teacher Specific Project from Ningde Normal
University (No. 2016Q46) to PL.
Author Contributions
Data curation: Zhijun Zhu, Qingxuan Li.
Formal analysis: Xiaojie Xun, Liyuan Zheng.
Methodology: Zhijun Zhu, Qingxuan Li, Ping Li, Dandan Ning.
Supervision: Ming Su.
Writing – original draft: Zhijun Zhu, Qingxuan Li.
Writing – review & editing: Ping Li, Ming Su.
References1. Liu W, Li C, Ren Y, Sun X, Pan W, et al. (2016) Carbon dots: surface engineering and applications. J
Mater Chem B 4: 5772–5788.
Surface charge controlled nucleoli selective staining with nanoscale carbon dots
PLOS ONE | https://doi.org/10.1371/journal.pone.0216230 May 31, 2019 8 / 11

2. Pierrat P, Wang R, Kereselidze D, Lux M, Didier P, et al. (2015) Efficient in vitro and in vivo pulmonary
delivery of nucleic acid by carbon dot-based nanocarriers. Biomaterials 51: 290–302. https://doi.org/10.
1016/j.biomaterials.2015.02.017 PMID: 25771019
3. Lim SY, Shen W, Gao Z (2015) Carbon quantum dots and their applications. Chem Soc Rev 44: 362–
381. https://doi.org/10.1039/c4cs00269e PMID: 25316556
4. Kong B, Zhu A, Ding C, Zhao X, Li B, et al. (2012) Carbon dot-based inorganic–organic nanosystem for
two-photon imaging and biosensing of pH variation in living cells and tissues. Adv Mater 24: 5844–
5848. https://doi.org/10.1002/adma.201202599 PMID: 22933395
5. Kim J, Park J, Kim H, Singha K, Kim WJ (2013) Transfection and intracellular trafficking properties of
carbon dot-gold nanoparticle molecular assembly conjugated with PEI-pDNA. Biomaterials 34: 7168–
7180. https://doi.org/10.1016/j.biomaterials.2013.05.072 PMID: 23790437
6. Tao H, Yang K, Ma Z, Wan J, Zhang Y, et al. (2012) In vivo NIR fluorescence imaging, biodistribution,
and toxicology of photoluminescent carbon dots produced from carbon nanotubes and graphite. Small
8: 281–290. https://doi.org/10.1002/smll.201101706 PMID: 22095931
7. Jiang K, Sun S, Zhang L, Lu Y, Wu A, et al. (2015) Red, green, and blue luminescence by carbon dots:
full-color emission tuning and multicolor cellular imaging. Angew Chem Int Ed 54: 5360–5363.
8. Gupta V, Chaudhary N, Srivastava R, Sharma GD, Bhardwaj R, et al. (2011) Luminscent graphene
quantum dots for organic photovoltaic devices. J Am Chem Soc 133: 9960–9963. https://doi.org/10.
1021/ja2036749 PMID: 21650464
9. Yang S-T, Cao L, Luo PG, Lu F, Wang X, et al. (2009) Carbon dots for optical imaging in vivo. J Am
Chem Soc 131: 11308–11309. https://doi.org/10.1021/ja904843x PMID: 19722643
10. Yan F, Zou Y, Wang M, Mu X, Yang N, et al. (2014) Highly photoluminescent carbon dots-based fluo-
rescent chemosensors for sensitive and selective detection of mercury ions and application of imaging
in living cells. Sens Actuators B: Chem 192: 488–495.
11. Sharma V, Tiwari P, Mobin SM (2017) Sustainable carbon-dots: recent advances in green carbon dots
for sensing and bioimaging. J Mater Chem B 5: 8904–8924.
12. Jiang D, Chen Y, Li N, Li W, Wang Z, et al. (2016) Synthesis of Luminescent Graphene Quantum Dots
with High Quantum Yield and Their Toxicity Study. PLOS ONE 10: e0144906.
13. Kong W, Liu R, Li H, Liu J, Huang H, et al. (2014) High-bright fluorescent carbon dots and their applica-
tion in selective nucleoli staining. J Mater Chem B 2: 5077–5082.
14. Qu K, Wang J, Ren J, Qu X (2013) Carbon dots prepared by hydrothermal treatment of dopamine as an
effective fluorescent sensing platform for the label-free detection of iron (III) ions and dopamine. Chem
Eur J 19: 7243–7249. https://doi.org/10.1002/chem.201300042 PMID: 23576265
15. Du F, Zhang L, Zhang L, Zhang M, Gong A, et al. (2017) Engineered gadolinium-doped carbon dots for
magnetic resonance imaging-guided radiotherapy of tumors. Biomaterials 121: 109–120. https://doi.
org/10.1016/j.biomaterials.2016.07.008 PMID: 28086179
16. Wang S, Li C, Qian M, Jiang H, Shi W, et al. (2017) Augmented glioma-targeted theranostics using mul-
tifunctional polymer-coated carbon nanodots. Biomaterials 141: 29–39. https://doi.org/10.1016/j.
biomaterials.2017.05.040 PMID: 28666100
17. Wu Y-F, Wu H-C, Kuan C-H, Lin C-J, Wang L-W, et al. (2016) Multi-functionalized carbon dots as thera-
nostic nanoagent for gene delivery in lung cancer therapy. Sci Rep 6: 21170. https://doi.org/10.1038/
srep21170 PMID: 26880047
18. Feng T, Ai X, An G, Yang P, Zhao Y (2016) Charge-convertible carbon dots for imaging-guided drug
delivery with enhanced in vivo cancer therapeutic efficiency. ACS Nano 10: 4410–4420. https://doi.org/
10.1021/acsnano.6b00043 PMID: 26997431
19. Vazquez-Gonzalez M, Liao W-C, Cazelles R, Wang S, Yu X, et al. (2017) Mimicking horseradish peroxi-
dase functions using Cu2+-modified carbon nitride nanoparticles or Cu2+-modified carbon dots as het-
erogeneous catalysts. ACS Nano 11: 3247–3253. https://doi.org/10.1021/acsnano.7b00352 PMID:
28234445
20. LeCroy GE, Sonkar SK, Yang F, Veca LM, Wang P, et al. (2014) Toward structurally defined carbon
dots as ultracompact fluorescent probes. ACS Nano 8: 4522–4529. https://doi.org/10.1021/nn406628s
PMID: 24702526
21. Hola K, Zhang Y, Wang Y, Giannelis EP, Zboril R, et al. (2014) Carbon dots—Emerging light emitters
for bioimaging, cancer therapy and optoelectronics. Nano Today 9: 590–603.
22. Zeng Q, Shao D, He X, Ren Z, Ji W, et al. (2016) Carbon dots as a trackable drug delivery carrier for
localized cancer therapy in vivo. J Mater Chem B 4: 5119–5126.
23. Wang L, Li B, Xu F, Li Y, Xu Z, et al. (2017) Visual in vivo degradation of injectable hydrogel by real-time
and non-invasive tracking using carbon nanodots as fluorescent indicator. Biomaterials 145: 192–206.
https://doi.org/10.1016/j.biomaterials.2017.08.039 PMID: 28869865
Surface charge controlled nucleoli selective staining with nanoscale carbon dots
PLOS ONE | https://doi.org/10.1371/journal.pone.0216230 May 31, 2019 9 / 11

24. Yang Y, Gao C, Li B, Xu L, Duan L (2014) A rhodamine-based colorimetric and reversible fluorescent
chemosensor for selectively detection of Cu2+ and Hg2+ ions. Sensors and Actuators B: Chemical
199: 121–126.
25. Luo PG, Sahu S, Yang S-T, Sonkar SK, Wang J, et al. (2013) Carbon "quantum" dots for optical bioima-
ging. J Mater Chem B 1: 2116–2127.
26. Cao L, Wang X, Meziani MJ, Lu F, Wang H, et al. (2007) Carbon dots for multiphoton bioimaging. J Am
Chem Soc 129: 11318–11319. https://doi.org/10.1021/ja073527l PMID: 17722926
27. Hu L, Sun Y, Li S, Wang X, Hu K, et al. (2014) Multifunctional carbon dots with high quantum yield for
imaging and gene delivery. Carbon 67: 508–513.
28. Fowley C, McCaughan B, Devlin A, Yildiz I, Raymo FM, et al. (2012) Highly luminescent biocompatible
carbon quantum dots by encapsulation with an amphiphilic polymer. Chem Comm 48: 9361–9363.
https://doi.org/10.1039/c2cc34962k PMID: 22892652
29. Mewada A, Pandey S, Thakur M, Jadhav D, Sharon M (2014) Swarming carbon dots for folic acid medi-
ated delivery of doxorubicin and biological imaging. J Mater Chem B 2: 698–705.
30. Yang G, Liu L, Yang Q, Lv F, Wang S (2012) A Multifunctional Cationic Pentathiophene: Synthesis,
Organelle-Selective Imaging, and Anticancer Activity. Advanced Functional Materials 22: 736–743.
31. Senthilnathan N, Chandaluri CG, Radhakrishnan TP (2017) Efficient Bioimaging with Diaminodicyano-
quinodimethanes: Selective Imaging of Epidermal and Stomatal Cells and Insight into the Molecular
Level Interactions. Scientific Reports 7: 10583. https://doi.org/10.1038/s41598-017-11293-y PMID:
28878252
32. Hu F, Liu B (2016) Organelle-specific bioprobes based on fluorogens with aggregation-induced emis-
sion (AIE) characteristics. Organic & Biomolecular Chemistry 14: 9931–9944.
33. Zhu H, Fan J, Du J, Peng X (2016) Fluorescent Probes for Sensing and Imaging within Specific Cellular
Organelles. Accounts of Chemical Research 49: 2115–2126. https://doi.org/10.1021/acs.accounts.
6b00292 PMID: 27661761
34. Liu X, Pang J, Xu F, Zhang X (2016) Simple approach to synthesize amino-functionalized carbon dots
by carbonization of chitosan. Sci Rep 6: 31100. https://doi.org/10.1038/srep31100 PMID: 27492748
35. Jung YK, Shin E, Kim B-S (2015) Cell nucleus-targeting zwitterionic carbon dots. Sci Rep 5: 18807.
https://doi.org/10.1038/srep18807 PMID: 26689549
36. Shen R, Shen X, Zhang Z, Li Y, Liu S, et al. (2010) Multifunctional conjugates to prepare nucleolar-tar-
geting CdS quantum dots. J Am Chem Soc 132: 8627–8634. https://doi.org/10.1021/ja1002668 PMID:
20518506
37. Wang X, Wang Y, He H, Ma X, Chen Q, et al. (2017) Deep-Red Fluorescent Gold Nanoclusters for
Nucleoli Staining: Real-Time Monitoring of the Nucleolar Dynamics in Reverse Transformation of Malig-
nant Cells. ACS Applied Materials & Interfaces 9: 17799–17806.
38. Saini AK, Sharma V, Mathur P, Shaikh MM (2016) The development of fluorescence turn-on probe for
Al(III) sensing and live cell nucleus-nucleoli staining. Scientific Reports 6: 34807. https://doi.org/10.
1038/srep34807 PMID: 27721431
39. Wang F, Xie Z, Zhang H, Liu Cy, Zhang Yg (2011) Highly luminescent organosilane-functionalized car-
bon dots. Adv Funct Mater 21: 1027–1031.
40. Salinas-Castillo A, Ariza-Avidad M, Pritz C, Camprubi-Robles M, Fernandez B, et al. (2013) Carbon
dots for copper detection with down and upconversion fluorescent properties as excitation sources.
Chem Comm 49: 1103–1105. https://doi.org/10.1039/c2cc36450f PMID: 23283251
41. Bhunia SK, Maity AR, Nandi S, Stepensky D, Jelinek R (2016) Imaging cancer cells expressing the
folate receptor with carbon dots produced from folic acid. ChemBioChem 17: 614–619. https://doi.org/
10.1002/cbic.201500694 PMID: 26773979
42. Wang C-I, Periasamy AP, Chang H-T (2013) Photoluminescent C-dots@RGO probe for sensitive and
selective detection of acetylcholine. Anal Chem 85: 3263–3270. https://doi.org/10.1021/ac303613d
PMID: 23398232
43. Huang P, Lin J, Wang X, Wang Z, Zhang C, et al. (2012) Light-triggered theranostics based on photo-
sensitizer-conjugated carbon dots for simultaneous enhanced-fluorescence imaging and photodynamic
therapy. Adv Mater 24: 5104–5110. https://doi.org/10.1002/adma.201200650 PMID: 22718562
44. D’Angelis do E S. Barbosa C, Corrêa JR, Medeiros GA, Barreto G, Magalhães KG, et al. (2015) Carbon
dots (C-dots) from cow manure with impressive subcellular selectivity tuned by simple chemical modifi-
cation. Chem Eur J 21: 5055–5060. https://doi.org/10.1002/chem.201406330 PMID: 25693878
45. He H, Wang Z, Cheng T, Liu X, Wang X, et al. (2016) Visible and Near-Infrared Dual-Emission Carbo-
genic Small Molecular Complex with High RNA Selectivity and Renal Clearance for Nucleolus and
Tumor Imaging. ACS Appl Mater Interfaces 8: 28529–28537. https://doi.org/10.1021/acsami.6b10737
PMID: 27704754
Surface charge controlled nucleoli selective staining with nanoscale carbon dots
PLOS ONE | https://doi.org/10.1371/journal.pone.0216230 May 31, 2019 10 / 11

46. Song Y, Zhu S, Zhang S, Fu Y, Wang L, et al. (2015) Investigation from chemical structure to photolumi-
nescent mechanism: a type of carbon dots from the pyrolysis of citric acid and an amine. J Mater Chem
C 3: 5976–5984.
47. Wang L, Yin Y, Jain A, Zhou HS (2014) Aqueous Phase Synthesis of Highly Luminescent, Nitrogen-
Doped Carbon Dots and Their Application as Bioimaging Agents. Langmuir 30: 14270–14275. https://
doi.org/10.1021/la5031813 PMID: 25365539
48. Magde D, Rojas GE, Seybold PG (1999) Solvent Dependence of the Fluorescence Lifetimes of Xan-
thene Dyes. Photochemistry and Photobiology 70: 737–744.
49. Zhu S, Song Y, Zhao X, Shao J, Zhang J, et al. (2015) The photoluminescence mechanism in carbon
dots (graphene quantum dots, carbon nanodots, and polymer dots): current state and future perspec-
tive. Nano Research 8: 355–381.
50. Mosquera J, Garcıa I, Liz-Marzan LM (2018) Cellular Uptake of Nanoparticles versus Small Molecules:
A Matter of Size. Accounts of Chemical Research 51: 2305–2313. https://doi.org/10.1021/acs.
accounts.8b00292 PMID: 30156826
Surface charge controlled nucleoli selective staining with nanoscale carbon dots
PLOS ONE | https://doi.org/10.1371/journal.pone.0216230 May 31, 2019 11 / 11