Surface and solvent influences on protein crystallization
165
Retrospective eses and Dissertations Iowa State University Capstones, eses and Dissertations 2001 Surface and solvent influences on protein crystallization Xiaojing Pan Iowa State University Follow this and additional works at: hps://lib.dr.iastate.edu/rtd Part of the Chemical Engineering Commons is Dissertation is brought to you for free and open access by the Iowa State University Capstones, eses and Dissertations at Iowa State University Digital Repository. It has been accepted for inclusion in Retrospective eses and Dissertations by an authorized administrator of Iowa State University Digital Repository. For more information, please contact [email protected]. Recommended Citation Pan, Xiaojing, "Surface and solvent influences on protein crystallization " (2001). Retrospective eses and Dissertations. 1072. hps://lib.dr.iastate.edu/rtd/1072
Transcript of Surface and solvent influences on protein crystallization

Retrospective Theses and Dissertations Iowa State University Capstones, Theses andDissertations
2001
Surface and solvent influences on proteincrystallizationXiaojing PanIowa State University
Follow this and additional works at: https://lib.dr.iastate.edu/rtd
Part of the Chemical Engineering Commons
This Dissertation is brought to you for free and open access by the Iowa State University Capstones, Theses and Dissertations at Iowa State UniversityDigital Repository. It has been accepted for inclusion in Retrospective Theses and Dissertations by an authorized administrator of Iowa State UniversityDigital Repository. For more information, please contact [email protected].
Recommended CitationPan, Xiaojing, "Surface and solvent influences on protein crystallization " (2001). Retrospective Theses and Dissertations. 1072.https://lib.dr.iastate.edu/rtd/1072

INFORMATION TO USERS
This manuscript has been reproduced from the microfilm master. UMI films
the text directly from the original or copy submitted. Thus, some thesis and
dissertation copies are in typewriter face, while others may be from any type of
computer printer.
The quality of this reproduction is dependent upon the quality of the
copy submitted. Broken or indistinct print, colored or poor quality illustrations
and photographs, print bleedthrough, substandard margins, and improper
alignment can adversely affect reproduction.
In the unlikely event that the author did not send UMI a complete manuscript
and there are missing pages, these will be noted. Also, if unauthorized
copyright material had to be removed, a note will indicate the deletion.
Oversize materials (e.g., maps, drawings, charts) are reproduced by
sectioning the original, beginning at the upper left-hand comer and continuing
from left to right in equal sections with small overlaps.
Photographs included in the original manuscript have been reproduced
xerographically in this copy. Higher quality 6" x 9" black and white
photographic prints are available for any photographs or illustrations appearing
in this copy for an additional charge. Contact UMI directly to order.
ProQuest Information and Learning 300 North Zeeb Road, Ann Arbor, Ml 48106-1346 USA
800-521-0600


Surface and solvent influences on protein crystallization
by
Xiaojing Pan
A dissertation submitted to the graduate faculty
in partial fulfillment of the requirements for the degree of
DOCTOR OF PHILOSOPHY
Major: Chemical Engineering
Major Professor: Charles E. Glatz
Iowa State University
Ames, Iowa
2001
Copyright © Xiaojing Pan, 2001. All rights reserved.

UMI Number 3016737
®
UMI UMI Microform 3016737
Copyright 2001 by Bell & Howell Information and Learning Compamy. All rights reserved. This microform edition is protected against
unauthorized copying under Title 17, United States Code.
Bell & Howell Information and Learning Company 300 North Zeeb Road
P.O. Box 1346 Ann Arbor, Ml 48106-1346

II
Graduate College Iowa State University
This is to certify that the Doctoral dissertation of
Xiaojing Pan
has met the dissertation requirements of Iowa State University
Major Professor
For the Major Program
Signature was redacted for privacy.
Signature was redacted for privacy.
Signature was redacted for privacy.

iii
To my husband Bing Yuan and my parents Biao Pan and Fangkui Ren
for their encouragement and support
iv
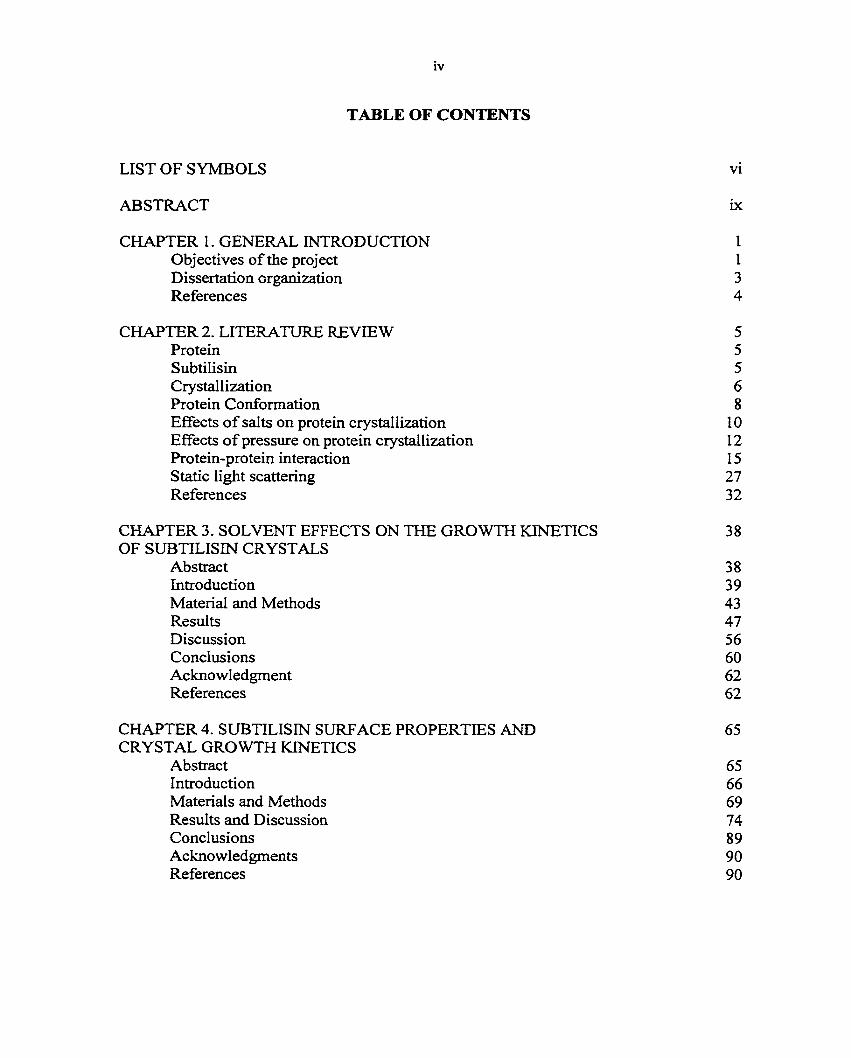
TABLE OF CONTENTS
LIST OF SYMBOLS vi
ABSTRACT ix
CHAPTER 1. GENERAL INTRODUCTION 1 Objectives of the project 1 Dissertation organization 3 References 4
CHAPTER 2. LITERATURE REVIEW 5 Protein 5 Subtilisin 5 Crystallization 6 Protein Conformation 8 Effects of salts on protein crystallization 10 Effects of pressure on protein crystallization 12 Protein-protein interaction 15 Static light scattering 27 References 32
CHAPTER 3. SOLVENT EFFECTS ON THE GROWTH KINETICS 38 OF SUBTILISIN CRYSTALS
Abstract 38 Introduction 39 Material and Methods 43 Results 47 Discussion 56 Conclusions 60 Acknowledgment 62 References 62
CHAPTER 4. SUBTILISIN SURFACE PROPERTIES AND 65 CRYSTAL GROWTH KINETICS
Abstract 65 Introduction 66 Materials and Methods 69 Results and Discussion 74 Conclusions 89 Acknowledgments 90 References 90

V
CHAPTER 5. SOLVENT ROLE IN PROTEIN CRYSTALLIZATION 94 AS DETERMINED BY PRESSURE DEPENDENCE OF NUCLEATION RATE AND SOLUBILITY
Abstract 94 Introduction 95 Materials and Methods 99 Results 101 Discussion 107 Conclusions 111 Acknowledgments 111 References 111
CHAPTER 6. SOLVENT EFFECTS ON THE SECOND VIRIAL 115 COEFFICIENTS OF SUBTILISIN AND SOLUBILITY
Abstract 115 Introduction 116 Materials and Methods 121 Results and Discussion 124 Conclusions 131 Acknowledgments 13 2 References 132
CHAPTER 7. GENERAL CONCLUSIONS 135
APPENDIX A: COMPUTER PROGRAM FOR CALCULATION OF 137 INTERACTION FREE ENERGY IN CHAPTER 4
APPENDIX B: COMPUTER PROGRAM FOR DETERMINATION 146 OF THE EFFECTIVE HAMAKER CONSTANTS IN CHAPTER 6
ACKNOWLEDGEMENTS 151

vi
A
a
B2
b
c
CF
D
DF
dp
e
G
G'
AG(T)
H
I
K
LIST OF SYMBOLS
the change rate of absorbance, min"1
nucleation power; effective spherical radius of protein molecule, Â
the second virial coefficient, mol-mL-g"2
growth power
concentration of soluble protein in solution, mg/ml
conversion factor
diameter of crystal, fim
dilute factor
effective spherical diameter
the elementary charge
the fugacity of protein in the solid phase at the system temperature, T
the protein infinite dilution fugacity in a salt-free solution
the protein infinite dilution fugacity in a salt-containing solution
growth rate, (j.m/hr
volumetric growth rate per unit crystal surface, pm/hr
the free energy change of dissolving the solid protein into a salt-free solution
at infinite dilution
effective Hamaker constant
ionic strength
equilibrium constant

VII
Ks or k' or ko salting-out constant
k kinetic rate constant, subscript (G for growth, N for nucleation)
ki sal ting-in constant
L length of crystal, pm
Mc mass of a crystal, mg
Mp the molecular weight of protein, g/mol
Na Avogadro's number
no the refractive index of solvent
dn/dcp the refractive index increment of protein
P pressure
R gas constant
r the center-to-center distance, Â
S or s solubility of protein, mg/ml
T temperature, K.
t time, hr
AV volume change for reaction (e.g. crystallization), cm3/mol
AV* activation volume, cm3/moI
Vm intrinsic volume, cm3/mol
Vt thermal volume, cm3/mol
Vi interaction volume, cm3/mol
Vw the molar volume of water
xp the protein mole fraction
z the valence of protein

s
er
K
P
Pc
a
Subscript
atm
c
G
N
P
s
viii
dielectric permittivity; the minimum interaction energy
the relative permittivity of solvent (water, 78.3; protein, 4.0)
the inverse of the Debye screening length
chemical potential; the dipole moment of the protein
the partial molar volume of protein
solution density, g/mL
crystal density, g/mL
the collision diameter
atmosphere
crystal
growth
nucleation
high pressure or protein
salt

ix
ABSTRACT
The role of water in protein crystallization was explored by investigating the effects
of three factors (salts, point mutations and pressure) on subtilisin crystallization.
Solubility and growth kinetics of three subtilisin mutants in three salt solutions were
measured. The decrease of the solubility of Properase® and Purafect® subtilisin followed the
reverse order of the Hofmeister series: SCN~ >NO]" >C1\ The solubility of Properase® was
higher than other two mutants. Crystal morphology changed with the nature of salts and the
substitution of surface residues. The required supersaturation (c-s)/s for a given growth rate
increased when solubility was decreased. The effect of anion on protein growth was related
to the molar Gibbs free energy of hydration of the anion.
Structural and energetic considerations for crystallization of two subtilisin mutants
(Properase® and Purafect®) were compared. The average hydrophobicity, solvent accessible
surface area (ASA) and the number of hydrogen bonds and salt bridges were calculated to
quantify surface properties of proteins in intermolecular contact patches. All three amino
acid substitutions are present in the contact patches. Properase® lattice involves more atomic
contacts and hydrogen bonds and larger accessible surface area, which corresponding to the
faster growth of Properase® crystals. Non-electrostatic interaction energy was calculated for
each contact direction and the competition of misoriented molecules with correctly oriented
ones was considered to explain the variation of growth kinetics
The increase of solubility with pressure gave a total volume change for crystallization
of 37 cm3/mol, whereas the decrease of nucleation rate with pressure gave an activation

X
volume for nucleation of226 cm3/mol. 983 water molecules were estimated to attend
Properase® crystallization.
The second virial coefficients (Bi) of Properase® and Purafect® subtilisin under
crystallization conditions were measured by static light scattering as a function of salt type
and salt concentration, showing that conditions with slight negative B2 are suitable for protein
crystallization. A DLVO-type model was used to fit the effective Hamaker constants for
subtilisin and solubility was quantitatively correlated with B2 using a theoretically based
correlation.

1
CHAPTER 1. GENERAL INTRODUCTION
Objectives of the project
Crystallization is one of the oldest known separation and purification methods.
Because of its advantages of lower cost and simple operation, it is widely used in purification
or recovery of many inorganic, organic and pharmaceutical materials. With the application
of X-ray diffraction to determine the 3-D protein structure, protein crystallization is paid
more and more attention as a prerequisite to X-ray diffraction (Ducruix, et al. 1992).
Because of the complexity of protein structure, protein crystallization was not
understood as well as crystallization of small inorganic molecules (Durbin and Feher, 1996).
Many researchers have devoted their efforts to finding the appropriate crystallization
conditions for good quality crystals. Nevertheless, most crystallization conditions were
obtained by screening experiment and depended on the protein of interest. We have no
general principle to guide us to optimize protein crystallization.
The main objective of this work is to study of the role of water in protein
crystallization. In a protein solution, each protein molecule interacts with its surrounding
water molecules (i.e. the bound water). The bound water forms a hydration shell around the
protein. When a protein molecule is incorporated into a nucleus or a crystal surface, part of
its bound water is released from the hydration shell. And the average water content in a
protein crystal is around 43% (Matthews, 1968). Therefore, the study of the role of water
(i.e. hydration) can provide us an insight into the underlying mechanism in protein
crystallization.

2
The hydration state of a protein in aqueous solution depends on many parameters,
including temperature, pressure, solvent conditions and surface properties of protein.
Meantime, protein crystallization is also affected by these factors. In this work, three factors
were considered: the nature and concentration of salt, surface properties of protein and
pressure. Solubility, nucleation rate and growth rate are three main parameters for evaluating
a crystallization process. The second virial coefficient, a measure of protein-protein
interaction, has been proposed as a predictor for screening protein crystallization conditions
(George and Wilson, 1994). Therefore, experimental studies regarding to the four parameters
were conducted.
• Changes of solubility with the nature and concentration of salts, protein mutants
and pressure.
• Measurement of growth kinetics of different mutants in various salt solutions.
• Measurement of nucleation kinetics under different pressures.
• Changes of the second virial coefficient of protein with the nature and
concentration of salts.
In this work, the three types of salts, NaCl, NaNOs and NaSCN, were selected because they
are all monovalent and present as fully ionized species in solution and as well as cover a
range of the Hofmeister series. Subtilisin was chosen as the model protein in this work due
to the availability of its mutants. Properase®, Purafect® and Purafect® OX subtilisin were
used to present the effects of point mutation in protein surface. The range of pressure was
chosen from 0.1 to 68 MPa because no conformation change and no activity loss were
observed at this pressure range (Webb et al. 2000).

3
Experimental results showed strong dependence of protein crystallization on three
factors (i.e. salts, mutations and pressures) and supported that hydration would play a role in
protein crystallization. Thus, the next question would be how hydration affects protein
crystallization. To answer this question, I have specifically
1. correlated the hydration free energy of ions with the supersaturation required for
the same growth rate.
2. characterized the surface properties of protein by accessible surface area,
hydrophobicity, hydrogen bonds
3. calculated the non-electrostatic interaction free energy between two protein
molecules along certain contact bonds
4. estimated the volume change for crystallization and activation volume for
nucleation, and further estimated how many water molecules are involved in
protein crystallization.
5. determined the effective Hamaker constant for subtilisin and correlated the
solubility with the second virial coefficient.
Dissertation organization
This dissertation includes seven chapters. The first chapter introduces the objectives
of research in this work and dissertation organization. Chapter 2 is literature review giving
the basic background about protein crystallization. The previous studies on salt effects,
pressure effects, protein-protein interactions and theory of static light scattering are reviewed.
The following four chapters are four manuscripts to be submitted for publication.
4
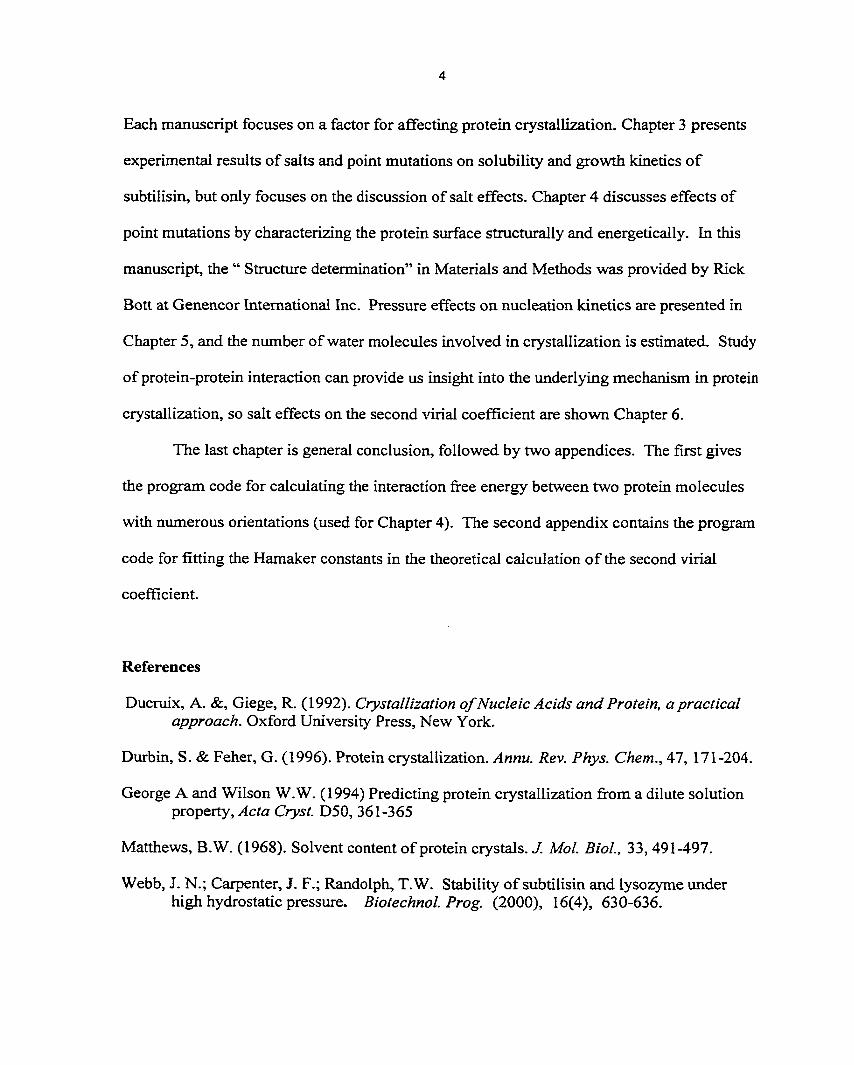
Each manuscript focuses on a factor for affecting protein crystallization. Chapter 3 presents
experimental results of salts and point mutations on solubility and growth kinetics of
subtilisin, but only focuses on the discussion of salt effects. Chapter 4 discusses effects of
point mutations by characterizing the protein surface structurally and energetically. In this
manuscript, the " Structure determination" in Materials and Methods was provided by Rick
Bott at Genencor International Inc. Pressure effects on nucleation kinetics are presented in
Chapter 5, and the number of water molecules involved in crystallization is estimated. Study
of protein-protein interaction can provide us insight into the underlying mechanism in protein
crystallization, so salt effects on the second virial coefficient are shown Chapter 6.
The last chapter is general conclusion, followed by two appendices. The first gives
the program code for calculating the interaction free energy between two protein molecules
with numerous orientations (used for Chapter 4). The second appendix contains the program
code for fitting the Hamaker constants in the theoretical calculation of the second virial
coefficient.
References
Ducruix, A. &, Giege, R. (1992). Crystallization of Nucleic Acids and Protein, a practical approach. Oxford University Press, New York.
Durbin, S. & Feher, G. (1996). Protein crystallization. Annu. Rev. Phys. Chem., 47, 171-204.
George A and Wilson W.W. (1994) Predicting protein crystallization from a dilute solution property, Acta Cryst. D50, 361-365
Matthews, B.W. (1968). Solvent content of protein crystals. J. Mol. Biol., 33, 491-497.
Webb, J. N.; Carpenter, J. F.; Randolph, T.W. Stability of subtilisin and lysozyme under high hydrostatic pressure. Biotechnol. Prog. (2000), 16(4), 630-636.

5
CHAPTER 2. LITERATURE REVIEW
Protein
Proteins are high molecular weight molecules that play indispensable roles in living
systems. Most proteins consist of 20 naturally occurring amino acids linked by peptide
bonds. The twenty amino acids have different size, shape, charge and polarity. According to
the interactions of residue-residue and residue-solvent, the amino acid side chains fold to
proteins with specific conformation (Creighton, 1993). The charge of a protein and the
polarities of its surface residues are of primary interest for the investigation of protein-protein
interactions. These properties can be adjusted by changing the solution condition or using
genetic mutations.
Subtilisin
Subtilisin from Bacillus lentus is a serine endo-protease and has a molecular weight
of around 27 kD. The dimension of a subtilisin molecule is about 48 x 44 x 40 (À). Its
specific volume is 0.703 ml/g (Creighton, 1993). It is used in laundry detergents to
hydrolyze insoluble protein stains into soluble peptides (Becker, 1991).
Properase®, Purafect® and Purafect® OX subtilisin are three mutants derived from
wild type Bacillus lentus subtilisin. They are manufactured commercially by Genencor
International, Inc. All of them have 269 residues. The differences in the amino acid
sequence are listed in Table 2-1 (Bott, 1997).

6
Table 2-1. Differences in amino acid sequence of mutants
1 74 85 97 99 101 102 157
Wide Type Gly Asn Ser Asp Arg Ala lie Ser
Purafect® Ala Asn Ser Ser Ser Ser Val Gly
Properase® Ala Asn Asn Ser Gly Ser Asn Gly
Purafect® OX Ala Asp Ser Ser Ser Ser Val Gly
Crystallization
Crystallization is a process by which species are stripped out from vapor, solution or
melt. It involves a solid-liquid phase equilibrium. The prerequisite for crystallization is that
the system has to be brought to a supersaturated state (Ducruix et al., 1992). In
crystallization from solution, the supersaturated state can be achieved by several methods,
such as changing temperature, evaporating solvent, adding electrolytes and adjusting pH
(Mersmann, 1994). The selection of one specific method depends on the nature of the
product desired. Solubility, nucleation rate and growth rate are three main variables
measured for studying a crystallization process.
A crystallization process consists of two steps — nucleation and growth. Nucleation
concerns the genesis of new crystals. Firstly, the protein molecules aggregate up to the
appearance of nuclei of a critical size. At this stage, the interactions between molecules
tends to form an overall negative free energy and the nuclei are stable. There are three
mechanisms controlling the nucleation process: homogeneous, heterogeneous and secondary

7
(Belter et al., 1988). Homogeneous and heterogeneous nucleation are types of primary
nucleation, which is the formation of new crystals directly from the liquid phase.
Homogeneous nucleation is spontaneous and only due to supersaturation, whereas
heterogeneous nucleation results from the presence of insoluble materials. Secondary
nucleation involves contact with other crystals initially presented in a supersaturated system.
Which mechanism is dominant in a crystallization process depends on the crystallization
condition: homogenous nucleation rarely occurs in industrial process, whereas secondary
nucleation dominants in industrial crystallizes (Belter et al., 1988)
Crystal growth follows the formation of nuclei. The growth process is quite complex and
roughly includes three steps: molecules in solution first diffuse to the surface of the crystal,
then they are orderly incorporated in to the crystal, and finally the water molecules released
counter diffuse to the bulk. At present, diffusion and surface integration reactions are
considered to be the usual controlling mechanisms (Mersmann, 1994). The associated
concentration profile for each growth limitation is demonstrated in Figure 2-1. In the case of
diffusion-control, the concentration gradient develops in the boundary layer of crystal
surface. Convection and agitation can decrease the thickness of the boundary layer and then
speed growth. Once a molecule arrives at the crystal surface, its attachment to the surface
depends on the structure of the surface.
The kinetics of nucleation and growth can be simply described by the following
equations (Randolph and Larson, 1988):
* = *,(—)" (2-1)
G = *c(—)* (2-2) s

8
where B is the nucleation rate and G is the growth rate; and kc are the corresponding
constants; a and b are the nucleation power and growth power, (c-s ) represents the
supersaturation which is the difference between the solution concentration, c, and the
solubility, s.
Diffusion controlled Integration controlled
I
P
Figure 2-1. Concentration profile for growth that is limited by diffusion and integration
(Mersmann, 1995). p represents the concentration, p* is the equilibrium
concentration, pi is the concentration in the interface / which is between the
diffusion-convection layer and the integration reaction boundary layer. Ap=p-
p* is the concentration gradient across two layers (diffusion-convection layer
and integration reaction boundary layer), y is the position away from the surface
of crystal.

9
Protein conformation
Since our understanding of protein conformation is mainly based on X-ray
crystallographic analysis, a basic question is generated about whether the incorporation of a
protein into the crystal affects the protein conformation. Rupley (1969) reviewed the
experimental data about the reactivities of side-chain groups in the crystalline and in the
soluble protein. The chemistry of the crystalline protein was directly compared with that of
the soluble protein by equilibrium and kinetic properties. Equilibrium binding of saccharides
to lysozyme (Butler and Rupley, 1967) and azide to horse methemoglobin (Perutz and
Mathews, 1966) were examined and found that no change in binding behavior is introduced
by crystallization. So they concluded that no conformational change occurs during
crystallization. Krivacic and Rupley (1968) found the solvation of horse methemoglobin
caused a volume contraction of 20~40 mL/mol, which is close to the volume change for the
électrostriction of a pair of ions (10 to 20 mL/mol) or the transfer of a nonpolar group from
hydrophobic to aqueous environment (about 20 mL/mol). The structures of hemoglobin,
lysozyme, myoglobin and dehydrogenase were proved to be the same in crystal as in solution
(Rupley, 1969). Although an effect of crystallization on kinetic behavior of the enzyme was
occasionally found, the general rule was that no effect of crystallization on equilibrium
properties or on average conformation (Rupley, 1969).
Protein conformation in solution depends on the solvent and environmental
conditions, such as temperature, ionic strength and pressure. Ions affect the protein
conformation electrostatically and lyotropically. Electrostatic effects depend on the sign and
magnitude of ionic charge, while lyotropical effects (also called the Hofmeister effects) come
from the nature of ions (von Hippel and Schleich, 1969). Protein melting temperature (Tm)

10
is often used to investigate ion effects. It was found that Tm of lysozyme decreased with
increasing concentration of urea, LiBr, and guanidinium chloride at high pH (Hamaguchi and
Sakai, 1965). The effects of neutral salts on macromolecules was reviewed by Von Hippel
and Schleich (1969)
Pressure affects the structure and function of proteins either by directly compressing
the residue packing or by altering the ionization or hydration state of those residues. It has
been observed that high pressure can denature and inactivate enzymes, but the activity of
some deep-sea microbes is accelerated at high pressure (Visuri et al., 1990). No
conformation change was found for single-chain proteins at pressure under 40 to 50 MPa
(Weber, 1992). Pressure effects on protein have been reviewed by Morild (1981) and Gross
and Jaenicke (1994). Lysozyme, a-amylase and pepsin are stable and active up to 100 MPa.
Reversible conformation changes of lysozyme was found from 600 to 1000 MPa
(Chryssomallis et al., 1981)
Effects of salts on protein crystallization
When salts are added to a protein solution, two different effects can be observed:
salting-in and salting-out (von Hippel and Schleich, 1969). With the increase of salt
concentration, the solubility of protein increases with the increasing salt concentration first
(referred to "salting-in"), and then passes through a maximum before decreasing ("salting-
out") (Figure 2-2). Salting-out is a common method for protein crystallization.
A well-known correlation between the protein solubility and the ionic strength of the
solution was given by Cohn (1925)
logS = J3 -KJ (2-3)

11
Salting-out Region <c
CO
Salt Concentration
Figure 2-2. Typical solubility behavior of a protein. (Shih et al., 1992)
where S is the solubility of the protein; I is the ionic strength; Ks is the salting-out constant
which depends on the nature of protein and salt; f3 is a constant that depends on temperature
and the net charge of the protein but not on the salt. Melander and Horvath (1977) showed
from theory that the apparent salting-out constant, Ks, is the combined result of electrostatic
and hydrophobic interactions.
At lower salt concentration, the salting-in effect has to be considered (Green, 1932):
where kt and ka are the salting-in and salting-out constants, respectively, and So is the
solubility of protein in pure water; Cs is the concentration of salts.
The relative effectiveness of salts in decreasing the solubility of protein was ranked
by Hofmeister in 1888, based on ability to precipitate hen egg white proteins.
(2-4)

12
• cations : Li+>Na+>K+>NH4+>Mg2+
• anions: SO^HPO^CHjCOO^HsOy^CaHiC^^HCC^CrO^Cr
>N03»C103>SCN"
Since the Hofmeister series was developed, it has been associated with many trends in
physical properties of macromolecular solutions (Collins, 1985 and Cacacem, 1997).
Recently, systematic studies of the effect of salts on protein solubility were conducted on
many other proteins, including lysozyme, a-amylase, hemoglobin (Veelser et al., 1996;
Carbonnaux et al., 1995; Guilloteau et al., 1992; Qasim et al., 1981; Salahuddin et al., 1981;
Ries-Kautt et al., 1989, 1991; Poillon et al., 1979; Shih et al., 1992). A summary of some
published experimental results is shown in Table 2-2. A detailed literature review on the
effects of salts on solubility and growth rates of protein crystals can be found in Chapter 3.
Beside these effects, salts also influence the temperature sensitivity of protein crystallization
(Wiencek and Darcy, 1997) and the dimension and type of unit cell (Ries-Kautt et al., 1989).
Effects of pressure on protein crystallization
Faster crystallization of glucose isomerase at higher pressure than at 0.1 MPa (i.e.
atmosphere) (Visuri et al., 1990) motivated the research here. Crystallization of lysozyme
and subtilisin under high pressure were followed (Gro(3 and Jaenicke, 1991, 1993; Suzuki et
al., 1994; Schall et al., 1993; Takano et al., 1997; Saikumar et al., 1995, 1998; Waghmare et
al., 2000). However, contrary to glucose isomerase, lysozyme and subtilisin were found to
crystallize more slowly at high pressure.
Pressure could change the partial mole volume of macromolecule by directly
compressing residue packing inside the macromolecule or rearranging the solvent molecules

13
Table 2-2. Effectiveness of various salts for protein crystallization (Comparison at the same
ionic strength)
Protein Crystallization
Conditions
Effectiveness Order
«.-amylase, pl=5.9 pH=8 Saltine-out:
(Veelser et al., 1996) 20°C SO42>CI~>SCN-
Acidic hypoderma pH = 7.2 Saltine-out:
lineatum, pi =4.1 18°C HP042VH2P04>S04
2>Citrate37Citrate2"
(Carbonnaux et al., 1995) »C1"
Erabutoxin b pH = 4.5 Saltine-out:
pi > 9.2 18°C SCN>C1"
(Ries-Kautt et al., 1991)
Lysozyme pH = 4.5 saltine-out:
p i = 1 1 . 1 18°C Li+>Na+>K+
(Ries-Kautt et al., 1989) SCN>N03>CR>HC5H5072>CH3C00"
>H2PO4>SO42"
*: The rank was based on the concentration of salts.

14
Table 2-2. Effectiveness of various salts for protein crystallization (Comparison at the same
ionic strength) (continued)
Protein Crystallization
Conditions
Effectiveness Order
Buffalo immunoglobulin G pH = 7.0
(Salahuddin et al., 1981) 33°C
Salting-in: KSCN > MgS04> ZnS04>
Sodium Citrate > (NH4)2S04 > NaH2P04 >
KH2P04>Na2S04
Salting-out: phosphate most effective,
KSCN least effective
Serum albumins pH = 6.8
(Qasim et al., 1981) 30°C
Saltine-in:
NaCl03>NaBr>Sodium
Citrate>MgS04>NaCl>li2S04
Salting-out:
Na2S04>(NH4)2S04>Sodium Citrate
Deoxygenated sickle pH = 6. 8
hemoglobin * 30°C
(Poillon et al., 1979)
Salting-in:
SCN">Ci04\r>Br">N03">Cr
Salting-out
S042>HP04
2">F"(Na is counterion)
S042>N03">Cl->SCNXguanidinum as
counterion)

15
surrounding it. If crystallization is considered as a reaction and Le' Chatelier's principle is
applicable, the volume change for protein crystallization and the activation volumes for
nucleation and growth can be deduced from pressure experiments. Therefore, the
interpretation to the volume change gives us the insight into the transition state, the role of
hydration in protein crystallization and as well as the mechanism underlying protein
crystallization. (Refer to Chapter 5 for details).
Protein-protein interaction
A crystal consists of molecules packed in a regular manner for achieving a minimum
total free energy of the system. Packing of protein crystal is determined by protein-protein
interaction, including electrostatics, van der Waals forces, hydrogen bonding, salt bridging,
hydration and hydrophobic contributions. These forces belong to short and medium range
forces (i.e. the acting distance is a few  up to tens of Â) and are widely studied in the field of
protein folding. Studies on protein-protein interactions showed that the involved interactions
in protein binding are similar to those in protein folding, but the relative importance of these
interactions differs. Electrostatic interactions play a more important role in binding than in
folding, whereas hydrophobic interactions are dominant in folding (Xu et al., 1997a).
Electrostatic interaction
Electrostatic interactions are of importance for the structures and functions of large
macro molecules. It has long been a subject of study. The theoretical models include
computer simulation and approximate theory (Fushiki et al., 1991; Warshel and Aquist,
1991). Monte Carlo simulation is a main simulation method and can provide a good
agreement with experimental results. But the simulation of large molecules in electrolyte

16
solutions is computationally expensive (Ullner et al., 1996). Thus the approximate theory
becomes an alternative approach.
The classical treatment is based on the Poisson-Boltzmann Equation (PBE) which is a
dielectric continuum model (Honig and Nicholls, 1995). The Debye-Huckel approximation
is a solution to the linearized PBE at low ionic strength (Ullner et al., 1996). In this theory,
the charged proteins are modeled as simple ions immersed in a dielectric continuum. The
charge-charge potential is described by (Vilker et al., 1981)
where dp is the effective spherical diameter, z is the valence of the protein, e is the
elementary charge. SO£R is the dielectric permittivity of solvent, K is the inverse of the Debye
screening length ( K1 = ^OOOg NAI ^ js a function of ionic strength I . NA is kTs0er
Avogadro's number, k is Boltzmann's constant and T is temperature.
When the dipole of macromolecule is relatively large, the contributions of charge-
dipole and dipole-dipole also should be considered (Vilker et al., 1981):
3(1 + kr)e~k(r~2aJ V
W,-,=
2 (zg)2//2
3 £2kTrA
2 S 3 s2kTr6
(1 + ka) [2 + 2ka + (ka)2 +(I + ka) e/e]\ (2-6)
3[2 + 2nr + (w)2 ]e"4r(''"0) V [2 + 2KO + (/ca)~ + (1 + fca)e s /s] J
where a is the equivalent spherical radius; Ss is the dielectric constant at the protein molecular
surface; fj. is the dipole moment of the protein.

17
Van der Waals dispersion interaction
The dispersion force is also known as London force, charge-fluctuation force,
electrodynamic force and induced dipole-induced dipole force. The effective range varies
from 20 Â to 100 Â. A classical treatment of dispersion forces considers the interaction
between an instantaneous dipole in one molecule and the instantaneous dipole induced by it
in another molecule (Nir, 1976). If both molecules are treated as spherical particles, the pair
potential is given by Hamaker(1937).
where H, the Hamaker constant, depends on the nature of the protein and the surrounding
medium. The approximate value of A for a protein in aqueous solution is 5 kT (Nir, 1976).
Roth et al. (1996) derived the expected A from Lifshitz theory (3.1 kT for a protein in
aqueous solution and 23.7 kT for a protein in vacuum).
Excluded volume potential
The hard-sphere potential describes the repulsive force between the protein molecules
due to the excluded volume of protein, given by (Verwey and Overbeek, 1948)
When two protein molecules approach each other, salt ions are excluded between
them and the local region between them becomes a phase of pure water. Therefore, there
exists a concentration difference of salt ions between the local region and the bulk which
gives rise to a force equivalent to the osmotic pressure of salt ions (Curtis et al., 1998). At
(2-7)
for r>2a where s(r) = r / a
Whs(r) = <x> for r <dp
Wh s{r)= 0 for r > dp (2-8)

18
high salt concentration, the concentration difference becomes larger and salts may form ionic
clusters, which would increase the effect of the excluded volume of salts (Chiew et al.,
1995). The force resulting from the excluded volume of salt ions can be described by the
osmotic-attraction potential (Asakura and Oosawa, 1954; Curtis et al., 1998).
where dpi = (dp+dJ/2, di is the mean ionic hydrated diameter and ps represents the total ion
concentration. The hydrated diameter of a salt depends on its size and charge.
Hydration forces
The concept of hydration and experimental study
In a protein solution, there are three types of water molecules: the bound water
molecules that surround and strongly interact with solute molecules, the bulk water and the
buried water within the protein molecules (Gerstein and Levitt, 1998). Compared with the
bulk water, the bound water molecules are more restricted in their motion and form a
hydration shell around the solute molecule. The existence of the hydration shell has some
important consequences. First, it makes the transfer of solute molecules from an aqueous
solution to a nonpolar environment unfavorable. Second, it affects the local dielectric
constant of the solvent and the effective dielectric constant in the hydration shell may be
lower than that in the bulk. Third, a short-range hydration force arises when the hydration
shells of two solvated molecules overlap that can not be treated in terms of the continuum
model (Israelachvili, 1991).
3 I 4dp, l6dP,
Wos,nal,Ar) = 0 for r> 1 dp, osmotic
3 for dp <r< 2 dpi
(2-9)

19
Kuntz and Kauzmann (1974) classified four operational definitions of hydration:
preferential hydration, hydrodynamic hydration, structural hydration and low temperature
hydration. Preferential hydration describes the variance of thermodynamics properties of
water due to the presence of proteins, including activity, vapor pressure, partial molar free
energy, enthalpy, entropy, heat capacity and volume. Hydrodynamic hydration is related to
kinetic properties. It mainly focuses on the motion (translation, rotation, shear) of protein
molecules and the amount of water molecules moving with the protein. The quantity
depends on the effective shape of molecule. Structural hydration is a description for the
water molecules localized in protein crystals. The positions of the water molecules bound to
the protein can be determined by x-ray diffraction. There are relatively fewer water
molecules in the definition of structural hydration. The amount of water in non-freezable
protein solutions can be described by low temperature hydration. This approach can
determine and characterize a definite amount of water very easily. But it is not suitable to
study dilute solution, and the obtained results are hard to extend to room temperature (Kuntz
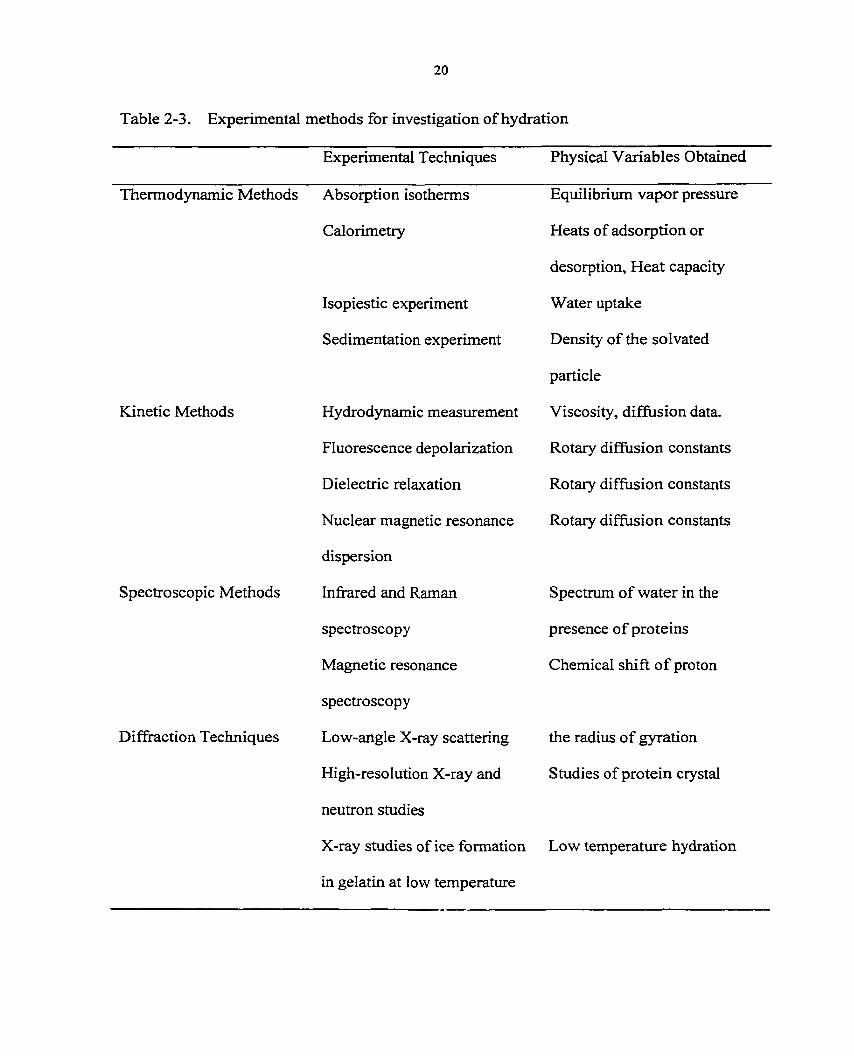
and Kauzmann, 1974). There are many experimental methods used to investigate hydration
phenomena (Kuntz and Kauzmann, 1974). A summary classified into four approaches is
shown in Table 2-3.
Temperature, pressure and salt may affect hydration by changing hydrogen bonding
(Tromp et al., 1992; Herdman et al., 1990, Leberman and Soper, 1995). Neutron scattering
studies of aqueous electrolyte solutions showed that salts and pressure have similar effects on
water structure, e.g. 2 molal NaCl solution and 1.4xl02 MPa pressure were equivalent in
destroying the hydrogen network of water (Leberman and Soper, 1995). And the trend of
equivalent pressure of salts on destroying the water structure is consistent with the
20
Table 2-3. Experimental methods for investigation of hydration
Experimental Techniques Physical Variables Obtained
Thermodynamic Methods Absorption isotherms Equilibrium vapor pressure
Calorimetry Heats of adsorption or
desorption, Heat capacity
Isopiestic experiment Water uptake
Sedimentation experiment Density of the solvated
particle
Kinetic Methods Hydrodynamic measurement Viscosity, diffusion data.
Fluorescence depolarization Rotary diffusion constants
Dielectric relaxation Rotary diffusion constants
Nuclear magnetic resonance Rotary diffusion constants
dispersion
Spectroscopic Methods Infrared and Raman Spectrum of water in the
spectroscopy presence of proteins
Magnetic resonance Chemical shift of proton
spectroscopy
Diffraction Techniques Low-angle X-ray scattering the radius of gyration
High-resolution X-ray and Studies of protein crystal
neutron studies
X-ray studies of ice formation Low temperature hydration
in gelatin at low temperature

21
Hofmeister series, which can be understood by the partial molar volumes of various ions.
Ions of which the partial molar volumes notably differ with that of water would have big
changes in hydrogen bonding.
Theoretical model of hydration
The hydration of protein is an important factor in stabilizing the conformation of the
protein in an aqueous solution. Several models were proposed to calculate the free energy of
hydration, which thus was incorporated into the calculation of the conformation energy. The
common characteristic of these models is that the total free energy of hydration is assumed to
be a sum of contributions from all groups or atoms, and the contribution can be modeled as
linearly proportional to the solvent exposure of the group or atom (Augspurger et al., 1996).
The two popular models are the hydration shell model (Gibson and Scheraga, 1967) and the
solvent accessible surface area model (Lee and Richards, 1971).
(1). Hydration Shell Model
The hydration shell model was introduced by Gibson and Scheraga in 1967. In this
model, they used the exposed volume of the hydration shell (VHS) as the unit to calculate the
free energy of hydration. Thus, the total free energy of hydration is given by
AG* =2^,(K%S), (2-10)
where 5 is the free energy density of atom i and an empirical parameter. The hydration shell
of an atom is the space between the two concentric spheres with the radius of the first
hydration shell, RhH, and the van der Waals radius, RvH, respectively (Figure 2-3). VHS is the
volume not occupied by other atoms of the protein. The overlaps among the hydration shells
of atoms result in the difficulty in the calculations of (VHS)j.

22
Figure 2-3. A schematic of the exposed volume of hydration shell. The shaded part is the
exposed volume of the hydration shell about an amide hydrogen. (Augspurger
and Scheraga, 1996)
(2). Solvent accessible surface (SAS) model
The concept of solvent accessible surface was first proposed by Lee and Richards in
1971. Its area is defined as " the area on the surface of a sphere of radius R, on each point of
which the center of a solvent molecule can be placed in contact with this atom without
penetrating any other atoms of the molecule" (Lee and Richards, 1971). The radius R is the
sum of van der Waals radius of the atom and the radius of water molecule (1.4 Â). A
schematic is shown in Figure 2-4.
The total free energy of hydration can be described as the sum of contributions of SAS
of all atomic groups (Van Holde et al., 1998; Ooi et al., 1987). That is,
AGh=^(ASP,*SAS,) (2-11)

23
'"vdw
Figure 2-4. The solvent accessible surface (solid line) of a molecule is calculated by rolling
a ball of radius rxv over the molecular surface. (Van Holde et al., 1998)
where ASP is the atomic solvation parameter that can be obtained experimentally from the
equilibrium constant K of a small model compound between water and an organic solvent
(AGH=-RTlnK). The common organic solvents are octanol and cyclohexane. The model
compound is often ALA-X-ALA(Chothia, 1974), where X is the atomic group.
Many models based on the SAS model have been developed differing in their
definition of R and the classification of the atomic groups, as well as the methods to obtain
the hydration free energy of the model compound (Ooi et al., 1987; Chothia, 1974; Wang et
al., 1995; Vila et al., 1991). The solvent accessible surface model provides a quite rapid way
to calculate the total free energy of hydration as well as hydrophobicity. It has been widely
incorporated into many computational algorithms for biomolecular modeling, such as X-plor
(Brunger, 1987) and ASC (Eisenhaber and Argos, 1993)

24
Hydrophobic interactions
The residues constituting proteins are classified as polar or nonpolar residues. In
aqueous solutions, the polar residues can form favorable hydrogen bonds with water
molecules. The relative lack of such bonds between water molecules and nonpolar residues
causes a favorable interaction between the nonpolar residues which has come to be known as
hydrophobic interactions (Creighton, 1993).
When a nonpolar solute is dissolved in water, the interactions between the solute and
the solvent are very weak. To reduce the free energy of the system, the solvent molecules
surrounding the solute are rearranged to form more hydrogen bonds between the water
molecules and a local clathrate-like convex cage can be observed (Creighton, 1993). When
two nonpolar molecules come together, their solvation cages join and the surface area of the
cavity housing them decreases, and hence the free energy of the system is reduced. So, the
reduction of the free energy for dissolving the nonpolar solute is the origin of hydrophobic
interactions.
The hydrophobic interaction between a pair of nonpolar solutes in aqueous solution is
entropy-driven and is generally thought to be the primary diving force for folding of proteins
into their tertiary structures. Because the direct measurement of the hydrophobic interaction
between nonpolar molecules is difficult, the free energy of hydrophobic interaction is
generally described as the transfer energy of a nonpolar molecule from an aqueous to a
nonaqueous environment (Van Holde et al, 1998). The free energy of transfer of nonpolar
groups is about 24 calories per additional Â2 of accessible surface area (Chothia, 1974).
There exist several hydrophobicity scales for amino acid residues based on different
assessment methods. Nozaki and Tanford (1971) measured the relative solubilities of the

25
free amino acid in aqueous and nonpolar solvents, Shzo and Snp, and calculated the free
energy of transfer according to
AGlr = RT ln(-^-) (2-12)
The AGtr of glycine was set as the zero point in the hydrophobicity scale. The other
measured values were compared to the AGtr of glycine. The relative values were assumed to
measure the hydrophobicities of amino acids.
Young et al. (1994) applied another method to assess hydrophobicity. Their approach
was based on the pairwise contact energies calculated by Miyazawa and Jernigan (1985).
The contact energies were derived by a quasi-chemical model from the statistical study of 42
high-resolution X-ray crystal structures. The hydrophobicity of each residue type was the
average contact energy of all such contacts. The two hydrophobicity scales have a strong
correlation and the values in both scales are listed in Table 2-4.
Hydrogen bonds and salt bridges
A hydrogen bond is a particular type of electrostatic interaction. It occurs when two
electronegative atoms compete for the same hydrogen atom. The hydrogen atom forms a
co valent bond with one of the atoms, but also interacts favorably with the other. The optimal
hydrogen bonds have linear geometry and the strength of a typical hydrogen bond ranges
from 10 to 40 kJ/mol (Israelachvili, 1991).
A salt bridge is another type of electrostatic interaction that exists between very close
and oppositely charged groups in protein. When two charged groups are very close, they can
not be treated as point charges. So, in this case, the term of salt bridge is used to describe the
interaction between them (Xu et al., 1997b). If the net interaction between two groups is

26
Table 2-4. Hydrophobicities (H) of 20 naturally occurring amino acids : Ha is scaled by
Tanford and Nozaki; Hb is scaled by Young et al. (Creighton, 1993; Young et
al., 1994)
Amino Acid Ha Hb Amino Acid Ha Hb
Phe 2.5 5. 12 Gly 0 2. 34
Met 1. 3 4.91 Thr 0.4 2. 30
lie (2. 5) 4. 88 Pro (-3. 3) 2. 22
Leu 1. 8 4. 65 Arg (-11.2) 2. 18
Trp 3.4 4. 36 Ser (-0. 3) 2. 07
Val 1. 5 4. 17 Gin (-0. 3) 1. 98
Cys (-2. 8) 4. 00 Glu (-9. 9) 1. 94
Tyr 2.3 3.24 Asn -0. 2 1. 90
Ala 0.5 2. 82 Asp (-7. 4) 1. 81
His 0.5 2. 75 Lys (-4. 2) 1. 50
Note: Values in parentheses were estimated from the relation between the free energy of
transfer and the accessible surface area of amino acid (Von Heijne and Blomberg,
1979)
described by an equilibrium constant KAB, the KAB of a salt bridge is roughly ten times as that
of a hydrogen bond. In a protein structure, salt bridges can be determined when the distances
between the donor atoms (including of Lys, iV\ NnI and Nn2 of Arg, N6' and hj£2 of His
and the amide N of the N-terminus) and the acceptor atoms (OeI and Cf2 of Glu, Osl and O32
of Asp and the two carboxyl oxygen atoms of the C-terminus) are less than 4. 0 Â.
27
Xu and et al. (1997b) investigated the X-ray data of 376 different interfaces. By
statistical analysis, they found that there were 10.69 hydrogen bonds and 2 salt bridges on
average for one interface. The hydrogen bonds across the interfaces were mainly the
oxygen-nitrogen type, and the number of hydrogen bonds had strong correlation with the
total accessible surface area of the interface.
Static light scattering
Theory ofstatic light scattering
Static light scattering is a technique to measure molecular interactions in
macromolecular solutions. It is used to measure the average scattered intensity over a given
period of time. Three characteristic parameters of a macromolecule can be obtained: the
molar mass, the second virial coefficient and the mean radius of gyration (Kratochvil, 1987).
The second virial coefficient of protein has been related to the selection for protein
crystallization conditions (George and Wilson, 1994, 1997)
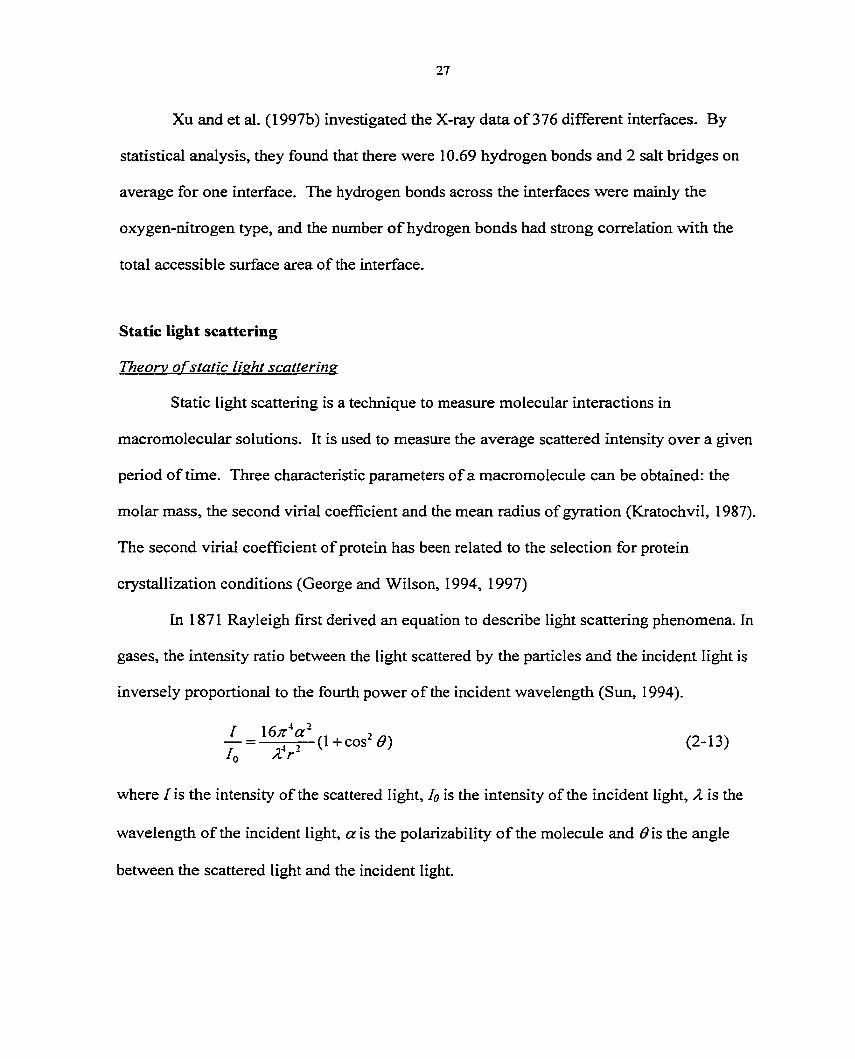
In 1871 Rayleigh first derived an equation to describe light scattering phenomena. In
gases, the intensity ratio between the light scattered by the particles and the incident light is
inversely proportional to the fourth power of the incident wavelength (Sun, 1994).
m (2-i3) ' 0 /l /"
where I is the intensity of the scattered light, Io is the intensity of the incident light, X is the
wavelength of the incident light, a is the polarizability of the molecule and 0 is the angle
between the scattered light and the incident light.

28
Later, Debye proposed the fluctuation theory based on the Rayleigh theory and
extended the Rayleigh theory from gases to liquids (Sun, 1994; Brown, 1996). In the case of
a nonideal solution, the light-scattering equation is given by
— = — + 2B2C (2-14) a, M =
K=̂ rk̂ r)2 (2-i5) NaA dc
Ir2
where Rg is tlie Rayleigh ratio Rg = ( ), c is the concentration of the solute g/ml, M is the h
molecular weight, B2 is the second virial coefficient, NA is Avogadro's number, no is the
refractive index of solvent, (dn/dc) is the refractive index increment of solute
When the molecular weight of scattering molecules exceeds 300 KDa, more than one
scattering point may appear. The phase differences among rays scattered from the different
points would result in nonsymmetrical scattering envelope, which is referred as internal
interference. Therefore, a interference factor, P(9), is applied into Equation 2-14 (Sun,
1994).
fr^+2S>c (2-l6)
where P(Q) depends on the shape of the molecules.
Zimm (1948) developed a graphical method, which is referred as "Zimm Plot"
(Figure 2.5), to determine the molecular weight M, the radius of gyration Rg and the second
virial coefficient B2 of a macromolecule simultaneously regardless of its shape. In his
derivation, P(Q) is expressed as a function of the radius of gyration, Rg,

29
_L_ = i+!ÉÇfi 2sin2^ />(0) 3Â2 * 2
1+-^-/? 'sin2- (2-17)
Therefore, the light-scattering equation with internal interference is written as
(2-,8) v<9
and the dependence of on concentration c and angle 0 is plotted in Figure 2-5. & is an Re
arbitrary constant to adjust the size of plot (Sun, 1994). From the Zimm plot, we obtain
Intercept = lim = — c-+0,<?—>0
Limiting slope of 6 curve, c —> 0 _ 16;r2Rg~ Intercept 3 A2
Limiting slope of c curve, <9 —> 0 _ Intercept 2
Protein crystallization probed by light scattering
The osmotic second virial coefficient is a parameter in the virial expansion for the
osmotic pressure of a solution (Hill, 1962).
K = kT(p + B2p2 + BiP3 +...) (2-19)
where ;ris the osmotic pressure; Bn is the nth virial coefficient ; p is the number density of
the single solute. The second term including B? characterizes the deviation from ideal
solution behavior due to the interactions of two bodies. George and Wilson (1994,1997)
measured 5? of 20 proteins under crystallization conditions and found the values fell between
—lxlO"4 and -8x10"4 mol-mL-g"2. Others have shown that there is a high degree of correlation
between solubility and the second virial coefficient (Guo et al. 1999; Bonnete et al., 1999).

30
Concentration curves (at constant 0)
Angle curves (at constant c)
0
2
Figure 2-5. Zimm plot
Therefore, the second virial coefficient has been proposed as a predictor for screening
crystallization condition.
Time-resolved static light scattering has also been used to investigate nucleation and
crystal growth kinetics (Fawell and Watling, 1998; Dhont et al., 1992). When nuclei form in
solution, they become strong scattering foci. By measuring the intensity of light scatted at
90° with time, the nucleation induction time and crystal growth rate can be detected readily.
Figure 2-6 is a schematic growth curve. Nucleation induction time decreases with the
increasing supersaturation (Fawell and Watling, 1998).

31
Intensity "Final intensity"
Crystal growth rate, R
"Induction time", %
time Figure 2-6. A chematic for the measurement of nucleation and growth rate. Three
characteristic quantities are defined as follow: the crystal growth rate is the slope
of the curve at the inflection point; the nucleation induction time is the
intersection f a straight line with slope through the inflection point with the time
axis; the final intensity is the asymptotic limit of the curve. (Dhont et al., 1992)
References
Asakura, S. & Oosawa, F. On interaction between two bodies immersed in a solution of macromolecules, J. Chem. Phys. 22, 1255-1256.
Augspurger, J. D. & Scheraga, H. A. (1996). An efficient, differentiate hydration potential for peptides and proteins, J". Comput. Chem. 17(13), 1549-1558.
Becker, T. & Lawlis Jr., V. B. (1991). Subtilisin crystallization process, United States Patent (5,041,377).
Belter, P. A., Cussler, E. L. & Hu, W. (1988). Bioseparations— downstream processing for biotechnology. John Wiley & Sons, New York.
Bott, R. (1997). Personal communication.
Brown, W. (1996). Light Scattering: Principles and Development. Oxford Science Publications, New York.
32
Butler, L. G. & Rupley, J. A. (1967). Binding of saccharide to crystalline and soluble lysozyme measured directly and through solubility studies. J. Biol. Chem. 242(5), 1077-1078.
Brunger A. T. (1987) X-Plor: A System for X-ray Crystallography and NMR, Yale University Press, New Haven, CT.
Cacacem, M. G., Landau, E. M. & Ramsden, J. J. (1997). The Hofineister series: salt and solvent effects on interfacial phenomena. O. Rev. Biophys. 30(3), 241-277.
Carbonnaux, C., Ries-Kautt, M. & Ducruix, A. (1995). Relative effectiveness of various anions on the solubility of acidic hypoderma lineatum collagenase at pH7.2. Protein Sci. 4, 2123-2128.
Chiew, Y. C., Kuehner, D., Blanch, H. W. & Prausnitz, J. M. (1995). Molecular thermodynamics for salt-induced protein precipitation. AIChEJ. 41(9), 2150-2159.
Chothia, C. (1974). Hydrophobic bonding and accessible surface area in proteins. Nature, 248, 338-339.
Chryssomallis, G.S., Torgerson, P.M., Drickamer, H.G., & Weber, G. (1981). Effect of hydrostatic pressure on lysozyme and chymotrypsinogen detected by fluorescence polarization. Biochemistry, 20, 3955-3959.
Cohn, E. J. (1925). The physical chemistry of the proteins. Physiol. Rev. 5, 349-437.
Collins, K. D., & Washabaugh, M. W. (1985). The Hofineister of effect and the behavior of water at interfaces. Q. Rev. Biophys. 18(4), 323-422.
Creighton, T. E. (1993). Proteins—Structures and Molecular Properties, W.H. Freeman and Company, New York.
Curtis, R. A., Prausnitz, J. M. & Blanch, H. W. (1998). Protein-protein and protein-salt interactions in aqueous protein solutions containing concentrated electrolytes. Biotechnol. Bioeng. 57, 11-21.
Dhont, J., Smits, C. K. G. & Lekkerkerker, H. N. W. (1992). A time resolved static light scattering study on nucleation and crystallization in colloidal system. J. Colloid Interface Sci. 152(2), 386-401.
Ducruix, A. &, Giege, R. (1992). Crystallization of Nucleic Acids and Protein, a practical approach. Oxford University Press, New York.

33
Eisenhaber, F. & Argos, P. (1993). Improved strategy in analytic surface calculation for molecular systems: handling of computational efficiency. J. Comput. Chem. 14(11), 1272-1280.
Eisenhaber, F., Lijnzaad, P., Argos, P., Sander, C. & Scharf, M. (1995). The double cube lattice method for efficient approaches to numerical integration of surface area and volume and to dot surface contouring of molecular assembles. J. Comput. Chem. 16 (3), 273-284.
Fawell, P. D. & Watling H. R. (1998). Multi-angle laser light scattering to measure nucleation induction periods. Appl. Spectrosc. 52(8), 1115-1117.
Fushiki, M., Svensson, B., Jonsson, B. & Woodward, C. E. (1991). Electrostatic interactions in protein solution — a comparison between Poisson-Boltamann and Monte Carlo calculations. Biopolymers, 31,1149-1158.
George A and Wilson W.W. (1994) Predicting protein crystallization from a dilute solution property, Acta Cryst. D50, 361-365
George, A., Chiang, Y., Guo, B., Arabshahi, A., Cai, Z. & Wilson W. W. (1997). Second virial coefficient as predictor in protein crystal growth. Methods Enzymol. 276, 100-110.
Gerstein, M. & Levitt, M. (1998). Simulating water and the molecules of life. Sci. Am. Nov., 101-105
Gibson, K. D. & Scheraga H. A. (1967). Minimization of polypeptide energy, I. preliminary structures of bovine pancreatic ribonuclease S-peptide. Proc. Natl. Acad. Sci. USA, 58, 420-427.
Green, A. A. (1932). Studies in the physical chemistry of the proteins, X: The solubility of hemoglobin in solutions of chlorides and sulfates of varying concentration. J. Biol. Chem. 95, 47-66.
Gro(3, M. & Jaenicke, R. (1991). Growth inhibition of lysozyme crystals at high hydrostatic pressure. FEBS Lett. 284, 87-90.
Gro(3, M. & Jaenicke, R. (1993). A kinetic model explaining the effects of hydrostatic pressure on nucleation and growth of lysozyme crystals. Biophys. Chem. 45, 245-252.
Gross, M & Jaenicke R. (1994). Proteins under pressure. The influence of high hydrostatic pressure on structure, function and assembly of proteins and protein complexes. Eur. J. Biochem. 221(2), 617-30.

34
Guilloteau, J., Ries-Kautt, M. M. & Ducruix, A. F. (1992). Variation of lysozyme solubility as a function of temperature in the presence of organic and inorganic salts. J. Cryst. Growth, 122, 223-230.
Hamaguchi, K. & Sakai, H. (1965) Structure of lysozyme (DC): effect of temperature on the conformation of lysozyme, J. Biochem. 57, 721-732.
Hamaker, H. C. (1937). The London-van der Waals attraction between spherical particles, Physica IV, 10, 1059-1071.
Hill, T. L. (1987). Statistical Mechanics. Principles and Selected Application. Dover, Mineola, NY.
Herdman G. & Neilson, G. (1990) Neutron scattering studies of aqua-ions, J Molecular Liquids, 46, 165-179.
Hofineister, F. (1888). Zur Lehre von der wirkung der Salze. Arch. Exp. Pathol. Pharmakol. 24, 247.
Honig, B. & Nicholls, A. (1995). Classical electrostatics in biology and chemistry. Science (Washington, D.C.), 268, 1144-1149.
Israelachvili, J. (1991). Intermolecular & Surface Forces, 2nd edition, Academic Press Limited, San Diego, CA.
Kratochvil, P. (1987). Classical Light Scattering from Polymer Solution, Elselvier Science Publishing Company INC., New York, NY.
Krivacic, J. & Rupley, J. A. (1968) Comparison of protein structures in the crystal and in solution. VI. Volume change in the crystallization of horse methemoglobin. J. Mol. Biol. 35(3), 483-488.
Kuntz, I. D. & Kauzmann, W. (1974). Hydration of proteins and polypeptides. Advan. Protein Chem. 28, 239-347.
Leberman, R. & Soper A. K. (1995) Effect of high salt concentration on water structure, Nature, 378, 364-366.
Lee, B. & Richards, F. M. (1971). The interpretation of protein structures: Estimation of static accessibility. J. Mol. Biol. 55, 379-400.
Matthews, B.W. (1968). Solvent content of protein crystals. J. Mol. Biol., 33, 491-497.

35
Melander, W. & Horvath, C. (1977). Salt effects on hydrophobic interaction in precipitation and chromatography of proteins: an interpretation of Iyotropic series. Arch. Biochem. Biophys. 183,200-215.
Mersmann, A. (1994). Crystallization technology handbook. Marcel Dekker Inc., New York.
Miyazawa, S. & Jemigan, R. L. (1985). Estimation of effective interresidue contact energies from protein crystal structures: Quasi-chemical approximation. Macromolecules, 18, 534-552.
Morild, E. (1981). The theory of pressure effects on enzymes. Advan. Protein Chem. 34, 93-166.
Nir, S. (1976). Van-der Waals interactions between surfaces of biological interest. Prog. Surf. Sci. 8, 1-58.
Nozaki, Y. & Tanford, C. (1971). The solubility of amino acids and two glycine peptides in aqueous ethanol and dioxane solution. J. Biol. Chem. 246, 2211-2217.
Ooi, T., Oobatake, M., Nemethy, G. & Scheraga, H. A. (1987). Accessible surface areas as a measure of the thermodynamic parameters of hydration of peptides. Proc. Natl. Acad. Sci. USA, 84, 3086-3090.
Perutz, M. F. & Mathews, F. S. (1966). X-ray study of azide methemoglobin. J. Mol. Biol. 21, 199-202.
Poillon, W. & Bertles, J. (1979). Deoxygenated sickle hemoglobin—effects of Iyotropic salts on its solubility. J. Biol. Chem. 254, 3462-3467.
Qasim, M. A. & Salahuddin, A. (1981). Influence of salts of Hofineister series on the salting-out of bovine & buffalo serum albumins. Indian J. Biochem Biophys, 18, 393-397.
Randolph, A. D. & Larson, M. A. (1988). Theory of particulate processes. Academic press Inc.
Ries-Kautt, M. & Ducruix, A. (1989). Relative effectiveness of various ions on the solubility and crystal growth of lysozyme. J. Biol. Chem. 264, 745-748.
Ries-Kautt, M. & Ducriux, A. (1991). Crystallization of basic protein by ion pairing, J. Cryst. Growth, 110, 20-25.
Roth, C. M., & A. M. Lenhoff (1996) Improved Parametric Representation of Water Dielectric Data for Lifshitz Theory Calculations. J. Colloid Interface Sci., 179(2), 637-639.

36
Rupley, J. A. (1969) The comparison of protein structure in the crystal and in solution. Structure and Stability of Biological Macromolecules. edited by S.N. Timasheff and G.D. Fasman, Marcel Dekker,Inc. New York.
Saikumar, M. V., Glatz C. E. & Larson M. A. (1995). Crystallization of lysozyme at high pressure. J. Cryst. Growth, 151, 173-179.
Saikumar, M. V., Glatz, C. E. & Larson, M. A. (1998). Lysozyme crystal growth and nucleation kinetics. J. Cryst. Growth, 187, 277-288.
Salahuddin, A., Irshad, M. & Qasim, M. A. (1981). Buffalo Immunoglobulin G—effect of Iyotropic salts on its solubility. Indian J. Biochem. Biophys. 18, 317-321.
Schall, C., Wiencek, J., Yarmush, M. & Arnold, E. (1994). Lysozyme crystal growth reduced at high pressure. J. Cryst Growth, 135(3-4), 548-554.
Sliih, Y. C., Prausnitz, J. M. & Blanch, H. W. (1992). Some characteristics of protein precipitation by salts. Biotechnol. Bioeng. 40, 1155-1164.
Sun, S. F. (1994). Physical Chemistry of Macromolecules: Basic Principles and Issues. John Wiley & Sons INC., New York, NY.
Suzuki, Y., Miyashita, S., Komatsu, H., Sato, K. & Yagi, T. (1994). Crystal growth of hen egg white lysozyme under high pressure. Japanese J. Appl. Phys. 33, 1568-1570.
Takano, K. J., Harigae, H., Kawamura, Y. & Ataka, M. (1997). Effects of hydrostatic pressure on the crystallization of lysozyme based on in situ observations. J. Cryst. Growth, 171, 554-448.
Tromp R. H., Neilson, G.W. and Soper, A.K. (1992) Water structure in concentrated lithium chloride solutions, J Chem. Phys. Vol. 96, No. 11, 8460-8469
Ullner, M., Wood ware, C. E. & Josson, B. (1996). A Debye-Huckel theory for electrostatic interactions in proteins. J. Chem. Phys. 105(5), 2056-2065.
Van Holde, K. E., Johnson, W. C. & Ho, P. S. (1998). Principles of Physical Biochemistry, Prentice-Hall Inc., Upper Saddle Revier, New Jersey.
Von Hippel, P.H. & Schleich, T. (1969). The effects of neutral salts on the structure and conformational stability of macromolecules in solution. Structure and Stability of Biological Macromolecules, edited by S.N. Timasheff and G.D. Fasman, Marcel Dekker.Inc. New York.
Veelser, S., Lafont, A., Marcq, S., Astier, J. P. & Boistelle, R. (1996). Prenucleation, crystal growth and polymorphism of some proteins, J. Cryst. Growth, 168, 124-129.

37
Verwey E. J. W. & Overbeek J. T. K. (1948). Theory of Stability ofLyophobic Colloids, Elsevier, Amsterdan.
Vila, J., Williams, R. L., Vasquez, M. & Scherage, H. A. (1991). Empirical solvation models can be used to differentiate native from near-native conformations of bovine pancreatic trypsin inhibitor. Protein: Struct. Funct. Genet. 10, 199-218.
Vilker, V. L., Colton, C. K. & Smith, K. A. (1981). The osmotic pressure of concentrated protein solutions : Effect of concentration and pH in saline solution of bovine serum albumin. J. Colloid Interface Sci. 79(2), 548-565.
Visuri, EC, Kaipainen, E., Kivimaki, J., Niemi, H., Leisola, M. & Palosaari, S. (1990). A new method for protein crystallization using high pressure. Bio/Technology, June, 547-549.
Waghmare, R. Y., Webb, J. N., Randolph, T. W., Larson, M. A. & Glatz, C. E. (2000). Pressure dependence of subtilisin crystallization kinetics. J. Cryst. Growth, 208(1-4), 678-686.
Wang, Y., Zhang, H. & Scott, R. A. (1995). A new computational model for protein folding based on atomic solvation. Protein Sci. 4, 1402-1410.
Warshel, A. & Aquist, J. (1991). Electrostatic energy and macromolecular function. Annu. Rev. Biophys. Biophys. Chem., 20, 267-298.
Weber, G. (1992). Protein Interactions, Chapman and Hall, New York, 235-270.
Wiencek, J. M. & Darcy P. A. (1997). Effect of electrolyte on the enthalpy of crystallization of lysozyme. Spacebound 97 Conference Proceedings.
Xu, D., Lin, S. C. and Nussinov, R. (1997a) Protein binding versus protein folding: the role of hydrophilic bridges in protein associations, J. Mol. Biol., 265. 68-84.
Xu, D., Tsai, C. & Nussinov, R. (1997b). Hydrogen bonds and salt bridges across protein-protein interfaces. Protein Eng. 10(9), 999-1012.
Young, L., Jemigan, R. L. & Covell, D. G. (1994). A role of surface hydrophobicity in protein-protein recognition. Protein Sci. 3, 717-729.
Zimm, B. H. (1948). The scattering of light and the radial distribution function of high polymer solutions. J. Chem.Phys. 16, 1093-1099.

38
CHAPTER 3. SOLVENT EFFECTS ON THE GROWTH
KINETICS OF SUBTILISIN CRYSTALS
A manuscript submitted for publication to the Journal of Crystal Growth
X. Pan and C. E. Glatz
Department of Chemical Engineering, Iowa State University, Ames. IA 50011
Abstract
The effects of salts on subtilisin crystallization were investigated. Three kinds of
salts, NaCI, NaNOg and NaSCN were selected to study the effects of different anions on
growth kinetics of three subtilisin mutants, Properase®, Purafect® and Purafect®OX. The
effectiveness of salts in decreasing the solubility of Properase® and Purafect® subtilisin
followed the reverse order of the Hofmeister series: SCN">NO]">Cr. The average length and
diameter of crystals were measured during crystallization. The nature of salt changed the
length/diameter ratio of crystals, indicating the changes in the relative growth rate of
different crystal faces. The required supersaturation (c-s)/s for a given growth rate increased
with the order of NaCI, NaNOa and NaSCN. The observed trend in required supersaturation
was counter to that expected from the solubility data. Three possible reasons were
hypothesized and then the effect of anion on protein growth was related to the molar Gibbs
free energy of hydration of the anion.

39
Introduction
As a separation and purification method, protein crystallization has been widely
studied for more than a century. With the application of X-ray diffraction in structural
biology, producing good quality crystals is always a critical step for determining protein
structures. However, the complexity of proteins has left protein crystallization not as well
understood as crystallization of small inorganic molecules [1].
Since most proteins exist in aqueous solutions, crystallization from solution is the
usual procedure. In a protein solution, water is found buried within the protein, bound as a
hydration shell at the surface of the protein and as bulk water [2]. During crystal growth, the
hydration shell of an individual protein molecule merges with the hydration shell of the
crystal lattice and part of the bound water molecules will be dissociated [3]. This
dissociation step gives water a role in crystallization energetics. Protein hydration depends
on temperature, pressure, the surface properties of the protein, and the additional solutes that
together with water comprise the bulk solvent. In this work, through selection of different
salts and a series of point mutations in the protein, we focus on the last two factors to explore
the role of water in protein crystallization.
Characterization of the effectiveness of various salts in crystallizing (salting out)
proteins can be traced to 1888 [4,5] when Hofmeister established the lyotropic series that
ranked various salts according to their ability to precipitate hen egg white proteins.
• cations : Li+>Na+>K+>NH4+>Mg2+
• anions: SO^HPO^CHaCOO^CeHsOv^CaHzO^HCOa^CrO/^Cr
>N03»C103>SCN"

40
Later on, as reviewed by Collins and Washabaugh [5] and Cacacem et al. [6], many
biological phenomena were related to the lyotropic series. Further testing by the
crystallization of other proteins, e. g. IgG, hemoglobin, albumin, lysozyme, a-amylase,
lineatum [7-15] showed that the lyotropic series is not always followed. For acidic proteins
in basic buffers, the effectiveness of various salts usually follows the lyotropic series, except
for the relative positions of some salts. For basic proteins in acidic buffers, e.g. lysozyme,
the cations follow the lyotropic series, but the anions influence solubility according to the
reverse order of the lyotropic series. Moreover, anions have more profound effects than
cations [13]. The larger effect of anions may be explained by the electrostatic interactions
between anions and positively charged protein molecules when the protein is in a buffer with
lower pH than its isoelectric point.
Melander and Horvath [16], adapting Sinanoglu's solvphobic theory to approximate
the effect of salts on protein solubility, derived a relationship between the apparent salting-
out constant and the molar surface tension increment of the salt. Ries-Kautt et al. [13]
proposed that ion pairing between anions and positively charged residues of proteins would
be the reason for the different effectiveness of SCN~ and CI" in decreasing the solubility of
lysozyme. However, they only classified anions in terms of Pearson's theory [17] and did
not define the classification of the charged residues. Collins [18] elucidated the origin of ion
pairing preferences. Ions can be categorized into kosmotropes and chaotropes on the basis of
the strength of ion-water interactions. Kosmotropes are small ions with high charge density
that bind water molecules strongly, decreasing the mobility of nearby water molecules.
Chaotropes are large monovalent ions with low charge density that bind water weakly
relative to the strength of water-water interaction [19]. Formations of both small-small ion

41
pairs and large-large ion pairs are energetically favorable because, in both cases, removal of
water leads to stronger interactions between ion pairs than between ion and water [18].
Therefore, ions tend to aggregate according to their size in a solution: ions form the stronger
interaction with other ions with the opposite sign and comparable size. Since charged side
chains of proteins are classified as large ions with low charge density, Arg, His and Lys side
chains are chaotropes when they are present as cations in solution [18]. Among chaotropic
ions, SCN" has weaker interaction with water than Cl", but SCN" would form stronger
interaction with the positively charged side chain (Arg+, His+, and Lys*). Thus ion pairing
would be a reason for the high effectiveness of SCN" in decreasing the solubility of
lysozyme.
To date research on the effects of salts on protein crystallization has focused on
protein solubility (thermodynamics) rather than growth rate (kinetics). Only a few studies
were conducted for investigating the effects of ionic strength on the growth of protein
crystals [20-22]. And the effects of the nature of salts on growth kinetics of protein crystals
were seldom touched. Studies on crystallization of small molecules [23] showed that there
are two effects exerted by salt on crystal growth rates: either a thermodynamic effect when
the change of solubility (i. e. driving force) is dominant, or a kinetic effect when other kinetic
factors, e.g. blocking of crystal surface, override the change of solubility. The same effects
were also observed for protein crystal growth. Forsythe and coworkers [20] found that both
solubility and growth rate of lysozyme decrease with increasing NaCI concentration. The
growth rate versus supersaturation curve shifts to high supersaturation as NaCI concentration
increases, indicating the kinetic effects of NaCI are dominant during lysozyme
crystallization. Gallagher et al. [21] found the morphology of subtilisin crystals changes

42
from a thin plate to an isometric bar when the concentration of ammonium sulfate increases,
which meant the relative growth rate of subtilisin crystals changed with ionic strength. One
of the crystal contacts was held responsible for the sensitivity of crystal growth rates to ionic
strength. However, this sensitivity to ionic strength can be diminished by changing an amino
acid involved in the particular crystal contact [22].
Crystallization growth kinetics is commonly expressed as [24] :
G = ̂ = kG(—)' (3-1) at s
where G is the growth rate; L is the length of crystal; (c-sj/s is a measure of dimensionless
supersaturation as the difference between the solution concentration , c, and the solubility, s;
ko is the growth rate constant and b is the growth power. The previous studies show salts
affect not only protein solubility but also their morphology (i.e. the relative growth rate). To
compare the growth kinetics of protein of different morphologies, a modified expression for
growth rate is used in our paper:
G'=Ï75Î (M)
where L/D is the length/diameter ratio of crystals during crystallization, G ' is the volumetric
growth rate per unit crystal surface.
In this paper, we focus on the effects of the nature and concentration of monovalent
anions on the growth rate of subtilisin. Three salts, NaCI, NaNO] and NaSCN, were selected
for our investigation. The reasons for the selection of these three particular anions, Cl", NO3",
and SCN", are that they are all monovalent and present as fully ionized species in solution.
The effect of the nature of salt is related to the solution properties of the anion.
Crystallization of three subtilisin mutants, Properase®, Purafect® and Purafect® OX was

43
followed. A later paper will pursue the influences of the surface differences among these
three mutants on their crystallization behavior.
Materials and methods
Materials
Properase®, Purafect® and Purafect® OX subtilisin derived from Bacillus lentus were
provided by Genencor International (Palo Alto, CA). They are serine proteases of269 amino
acids, molecular mass of 27,000 Da, produced commercially for use in liquid detergent
formulation [25]. Each mutant was twice recrystallized and redissolved in 8% sodium
formate and 50% propylene glycol in preparation for our crystallization studies. Reagent
grade sodium salts of chloride, acetate, nitrate and thiocyanate, calcium chloride and
molecular biology grade Tris were purchased from Fisher Chemicals (Fair Lawn, NJ).
Polyoxyethylenesorbitan monooleate (Tween-80) and dimethyl sulfoxide (DMSO) were
purchased from Sigma Chemical Company (St. Louis, MO), whereas the substrate for
determining the activity of subtilisin (sAAPFpNA) was purchased from BACHEM
bioscience Inc. (King of Prussia, PA). Water was purified by passing through a Bamstead
Nanopure II system.
Methods
All the experiments were performed in lOmM sodium acetate, pH=5.5 buffer at
ambient pressure and temperature (23 °C).
(I) . Protein assay
The protein concentration in solution was determined by a protease assay [26]. The
enzyme was diluted with 0.1 M Tris, 0.01 M CaCh, 0.005% Tween-80, pH=8.6 dilution

44
buffer. A 1.5-mL semi-micro cuvette (Bio-Rad Laboratories, Hercules, CA) containing 980
\xL reaction buffer (0.1 M Tris, 0.005% Tween-80, pH=8.6), 10 (J.L substrate (1.2mM
sAAPFpNA dissolved in DMSO) and 10 pL enzyme solution was put in a spectrophotometer
(U-2000, Hitachi Ltd, Tokyo, Japan) for monitoring the rate of change of absorbance. The
protease concentration was determined according to the following correlation:
Protease concentration (g/L) = A xDFxCF (3 -3 )
where A is the change rate of absorbance (min"1), DF is the dilution factor and CF is the
conversion factor. The conversion factors provided by Genencor International of Properase®,
Purafect® and Purafect ®OX were 0.032, 0.059 and 0.80 g-min/L, respectively.
(2). Solubility measurement
The sodium formate and propylene glycol were removed from the protein stock
solutions by diafiltration with lOmM pH=5.5 sodium acetate buffer (10K MWCO OMEGA
low protein-binding polyethersulphone membrane, Pall Filtron, Northborough, MA). Protein
was then concentrated to the desired stock concentration (Properase® ~ 75 mg/ml, Purafect®
and Purafect® OX ~ 50 mg/ml) using the same ultrafiltration cell. 5M NaCI, 5M NaNOg and
5M NaSCN salt stock solutions were prepared in 10 mM pH=5.5 sodium acetate buffer. Salt
solutions and protein solutions were filtered through 0.22 jam filters (jaStar cellulose acetate,
Costar, Cambridge, MA). Crystallization followed mixing of the appropriate amounts of
protein and salt stock solutions. Solubility of subtilisin was determined at various salt
concentrations, for three salts and three subtilisin mutants (Table 3-1).
To decrease the crystallization time, the measurement of solubility was divided into
two steps. The first step was to produce crystal seeds by crystallization from a supersaturated

45
Table 3-1. Salt and mutation dependence of subtilisin solubility
Salt Solubility3 of subtilisin (mg/ml)
Nature Concentration (M) Properase® Purafect® Purafect® OX
NaCI 0.1 21.9±1.0b - -
0.2 9.5±0.8 5.O±O.3 1.9±0.3
0.5 8.Î+O.2 2.6+0.4 Î.4+O.Î
0.8 - 1.7±0.2 1.0±0.1
1.0 4.0±0.4 - -
1.5 3.4±O.2 - -
NaNOs 0.1 17.8±1.2 - -
0.2 8.2±1.3 3.2+O.2 2.8±0.1
0.5 6.7±0.8 2.6±0.1 Î.9+O.2
0.8 7.1+1.0 2.9±0.2 2.4±0.1
1.0 8.1±1.0 - -
NaSCN 0.05 21.1±0.6 - -
0.1 8.7±1.7 3.9+O.7 -
0.2 4.5+O.3 2.3±O.3 -
0.5 3.4+0.4 1.1±0.1 -
a Conditions: 23 °C, pH 5.5, lOmM sodium acetate buffer. b The standard deviation over three replicates.

46
solution of the appropriate salt and an initial protein concentration of 50 mg/ml (Properase®)
or 40 mg/ml (Purafect® and Purafect® OX). The supersaturated solution was added to a 0.5
ml polypropylene microcentrifuge tube (Intermountain Scientific Corporation, Kaysville,
UT) and then tumbled gently (LabQuake shaker, Labindustries, INC). After three days, the
supernatant and crystals were separated by centrifiigation. The crystals were used to seed 0.5
ml of supersaturated solution at the same salt concentration and an initial protein
concentration of 30 mg/ml (Properase®) or 15 mg/ml (Purafect® and Purafect® OX) in the
same microcentrifuge tube, which was then mixed as before for 2 weeks. Concentration of
supernatant was measured weekly until the concentration remained constant. The final value
was considered as the protein solubility.
(3). Growth rate measurement
The preparation of protein solutions and salt solutions was the same as that described
in the measurement of solubility. As for solubility, the measurement of growth rate in batch
crystallization was studied as affected by the nature of salt, salt concentration and protein
mutation.
The initial supersaturated solution (8 ml), with desired protein and salt
concentrations, was divided. Three milliliters was placed in a Falcon plastic petri dish
(35mm in diameter), the lid was sealed by PTFE thread-sealing tape, and the dish was put
under a microscope (Nikon Optiphot-2, Fryer Company INC., MN) to follow growth of
individual crystals. Since subtilisin crystals are rod-like, both lengths and diameters of
crystals were measured by an image analysis system (Image-Pro Plus 4.0, Media
Cybernetics, MD) connected to the microscope. An empirical growth rate expression was

47
determined by fitting the observed length-time curve and diameter-time curve with
Chebyshev polynomials using FORTRAN NAG subroutine E02AGF.
The remainder of the supersaturated solution was divided into five 1-ml samples
placed in individual wells of a polystyrene tissue culture plate (CoStar ®,Coming
Incorporated, Corning, NY) providing for five concentration vs. time samples in parallel with
the crystal growth rate determination. Timed samples were transferred to 1.5-ml
microcentrifuge tubes, supernatant and crystals were separated by centrifiigation, and the
concentration of supernatant determined by the protease assay. The concentration-time curve
was also fit with a Chebyshev polynomial. Finally, the dependence of growth rate on
supersaturation was obtained by crossplotting the growth rate and concentration vs. time
data.
Results
Solubility
Solubility results for subtilisin from sodium salts of three different anions are given in
Table 3-1. The measurement accuracy is estimated at ± 3-20%. Solubility of Properase®
subtilisin generally decreases with increasing salt concentration. The solubility of
Properase® in NaSCN solution is the lowest for the same anion concentration. There is no
significant difference between the solubilities in NaCI and NaNO] solutions. It was noted
that the solubility of Properase® in NaNOg solution at first decreased with increasing salt
concentration and then increased at higher salt concentration. Similar results were observed
in the measurement of Purafect® and Purafect® OX solubilities.

48
In the same salt solution, the relative solubilities of the three subtilisins showed the
same progression with the solubility of Properase® subtilisin being far larger than that of the
other two mutants. Purafect® and Purafect® OX have only a single amino acid difference
(Asn74 —> Asp 74), while Purafect® and Properase® have three different residues (Ser 85 —>
Asn 85, Ser 99 —> Gly 99 and Val 102 —> Asn 102). The results show as much as a four-fold
change in solubility for the small number of substitutions.
Crystal morphology
Both salts and mutations had a significant influence on crystal morphology. Figure 3-
1 shows the crystals of the three subtilisin mutants in the three salt solutions. All of the
crystals are rod-like and the two short dimensions are roughly equal, so only two
characteristic dimensions, length (£) and diameter (£>), were measured. The L/D ratio and its
standard deviation among crystals of various mutants in different salt solutions are shown in
Table 3-2. The standard deviation of L/D ratio was within 10 ~ 20%, except for Properase®
in 0.5M NaSCN solution (standard deviation of L/D = 36%) and Purafect® in 0.8M NaNO]
solution (standard deviation of L/D = 24%). Therefore, it was assumed that the L/D ratio of
crystals was constant during crystal growth.
As indicated in Table 3-2, the L/D ratio of subtilisin crystals increased with the
sequence of NaCI < NaNOg < NaSCN. For Properase® crystals in NaNOg solution, salt
concentration also has significant influence on the L/D ratio. Crystals in 0.2M NaNOs
solution had lower L/D ratio (-7.5) than those in 0.5M and 0.8M NaNOs solution (~11).
Grown from the same salt solutions, Properase® crystals had much lower L/D ratio than

49
Figure 3-1. Micrographs of crystals of the three subtilisin mutants in three salt solutions. A
and C are Properase® crystals in 0.5M NaCI and NaNO], respectively; B and D
are Purafect® crystals in 0.5M NaCI and NaNOs, respectively.

50
Figure 3-1. (continued) Micrographs of crystals of the three subtilisin mutants in three salt
solutions. E anf F are Properase® and Purafect® crystals in 0.5M NaSCN,
respectively; G and H are Purafect® OX crystals in 0.5M NaCI and NaNOg,
respectively.

51
Table 3-2. Length/Diameter ratio of crystals of three subtilisin mutants in various salt
solutions
Salt Length/Diameter ratio
Nature Concentration (M) Properase® Purafect® Purafect® OX
NaCI 0.2 3.5±0.6a 13.1±1.9 14.4±2.3
0.5 4.3+0.8 13.6±2.6 Î3.3+2.O
0.8 4.1+0.7 14.6±2.0 11.8±1.5
NaNO] 0.2 7.4+1.1 31.3+4.2 29.7±2.8
0.5 H.4+Î.7 37.2+4.O 28.9±3.4
0.8 11.1±1.8 39.4+9.6 31.1 ±4.1
NaSCN 0.5 34.5+Î2.7 52.2+ÎO.Î -
a The standard deviation over all crystals (40 ~ 180 crystals) measured during one batch crystallization.
Purafect® and Purafect® OX. Purafect® and Purafect® OX from NaCI solutions were similar;
however, the L/D ratio of Purafect® was higher from NaNOj solutions. Properase®, the most
different in L/D, has the greater number of surface residue differences also.
Growth kinetics
By microscopy, it was noted that during batch crystallization no new nuclei were
observed once measurable crystals were visible and that there was no significant growth
dispersion, i.e. the dimensions of all crystals in a batch at any time were very similar. Hence,
it was assumed that the crystals nucleated during a very short period after the salt solution
was added into the protein solution and that growth rate could be based on measures of the

52
average length and diameter of 8~10 randomly selected crystals. The relative standard
deviation in measurement of crystal length and diameter of the sampled crystals at a given
time was less than 5% and 20%, respectively. The large deviation in measuring the crystal
diameter reflects the fact that it is an average of the two dominant cross-sectional
dimensions.
Figure 3-2 shows the dependence of growth rate of Properase® subtilisin on
dimensionless supersaturation (c-s)/s. Generally, high supersaturation corresponded to high
growth rate, and the dependence of growth rate on supersaturation decreased with increasing
supersaturation. The effects of salt and salt concentration on crystal growth are also shown
in Figure 3-2. If one compares the salt effects by noting the required supersaturation for a
given salt to attain the same growth rate as the others (basing the comparison on the lower
growth rates reached in all salts), the required supersaturation for a given growth rate
increased in the order of NaCI < NaNOg < NaSCN, except for the 0.2M NaNOg result,
regardless of dimension. However, magnitudes of the growth rate in the length direction
were similar, whereas they differed widely in the diameter dimension. Except for the 0.2M
NaNOs result, the diameter-dimension growth rates in NaNOj and NaSCN solution were less
than 0.7 pjn/hr while the growth rates in NaCI solutions reached 4.5 jom/hr.
Figures 3-3 and 3-4 show that the growth rates of Purafect® and Purafect® OX
crystals in various salt solutions show the same trends as were seen for Properase® (Figure 3-
2). The required supersaturation for a given growth rate (including dL/dt, dD/dt and G')
increased with the order of NaCl<NaN03<NaSCN, except the growth in 0.2M NaNOg which
was close to the growth in NaCI. For Purafect® OX, with the exception for 0.8M NaCI, the
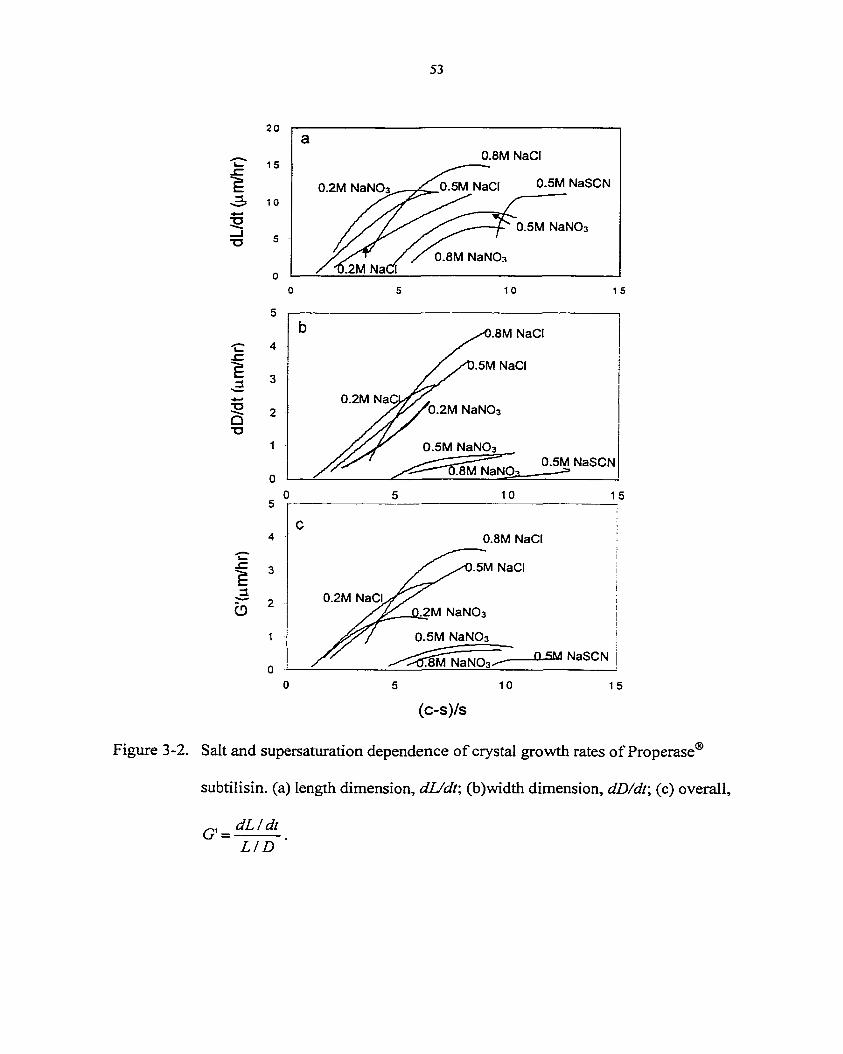
53
1
5 "O
1 a
§ T3
2 0
1 5
1 0
a 0.8M NaCI
0.2M NaNOa^— ̂ ^0.5M NaCI 0.5M NaSCN
0.5M NaNOa
Z 0.8M NaNO* Z1X2M NaCI
1 0 1 5
1
5
5
4
3
2
1
0
5
4
3
2
1
0
b ^0.8M NaCI
y^Zt).5IVI NaCI
0.2M NaO/ Vb^M NaNOa
0.5M NaNOa 0.5M NaSCN
^—08M NaNOa___—
1 0 15
0.2M NaCI
0.8M NaCI
-5M NaCI
2M NaNOs
0.5M NaN03
-£L5M NaSCN
10 1 5
(c-s)/s
Figure 3-2. Salt and supersaturation dependence of crystal growth rates of Properase®
subtilisin. (a) length dimension, dL/dt\ (b)width dimension, dD/dt\ (c) overall,
dL/dt G' = L I D

54
2.5
E 15
>5: CD 1
0.5
0.2M NaNOa 0.5M NaN03
,5M NaCI
0.8M NaCI
0.8M NaNOa
0.2M NaCI
0.5M NaSCN
NaNOa
8M NaCI
NaNOa
NaNOa
NaSCN
0.2M NaCI, 0.2M NaNOa
8M NaCI
,5M NaCI
0.5M NaNOa
0.8M NaNOa
0.5M NaSCN
20 25 30 0 5 10 15
(c-sVs
Figure 3-3. Salt and supersaturation dependence of crystal growth rates of Purafect®
subtilisin. (a) length dimension, dL/dt\ (b)width dimension, dD/df, (c) overall,
dL/dt G' = L / D

55
70
60
g" 50
E 40
0.8M NaNOa
3
5 "O
30
20
10
0
3
2.5
2
1.5
§ 0.5
3
2.5
2
| 1.5
•3? 1
° 0.5
0
0.2M
NaNOa
5M NaNOa
0.8M NaCI
10 20 30 40 50
b °-5M NaCI o.2M NaNOa
i 0.5M NaNOa
0.2M NaCI
0.SNT NaNOa 0.8M NaCI
10 20 30 40 50
NaCI
0.2M NaN03>
0.2M NaCI NaNOa
0.8M NaCI
10 20 40 50
60
60
60 30
(c-s)/s
Figure 3-4. Salt and supersaturation dependence of crystal growth rates of Purafect® OX
subtilisin. (a) length dimension, dL/dt\ (b)width dimension, dD/dt\ (c) overall,
dL/dt G'
L / D

56
crystal growth rates for a given supersaturation in NaCI solutions were larger than in NaNOj
solutions.
4. Discussion
Solubilities of subtilisin in three salt solutions decreased with increasing salt
concentration, which is similar to observations for other proteins, including lysozyme, a-
chymotrypsin and bovine serum albumin [11,12]. The empirical correlation between protein
solubility, S, and salt concentration, Cs, is usually given by a linear equation of log S vs. Cs
[11]. Since the plot of log (subtilisin solubility) versus salt concentration was not linear
(Figure 3-5), no single salting-out constant can be given for each type of salt. The solubilities
of Properase® and Purafect® subtilisin in three salt solutions decreased in the order NaCI >
NaNO] > NaSCN. Similar trends have been reported for lysozyme and Erabutoxin [13].
Subtilisin (pi ~ 10) has a positive net charge at pH 5.5 and the anions are expected to
influence the protein solubility more effectively than cations [13]. Our results are consistent
with the previous observation that the effectiveness of anions for decreasing the solubility of
basic proteins in acidic buffers follows the reverse order of the Hofineister series, i.e. SCN>
N03> CI" [13]. Compared to lysozyme, the subtilisin's sensitivity to the nature of salt is
lower (Figure 3-5). SCN" causes more significant decrease for lysozyme.
The high effectiveness of SCN" in decreasing subtilisin solubility can be understood
from its effects on repulsive and attractive interactions between protein molecules. Cl", NO3"
and SCN" are all chaotropes as defined by Collins [18]. Moreover, since the standard partial
molar volumes of Cl", NO3" and SCN" are 23.3, 34.5 and 41.2 cm3/mol, respectively [27],

57
1 0 0
Properase , NaN03
10 E O) E
properase , NaCI
Properase , NaSCN g
!2 3
Lysozyme, NaCI o CO .ysozyme, NaN03
0.1 Lysozyme, NaSCN
0.01
0 0.5 1 1.5 2
Sait concentration (M)
Figure 3-5. Solubilities of Properase subtilisin and lysozyme in different salt solutions.
Solubility data for lysozyme are taken from Guilloteau et al. [12]. Open
symbols, lysozyme; closed symbols, subtilisin.

58
SCN" has the largest size and the lowest charge density (i.e. charge/volume). Hence, SCN" is
most chaotropic. At pH5.5, subtilisin is positively charged. The volumes of Arg+, His+ and
Lys+ are 104.3, 92.2 and 101.5 cm3/mol, respectively, so they are also chaotropes. The
theory of ion pairing shows ions aggregate according to opposite sign and comparable size.
Therefore, the interaction between SCN" and positively charged residues of subtilisin would
be the strongest and, thus, the most effective in decreasing the repulsive electrostatic
interactions between subtilisin molecules. Additionally, volume exclusion of ions leads to
the osmotic attraction between protein molecules [28]; therefore, SCN" would best enhance
this attractive term
The relative supersaturation required for effective crystallization (Figure 3-2, 3-3, 3-
4) of subtilisin from these salts was typical for protein crystal growth (>5). The plots of log
(growth rate) versus log (supersaturation) were not linear at high supersaturation. Similar
observations were reported for lysozyme [20], Purafect® subtilisin [29] and two small
biochemical solutes, Iovastain and asparagine [30]. Waghmare et al. [29] hypothesized that
the altered dependence of growth rate on supersaturation results from a change in the limiting
rate step - from mass transfer or solution growth unit formation at low supersaturation at low
supersaturation to lattice incorporation at high supersaturation.
Solubility affects growth rate by altering supersaturation in the equation of growth
kinetics (Eq. 1), so the reduction of solubility would increase supersaturation and be expected
to increase growth rate. However, our results show that the required supersaturation for the
same growth rate increased when the solubility decreased, which means the growth rate
constant in Eq. 1 decreased also. Therefore, the kinetic effect offsets the thermodynamic
effect. Such a situation was true for lysozyme [20], where both solubility and growth rate of

59
lysozyme decreased with increasing NaCI concentration for a given relative supersaturation
(c/s, in their case). The data of Figure 3-2 to 3-4 were replotted (not shown) using (c-s) as
the measure of supersaturation to see whether our conclusion was dependent on the choice.
The comparison of required supersaturation for the same growth rate still came out much the
same. The biggest shift one the supersaturation axis was for NaSCN but, in absolute terms,
growth rate is still lowest in NaSCN.
The decrease of the growth rate in the order of NaCI >NaNOs>NaSCN can be
interpreted in terms of the activation energy barrier for the incorporation of soluble
monomers into the crystal lattice and the competition among protein-protein, protein-water,
protein-ion and ion-water interactions.
1. Lower activation energy for the attachment of protein molecule to the crystal
surface in NaCI solution. Temperature dependence of growth rates reveal the activation
energy of crystal growth, but these were not in the scope of this work.
2. The competition between protein-protein and protein-anion interaction. In a
protein solution, anions may cover the surface of positively charged protein. Then
replacement of anion-protein with protein-protein bonds would play an important role in
crystal growth. Forsythe and Pusey [20] found that at high NaCI concentration, the CI" ion
apparently occupied all available sites on the soluble lysozyme surface, which caused the
growth of lysozyme to require higher supersaturation to obtaining the same growth rate in
NaCI solutions of increasing concentration. Previous investigations of the physical chemistry
of albumin solution [31, 32] showed that the numbers of CI" and SCN" binding to an albumin
molecule are 11 and 40, respectively. Therefore, SCN- may block the surface of protein

60
crystals more than the other anions (CI" and NO3"), resulting in the higher supersaturation
required for comparable growth rate (Figure 3-2 and 3-3).
3. The competition between protein-protein and protein-water interaction. Studies on
solvent effects on crystal growth of small molecules elucidated that hydrogen bonding
between the solvent and the crystal surface could block the crystal surface and reduce the
growth rate [33, 34]. The molar Gibbs energy of hydration of three ions, Cl", NO3" and SCN",
is —340, -300 and —280 kJ/mol [27], respectively, indicating the interaction between CI* and
water is most favorable for stripping solvent from the protein surface. Figure 3-6 shows the
required supersaturation for a given growth rate G' has a positive correlation with the molar
Gibbs energy of hydration of ions. The relative growth rate of different crystal faces changed
with the addition of different salts (Table 3-2 and Figure 3-2 ~ 3-4). The growth rates in both
length and diameter dimensions decreased in the order of NaCI > NaNOs > NaSCN, and the
diameter-dimension growth of crystals decreased more rapidly. This result shows that NaNOs
and NaSCN block the growth in diameter more effectively. Structural analysis of subtilisin
[35] shows that the number of Arg+and Lys+ residues in diameter-dimension contact regions
is larger than in the length-dimension contacts. Therefore, more NO3" and SCN" ions would
cover the diameter-dimension surface via ion-pairing.
5. Conclusions
The solubility of subtilisin decreased with the increasing salt concentration, following
the reverse order of the Hofineister order: SCN">N03 >C1". The required supersaturation for
the same growth rate of subtilisin crystals increased when solubility decreased, indicating the
kinetic and thermodynamic effects of salt on growth rate offset each other. NO3" and SCN"

61
significantly changed the L/D ratio of the crystals, indicating a change in the relative growth
rates of different crystal faces. Growth rate in different salts correlated with the Gibbs free
energy of hydration of the anion. The competition among protein, ion and water explains the
low crystallizability of subtilisin in NaSCN solution.
25 NaNO
NaSCN
20 E <N O II b £ "O £
NaCI 3 O" <u h_ c o
Properase' 2 3 a !2
Purafect
Q. Purafect OX 3 to
-350 -300 -250 -200
Molar Gibbs energies of hydration of ions, KJ/mol
Figure 3-6. The correlation between the molar Gibbs energies of hydration of ions and the
crystal growth rate of three subtilisin mutant in various salt solutions

62
Acknowledgements
This material is based on work supported in part by the National Science Foundation
under grant number BES-9510302. The authors would like to thank Todd Becker of
Genencor International, Inc. for the generous supply of subtilisin and Dr. Rex Lovrien of the
University of Minnesota for helpful scientific discussion.
References
[1]. S. Durbin, G. Feher, Protein crystallization, Annu. Rev. Phys. Chem. 47 (1996) 171.
[2]. M. Gerstein, M. Levitt, Simulating water and the molecules of life, Sci. Am. Nov (1998) 101.
[3]. M. Mathlouthi, J. Genotelle, Role of water in sucrose crystallization, Carbohydrate Polymers, 37 (1998) 335.
[4]. A. Ducruix, R. Giege, Crystallization of Nucleic Acids and Protein, a practical approach, Oxford University Press, New York, 1992.
[5]. K.D. Collins, M.W. Washabaugh, The Hofineister effect and the behavior of water at interfaces, Q. Rev. Biophys. 18 (1985) 323.
[6]. M.G. Cacacem, E.M. Landau, J.J. Ramsden, The Hofineister series: salt and solvent effects on interfacial phenomena, Q. Rev. Biophys. 30 (1997) 241.
[7]. A. Salahuddin, M. Irshad, M.A. Qasim, Buffalo Immunoglobulin G—effect of lyotropic salts on its solubility, Indian J. Biochem. Biophys. 18 (1981) 317.
[8]. W.N. Poillon, J.F. Bertles, Deoxygenated sickle hemoglobin—effects of lyotropic salts on its solubility, J. Biol. Chem. 254 (1979) 3462.
[9]. M.A. Qasim, A. Salahuddin, Influence of salts of Hofineister series on the salting-out of bovine & buffalo serum albumins, Indian J. Biochem. Biophys. 18 (1981) 393.
[10]. M. Ries-Kautt, A. Ducruix, Relative effectiveness of various ions on the solubility and crystal growth of lysozyme, J. Biol. Chem. 264 (1989) 745.
[11]. Y.C. Shih, J.M. Prausnitz, H.W. Blanch, Some characteristics of protein precipitation by salts, Biotechnol. Bioeng. 40 (1992) 1155.

63
[12]. J. Guilloteau, M.M. Ries-Kautt, A.F. Ducruix, Variation of lysozyme solubility as a function of temperature in the presence of organic and inorganic salts, J. Cryst. Growth, 122 (1992) 223.
[13]. M.M. Ries-Kautt, A.F. Ducruix, Crystallization of basic protein by ion pairing, J. Cryst. Growth, 110 (1991) 20.
[14]. C. Carbonnaux, M. Ries-Kautt, A. Ducruix, Relative effectiveness of various anions on the solubility of acidic hvpoderma lineatum collagenase at pH7.2, Protein Sci. 4 (1995) 2123.
[15]. S. Veelser, S. Lafont, S. Marcq, J.P. Astier, R. Boistelle, Prenucleation, crystal growth and polymorphism of some proteins, J. Cryst. Growth, 168 (1996) 124.
[16]. W. Melander, C. Horvath, Salt effects on hydrophobic interactions in precipitation and chromatography of proteins: an interpretation of lyotropic series, Arch. Biochem. Biophys. 183 (1977)200.
[17]. R.G. Pearson, Hard and soft acids and bases, J. Am. Chem. Soc. 85 (1963) 3533.
[18]. K. Collins, Charge density-dependent strength of hydration and biological structure, Biophys. J. 72 (1997) 65.
[19]. K.D. Collins, Sticky ions in biological systems, Proc. Natl. Acad. Sci. USA. 92 (1995) 5553.
[20]. E. Forsythe, M. Pusey, The effects of temperature and NaCl concentration on tetragonal lysozyme face growth rates, J. Cryst. Growth, 139 (1994) 89.
[21]. D.T. Gallagher, Q. Pan, G.L. Gilliland, Mechanism of ionic strength dependence of crystal growth rates in a subtilisin variant, J. Cryst. Growth, 193 (1998) 665.
[22]. Q. Pan, D.T. Gallagher, Probing protein interaction chemistry through crystal growth: structure, mutation and mechanism in subtilisin s88, J. Cryst. Growth, 212 (2000) 555.
[23]. S. Zhang, J. Yuan, H.A. Mohameed, J. Ulrich, The effect of different inorganic salts on the growth rate of NaCl crystallized from sea water, Cryst. Res. Technol. 31 (1996) 19.
[24]. A.D. Randolph, M.A. Larson, Theory of particulate processes, Academic Press Inc., 1988.
[25]. T. Becker, V.B. Lawlis Jr., Subtilisin crystallization process, U. S. Patent 5,041,377, 1991.

64
[26]. T. Becker, Personal communication, 1997.
[27]. Y. Marcus, Thermodynamics of solvation of ions: part 5—Gibbs free Energy of hydration at 298.15K, J. Chem. Soc. Faraday Trans. 87 (1991) 2995.
[28]. Y.C. Chiew, D. Kuehner, H.W. Blanch, J.M. Prausnitz, Molecular thermodynamics for salt-induced protein precipitation, AIChE J. 41 (1995) 2150.
[29]. R.Y. Waghmare, J.N. Webb, T.W. Randolph, M.A. Larson, C.E. Glatz, Pressure dependence of subtilisin crystallization kinetics, J. Cryst. Growth, 208 (2000) 678.
[30]. A.J. Mahajan, D.J. BCirwan, Nucleation and growth kinetics and biochemicals measured at high supersaturations, J. Cryst. Growth, 144 (1994) 281.
[31]. G. Scatchard, I.H. Scheinberg, S.H. Armstrong Jr., Physical chemistry of protein solutions: IV. The combination of human serum albumin with chloride ion, J. Am. Chem. Soc. 72 (1950) 535.
[32]. G. Scatchard, I.H. Scheinberg, S.H. Armstrong Jr., Physical chemistry of protein solutions: V. The combination of human serum albumin with thiocynate ion, J. Am. Chem. Soc. 72 (1950) 540.
[33]. R.J. Davey, The role of the solvent in crystal growth from solution, J. Cryst. Growth, 76 (1986) 637.
[34]. D.A. Green, P. Meenan, Acetaminophen crystal habit: solvent effects, Cryst. Growth Org. Mater. Proc. Conf. (1996) 78.
[35]. X. Pan, R. Bott, C.E. Glatz, Subtilisin surface properties and crystal growth kinetics, submitted to J. Cryst. Growth.

65
CHAPTER 4. SUBTILISIN SURFACE PROPERTIES AND CRYSTAL
GROWTH KINETICS
A manuscript to be submitted for publication to Journal of Crystal Growth
X. Pan3, R. Bottb and C. E. Glatz*
a Department of Chemical Engineering, Iowa State University, Ames. IA 50010
b Department of Research and Development, Genencor International, Inc.,
Palo Alto, CA 94304
Abstract
Our previous study showed that solubility and growth rate of subtilisin crystals
changed with the substitution of amino acid residues. Structural and energetic comparisons
of crystal structures of two subtilisin mutants were conducted to explore the reason for
changes in the growth rate of subtilisin crystals. Unique contact patches were determined for
the crystal lattice of two subtilisin mutants. The loss of solvent accessible surface area, the
average hydrophobicity and the number of hydrogen bonds and salt bridges were calculated
to quantify surface properties of proteins in contact patches. The structural comparison
showed that the three amino acid mutations (Purafect® —> Properase®) are all in contact
patches and provide extra atomic contacts. For Properase® subtilisin, the number of
contacting residues and the loss of accessible surface area increased. Binding energetic
calculations, based on the detailed protein structures, were performed to determine non-
electrostatic interaction contributions for the required crystallographic orientation and the

66
number of energetically favored, false-binding orientations. The agreement and disparity
between molecular structure and macroscopic crystallization behavior is discussed.
Introduction
Growing protein crystals of good quality is a critical prerequisite for determining 3D
protein structures by X-ray diffraction. Currently, good quality crystals are mainly obtained
by trial-and-error screening experiments, as the underlying mechanisms are still unclear. In
addition, protein crystallization has sometimes proven suitable for commercial protein
recovery [1].
A few studies have analyzed packing contacts in protein crystals as a means of
understanding the mechanism of crystallization. Lawson et al. [2] introduced a Lys 86 —»
Gin 86 substitution into human H ferritin to provide for Gin in contact with an Asp of the
neighboring lattice molecule via a double Cd+ bridge; diffraction resolution was improved up
to 1.9 Â. McElory and coworkers [3] investigated the crystallization of 12 human
thymidylate synthase (TS) mutants. The results showed that a single amino acid mutation on
the surface could greatly change the solubility of TS. Some mutants introduced more
favorable crystal contacts and changed their space groups. Mittl et al [4] analyzed the X-ray
structure of glutathione reductase and found an additional possible contact position where
two molecules were very close but no contact formed due to the short side chains of residues.
By genetically engineering two larger side chains at the surface to bridge the gap, they
shortened the induction time for crystallization by a factor of 40. Obviously, both the
nucleation and growth processes were accelerated. Based on the analysis of crystal structure,
Heinz and Matthews [5] introduced cross-linking between two T4 lysozyme molecules

67
through two disulfide bridges that resulted in a rapid crystallization of the protein. Jesch et
al. [6] studied packing forces in nine crystal forms of cutinase and found that an increase in
local hydrophobicity could strengthen contacts. They concluded that surface modification is
a promising tool to change crystal form. Gallagher and coworkers [7] investigated how ionic
strength affected the growth rate of different crystal faces by analyzing molecular contacts.
They found one of the crystal contacts involved a hydrogen bond between two ionized
carboxylic acid groups. Ionic strength affected the ease of forming that contact, such that, as
evidenced by altered crystal morphology, the relative face growth rates changed. In their
recent study [8], they changed an amino acid involved in the particular crystal contact that
had been sensitive to ionic strength and found that the morphology variation effect was
eliminated.
Protein-protein interaction can be characterized structurally and energetically. The
general structural characteristics of protein-protein interactions have been reviewed by Jones
and Thornton [9, 10]. Protein-protein interaction is based on the specific complementary
recognition of two macromolecules to form a stable association. Fersht [11] suggested that
hydrophobic interaction is the driving force and hydrogen bonds and salt bridges provide the
specificity. Meanwhile, the shape complementary of protein-protein interfaces is also a
factor. The structural properties of protein-protein interfaces include accessible surface area
(ASA), hydrophobicity, hydrogen bonding, salt bridges, and shape and residue preference.
The concept of solvent accessible surface was introduced by Lee and Richards [12] as
the surface traced out by the center of a solvent molecule rolling on the van der Waals
surface of the molecule. Of note in the context of crystallization, the free energy of hydration
can be estimated by a summation of the ASA of each atomic group multiplied by its solvation

68
parameter [13]. Moreover, the loss of accessible surface area of protein was correlated with
the interaction energy of crystal packing and folding [14]. Hydrophobic interactions are the
dominant favorable interactions between nonpolar residues. Since the direct measurement of
hydrophobic interactions is very difficult, the magnitude of hydrophobic interaction is
commonly estimated as the transfer free energy of a nonpolar solute from an aqueous to a
nonaqueous environment [15]. The free energy of transfer can be calculated from the
relative solubility of the solute in aqueous and nonpolar solutions [16]. An alternative
measure of the hydrophobic interaction uses the average for each amino acid of the pairwise
contact energy derived from 42 high-resolution X-ray crystal structures [17, 18]. The overall
hydrophobicity of protein is derived from the hydrophobicity of its constituent amino acid
residues. Hydrophobic interaction is estimated to be 0.18xl0"21 J per Â2 of AASA per
molecule [19]. Since AASA of larger than 200 Â2 is not unreasonable during crystallization,
hydrophobic interaction provides a large contribution to crystallization energetics [20].
Hydrophobic interactions arise from the differences of direct interactions of protein
with two environments. The direct interactions arise from electrostatics (including salt
bridges), van der Waals dispersion, and hydrogen bonds formed with solvent (hydration) or
self (folding and intermolecular contacts). Generally, the magnitude of hydrogen bond
energy is 3.5—1 Ox 10"21 J; electrostatic interaction is about 14xl0"21 J when two unit charges
are apart 5 Â [21-22]; and the dispersion energy, estimated from the Lennard-Jones potential
function, is 0.7xl0"21 J for a pair of atoms at 5 Â separation. For protein molecules, the
portion of charged atoms is far less than that of polar and non-polar atoms, so
nonelectrostatic interactions dominate the interaction energy [23].

69
Crystallization is a process of ordered arrangement of molecules or atoms, so only
protein molecules with specific orientations can be incorporated into crystals. At the
growing crystal face, protein molecules with correct orientation would compete with
misoriented ones. The impact of this competition on growth rate has been estimated by
determining the number of misoriented molecules with more favorable interaction free
energy with the crystal face than that of the correctly oriented interaction [23].
Our previous paper showed that both solubility and growth rate decrease in the order
of Properase® > Purafect® > Purafect® OX subtilisin [24] and that crystal morphology
differed among these mutants. Since only Properase® and Purafect® crystals were obtained
with sufficient quality for x-ray diffraction, this paper focuses on the structural and energetic
comparison of these two subtilisin mutants and relates the microscopic differences to the
variations of crystallization behaviors.
Materials and Methods
Crystal growth for X-rav diffraction
The two subtilisin mutants, Properase® and Purafect®, were provided by Genencor
International, Inc. The proteins were buffer-exchanged into lOmM sodium acetate pH 5.5
solution. The crystals were grown by the hanging-drop method at 23 °C. Drops were
prepared by mixing 3 fiL of protein solution with an equal volume of reservoir solution. The
protein concentrations in crystallization drop were approximately 10 mg/ml for Properase®
and 6 mg/ml for Purafect®. The reservoir contained 0.5M NaCl for Properase®
crystallization and 0.2M NaCl for Purafect® crystallization. After 10 days, a Properase®

70
crystal of 500(length)x 150(diameter) ^m3 was obtained, while a Purafect® crystal of
800(length)x75(diameter) jam3 was obtained after 30 days.
Structure determinations
Crystals of Properase® and Purafect® grew in the space group P2|2|2, with unit cell
dimensions of a=47.8, b=62.5, c= 75.6 and a=47.6, b=62.4 and c=75.8Â respectively.
Diffraction data were collected from single crystals of each enzyme using an RAXIS-H area
detector. The crystal to detector distance was 70mm both crystals. Frames corresponding to
oscillations of 1.5 ° were collected for 30 min. A total of 60 frames were collected from each
crystal. Data were processed, scaled and merged using software supplied by the
manufacturer Rigaku USA (The Woodlands, Texas). Data from the Purafect® crystal
extended to 1.8 Â, consisted of 18443 reflections with an R-merge of 0.068. Data from the
Properase® crystal extended to 1.6 Â, consisted of 22770 reflections with an R-merge of
0.048.
Initial models were obtained by molecular replacement using the structure of the
same enzyme from a different crystal for ljea.pdb from the protein data bank [25]. After
rotation and translation, each model was adjusted based on 2Fo-Fc and Fo-Fc difference
electron density maps to accommodate altered side chains in the case of Purafect® and to
incorporate the substitutions at position 87, 101 and 104 in Properase®. These models were
then refined with the program PROLSQ. The Purafect® model has been refined to a
crystallographic R-factor of 0.196 the current model contains 1992 non-hydrogen atoms with
102 of these refined with variable occupancies including two calcium ions and solvent
molecules. The model has good stereochemistry with rms deviations from ideality of 0.1 Â

71
in bond length, 2.3 0 in bond angles and 0.015 Â in planarity. The Properase® model has
been refined to a crystallographic R-factor of 0.188 the current model contains 1972 non-
hydrogen atoms with 82 of these refined with variable occupancies including two calcium
ions and solvent molecules. The model has good stereochemistry with rms deviations from
ideality of 0.14 Â in bond length, 3.8 0 in bond angles and 0.019 Â in planarity.
Structural analysis
The molecule determined by X-ray diffraction was labeled as Chain A and displayed
using Swiss-PDBViewer [26]. All of the molecules possibly contacting with Chain A were
identified visually using Swiss-PDBViewer, and their coordinates were generated using the
program PDBSET of the CCP4 suite [27] and labeled as different chains. All chains were
grouped as a protein complex and the contacts between chains were determined using the
ISUB mode of the CONTACT program from the CCP4 suite [27]. In this calculation, all of
water molecules and hydrogen atoms were excluded. The residues in contact with
neighboring molecules were identified by searching for atom-atom distances under 4.5 Â.
The residues identified were grouped into several contact "patches" based on the neighboring
molecule that they contact.
The hydrophobicity of each contact patch was calculated as the average
hydrophobicity of the residues in the patch. Hydrophobicity values for individual residues
were those determined by Young et al. [14], The solvent accessible surface area (ASA) was
calculated with the analytical surface computation routine ASC [28, 29]. The probe (water)
radius was set to 1.4 Â. The loss of ASA (AASA) when going from a monomelic to a dimeric
state was calculated according to the following equation:
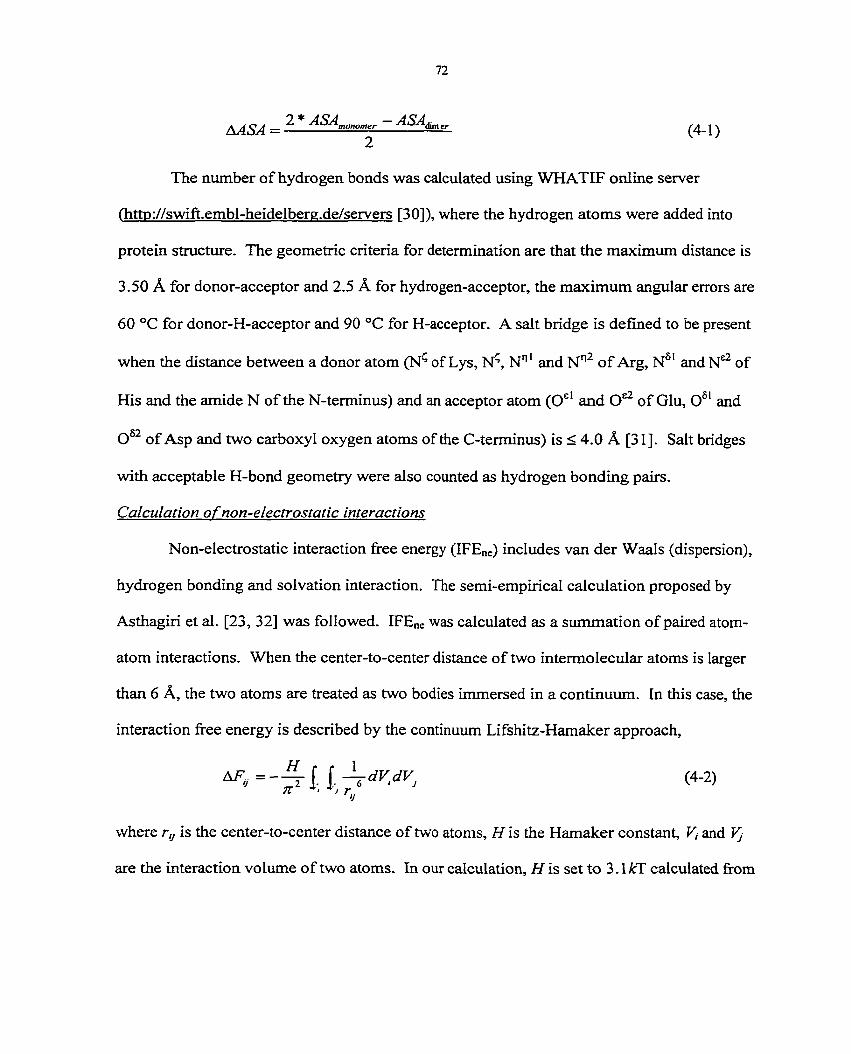
72
AASA = 2 * 1monomer (4-1) 2
The number of hydrogen bonds was calculated using WHATIF online server
(http://swift.embl-heidelberg.de/servers [30]), where the hydrogen atoms were added into
protein structure. The geometric criteria for determination are that the maximum distance is
3.50 Â for donor-acceptor and 2.5 Â for hydrogen-acceptor, the maximum angular errors are
60 °C for donor-H-acceptor and 90 °C for H-acceptor. A salt bridge is defined to be present
when the distance between a donor atom (N^ of Lys, N \ Nnl and Nn2 of Arg, NSI and N*2 of
His and the amide N of the N-terminus) and an acceptor atom (Oel and 0e2 of Glu, O51 and
O82 of Asp and two carboxyl oxygen atoms of the C-terminus) is < 4.0 Â [31]. Salt bridges
with acceptable H-bond geometry were also counted as hydrogen bonding pairs.
Calculation of non-electrostatic interactions
Non-electrostatic interaction free energy (IFEne) includes van der Waals (dispersion),
hydrogen bonding and solvation interaction. The semi-empirical calculation proposed by
Asthagiri et al. [23, 32] was followed. IFEne was calculated as a summation of paired atom-
atom interactions. When the center-to-center distance of two intermolecular atoms is larger
than 6 Â, the two atoms are treated as two bodies immersed in a continuum. In this case, the
interaction free energy is described by the continuum Lifshitz-Hamaker approach,
where rtJ is the center-to-center distance of two atoms, H is the Hamaker constant, Vt and V)
are the interaction volume of two atoms. In our calculation, H is set to 3.1&T calculated from
dV.dV (4-2)

73
Lifshitz theory [33]. For the interior atoms, the interaction volumes are the Voronoi
volumes, calculated with the online serve of http://molbio.info.nih.gov/structbio/surfvol.html
[34]. For the surface atoms, Voronoi volumes are undefined, so the interaction volume used
is the van der Waals volume using the radius values of Ooi et al [17].
When the center-to-center distance of two intermolecular atoms is not more than 6 Â,
the Lennard-Jones interaction is used to calculate the interaction potential:
=4 e,j f _ ~\ 12
K r i y V R>J J (4-3)
where -£/, is the minimum interaction energy and cry is the collision diameter. % and are
calculated by the standard combining rule, i.e. stJ = (£,£j)'/2 and <yy=(<XiCTj)l/2', where s, and a,
are given by the OPLS parameter set [35]. An empirical multiplier of '/2 adjusts the Lennard-
Jones interaction to account for the effects of hydrogen bonding and solvation interaction
[36].
The docking of two protein molecules used multiple orientations of one molecule
toward the intended contact patch on the other [23]. The sampled orientation were obtained
by rotation about the center through the three Euler angles ae[0,27t], (3e[0,7t] and ye [0,2%]
with sample intervals of 20°. At each orientation, the other molecule was translated toward
to the contact patch of the other to find the position with the lowest IFEne.
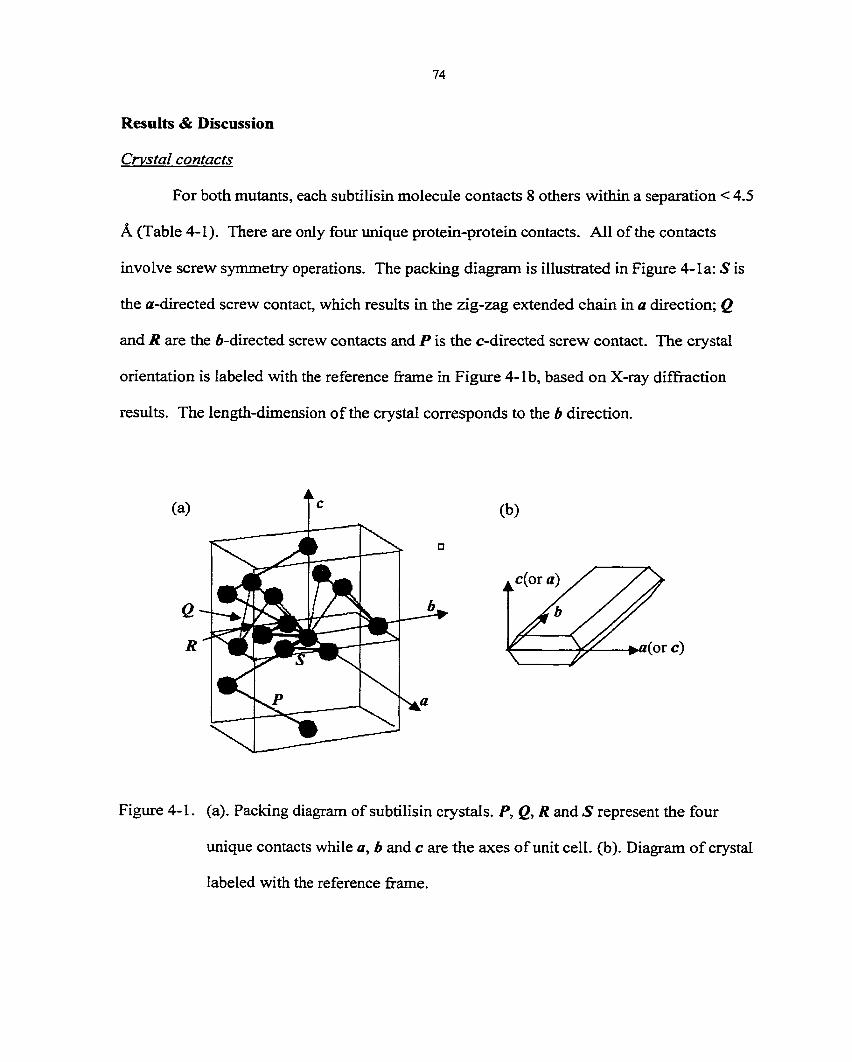
74
Results & Discussion
Crystal contacts
For both mutants, each subtilisin molecule contacts 8 others within a separation < 4.5
 (Table 4-1). There are only four unique protein-protein contacts. All of the contacts
involve screw symmetry operations. The packing diagram is illustrated in Figure 4-la: S is
the a-directed screw contact, which results in the zig-zag extended chain in a direction; Q
and R are the ^-directed screw contacts and P is the c-directed screw contact. The crystal
orientation is labeled with the reference frame in Figure 4-lb, based on X-ray diffraction
results. The length-dimension of the crystal corresponds to the b direction.
><z(or c)
Figure 4-1. (a). Packing diagram of subtilisin crystals. P, Q, R and S represent the four
unique contacts while a, b and c are the axes of unit cell. (b). Diagram of crystal
labeled with the reference frame.

75
Table 4-1. Properase® and Purafect® subtilisin lattice interactions
(a) Properase®
Contact Symmetry3 Translation" VDW contact0 Short VDW0
P 2 0-10 62 6
2 0-1 -1 62 6
Q 3 0 0 0 64 8
3 0 -10 64 8
R 3 1 00 110 23
3 1 -1 0 110 23
S 4 0-10 61 6
4 -1 -1 0 61 6
Total interactions 594 86
a: Symmetry operation codes: 2: A-x, -y, Zz+z; 3: -x, 14+y, lA-z; 4: A+x, lA-y, -z b: Translation operation is to move molecules along the unit cell axis, e.g. Ill means x+a,
y+b, z+c. c: The number of the pairs of atoms in VDW contact (separation less than 4.5 Â) or short
VDW contact (separation less than 3.5 Â).

76
Table 4-1. (continued) Properase® and Purafect® subtilisin lattice interactions,
(b) Purafect®
Contact Symmetry Translation VDW contact Short VDW
P 2 0 2 0 66 9
2 i CN O 66 9
Q 3 0 0 0 59 8
3 0 -1 0 59 8
R 3 1 00 72 21
3 1 -1 0 72 21
S 4 0 1 1 58 5
4 -1 11 58 5
Total interactions 510 86
Because our previous growth experiment considered crystals as rod-like crystals, the a and c
axes were not distinguished when we labeled the crystal within the reference frame.
Structural comparison
There are 594 atomic van der Waals (VDW) contacts for Properase®, including 86
short atomic VDW contacts (defined as non-ionic contacts less than 3.5 Â), while Purafect®
has 510 atomic VDW contacts (including 86 short ones) (Table 4-1). The results show that
more atomic VDW contacts exist in Properase® lattice. The residue compositions of unique
contacts are listed in Table 4-2. It is noted that the residue compositions of contact patches
of two mutants are similar, but each differs in from two to four residues in contact. For

77
Table 4-2. Compositions of amino acid in contact patches of Properase® and Purafect®
subtilisin
Contacts Properase® Purafect®
P Alal5-Prol27 Asnl8-Prol27 Alal5-Prol27 Asnl8-Prol27
(c-axis) Asnl8-Serl8 Argl9-Prol27 Asnl8-Serl28 Argl9-Prol27
Argl9-Alal56 Argl9-Serl54 Argl9-Alal56 Argl9-Serl54
Argl9-Glnl85 GIy20-Alal56 Argl9-Glnl85 Gly20-Alal56
Leu21-Serl54 Lys231-Asnl53 Leu21-Serl54 Lys231-Asnl53
Are269-Glv98 Are269-Glv99 Lvs231-Serl54 Are269-Ser99
Are269-Ser97
Q Pro3 9-Asn 178 Pro3 9-Thr249 Thr37-Glnl2 Pro39-Asnl78
(6-axis) Asn42-Argl0 Leu73-Asnl77 Pro39-Thr249 Asn42-Argl0
Leu73-Glnl76 Asn74-Asnl79 Leu73-Asnl77 Leu73-Glnl76
Asn74-Asnl77 Asn75-Asnl77 Asn74-Asnl79 Asn74-Asnl77
Asn75-Asnl78 Asn75-Asnl79 Asn75-Asnl77 Asn75-Asnl78
Ser76-Asnl79 Ser76-Leu251 Asn75-Asnl79 Ser76-Asnl79
Ser76-Glv252 Ser76-Tvr257 Ser76-Leu251 Ser76-Tyr257
Ile77-Leu251 Ue77-Gly252 Ile77-Leu251 Ile77-Ser250
Ile77-Ser250 Asn85-Asnl77 Ile77-Gly252
*: Underlined contacts present differences between Properase® and Purafect® subtilisin.

78
Table 4-2. Compositions of amino acid in contact patches of Properase® and Purafect®
subtilisin (continued)
Contacts Properase Purafect
R
(b-axis)
S
(a-axis)
Glyl 13-Thr254 Asnl 14-Lys245 Glyl 13-Thr254 Asnl 14-Lys245
Asnl 14-Ser259 Asnl 14-Asn246 Asnl 14-Ser259 Asnl 14-Asn246
Serl42-Gly252 Serl42-Ser253
Argl43-Gly252 Argl43-Ser253
Argl43-Thr254 Argl43-Ser250
Argl43-Leu251 Argl43-Glv258
Arel43-Ser259 Argl43-Glv260
Argl43-Tvr257
Pro51-Thr207 Pro51-Tyr208
Pro51-Ala209 Pro51-Tyr203
GlvlQ0-Glv2Q5 Serl01-Gly205
Serl01-Pro204 Serl03-Gly59
Serl03-Asn60 Serl03-Pro204
Serl03-Asp58 Alal31-Gly52
Alal31-Glu53 Thrl32-Gly59
Thrl32-Ala96 Thrl32-Glu53
Glnl35-Glv52
Serl42-GIy252 Serl42-Ser253
Argl43-Gly252 Argl43-Ser253
Argl43-Thr254 Argl43-Ser250
Argl43-Leu251
Pro51-Thr207 Pro51-Tyr208
Pro51-Ala209 Pro51-Tyr203
Serl01-Gly205 Serl01-Pro204
Vall02-Glv59 Serl03-Gly59
Serl03-Asn60 Serl03-Pro204
Serl03-Asp58 SerlQ3-Glv61
Alal31-Gly52
Alal31-GIu53 Thrl32-Gly59
Thrl32-Ala96 Thrl32-Glu53
Glnl35-Ala96

79
contacts P, Q and R, there are more residual contacts involved in Properase® subtilisin,
whereas contact S of Purafect® has one more residual contact than Properase®. The
geometric views of contacts P, Q, R, and S are shown in Figure 4-2. Among the four
contacts, contact P, Q and S involve one substituted residue between Properase® and
Purafect®, respectively. For contact P, Ser99 (in Purafect®) and Gly99 (in Properase®) are
all presents in contact regions. Although Ser has longer side chain than Gly, the side chain of
Arg269 in Properase® extends outward, which still makes the contact between Gly99 and
Arg269 and brings in two more contacts. For contact Q, Asn85 (in Properase®) has a longer
side chain than Ser 85 (in Purafect®), and thus Asn forms three atomic VDW contacts with
Asnl 77 of the neighboring molecules. The atomic distances between Ser85 and Asnl 77 in
Purafect® lattice are larger than 5.33 Â. For contact S, Val 102 forms an atomic VDW
contact with Gly52 in Purafect® lattice. Since Asn 102 in the Properase® lattice folds toward
the interior of the molecule, the atomic distances between Asn 102 and Gly52 are larger than
4.89 Â. For contact R, the Argl43 side chain of Properase® is closer to the neighboring
molecule, which results in an increase of four pairs of residual contacts.
The total accessible surface areas of Properase® and Purafect® are 9234 and 9316 Â2,
respectively. The decreases of ASA (AASA) due to contacts are listed in Table 4-3, where the
'Total" is the AASA when one molecule contacts other eight molecules simultaneously. The
total AASA of Properase® and Purafect® are 28% and 27% of the original ASA, respectively.
For each contact, Properase® has larger AASA than Purafect®. And the contact along the b
axis (contact Q+R) has larger AASA than the ones along the a and c axis (contacts S and P).

80
Contact P
Arg 269 (Prop)
X Ser 99 (Pura)
Gly 99 (Prop)
Contact Q
Asn85 (Prop)
AsnI77
Figure 4-2. Superimposed views of two subtilisin mutants in contact regions. Red and blue
are the two contact regions of Properase®, where black molecules are Purafect®
("Prop" represents Properase®; "Pura" represents Purafect®).

Contact S Asn 102 (Prop)
Val 102 (Pura)\
Arg143 (Pura)
Contact R
Figure 4-2. (Continued) Superimposed views of two subtilisin mutants in contact regions.
Red and blue are the two contact regions of Properase®, where black molecules
are Purafect® ("Prop" represents Properase®; "Pura" represents Purafect®).

82
Table 4-3. Surface properties of contact patches of Properase® (i.e. Prop)and Purafect® (i.e.
Pura) subtilisin
Contacts AASA
(Â2/molecule)
Average*
hydrophobicity
Hydrogen
Bonds
Prop Pura Prop Pura Prop Pura
P 338 338 2.51/1.94 2.51/1.82 3 2
(c-axis)
Q 361 357 2.68/2.45 2.73/2.41 3 2
(b-axis)
R 262 245 2.12/2.44 2.12/2.36 2 2
(Jb-axis)
S 317 301 2.26/2.44 2.52/2.43 0 1
(a-axis)
Total** 2556 2482 16 14
*: Values for each of the contacting patches, the hydrophobicity value of each residue is referred to [17].
**: Total is equal to 2*(AASAP+AASAQ+AASAR+AASAS)
It is noted that the difference between two mutants in AASA of contact R mainly is due to the
contribution of Arg 143. The AASA of Arg 143 due to contact are 150 Â2 for Properase® and
120 Â2 for Purafect®. Such closer contact has proven to be helpful for the increase of
crystallizability previously [3-5].
For each contact, the average hydrophobicities of each of the patches in contact were
calculated (Table 4-3). On the scale used to evaluate hydrophobicity, where phenylalanine

83
(5.12) and lysine (1.50) are the extremes, the hydrophobicity of the contact patch is less than
2.75, i.e. somewhat hydrophilic. When contact patches of each mutant are considered as a
whole, they consist of 58% polar, 27% non-polar and 15% charged residues. Polar and
charged groups interact with water strongly. During crystallization, the burying of polar and
charged groups from solution to crystal requires stripping of these hydration shells.
Therefore, the contact patches with more non-polar residues (i.e. high hydrophobicity) would
favor the burying from aqueous solution to crystal. There is no clear trend of hydrophobicity
found in the comparison between Properase® and Purafect®.
The numbers of hydrogen bonds across contacts are listed in Table 4-3. Properase®
has one more hydrogen bond than Purafect® for contact P and Q, respectively, and one less
hydrogen bond for contact S. But the total intermolecular hydrogen bonds in the Properase®
lattice are more than in the Purafect® lattice. No salt bridge was found among the contacts.
Xu et al. [36] found, on average, 10.7 hydrogen bonds and 2.0 salt bridges for each protein-
protein interface in multimeric protein complexes. Compared to such interactions, the protein
—protein interaction involved in crystallization is weak.
Energy comparison
The non-electrostatic interaction free energy (IFEne) of each unique protein-protein
contac t was ca lcu la ted (F igure 4 -3 and 4-4) . For bo th mutan ts , the d i s tances be tween the N n l
(or Nn2) of Arg 143 and one atom of the neighboring molecules are smaller than 1.7Â, which
caused the IFEne along contact R to be unreasonably repulsive and probably results from

84
-5
FT 4Ç, c
Hi -10
-15
-20
•4 4 S
•
3 I •
•
Figure 4-3. IFEne distribution of Properase® subtilisin for 2916 orientations docked to the
center molecule along four specific contact directions. Arrows point to the
crystallographically correct orientations.

85
-5
5 -io cy Es.
-15
-20
-25
Figure 4-4. IFEne distribution of Purafect® subtilisin for 2916 orientations docked to the
center molecule along three specific contact directions. Arrows point to the
crystallographically correct orientations

86
uncertainty in structure determination. To obtain a reasonable value, Arg is replaced by Ala
in the IFEne calculation of contact R. The effects of this substitution on the IFEne calculation
of other contacts were negligible. For Properase®, the IFEne of the two ^-directed contacts (Q
and R) are —11.0 kT and —9.2 kT, respectively, where the IFEne of a-directed (S) and c-
directed (JP) contacts are —9.9 kT and —12.72 kT, respectively. If the A-directed contributions
can be added, then this contact has more negative IFEne than the contacts along other two
directions. Similar calculations were done for Purafect® and the summed A-directed contacts
also had the lowest IFEne.
Near a crystal surface, correctly oriented protein molecules would compete with other
misoriented molecules [23]. When incorporating into a growing face, a protein molecule
would follow a stochastic path. To simplify the calculation and focus on the competition
between misoriented and properly oriented protein molecules, the docking path was set as a
straight line and the direction was specified by each unique protein-protein contact (shown in
Figure 1). For contacts Q and S, Properase® has 19 misoriented molecules that have lower
IFEne than the properly oriented one, whereas Purafect® has 3 and 4, respectively (Figure 3
and 4). For contacts P and R, Properase® has fewer energetically favored, misoriented
molecules than Purafect®. Moreover, it was noted that the number of energetically favored
misoriented molecules for contact R of Properase® (10) is far less than that of Purafect®
(157). And the actual crystallographic IFEne of contact R in the Properase® lattice (-11 kT) is
more favorable than that in Purafect® (-9.3 kT).
Correlation between microscopic analysis and macroscopic crystallization behavior
In a previous paper [24], we showed the required supersaturation for a given growth
rate of Properase® crystals is lower than that of Purafect® crystals. And Properase® crystals

87
have lower length/diameter ratio than Purafect® crystals. Representative growth rate vs.
supersaturation data from that study are replotted in Figure 4-5. Three conclusions can be
made and may be related to the structural and energetic comparisons in this paper.
(1). For a given supersaturation, the b-directed growth rate is fastest.
X-ray diffraction experiments have shown the length-dimension corresponds to the A-
direction (Figure lb). For both subtilisin mutants, two unique protein-protein contacts (Q
and R) are A-directed and one contact is a-directed (contact S) or c-directed (contact P). The
A-directed contacts are more numerous than either a- or c-directed contacts. Moreover, the
AASA of contact Q is larger than others. Therefore, more contacts and high AASA may be
responsible for faster A-directed growth rate. Additionally, energetic calculation showed the
A-directed contact direction to have the most favorable IFEne.
(2). Properase'1' crystals grow faster than Purafect® crystals and have lower
length/diameter ratio.
Properase® has more atomic VDW contacts, higher AASA and more hydrogen bonds
than Purafect®. Properase® and Purafect® have three amino acid substitutions, all of which
(Gly99—>Ser, Asn85—> Ser and Asnl02—>Val) are present in contact patches. Asn85 of
Properase® provide three extra atomic VDW contacts, respectively, while Val 102 of
Purafect® provides only one. All these factors correlate well with the observed growth rate
difference. However, energetic calculation did not show clear correlation with this
experimental result. For contact Q, the competitive ability of correctly oriented Purafect®
molecules is far lower than that of Properase®, which would contribute to the fast growth of
Properase® crystals, but the decrease of diameter-dimensional growth rate of Purafect® is still
unclear. One possible explanation would be that, since all contacts involve screw symmetry

88
(a) 100
E 10
3
3 1 —i •o
0.1
10
1
0.1
0.01
10 (C)
-C 1
(b) T
I
I "O
E 3 (D
0.1
0.01
Properase NaCI
Properase" NaN03
Purafect® NaC>
Purafect® NaNQ3
10
10
10
(c-s)/s
100
Purafect® Properase^/'' NaCI// NaCl/"^
/ ^ f f Purafect® Z Properase^ / / NaNOj / NaNG3 /
' 100
Purafect® Properase^—' Napl NaC|%^
/ /Purafect®
/ Properase? / / NaN03
/ NaNQ3
'
100
Figure 4-5. Salt and supersaturation dependence of crystal growth rates of Properase® and
Purafect® subtilisin. (a) length dimension,dL/dv, (b)width dimension, dD/dt\ (c)
dL/d t overall, G' = L I D
(data refer to [24]).
89
operation and extend the crystal in two or three directions, a more relevant computation of
IFEne should incorporate multi-molecule docking that would combine the simultaneous
interactions.
(3). The length/diameter of subtilisin crystals is lower in NaCl than in NaNC>3.
This experimental results means the diameter-dimension growth (JP contact) is
influenced more strongly than the length-dimension growth. In the case of Properase®
subtilisin, the number of ionic residues in contacts P,Q,R and S are three (Argl9, Arg269,
Lys231), one (ArglO), two (Argl43 and Lys245) and two (Asp58 and Glu53), respectively.
At pH 5.5, Arg and Lys carry positive charge while Glu and Asp carry negative charge. Arg+
and Lys+ could bind salt anions, interfering with forming of crystalline contacts. Contact P
would then be more strongly affected by the anion, accounting for the large variation in
diameter-dimension growth rate of Properase crystals with salt used as precipitation [24].
However, a similar explanation does not apply for Purafect®.
Conclusions
Within 4.5Â, both lattices have four unique protein-protein contacts. Three amino
acid substitutions are present in contact patches and provide extra atomic contacts.
Properase® subtilisin has more atomic contacts, the larger loss of accessible surface area and
more hydrogen bonds, all of which may be responsible for the faster growth of Properase®
crystals. The IFEne of Properase® in contact R is lower than Purafect®. And along this
contact direction, Properase® has far fewer misoriented molecules that have lower non-
electrostatic free energy than properly oriented ones. More favorable non-electrostatic

90
interaction free energy along the length-dimension also explains the faster growth in this
direction.
Acknowledgement
This work was partly supported by the National Science Foundation under grant
number BES-9510302. The authors would like to thank Todd Becker of Genencor
International, Inc. for the generous supply of subtilisin, Dr. Richard Honzatko and Dr.
Alexander Aleshin of Iowa State University for crystal mounting and helpful discussion, and
Dr. Fox for the use of computational facility.
References
[1]. B. Cudney, S. Patel, Crystallization as a tool for bioseparation, Amer. Biotechnolo. Lab., 1994, 6, 42.
[2]. D.M. Lawson, P.J. Artymiuk, S.J. Yewdall, J.M.A. Smith, J.C. Livingston, A. Treffiy, A., Luzzago, S. Levi, P. Arosio, G. Cessareni, C D. Thomas, W.V. Shaw, P.M. Harrison, Solving the structure of human H ferritin by genetically engineering intermolecular crystal contacts. Nature, 349 (1991) 541.
[3]. H.E. McElroy, G.W. Sisson, W.E. Schoettlin, R.M. Aust, J.E. Villafranca, Studies on engineering crystallizability by mutation of surface residues of human thymidylate synthase, J. Cryst. Growth 122 (1992) 265.
[4]. P.R.E. Mittl, A. Berry, N.S. Scrutton, R.N. Perham, G.E. Schulz, A designed mutant of the enzyme glutathione reductase shortens the crystallization time by a factor of forty, Acta Cryst., D50 (1994) 228.
[5]. D.W. Heinz, B.W. Matthews, rapid crystallization of T4 lysozyme by intermolecular disulfide cross-linking, Prot. Eng. 7 (1994) 301.
[6]. C. Jelsch, S. Longhi, C. Cambillau, Packing forces in nine forms of cutinase, Proteins: Structure, Function and Genetics, 31 (1998) 320.

91
[7]. D.T. Gallagher, Q. Pan, G.L. Gilliland, Mechanism of ionic strength dependence of crystal growth rates in a subtilisin variant, J. Cryst. Growth 193 (1998) 665.
[8], Q. Pan, D.T. Gallagher, Probing protein interaction chemistry through crystal growth: structure, mutation and mechanism in subtilisin s88, J. Cryst. Growth 212 (2000) 555.
[9]. S. Jones, J.M. Thornton, Protein-protein interactions: a review of protein dimer structures, Prog. Biophys. Molec. Biol. 63 (1995) 31.
[10]. S. Jones, J.M. Thornton, Principles of protein-protein interactions, Proc. Natl. Acad. Sci. USA 93 (1996) 13
[11]. A. R. Fersht, Chemical structure and biological activity of enzymes, TIBS 9 (1984) 145.
[12]. B. Lee, F.M. Richards, The interpretation of protein structures: estimation of static accessibility, J. Mol. Biol. 55 (1971) 379.
[13]. T. Ooi, M. Oobatake, G. Nemethy, H.A. Scheraga, Accessible surface areas as a measure of the thermodynamic parameters of hydration of peptides, Proc. Natl. Acad. Sci. USA 84(1987) 3086.
[14]. M. Frey, J. Genovesio-Taveme, J.C. Fontecilla-Camps, Molecular packing and morphology of protein crystals, J. Phys. D; Appl. Phys. 24 (1991) 105.
[15]. K.E. Van Holde, W.C. Johnson, P.S. Ho, Principles of Physical Biochemistry, Prentice-Hall Inc., Upper Saddle Revier, NJ 1998.
[16]. Y. Nozaki, C. Tanford, The solubility of amino acids and two glycine peptides in aqueous ethanol and dioxane solution, J. Biol. Chem. 246 (1971) 2211.
[17]. L. Young, R.L. Jemigan, D.G. Covell, A role for surface hydrophobicity in protein-protein recognition. Protein Sci. 3 (1994) 717.
[18]. S. Miyazawa, R.L. Jemigan, Estimation of effective interresidue contact energies from protein crystal structures: Quasi-chemical Approximation, Macromolecules 18 (1985) 534.
[19]. A.E. Eriksson, W.A. Baase, X.J. Zhang, D.W. Heinz, M. Blaber, E.P. Baldwin, B.W. Matthews, Response of a protein structure to cavity-creating mutations and its relation to the hydrophobic effect, Science (Washington, D. C., 1883-) 255 (1992) 178.
[20]. C. Haas, J. Drenth, The interaction energy between two protein olecules related to physical properties of their solution and their crystals and implications for crystal growth, J. Cryst. Growth, 154 (1995) 126.

92
[21]. Y.W. Chen, A.R. Fersht, K. Henrick, Contribution of buried hydrogen bonds to protein stability. The crystal structures of two barnase mutants, J. Mol. Biol. 234 (1993) 1158.
[22]. A. Warshel, S.T. Russell, Calculations of electrostatic interactions in biological systems and in solutions, Q. Rev. Biophys. 17 (1984) 283.
[23]. D. Asthagiri, A.M. Lenhoff, D.T. Gallagher, Role of competitive interactions in growth rate trends of subtilisin s88 crystals, J. Cryst. Growth, 212 (2000) 543.
[24]. X. Pan, C.E. Glatz, Solvent effects on the growth kinetics of subtilisin crystals, submitted to Journal of Crystal Growth.
[25]. H.M. Berman, J. Westbrook, Z. Feng, G. Gilliland, T.N. Bhat, H. Weissig, I.N. Shindyaloy, P. E. Bourne, The Protein Data Bank, Nucleic Acid Research, 28 (2000) 235.
[26]. N. Guex, M.C. Peitsch, M. C. SWISS-MODEL and the Swiss-PdbViewer: An environment for comparative protein modeling, Electrophoresis 18 (1997) 2714
[27]. CCP4, The SERC (UK) Collaborative Computing Project No. 4, a Suite of Programs for Protein Crystallography, distributed from Daresbury Laboratory, Warrington WA4 4AD, UK. 1979.
[28]. F. Eisenhaber, P. Argos, Improved strategy in analytic surface calculation for molecular systems: handling of computational efficiency, J. Computational Chemistry 14 (1993) 1272.
[29]. F. Eisenhaber, P. Lijnzaad, P. Argos, C. Sander, M. Scharf, The double cube lattice method for efficient approaches to numerical integration of surface area and volume and to dot surface contouring of molecular assembles, J. Computational Chemistry 16 (1995) 273.
[30]. R.W.W. Hooft, C. Sander, G. Vriend, Positioning hydrogen atoms by optimizing hydrogen-bond networks in protein structures, Proteins 26 (1996) 363.
[31]. D.J. Barlow, J.M. Thornton, Ion pairs in proteins, J. Mol. Biol. 168 (1983) 867.
[32]. D. Asthagiri, B.L. Neal, A.M. Lenhoff, Calculation of short -range interactions between proteins, Biophys. Chem. 78 (1999) 219.
[33]. C.M. Roth, A.M. Lenhoff, Improved parametric representation of water dielectric data for Lifshitz theory calculation, J. Colloid Interf. Sci. 179 (1996) 637.

93
[34]. M. Gerstein, J. Tsai, M. Levitt, The volume of atoms on the protein surface: Calculated from simulation, using Voronoi polyhedra, J. Mol. Biol. 249 (1995) 955.
[35]. W.L. Jorgensen, J. Tirado-Rives, The OPLS potential functions for proteins: Energy minimizations for crystals of cyclic peptides and crambin, J. Am. Chem. Soc. 110 (1988) 1657.
[36]. D. Xu, C. Tsai, Nussinov, R. Hydrogen bonds and salt bridges across protein-protein interfaces, Protein Eng. 10 (1997) 999.
94
CHAPTER 5. SOLVENT ROLE IN PROTEIN CRYSTALLIZATION
AS DETERMINED BY PRESSURE DEPENDENCE
OF NUCLEATION RATE AND SOLUBILITY
A manuscript submitted for publications to Crystal Growth & Design
Xiaojing Pan and Charles E. Glatz
Department of Chemical Engineering, Iowa State University, Ames, IA 50011
Abstract
The effects of pressure on nucleation rate provide information about the transition
state during crystal nucleation, providing insight into solvent roles in nucleation. Nucleation
kinetics and equilibrium solubilities of Properase® subtilisin were measured at four pressures:
0.1, 6.8, 13.6 and 34 MPa. The nucleation rate varied with supersaturation to the 1.30 power
over this range; crystal morphology was unchanged. Assuming Le' Chatelier's law to be
applicable to the kinetic rate equation used to model the nucleation kinetics, the activation
volume for nucleation was estimated to be 226 cm3/mol. The solubility dependence on
pressure corresponded to a 37 cm3/mol overall volume change for crystallization. These
results could be attributed largely to the volume change resulting from movement of water
from the hydration layers to the bulk.

95
Introduction
Pressure may influence nucleation and growth of protein crystals as strongly as
temperature, supersaturation, or ionic strength [1], Pressure exerts its effects by favoring
lower volume states of the system. As such, it influences the structure and function of
proteins by direct compression of residue packing or by altering the ionization or hydration
state of those residues [2-4].
The structure/activity effects of pressure operate on the energetics determining
protein folding, substrate binding, and subunit assembly, usually in such a way as to favor
dissociation. The reported effects of pressure on protein crystallization vary widely [5-15].
Glucose isomerase crystallized an order of magnitude faster at 200 MPa than it did at 0.1
MPa (atmosphere) [5]. In contrast, lysozyme was found to crystallize more slowly at high
pressure [6-12]. Others studies examined the separate effects of pressure on solubility,
nucleation and growth. Gro[3 and Jaenicke [10] found that the solubility of lysozyme
increased at high pressure and that nucleation was chiefly affected. Suzuki and coworkers
[11] reported the increase of solubility under high pressure decreased both the nucleation and
growth rate of lysozyme. However, Schall et al. [12] found that the solubility of lysozyme
was unchanged and growth slowed at high pressure. GroP and Jaenicke [13] used Oosawa's
theory of protein self-assembly to explain the effects of pressure on the kinetics of lysozyme
crystallization. They suggested that lysozyme monomers pass through an activated state
before they are incorporated into nucleus or crystal and that there exists a pressure-dependent
equilibrium between the activated monomer and the inactivated monomer. For subtilisin,
Waghmare and coworkers [14,15] found that solubility increased and both the overall
crystallization rate and the nucleation rate decreased under high pressure.

96
According to Le' Chatelier's principle, the effect of pressure on the equilibrium and
kinetic rate constant of a reaction can be given by the following two relationships [16]:
dln(/Q dP
dln(fc) dP
(5-1) RT
AV* RT
(5-2)
where K and k are the equilibrium and kinetic rate constants, P is the pressure, R is the gas
constant, and T is the temperature. AV is the reaction volume, i.e. the partial molar volume
change between the final and initial states, while AV*, activation volume, is the partial molar
volume change for formation of the intermediate activated state. Integration of Equation 5-1
gives
(5-3) *^atm
where the subscripts "p" and "atm" indicate high and atmospheric pressure, respectively. K
is the equilibrium constant for crystallization, defined as the ratio of the protein concentration
in the crystal to that in solution, i.e. inversely proportional to the solubility. Kp/Katm can be
calculated from the solubility, s, by
KP ' Ka,m = salmpalm / sppp (5-4)
where p is the solution density.
Nucleation can be viewed as the reaction: Protein (solution) +water (in various
pools) => Transition state=> Protein (nuclei) + water (in various pools). The various water
pools include bulk water and water of hydration around protein residues of various polarities;
the pools differ in density. During the course of this reaction, the distribution of water
97
among the pools changes. Typically, the nucleation rate is modeled as a power law function
of relative supersaturation [17]:
B = ^(—)' (5-5) s
where B is the nucleation rate and c is the concentration. If the power, a, does not change
with pressure, then the pressure dependence of can be used to calculate AV* from
Equation 2. In this way, the activation volumes for lysozyme and Purafect® subtilisin
nucleation have been estimated as 215 cm3/mol [9] and 330 cm3/mol [15], respectively.
The partial molar volume change between the two physical states can be considered
as the cumulative result of the three contributions [18-22]:
AV = AVm + AVt + AV, (5-6)
where AVM is the intrinsic volume change, AVT is the thermal volume change and A Vf is the
interaction volume change associated with hydration changes. VM is the volume occupied by
the solute molecule that is not penetrated by solvent. For globular proteins, it consists of two
terms: Vw, the sum of the van der Waals volume of all the constituent atoms, and Vv, the
structural void volume. The thermal volume, Vj, can be considered as the empty volume of a
layer surrounding the protein, resulting from the molecular vibrations of the solute and the
solvent. The thickness of the layer is about 1.0 Â for a globular protein [21] and this volume,
then, is approximately proportional to the solvent accessible surface area (ASA).
Vf represents the volume of the hydration layer. The residues hydrated can be
classified as charged, polar or nonpolar. Charged groups electrostrict the hydration shell
causing a reduction in the partial molar volumes relative to bulk water [22,23]. Polar groups
in a solute generally form solute-solvent hydrogen bonds with adjacent water molecules that
98
are more restrictive than bulk water resulting in a somewhat lower partial molar volume than
bulk water. However, water molecules around nonpolar groups act differently. They avoid
the solute by forming solvent-solvent hydrogen bonds. Such a situation causes the water in
the hydration shell of nonpolar groups to be akin to the bulk water with negligible change in
the partial molar volume [21]. Therefore, when polar and charged groups are buried from
previously exposed state during a certain process, AV/ should be positive. Conversely, the
exposure of previously buried polar and charged residues would result in a negative AV[.
We previously estimated the reaction and activation volume for nucleation of
Purafect® subtilisin by high-pressure measurement [15]. An expectation from the above
dissection of the partial molar volume is that point mutations on the protein surface would
change the reaction and activation volumes. Currently, there is no experimental evidence for
the effects of protein mutations on the activation volume for crystallization. However, we
can review a parallel example from the dealkylation reaction of human
butyrylocholinesterase (BuChE) [24]. It was found that the replacement of Glu-197—>• Asp
and Asp-70—>Gly in wild-type BuChE greatly changed the activation volume, which showed
Asp-70 and Glu-70 are two major residues controlling both the dynamics and the structural
organization of the hydrogen bond network in the active-site of BuChE.
In this paper, we investigate the nucleation kinetics of the subtilisin mutant,
Properase®, which differs by three amino acid substitutions from the previously studied
Purafect®. By comparing the reaction and activation volumes and crystal structures of two
mutants we hope to gain insights into the interaction of surface properties and hydration in
protein crystal nucleation.

99
Materials and Methods
Crystallization experiment
The procedure followed in this work was similar to that reported in our previous work
[15,25]. Properase® subtilisin was provided by Genencor International and, after diafiltration
to remove stabilizer, it was twice recrystallized before use. The protein (~ 100 mg/ml
Properase® subtilisin, lOmM pH5.5 NaAc) and the salt (5M NaCl, lOmM pH5.5 NaAc) stock
solutions were filtered (0.22 fjm pStar cellulose acetate filter, Costar, Cambridge, MA)
before combining appropriate amounts of each with diluent (lOmM pH5.5 NaAc) for
crystallization at the desired protein concentration and 0.5M NaCl [26]. One-milliliter
samples were placed in small polystyrene cuvettes (12.5mm x 5mm x 25mm, volume
1.25ml), tightly sealed with three layers of Parafilm (American National Can, Greenwich,
CT) secured by waterproof type, taking care to eliminate air [6], One set of 5 samples was
placed in a stainless steel pressure vessel filled with deionized water and closed with a
threaded stainless steel cap. The pressure was applied hydrostatically using a manual pump
(ENERPAC, Applied Power Inc., Butler, WI) within ten minutes after mixing the salt and
protein solutions.
Four pressure levels, 0.1, 6.8, 13.6 and 34 MPa, were investigated. Samples were
kept under pressure until the lengths of crystals were larger than 100 jj.m (after 4 to 27 h at
atmospheric and 6.8 MPa, 48 h at 13.6 MPa and 70 to 110 h at 34 MPa). Previous
experimental observation showed subtilisin crystals nucleated in a short time and no
significant growth dispersion was noted [25]. Hence, it was assumed that crystals in each
sample have the same size and that the number of formed crystals in each sample is
proportional to the nucleation rate. Therefore, for each sample, 20 to 30 crystals were

100
randomly selected and. their length and diameter were measured using image analysis
(Image-Pro Plus 4.1, Media Cybernetics, MD) for obtaining an average length and
"diameter". The mass of an average crystal in the sample, Mc, was calculated as
M ' = J N W (5'7)
by approximating the crystal as a cylinder of length, L, diameter, D, and density, pc. For
subtilisin, pc was estimated to be 1200 kg/m3 [15]. The amount of protein crystallized was
taken as the difference between the initial and final soluble protein concentration. The
concentration of protein was measured using an activity assay with the conversion factor
0.032 ge min/L, i.e. concentration of protein = 0.032 x the rate of change of absorbance x
dilution factor. The number of crystals in the sample was calculated by dividing the amount
of protein crystallized by the mass of an average crystal in the sample. Taken as proportional
to the nucleation rate, the number of crystals in each sample can be expressed as a measure of
nucleation rate:
number of crystals = kn ( )a (5-8) s
where kn. a pseudo kinetic constant, is proportional to the actual nucleation constant kN in
Equation 5-5. In our approach, k„ was used with Equation 2 to determine the activation
volume instead of k
Solubility was measured after crystallization at a given pressure for 14 days with
gentle agitation by rolling the pressurized chamber (HIP, High Pressure Equipment Co., Erie,
PA).

101
Structure analysis
The atomic coordinates of the two subtilisin mutants were provided by Genencor
International [27]. As before [28], all the possible contacting molecules were identified
visually using S wiss-PDB Viewer [29] and the coordinates of those molecules were generated
using the program PDBSET from CCP4 suite [30] according to appropriate symmetry and
translation operations. And then all of the generated molecules and the original molecule
were grouped as subunits within a protein complex. Crystal contacts were determined using
ISUB mode of the program CONTACT from the CCP4 suite with the criterion of 4.5 Â cut
off distance. All water molecules and hydrogen atoms were excluded. The nucleus was
constructed as a protein complex consisting of the original molecule and those molecules
with which it is in contact.
The solvent accessible surface areas for calculation of Vr of the solitary protein and
the protein within the lattice were calculated with the analytical surface computation routine
ASC [31,32], which is based on the concept of ASA proposed by Lee and Richards in 1971
[33]. The probe (water) radius was set to 1.4 Â. The ASA of each structure was derived from
the sum of the ASA s of all atoms in the structure.
Results
Solubility and volume of crystallization
Properase® subtilisin solubility increased with the increasing pressure (Figure 5-1),
indicating that lattice formation was less favored at high pressure. The protein solubility can
be used to calculate the equilibrium constant, Kp, for crystallization according to Equation 5-
4. Using Equation 5-3, the reaction volume AV was calculated as 37±17 (95% confidence)

102
15
O) E,
i 2 _3 O
CO
10
0 0 20 40 60 80
Pressure (MPa)
Figure 5-1. Solubility of Properase® subtilisin as a function of a pressure. Conditions: 0.5M
NaCl and lOmM NaAc at pH5.5.
cm3/mol from the slope of the linear fit to the plot of In (salm/sp) vs. (P-Patm)• This is close to
the volume change of Purafect® subtilisin reported by Waghmare et al. (30±6 cm3/moI) [14].
Two effects were taken as insignificant in this calculation. Since the density of water from
0.1 MPa to 68 MPa only changes by 3% [34], the ration of solution densities in Eqn. 5-4 is
neglected. At high pressure, the ionization of the buffer system will increase due to the
negative volume change of the ionization process [2], so the pH of solution may change with
pressure. However, Webb et al. [35] showed the solubility of subtilisin did not change when
the solution pH changed from 4.9 to 5.7 so this influence was neglected.

103
Nucleation kinetics and activation volume
Crystal shape as L/D did not change with pressure. Averaged over four pressures
(0.1, 6.8, 13.6 and 34 MPa), the L/D ratio was 3.63 ± 0.5 (95% confidence interval for the
mean). And as before [25], the crystals at each pressure were nearly the same in length with
the standard deviation ranging from 2 to 12% with an average of 5%. Therefore, it was
reasonable to use the average length and L/D ratio to calculate the mass of a crystal and the
number of crystals.
The number of nucleating crystals decreased with the increase of the pressure and the
decrease of the supersaturation (Figure 5-2). Figure 5-2 shows that power law kinetics
(Equation 5-8) were reasonable, where the nucleation pseudo rate constant kn> and the power,
a, were obtained from the intercept and the slope, respectively, for each pressure (Table 5-1).
The values of a and their 95% confidence intervals show that there was no significant
difference among the values of a\ therefore, the data for all pressures were refit using an
average a (a =1.30) to obtain the kinetic constant, (k„), based on the common a (Table 5-1).
The pressure dependence of (kn) was used to calculate the activation volume. Fitting
the pressure dependence of (k„) to the integrated form of Equation 5-2 (Figure 5-3) results in
an estimation of the activation volume for nucleation of 226 ± 76 cm3/mol. The positive
activation volume reflects the lower rate of nucleation at high pressure.
Use ofX-rav data to calculate accessible surface areas
To relate the above experimental observations to the amino acid differences between
the two forms of subtilisin, the crystal structures of both Properase® and Purafect® subtilisin
were analyzed. With a contact defined as intermolecular spacing in the lattice less than 4.5

104
E su 2 to
^ 10 o
• 0.1 MPa • 6.8 MPa • 13.6 MPa O 34 MPa
3 Z
1 10
(c-s)/s
Figure 5-2. Supersaturation dependence of nucleation rate over a range of pressures. Lines
are the least squares power law (Equation 5-5) fit; parameters are summarized in
Table 5-1.
Â, a subtilisin molecule was found to contact with other eight molecules for both cases.
These nine molecules form a model for a crystal nucleus that represents the smallest
assembly situating a protein into the lattice structure. Based on the X-ray crystallographic
structural data, the accessible surface areas of the free protein and the protein in the lattice
were calculated (Table 5-2). The surface areas of the charged, polar and nonpolar residues
are also listed. The solvent accessible surface area of a protein molecule decreases when it is
incorporated into nuclei. The residues involved in the reduction of the accessible surface
area are listed (Table 5-3). These residues also are present in contact regions identified

105
Table 5-1. The nucleation pseudo rate expression constants for Properase® subtilisin.
Pressure (MPa) lnkn a In (kn) b
0.1 10.1 l±0.85a 1.19±0.50 10.23+0.98
6.8 9.55+2.35 1.26±1.15 9.58±2.41
13.6 8.67±1.62 1.17±0.78 8.49±l.48
34.0 6.71±1.20 1.58±0.57 7.35±l.3l
a 95% confidence interval from the regression analysis. b Fitted rate constant over all pressures based on average of a values from each pressure (a
=1.30).
0
-0.5
1
-1.5
2
/ = -0.0912x R2 = 0.9358
-2.5
3
-3.5 0 10 20 30 40
P-Patm (MPa)
Figure 5-3. Pressure variation of nucleation rate plotted to obtain activation volume
(Equation 5-2). From the slope the activation volume, AV*, is 226 cm3/moI.
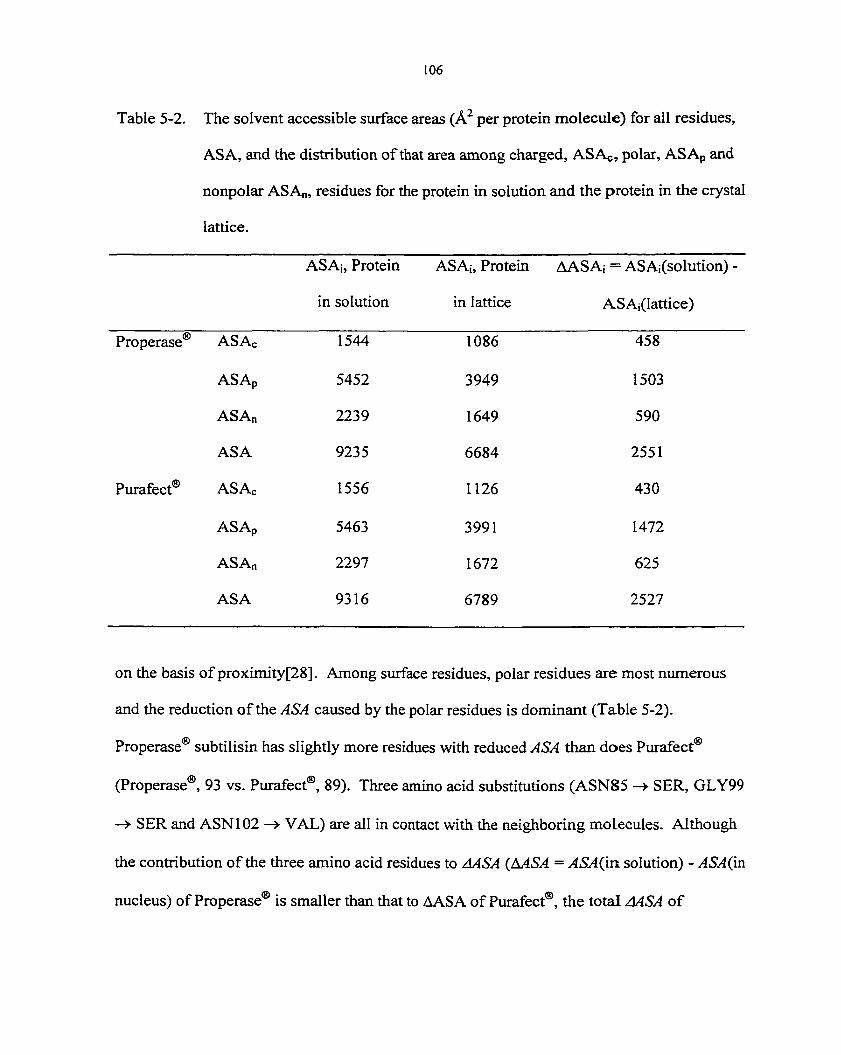
106
Table 5-2. The solvent accessible surface areas (Â2 per protein molecule) for all residues,
ASA, and the distribution of that area among charged, AS Ac, polar, ASAp and
nonpolar AS An, residues for the protein in solution and the protein in the crystal
lattice.
AS A;, Protein
in solution
ASAj, Protein
in lattice
AASAj = ASAi(solution) -
ASAj(lattice)
Properase® ASAc 1544 1086 458
ASAp 5452 3949 1503
ASAn 2239 1649 590
ASA 9235 6684 2551
Purafect® ASAc 1556 1126 430
ASAp 5463 3991 1472
ASA„ 2297 1672 625
ASA 9316 6789 2527
on the basis of proximity [28], Among surface residues, polar residues are most numerous
and the reduction of the ASA caused by the polar residues is dominant (Table 5-2).
Properase® subtilisin has slightly more residues with reduced ASA than does Purafect®
(Properase®, 93 vs. Purafect®, 89). Three amino acid substitutions (ASN85 —> SER, GLY99
—> SER and ASN102 —> VAL) are all in contact with the neighboring molecules. Althougli
the contribution of the three amino acid residues to AASA (AASA = ASA(in solution) - ASA (in
nucleus) of Properase® is smaller than that to AASA of Purafect®, the total AASA of

107
Table 5-3. The residues defining the intermolecular contact regions in the crystal lattice as
determined by the criteria of reduced solvent accessible surface area (ASA).
Properase subtilisin Purafect® subtilisin
nonpolar residue ALA (7)a, TRP (1), PRO(6)
LEU (6), PHE (1), ILE (1)
VAL (1)
polar residue SER (18), ASN (14), GLY (13),
GLN (7), THR (5)
ionic residue ARG (5), TYR (3), GLU (2)
ASP (1), LYS (3)
ALA (6), TRP (1), PRO(7)
LEU (6), ILE (1), VAL (1)
SER (18), ASN (12), GLY (12),
GLN (6), THR (5)
ARG (4), TYR (3), GLU (3),
ASP (1), LYS(3)
Total number of such residues involved the decrease in ASA. Contact defined by proximity [28] result in a slightly smaller number of residues in contact.
Properase® is higher. The contributions of charged, polar and nonpolar residues to the total
accessible surface loss of Properase® are 18%, 59% and 23%, respectively (For Purafect®,
they are 17%, 58% and 25%, respectively).
Discussion
Volume change during crystallization
The observed volume change, AV, is a sum of three terms: the intrinsic volume
change, AVM, the thermal volume change, AVr, and the interaction volume change, AV/.
Generally, it is assumed that no conformation change occurs upon protein crystallization [36,
37]. By comparing the properties of reactions (hydrogen-ion equilibrium, binding of small

108
molecules, enzymatic reaction, proton relaxation, etc.) using crystalline and soluble forms of
proteins (including lysozyme, hemoglobin, myoglobin, insulin), Rupley [38] found that the
crystalline form retains the soluble conformation. Therefore, we assume, AVM= 0 during
crystallization. AVr can be estimated from the crystallographic structure data, and thus AV/
can be estimated by difference. Since AV/ is the hydration volume [21], we can infer the role
of water in nucleation from AV/.
AVrcan be calculated by multiplying the change in the solvent accessible surface
area, AASA, of the protein (Table 5-2) by 1 Â, the thickness of the thermal volume. Thus,
AVr equaled -2551 Â3/molecule (-1535 cm3/mol) and -2527 Â3/molecule (-1521 cm3/mol)
for the crystallization of Properase® and Purafect® subtilisin, respectively.
By difference (AV-AVr), AV/ of Properase® subtilisin was equal to 37 + 1535 = 1572
cm3/mol, while AV/ for Purafect® was 30 + 1521 = 1551 cm3/mol. In both cases, the
interaction volume, V/, increased upon crystallization. Considering the approximations in our
analysis, there was no significant difference in V/ for Properase® and Purafect®
crystallization. During crystallization, the changes in both the thermal volume and the
interaction volume were large, but they offset each other. The positive AV/ would have
resulted from the burial of previously solvent-exposed polar or charged groups.
The extent of hydration change can be estimated from AV/ and typical values for
specific volume of water in the different pools. On average, the formation of each hydrogen
bond between a polar group and water decreases the partial molar volume by 2.2 cm3/mol
[19]. For charged groups, électrostriction reduces the volume by 1.6 cm3/moI [20, 39]. The
release of water from these environments upon burial of such residues during crystallization

109
would then increase volume by between 1.6 and 2.2 cm3/mol water released. Near room
temperature the partial molar volume change between bulk water and nonpolar groups is
approximately 0 [19]. Based on the contribution of charged, polar and nonpolar residues to
the total accessible surface change, an average value of the contribution of each water
molecule to AV/can. be estimated as 1.6 cm3/mol (0.585x2.2+0.175x1.6+0 =1.6, the friction
of each group is based on the average of Properase® and Purafect®). According to this
approximation, the number of water molecules released to the bulk state is 983 (= 1572/1.6)
and 969 (=1551/1.6) for Properase® and Purafect®, respectively.
For low molecular weight solutes, much experimental and theoretical estimation
show that the hydration shell extends no more than two layers of water molecules [22].
However, the hydration shells of macromolecular solutes extend further [21, 40]. The results
of the binding of CMP to RNase A showed a second and third hydration layers involved in
the hydration of globular proteins [20]. The number of water molecules released from the
first hydration shell can be calculated as the loss in ASA on crystallization divided by the
effective cross section of a water molecule, S,„ (Sw = 9 Â2, [20, 22]). For Properase® this
would be 283 (= 2551/9), which is 29% of the number estimated from AV/. A similar result
is obtained for Purafect®. If one allows that AV/ includes three hydration layers, then the loss
in ASA would account for 87% of the AV/. In doing so, we assume the same volume change
per molecule for all layers, which would be an overestimate since the third layer will have a
structure intermediate between bulk and the first layer. Hence, we conclude that changes in
water state can account for much, but not all, of the observed pressure dependence.

1 1 0
The transition state of protein during nucleation
Our experimental results showed that the crystallization volume, AV, and the
nucleation activation volume, AV*, of Properase® subtilisin were 37 and 226 cm3/mol,
respectively. Previous estimations for Purafect ® subtilisin were 30 and 330 cm3/mol [14,
15], respectively. Both cases show that the volume of protein-solvent system is larger in the
transition state than in either the protein solution or the crystalline states. A similar
observation has been made for protein folding [41]. The activation volume for folding is
greater than its reaction volume. The interpretation is that the activated state in going from
the unfolded to the folded polypeptide chain is a loosely packed globule that excludes a
portion of the water released from the final folded structure.
Activation volume can also be viewed from the perspective of contributions from
AVM*, AVr* and AV[*. We'll again assume AVM* is small as was the case for AVM. The
transition state would be reached by protein molecules releasing water as they approach each
other (resulting in AV/*>Qi). The change in thermal volume (<0) would not occur until after
this stripping of hydration (i.e. AVT* is small). Hence, the AV/* contribution at the
intermediate (activated) stage would not be offset by a significant AVr* and it would then be
reasonable that AV*>AV, i.e. (AV/*+AVr*) > (AV/+AVr ). This then implies that AV/* would
be several times smaller than AV/, leaving one with a picture of an activated state in which
hydration has been removed from a major contact region after which the remaining hydration
can be removed from the remaining contact regions.

I l l
Conclusions
We have estimated the crystallization volume and the nucleation activation volume of
Properase® subtilisin by measuring the solubility and the pseudo kinetic constant for
nucleation under different pressures. The solubility of Properase® subtilisin increased with
increasing pressure, giving a total reaction volume change of 37 cm3/mol. High pressure
decreased the nucleation rate by an amount corresponding to an activation volume of 226
cm3/mol. This result could be feasibly explained from consideration of the volume change
resulting from movement of water from hydration layers to the bulk. There was no
significant difference between Properase® and Purafect® in the number of water molecules
released to the bulk.
Acknowledgements
This material is based on work partly supported by the National Science Foundation
under grant number BES-9510302. And the authors would like to thank Todd Becker of
Genencor International for the generous supply of subtilisin and Rick Bott of Genencor
International for providing the atomic coordinates of protein structures.
References
[1]. Ducruix, A.; Giege, R. Crystallization of Nucleic Acids and Protein, a practical approach. Oxford University Press, New York, 1992.
[2], Morild, E. The theory of pressure effects on enzymes. Advan. Protein Chem. 1981, 34, 93-166.
[3]. Gross, M.; Jaenicke, R. Proteins under pressure, Influence of high hydrostatic pressure on structure, function and assembly of proteins and protein complexes. Eur. J. Biochem. 1994, 221, 617-630.

1 1 2
[4]. Weber, G. Protein Interactions, Chapman and Hall, New York (1992)
[5]. Visuri, K.; Kaipainen, E.; Kivimaki, J.; Niemi, H.; Leisola, M.; Palosaari, S. A new method for protein crystallization using high pressure. Bio/Technology, 1990, 6, 547-549.
[6]. Lober, B.; Jenner, G.; Giege, R. Effect of high hydrostatic pressure on nucleation and growth of protein crystals. J. Cryst. Growth, 1996, 158, 103-117.
[7], Takano, K. J.; Harigae, H.; Kawamura, Y.; Ataka, M. Effects of hydrostatic pressure on the crystallization of lysozyme based on in situ observations. J. Cryst. Growth, 1997, 171, 554-558.
[8]. Saikumar, M. V.; Glatz C. E.; Larson M. A. Crystallization of lysozyme at high pressures. J. Cryst. Growth, 1995, 151, 173-179.
[9]. Saikumar, M. V.; Glatz C. E.; Larson M. A. Lysozyme crystal growth and nucleation kinetics. J. Cryst. Growth, 1998, 187, 277-288.
[10]. Gro(3, M.; Jaenicke, R. Growth inhibition of lysozyme crystals at high hydrostatic pressure. FEBS Lett. 1991, 284, 87-90.
[11]. Suzuki, Y.; Miyashita, S.; Komatsu, H.; Sato, K.; Yagi, T. Crystal growth of hen egg white lysozyme under high pressure. Jpn. J. Appl. Phys. 1994, 33, L1568-L1570.
[12]. Schall, C.; Wiencek, J.; Yarmush, M.; Arnold, E. Lysozyme crystal growth reduced at high pressure. J. Cryst. Growth, 1994, 135, 548-554.
[13]. GroP, M.; Jaenicke, R. A kinetic model explaining the effects of hydrostatic pressure on nucleation and growth of lysozyme crystals. Biophys. Chem. 1993, 45, 245-252.
[14]. Waghmare, R. Y.; Webb, J. N.; Randolph, T. W.; Larson, M. A.; Glatz, C. E. Pressure dependence of subtilisin crystallization kinetics. J. Cryst. Growth, 2000, 208, 678-686.
[15]. Waghmare, R. Y.; Pan, X. J.; Glatz, C. E. Pressure and concentration dependence of nucleation kinetics for crystallization of subtilisin J. Cryst. Growth, 2000, 210, 746-752.
[16]. Laidler, K.J. Chemical Kinetics, New York: McGraw-Hill, 1965.
[17]. Randolph, A. D.; Larson, M. A. Theory of particulate processes, Academic press Inc., 1988.

1 1 3
[18]. Pierotti, R. A. A scaled particle theory of aqueous and nonaqueous solutions. Chem. Rev. 1976, 76, 717-726.
[19]. Kharakoz, D. P. Partial molar volume of molecules of arbitrary shape and the effect of hydrogen bonding with water. J. Solution Chem. 1992, 21, 569-587.
[20]. Dubins, D. N.; Filfil R.; Macgregor Jr., R.B.; Chalikian, T. V. Role of water in protein-ligand interactions: volumetric characterization of the binding of 2'-CMP and 3'-CMP to ribonuclease A. J. Phys. Chem. B, 2000, 104, 390-401.
[21]. Chalikian, T. V.; Totrov, M.; Abagyan, R.; Breslauer, K. J. The hydration of globular proteins as derived form volume and compressibility measurements: cross correlating thermodynamic and structural data. J. Mol. Biol. 1996, 260, 588-603.
[22]. Chalikian, T. V.; Sarvazyan A. P.; Breslauer K. J. Hydration and partial compressibility of biologocal compounds. Biophys. Chem. 1994, 51, 89-109.
[23]. Rashin, A. A. Aspects of protein-energetics and dynamics. Progr. Biophys. Mol. Biol. 1993,60, 73-200.
[24]. Masson, P.; Clery, C.; Guerra, P.; Redslob, A.; Albaret, C.; Portier, P. Hydration change during the aging of phosphorylated human butyrylcholinesterase: importance of residues asparatate-70 and glutamate-197 in water network as probed by hydrostatic and osmotic pressures. Biochem. J. 1990, 343, 361-369.
[25]. Pan, X.; Glatz, C. E. Solvent effects on the growth kinetics of subtilisin crystals, to be submitted.
[26]. Becker, T.; Lawlis Jr., V. B. Subtilisin crystallization process. U. S. Patent 5,041,377, 1991.
[27]. Bott, R. Personal communication, 1999.
[28]. Pan, X.; Bott, R.; Glatz, C.E. Subtilisin surface properties and crystal growth kinetics, submitted to J. Cryst. Growth
[29]. Guex, N.; Peitsch M. C. SWISS-MODEL and the S wiss-Pdb Viewer: An environment for comparative protein modeling, Electrophoresis, 1997, 18, 2714-2723.
[30]. CCP4. The SERC (UK) Collaborative Computing Project No. 4, a Suite of Programs for Protein Crystallography, distributed from Daresbury Laboratory, Warrington WA4 4AD, UK, 1979.
1 1 4
[31]. Eisenhaber, F.; Argos, P. Improved strategy in analytic surface calculation for molecular systems: handling of computational efficiency. J. Comput. Chem. 1993, 14, 1272-1280.
[32]. Eisenhaber, F.; Lijnzaad, P.; Argos, P.; Sander, C.; Scharf, M. The double cube lattice method for efficient approaches to numerical integration of surface area and volume and to dot surface contouring of molecular assembles. J. Comput. Chem. 1995, 16, 273-284.
[33]. Lee, B.; Richards, F. M. The interpretation of protein structures: Estimation of static accessibility. J. Mol. Biol. 1971, 55, 379-400.
[34]. NIST webbook, http://webbook.NIST.gov/. 1998.
[35]. Webb, J. N.; Waghmare, R. Y.; Carpenter, J. F.; Glatz, C. E.; Randolph, T. W. Pressure effects on subtilisin crystallization and solubility. J. Cryst. Growth, 1999, 205, 563-574.
[36]. Creighton, T. E. Proteins: Structures and Molecular Principles, W.H. Freeman and Company, New York, NY, 1983, Chapter 7.
[37]. Glusker, J. P.; Lewis, M.; Rossi, M. Crystal Structure Analysis for Chemists and Biologists, VCH Publishers, Inc. New York, NY, 1994. Chapter 15.
[38]. Rupley, J. A. The conformation of proteins structures in the crystal and in solution. In Structure and Stability of Biological Macromolecules; Timasheff, S.N., Fasman, G. D., Eds; Marcel Dekker, INC., New York, 1969, 291.
[39]. Chalikian, T. V.; Sarvazyan, A. P.; Breslaucer, K. J. Partial molar volumes, expansibilities and compressibilities of a,to-aminocsrboxylic acids in aqueous solutions between 18 and 55°C. /. Phys. Chem. 1993, 97, 13017-13026.
[40]. Noever, D. A. Kinetic effects in protein crystals. I: the role of hydration in protein aggregation. J. Phys. D: Appl. Phys. 1995, 28, 1384-1392.
[41]. Vidugiris, G. J. A.; Markley, J. L.; Royer, C. A, Evidence for a molten globule-like transition state in protein folding from determination of activation volumes. Biochemistry, 1995, 34, 4909-4912.

1 1 5
CHAPTER 6. SOLVENT EFFECTS ON THE SECOND VIRIAL
COEFFICIENT OF SUBTILISIN AND SOLUBILITY
A manuscript submitted for publication to AIChE Journal
Xiaojing Pan and Charles E. Glatz
Department of Chemical Engineering, Iowa State University, Ames. LA 50011
Abstract
Protein-protein interactions of Properase® and Purafect® subtilisin in solution have
been studied by static light scattering as a function of salt type (NaCl, NaSCN) and salt
concentration. The second virial coefficient is a measure of two-body protein-protein
interactions. The measured second virial coefficients decreased from positive to negative
values with increasing salt concentration, showing that protein-protein interaction changed
from repulsion to attraction. The second virial coefficient of Properase® in NaSCN is lower
than that in NaCl, indicating that aggregation is more favorable in NaSCN solution.
Moreover, solubility was quantitatively correlated with the second virial coefficient using a
theoretically based correlation. To relate the protein interactions to mechanistic
contributions, the experimental osmotic second virial coefficients were fitted to a DLVO-
type model, consisting of hard sphere, charge-charge electrostatic, dispersion and osmotic
attraction potentials, leaving the Hamaker constant as the adjustable parameter. The fitted
Hamaker constants for the two subtilisin mutants ranged from 4.4kT to 6.8kT in these salt

1 1 6
solutions. Contributions of electrostatic, van der Waals (dispersion) and osmotic attraction
potentials were compared for different salt solutions.
Introduction
Typically the selection of protein crystallization conditions depends on extensive
screening experiments. In their reviews of nucleation and crystallization of globular proteins,
Rosenberger et al. (1996) stressed that more insight into protein-protein interaction could
guide the search for crystallization conditions. George and Wilson (1994, 1997) identified
the osmotic second virial coefficient, B%, as a predictor for protein crystallization. They
measured B? of 20 proteins in dilute solutions under crystallization solvent conditions and
found the values fell in a " crystallization slot" between -1x10"* mol-mL-g"2 to -8x10"*
mol-mL-g"2. The probability of obtaining crystals decreased in a solution with a positive B%;
values of B% below the "crystallization slot" corresponded to a precipitating condition.
Moderately negative S? is a necessary but not sufficient condition for protein crystallization.
The second virial coefficient, derived from the virial expression for the osmotic
pressure of a solution, is a measure of two-body interactions. According to McMillan-Mayer
theory (1945), it can be expressed as an integration of the potential of mean force, w%(r),
between two molecules (Hill, 1962):
B2 = f (e~wAr) 'kr -1 )r2 dr (6-1)
where Mp is the molecular weight, k is the Boltzmann constant, T is temperature and r is the
center-to-center distance between two molecules. Currently, most models for calculating the
potential of mean force are based on the DLVO model for colloidal solutions (Verwey and

1 1 7
Overbeek, 1948). In the DLVO model, proteins are modeled as rigid spheres with uniform
surface charge in a continuous dielectric medium. The potential of mean force between two
protein molecules is described as the cumulative result of three contributions:
fTotm M = (r) + %% (r) + (r) (6-2)
where Whs(r) is the hard-sphere (excluded-volume) potential, Wq^(r) is the charge-charge
repulsive electrostatic potential and Wj,sp(r) is the dispersion (van der Waals) potential
(Table 6-1). Influence of ionic strength of dissolved salts in this accounting arises through
electrostatic screening and, indirectly, through influencing the degree of ionization of protein
residues, whereas the nature of salt affects potential of mean force through the effective
Hamaker constants. Later DLVO-type models added other contributions, such as charge-
dipole, dipole-dipole and charge fluctuation electrostatic interactions (Vilker et al., 1981;
Coen et al., 1995). At high salt concentration, the excluded-volume effect of ions becomes
important, and, thus, the osmotic-attraction potential developed by Asakura and Oosawa
(1954, 1958) was added to the calculation of potential of mean force in protein solution
(Coen et al., 1995; Curtis et al., 1998). Influence of the nature of ion is also incorporated into
the osmotic-attraction potential through the hydrated radius of ion. Some interaction
potentials resulting from hydrogen bond, salt bridge, hydrophobic and hydration effects were
considered (Curtis et al., 1998, Roth et al., 1996b). However, since the mechanisms
connected with these interactions have been unclear, no specific expression was developed
for them. In fact, the additional terms were often supplied to match prediction with
measurement. A simplified alternative to increased complexity is to calculate the potential of
mean force directly from an appropriate and simple pair potential. Rosenbaum and Zukoski
(1996) used an adhesive hard sphere potential to represent the combined interaction from the

1 1 8
Table 6-1 Expressions for various interactions*
Type Expression Reference
Hard Sphere Wfa (/*) = oo for r<2a Verwey&
(r) = 0 for r>2a Overbeek,
1948
Charge-charge W „ (r) - (ze>2 - 2,a)] for r>2a
4xs0£rr(\ + KO)'
where K 2 = (2000e 2 NA /) !{kTeQ£r )
Vilker et
al. 1981
Dispersion
for r>2a where s(r)=r/a
Vilker et
al., 1981
Osmotic attraction (r) = -1xd/(p,NAkTXl -
for 2a<r<2dPi dp i =a + a t
WOA 00 = 0 for r>2dpi
Coen et
al., 1995
* Definition of symbols: a is effective spherical radius of protein; K"1 is Debye screening length; Go is vacuum dielectric permittivity; er is relative permittivity of solvent (er=78.3, Vilker et al., 1981); NA is Avogadro's number; I is ionic strength; k is the Boltzmann constant; T is temperature; H is the effective Hamaker constant; ps is the total ion concentration (M) and a, is the mean ionic hydrated radius.

1 1 9
hard sphere potential and all short-range attractions. Their model successfully described the
phase behavior of lysozyme and yn-crystallin.
The second virial coefficient can by measured by static light scattering (Guo et al.,
1999; Neal et al., 1999), small-angle X-ray scattering (Bonnete et al., 1999; Tardieu et al.,
1999) and small-angle neutron scattering (Velev et al., 1998). Study of protein-protein
interactions conditions showed that there is a high degree of correlation between solubility
and the second virial coefficient (George et al., 1997; Guo et al. 1999; Bonnete et al., 1999).
That means Bz, a dilute solution parameter, can predict the behavior of protein at saturation.
Based on principles of phase equilibrium, Guo et al. (1999) developed a correlation between
solubility and Bi- The nonideal behavior of a solution can be expressed in terms of either the
activity coefficient or the virial coefficient. By combining these two expressions, they
obtained a relation between solubility and the second virial coefficient.
B 2 = ~ A / J p —1 l5±L (6-3) R T 2 M P S 2 M P S
where S is the solubility, R is the gas constant, T is temperature and A/JP is defined as
/Up '(solution)'(crystal), the difference of the standard chemical potentials of protein
between two states. Since the water content in protein crystallized under different conditions
varies from 27 to 65% (Matthew, 1968), nP ^crystal) is also not independent of crystallization
conditions. Ruppert et al. (2001) refined this analysis to obtain,
1 V V n" dn!dcn
s-> 7-^7 (M)
where Vw is the molar volume of water, V pm is the partial molar volume of protein, no is the
refractive index of solvent and dn/dcp is the refractive index increment. While Ac and K have

120
specific theoretical meaning, they were used as adjustable parameters by these authors in
order to fit Bi(exp) - S data. Ruppert et al.(2001) gave Ac and K as .
A=(T) = ]n f n}^ +K\nxm =-^21 + Klnxn (6-5) fpo (* )
K = ± = L £ ^ = <r-C- » (6.6) k' k'-C, ln(xP0 jxp)
where fPOs(T) is the fugacity of protein in the solid phase at the system temperature, T.
f r ™ ( T ) and // ( T , C s ) are the protein infinite dilution fugacities in a salt-free solution and
a salt-containing solution, respectively; xp and xpo are the protein mole fraction at saturation
in a salt-containing solution and a salt-free solution, respectively; Cs is the salt concentration;
AG(T) is the free energy change of dissolving the solid protein into a salt-free solution at
infinite dilution (hence, AG(T) <0). k characterizes activity coefficients at infinite dilution (k
<0); k' is the salting-out constant (>0); therefore, K<0. Because xp0 is always less than 1, the
second term in Equation 6-5 should be positive. It is expected, then, that AC(T) >0.
Our group has found that the solubility, nucleation rate and growth rate of subtilisin
varies with the crystallization conditions: salt type, salt concentration and pressure (Pan and
Glatz, 2001a, 2001b). Study of protein-protein interactions is helpful for us to further
understand the underlying mechanism of subtilisin crystallization. In this work, solvent
effects on the second virial coefficient of subtilisin were studied. The two types of salts
selected, NaCl and NaSCN, are 1-1 salts that provide for significantly different solubility and
growth rates of subtilisin crystals (Pan and Glatz, 2001a). Additionally, it was found that the
three amino acid mutations between Properase® and Purafect® subtilisin effect differences in

121
crystallization behavior (Pan and Glatz, 2001a). So, in this work, we compared the second
virial coefficients of the two mutants in the same type of salt solution (NaCl) to examine the
effect of point mutations on protein-protein interaction. To further investigate the effects of
salt anion and point mutations, we employed a DLVO-type model that included the osmotic
attraction potential in the calculation of the potential of mean force. Moreover, we used the
correlation developed by Ruppert et al. (2001) to explore the relation between solubility and
the second virial coefficient.
Materials and Methods:
Protein
Properase® and Purafect® subtilisin were provided by Genencor International, Inc.
Protein stock solution was prepared from the initial formulation by diaflltration,
recrystallization and redissolution (Pan and Glatz, 2001a). The concentration of protein
stock solution was analyzed by activity assay (Pan and Glatz, 2001a). Salt solutions were
prepared by dissolving appropriate amounts of NaCl or NaSCN in lOmM sodium acetate pH
5.5 solution. All solutions were prepared using deionized water (Bamstead, Nanopurell
water treatment system, Bamstead CO., Boston, MA) and then filtered (0.2 fim cellulose
acetate filters, Gelman Sciences, Ann Arbor, MI). All dilute samples were prepared by
weight using a Mettler analytical balance.
Multi-ansle laser lisht scattering
All experiments were performed at room temperature (23 °C). The measurement of
the second virial coefficient, B2, was carried out with a DAWN-B light scattering instrument
(Wyatt Technologies, Santa Barbara, CA). A graphical technique, the "Zimm plot", was

122
used to extrapolate the value of the Rayleigh ratio to zero angle for each protein
concentration. The second virial coefficient, B?, and molecular weight, M, were obtained
from the slope and intercept of the plot at zero angle, based on the light-scattering equation
(Kratochvil, 1987).
Kc i 1T=M + 2B^ (6-7)
•J (6-8)
Na>I dcp
where Rg is the Rayleigh ratio related to the intensity of the scattered and incident light; cp is
the protein concentration, g/ml; NA is the Avogadro's constant; Â is the wavelength of the
incident light.
(1) Determination of dn/dc
The refractive index increment of the protein was measured (OPTILAB 903
Differential Refractometer, Wyatt Technologies, Santa Barbara, CA) at a wavelength of
633nm. Anhydrous sodium chloride dissolved in water (dn/dc = 0.174 at 633 nm) was used
to calibrate the refractometer. Five protein samples ranging in concentration from 0.5 to 5
mg/ml were prepared in disposable culture tubes and injected into the measuring cell by
siphon. Measurements were in order of increasing concentration, taking care to avoid
bubbles entering the input tube between samples to prevent the axial mixing of sample
solutions. After the last sample, the sample cell was flushed with the buffer until the reading
returned to baseline. The data were processed with DNDC v 3.03b (provided with the
instrument).
(2). Multi-angle light scattering
123
A 5 mW helium-neon laser at a fixed wavelength of 633 nm was used as the incident
light source. 15 detectors at different angles ranging from 23° to 128° were used to record
light intensity. Borosilicate glass scintillation vials were used as the sample cells in the
DAWN-B instrument. Toluene with R90633 = 14.06 x 10"* cm~x was used to calibrate the
instrument. The intensity of scattered light was collected first with about 10g of the highest
concentration protein sample dilution (~ 5 mg/ml). The protein solution in the vial was then
diluted by adding filtered (0.02 jjm Anotop syringe-tip filters, Whatman) buffer. Each series
of dilutions provided 7 concentration levels. The DAWN bl.O version software (Wyatt
Technologies, Santa Barbara, CA) was used to process the data. A Zimm plot was
automatically generated for obtaining the second virial coefficient.
Calculation of properties of protein
The protein charge, z, was calculated for any given salt concentration at pH 5.5 using
the program MacroDox (Northrup et al., 1999). The atomic coordinates of Properase® and
Purafect® subtilisin were provided by Genencor International, Inc. The effective spherical
radius was estimated from the excluded volume, which is 1.7 times the molecular volume,
because surface roughness may increase the excluded-volume effect of a protein (Neal and
Lenhoff, 1995). The molecular volume was assumed as a summation of the Voronoi
volumes of the interior atoms and the van der Waals volumes of surface atoms. The Voronoi
volume was calculated using the NIH online server
(http://moIbio.info.nih.gov/structbio/surfvoI.html). The hydrated ionic radii were from
Marcus (1991). The properties of the two subtilisin mutants are listed in Table 6-2.

124
Results and Discussion
Measurement of Bi in various salt solutions
The protein second virial coefficients for Properase® and Purafect® subtilisin in
various solutions are shown in Figure 6-1. With increasing salt concentration, the value of
changed from positive to negative, indicating that the protein-protein interaction changed
from repulsion to attraction. Crystallization experiments have been conducted under the
same solution conditions at which the protein second virial coefficients were measured (Pan
and Glatz, 2001a). Crystallization required high protein concentration for nucleation and
produced fewer crystals for conditions with positive Bo (i.e. 0.05M NaSCN and 0.1 M
Table 6-2. Protein properties of two subtilisin mutants in various salt solutions (pH 5.5)
Properase Purafect
Molecular Weight, Mp, g/mol 26,695 26,683
Molecular Volume, VM, Â3 37810 37607
Effective spherical radius, a, Â 24.7 24.7
Charge, z I = 0.05 8.779 8.786
1 = 0.1 8.971 8.978
1 = 0.2 9.136 9.143
1 = 0.5 9.301 9.308
1 = 0.8 9.362 9.368
1 = 1.0 9.386 9.393
1= 1.5 9.424 9.431

125
1 -2
Z -4 %
CD
Properase, NaCl Properase, NaSCN Purafect, NaCl
-6
-8
0.5 1 Sait concentration (M)
1.5
Figure 6-1. Experimental second virial coefficient of two subtilisin mutants in various salt
solutions (A, Properase subtilisin in NaCl solutions; A, Purafect subtilisin in
NaCl solutions and ®, Properase subtilisin in NaSCN solutions).

126
NaCl). However, crystallization from conditions with moderately negative Bi were favorable
for protein crystallization, in agreement with the crystallization slot proposed by George and
Wilson (1994) and tested by others (Guo et al., 1999; Bonnete et al., 1999).
From Figure 6-1, it was noted that the variation of with salt concentration is
greater in NaSCN than in NaCl and B? of Properase® subtilisin in NaSCN is lower than that
in NaCl for the same salt concentration. This evidence of stronger attraction between
Properase® molecules in NaSCN than in NaCl may be due to the stronger binding between
subtilisin and SCN". Scatchard et al. (1950a, 1950b) found the binding strength between
albumin and SCN" is 25 times higher than that between albumin and CI". Binding would
decrease the net positive charge of subtilisin at the crystallization pH and thus electric
double-layer repulsion, so B? would decrease. At the same salt concentration, the second
virial coefficients for Properase® and Purafect® were different, which means point mutations
do affect the protein-protein interaction.
Determination of effective Hamaker constants
The dispersion potential is among the main short-range interaction. The expression
for the dispersion potential is based on a continuum model, in which the Hamaker constant is
an adjustable parameter. Nir (1976) found that the Hamaker constant depends on the
composition and the density of the protein and the chemical nature of the solute. In this
work, we used a DLVO-type model to calculate the effective Hamaker constant for subtilisin.
The osmotic attraction potential was added to the DLVO model (Equation 6-2) for
calculating the potential of mean force, PPj. By fitting the experimental second virial
coefficients with Equation 6-1 (the expressions for potential and the protein properties used
are listed in Tables 6-1 and 6-2), we fitted the Hamaker constants for each protein mutant in

127
each type of salt solution. The objective function to be minimized was chosen as the sum of
the squares of the difference between the measured and the calculated values of B?. The
comparison between the experimental and best-fit calculated second virial coefficients for
Properase® subtilisin in NaCl solutions is shown in Figure 6-2. The fitted Hamaker constants
for Properase® subtilisin in NaCl and NaSCN solutions are 5.1kT and 6.8kT, respectively,
whereas the Hamaker constant for Purafect® in NaCl solution is 4.4kT. These values are
1.4-2.2 times higher than that expected from a spherical particle interaction model based on
water dielectric data (3.1 kT, Roth et al., 1996a, 1996b), but they are closer to 5kT, an
approximate value proposed by Nir (1976).
To illustrate the relative contribution of each interaction term at different solution
conditions (0.1 M NaCl and 1.5M NaCl), we dissect B? as two contributive terms: B2O1S),
attributed to the hard sphere potential, and B2(other), a summation from the other potential
contributions. The relative contributions of charge-charge electrostatic, Wq^, dispersion,
Wdisp, and osmotic attraction potential of ions, Woa, to the potential of mean force, W2, are
shown in Figure 6-3. At low salt concentration (0.1 M NaCl), Wq^ is larger than Woa and its
absolute value decreases more slowly with increasing center-to-center distance, r, than that of
Wdisp. The contribution of these three potential terms to Bi, B2(other), is —0.46x10"4
mL-mol/g2, whereas B2(hs) is 2.129x10"^ mL-mol/g2. Therefore, the repulsion between
protein molecules is dominant and the second virial coefficient is positive. However, at high
salt concentration (1.5M NaCl), the osmotic attraction effect of ions becomes large and Wq^
is small and decays rapidly with increasing r. As a result, B2(other), is -6.83 lxlO"4

128
mL-mol/g2, whereas Bi(hs) remains 2.129x10"* mL-mol/g2. The contribution of Bofother)
increases about 15 times. Thus Sj is negative and protein-protein interaction is attractive.
Since the difference between the mean ionic hydrated diameters of NaCl and NaSCN
is very small (a;: NaCl, 2.2 Â; NaSCN, 2.3 Â), the osmotic attraction potential does not
reflect completely the effects of the nature of salt on the second virial coefficient. Part of the
o E
S cû
2
1
0
- 1
-2
-3
-4
-5
-6
O
O
• experimental O calculated
0.5 1
Salt concentration (M)
1.5
Figure 6-2.Experimental and best fit values of 5? (H = 5.1kT), based on the DLVO model
and osmotic attraction potential, for Properase® subtilisin in NaCl of pH5.5.

129
10
Wdisp (0.1 M and 1.5M NaCl)
1
O.IMNaCI
oa. 1.5MNaCI
Woa, O.IMNaCI
Wq-q, 1.5MNaCI
2 2.2 2.6 2.8 3 2.4
Dimensionless distance, r/a
Figure 6-3. Magnitude of various potential terms of Properase® subtilisin in 0.1 M NaCl
and 1.5M NaCl solutions (H = 5.1kT). Wdisp is the dispersion potential, Wq_q is
the charge-charge electrostatic potential and Woa is the osmotic attraction
potential, k is the Boltzmann constant, T is the temperature, r is the center-to-
center distance between two molecules and a is the effective spherical radius.

130
effects of salt type, such as those that would arise from ion binding, are incorporated into the
effective Hamaker constant, which is consistent with Nir's conclusion (1976) about the
dependence of the Hamaker constant on the chemical nature of the solute.
Protein-protein interactions and protein crystallization
The measured protein second virial coefficient shows a positive relation with the
solubility of protein (Pan and Glatz, 2001a) (Figure 6-4). With the increase of the protein
3
2
1
0
f-1 E E. -2
0 1 -3 CD
-4
-5
-6
0 5 10 15 20 25 30
Solubility (mg/mL)
Figure 6-4. Correlation between the second virial coefficient and the solubility (For
Properase®subtilisin, K = -1.10, Ac= 1.2; for Purafect®subtilisin, K = -1.01,
Ac= 0.2)
A "
• A •
A •
A •
• Properase, NaCl • Properase, NaSCN
1 A Purafect, NaCl — model

131
second virial coefficient, the protein-protein interactions change from attraction to repulsion,
and protein molecules have less tendency to aggregate; thus, the solubility increases. The
effectiveness of salt in decreasing the solubility of Properase® subtilisin is consistent with its
effectiveness in decreasing Bf. Properase® has lower solubility and B2 in NaSCN than in
NaCl at the same salt concentration.
According to the theoretical correlation between the second virial coefficient and the
solubility derived by Ruppert et al. (2001) (Equation 4), the adjustable parameters, Ac and K,
were fitted for Properase® subtilisin.. The partial molar volume of subtilisin is tabulated
(Creighton, 1983) and its refractive index increment was measured in light scattering
experiment. The fitted Ac and K of Properase® subtilisin are 1.2 and -1.10, respectively,
where the fitted Ac and K of Purafect® subtilisin are 0.2 and —1.01, respectively. All of the
fitted values are qualitatively consistent with their theoretical expectations. The point
mutations between two mutants largely affect the fitted Ac. The fitted B2 from Equation 4 are
shown in Figure 4. At low solubility, the fitted and experimental values are comparatively
close, raising the possibility of using virial coefficients as a predictor of solubility. The
discrepancy at high solubility may result from the growing and unaccounted importance of
multi-body interactions in solutions of high protein concentration. Therefore, the solubility
prediction should be limited to when the second virial coefficient is slightly negative.
Conclusions
The measured second virial coefficients (B2) of Properase® and Purafect® subtilisin at
0.1M-1.5M NaCl solutions and 0.05M ~ 0.8M NaSCN solutions ranged from -6.45x10"4 to

132
+2.2x10"4 mLmol/g2. At low salt concentration, repulsive interactions between protein
molecules are dominant {Bz >0). With the addition of salt, the overall interaction between
proteins becomes attractive, which is the origin of salting-out. Combined with the
crystallization studies of Properase® and Purafect®, our results showed the conditions
favorable for crystallization have a slightly negative second virial coefficient and supported
the crystallization slot proposed by George and Wilson (1994). The effects of the nature of
salt on B2 are represented by the hydrated radii of ions and the effective Hamaker constant.
The effective Hamaker constants of Properase® subtilisin in NaCl and NaSCN solution were
5.1 and 6.8 kT, respectively. Point mutations affected Bo and the effective Hamaker constant,
which was 4.4 kT for Purafect® subtilisin. Protein solubility may be correlated with the
second virial coefficient when the second virial coefficient is slight negative.
Acknowledgements
This work is supported by the National Science Foundation under grant number BES-
9510302. The authors would also like to thank Todd Becker of Genencor International for
the generous supply of subtilisin and Rick Bott of Genencor International for providing the
atomic coordinates of the subtilisin structures.
References
Asakura, S., and F. Oosawa, "On Interaction between Two Bodies Immersed in a Solution of Macromolecules," J. Chem. Phys., 22, 1255 (1954).
Asakura, S., and F. Oosawa, "Interaction between Particles Suspended in Solutions of Macromolecules," J. Polym. Sci., 33, 183 (1958).

133
Bonnete, F., S. Finet, and A. Tardieu, "Second Virial Coefficient: Variations with Lysozyme Crystallization Conditions," J. Cryst. Growth, 196, 403 (1999).
Coen, C. J., H. W. Blanch, and J. M. Prausnitz, "Salting Out of Aqueous Proteins: Phase Equilibria and Intermolecular Potentials," AAChE J., 41, 996 (1995).
Creighton, T. E., Proteins: Structures and Molecular Principles, W.H. Freeman and Company, New York (1983).
Curtis, R. A., J. M. Prausnitz, and H. W. Blanch, "Protein-protein and Protein-salt Interactions in Aqueous Protein Solutions Containing Concentrated Electrolytes," Biotech. Bioeng., 57, 11 (1998).
George A., and W. W. Wilson, "Predicting Protein Crystallization from a Dilute Solution Property," Acta Cryst., D50, 361 (1994).
George A., Y. Chiang, B. Guo, A. Arabshahi, Z. Cai, and W. W. Wilson, "Second Virial Coefficient as Predictor in Protein Crystal Growth," Meth. Enzym., 276, 100 (1997).
Guo, B., S. Kao, H. McDonald, A. Asanov, L. L. Combs, and W. W. Wilson, "Correlation of Second Virial Coefficients and Solubilities Useful in Protein Crystal Growth, J. Cryst. Growth, 196, 424 (1999).
Hill, T. L., Statistical Mechanics. Principles and Selected Application. Dover, Mineola, NY (1987).
Kratochvil, P. Classical Light Scattering from Polymer Solutions. Elsevier Science Publishing Co., Inc., New York, (1987).
Marcus, Y., "Thermodynamics of Solvation of Ions: Part 5. Gibbs Free Energy of Hydration at 298.15K,"/. Chem. Soc. Faraday Trans., 87(18), 2995 (1991).
Matthew, B. W., "Solvent Content of Protein Crystals," J. Mol. Biol., 33, 491 (1968).
McMillan W. G., and J. E. Mayer, "The Statistical Thermodynamics of Multi-Component Systems," J. Chem. Phys., 13, 276 (1945).
Neal, B. L., and A. M. Lenhoff, "Excluded Volume Contribution to the Osmotic Second Virial Coefficient for Proteins," AIChE J., 41(4), 1010 (1995).
Neal, B. L., D. Asthagiri, O. D. Velev, A. M. Lenhoff, and E. W. Kaler, "Why is the Osmotic Second Virial Coefficient Related to Protein Crystallization?" J. Cryst. Growth, 196, 377(1999).
Nir, S., "Van-der Waals Interactions between Surfaces of Biological Interest," Prog. Surf. Sci. 8, 1 (1976).

134
Northrup, S. H., G. P. Stevenson, T. L. Laughner, A. Boswell, and K. Mukhyala, http://pirn.chem.tntech.edu/macrodox.html
Pan, X., and C. E. Glatz, " Solvent Effects on the Growth Kinetics of Subtilisin Crystals," to be submitted to J. Cryst. Growth, (2001a)
Pan, X., and C. E. Glatz, "Solvent Role in Protein Crystallization as Determined by Pressure Dependence of Nucleation Rate and Solubility" to be submitted to Crystal Growth & Design, (2001b)
Rosenberger, F., P. G. Vekilov, M. Muschol, and B. R. Thomas, "Nucleation and Crystallization of Globular Proteins — What We Know and What is Missing," J. Cryst. Growth, 168, 1 (1995).
Rosenbaum, D. F., and C. F. Zukoski, "Protein Interactions and Crystallization," J. Cryst. Growth, 169, 752 (1996).
Roth, C. M., and A. M. Lenhoff, "Improved Parametric Representation of Water Dielectric Data for Lifshitz Theory Calculations," J. Colloid Interface Sci., 179(2), 637 (1996a).
Roth, C. M., B. L. Neal, and A. M. Lenhoff, "Van der Waals Interactions Involving Proteins," Biophys. J., 70, 977 (1996b).
Ruppert, S., S. L. Sandler, and A. M. Lenhoff, Correlation between the Osmotic Second Virial Coefficient and the Solubility of Proteins," Biotechnol. Prog., 17, 182 (2001).
Scatchard, G., I. H. Scheinberg, and S. H. Armstrong, "Physical Chemistry of Protein Solutions. IV. The Combination of Human Serum Albumin with Chloride Ion.," J. Amer. chem. Soc., 72, 535 (1950a).
Scatchard, G., I. H. Scheinberg, and S. H. Armstrong, "Physical Chemistry of Protein Solutions. V. The Combination of Human Serum Albumin with Thiocyanate Ion.," J. Amer. chem. Soc., 72, 540 (1950b).
Velev, O. D., E. W. Kaler, and A. M. Lenhoff, Protein Interactions in Solution Characterized by Light and Neutron Scattering: Comparison of Lysozyme and Chymotrypsinogen," Biophys. J. 75, 2682 (1998).
Verwey E. J. W., J. T. K. Overbeek J.T.K. Theory of Stability ofLyophobic Colloids, Elsevier, Amsterdan (1948).
Vilker, V. L., C. K. Colton, and K. A. Smith, "The Osmotic Pressure of Concentrated Protein Solutions: Effects of Concentration and pH in Saline Solutions of Bovine Serum Albumin," J. Colloid Interface. Sci, 79(2), 548 (1981).

135
CHAPTER 7. GENERAL CONCLUSION
The solubility of subtilisin. decreased with the increasing salt concentration, following
the reverse order of the Hofmeister order: SCN~>NO3 ">C 1". At the same salt solution, the
solubility of Properase® subtilisin is higher than Purafect® and Purafect® OX subtilisin. The
required supersaturation for the same growth rate of subtilisin crystals increased when
solubility decreased. The length/diameter ratio of subtilisin crystals increased with the order
of Cl" < NO3" < SCN", whereas the length/diameter ratio of Properase subtilisin crystals was
lower than other two mutants for the same salt solution.
For Properase® and Purafect® mutants, each molecule contacts with other eight
molecules within 4.5Â. There are two contacts along the length dimension of crystal. More
favorable non-electrostatic free energy along the length-dimension explain the faster growth
in that direction. Compared to Purafect® subtilisin, Properase® has more amino acid
involved in contact patches and its contact patches have more hydrogen bonds and larger
reduction of accessible surface area upon crystallization, which may be responsible for the
faster growth of Properase® crystals.
Solubility of Properase® subtilisin increased with increasing pressure, giving a total
volume change for crystallization of 37 cm3/mol. The average dependence of nucleation rate
on supersaturation over the studied pressures was the order of 1.3. Nucleation rate decreased
at high pressure and an activation volume of226 cm3/moI was estimated. Hydration shell of
protein consists of more than one layer of water molecules. Volume changes during
crystallization process result from the movement of water from hydration layers to the bulk.

136
The second virial coefficient (Bi) of subtilisin under the studied crystallization
conditions ranged from —6.45x10"4 to +2.2x10"4 mLmol/g2, supporting that conditions with
slight negative B2 favor protein crystallization, B2 of subtilisin decreased with increasing salt
concentration, resulting in a positive relation with protein solubility. The effective Hamaker
constants of Properase® subtilisin in NaCl and NaSCN solution were 5.1 and 6.8 kT,
respectively. Point mutations affected B2 and the effective Hamaker constant which was 4.4
kT for Purafect® subtilisin.

137
APPENDIX A: COMPUTER PROGRAM FOR CALCULATION OF INTERACTION FREE ENERGY IN CHAPTER 4
This program calculates the non-electrostatic interaction free energy between two protein molecules along a certain contact direction, where one molecule has the fixed orientation and the other rotates along its own center by the interval of 20° to obtain 2916 (=18x9x18) different orientation. This program is written by C++ language and requires four input files.
Input files: 1. inFilel contains the coordinates of atoms and its Voronoi volume as following format.
No. Atom Residue X(Â) Y(Â) Z(A) Volume (Â3) 10 CG GLN -2.491 -27.704 -25.385 23.95
2. inFile2 contains the symmetry operation for creating the coordinates of molecule mating with the molecule defined in inFilel.
Format: The coordinates of center of the molecule defined in inFilel :X,Y,Z Three dimensions of unit cell: a,b,c Symmetry operation: symxl,symx2, symyl,symy2,symzl,symz2
e.g. 0,-1,1/2,1,1/2,-1 means-x, 14+y, %-z Translation operation: transA, transB, transC
3. inFile3 (Lable.pra) assigns two numbers for searching the OPLS parameter and van der Waals radius to each type of atom, whereas inFile4 (OPLS.pra) assigns e; (the minimum interaction energy) and <Tj (the collision diameter) for each type of atom. They are available with the program and do not need changes.
Lable.pra atom residue No. for OPLS No. for VDW radius OPLS.pra No. for OPLS cr s
Execute this program: % exe.file inFilel inFile2
Program: #include <string> #include <iostream> #include <fstream> #include <math.h>
char in_filel [20],in_file2[20]; //define the char variables for the name of input files using namespace std;
class calculation // define class
138
public: fstream inFiIel,inFile2; //the input file fstream inFile3,inFile4; //the parameter file: 3=Label; 4=OPLS fstream outFile 1 ; //output
//define global variables: sg is aand ep is 8, dl is molecule 1, d2 for molecule2 double d 1 x[2000] ,d 1 y [2000] ,d 1 z[2000] ,d 1 v[2000],d 1 sg[2000] ,d 1 ep[2000] ; double d2x[2000],d2y[2000],d2z[2000],d2v[2000],d2sg[2000],d2ep[2000]; long lines 1, lines2, line3, Iine4; //the number of the lines of the file double symxl ,symx2,symy 1 ,symy2,symzl ,symz2; //symmetry operation double transA, transB, transC; //translation operation double cellA, cellB, cellC; //the dimension of unit cell string atom[2000], res[2000], Patom[200], Près[200]; double OPLSsg[7Q], QPLSep[70]; int OPLSnum[200], VDWnum[200]; double xCenter[2], y Center [2], zCenter[2]; //the coordinates of center double A[3][3]; // rotation matrix
calculationO //the initial function {
inFile 1 .open(in_fi!e 1, ios::in); if (Unfile 1) {
cerr « "\nThe input file 1 ",«in_filel«"' could not be opened." « endl; }
inFile2.open(in_file2, ios::in ); if (!inFile2) { cerr « "\nThe input file 2 ",«in_file2«"' could not be opened." « endl; }
inFile3.open("Label.pra", ios::in ); if (!inFile3) { cerr « "\nThe input Label.pra "'«"Label .pra"«'" could not be opened." « endl; }
inFile4.open("OPLS.pra", ios::in ); if (!inFile4) { cerr « "\nThe input OPLS.pra "'«"OPLS.pra"«"' could not be opened." « endl;

139
}
outFile 1 .open("result-new-ya0.out", ios::out ); if (loutFilel) { cerr « "\nThe output result.out ,,,«"result-new-ya0.out"«"' could not be opened." « endl; }
}
void ReadQ //used to read the data from the file {
string temp, datom, dres; //atom and residue double dll4,dll5,dll6,dll7; //the input data for filel string diatom, dires; //the atom and residue in filel string patom, près; // the atom and residue in parameter file 3 int i, numberOPLS, numberVDW; double psg, pep; // OPLS parameter double d5x,d5y,d5z; //the center points from file2
lines 1=0; while (inFile 1 »temp) {
inFile 1 »d 1 atom»d 1 res; inFile 1 »d 114»d 115»d 116»d 117; atom[lines 1 ]=d 1 atom; res [lines 1 ]=d 1 res; d2x [lines 1 ]=d 114; d2y [lines 1 ] =d 115 ; <±2z[linesl]=dll6; d2 v[Iines 1 ] =d 117; lines 1++;
}//end of while
lines2=linesl; inFile2»temp»d5x»d5 y»d5 z; xCenter[l]=d5x; yCenter[l]=d5y; zCenter[l]=d5z; inFile2»temp»cellA»cellB»cellC; inFile2»temp»symx 1 »symx2»symy 1 »symy 2»symz 1 »symz2 ; inFiIe2»temp»transA»transB»transC;
line3=0; while (inFile3»patom) {
inFile3»pres»numberOPLS»numberVDW; Patom[line3]=patom; Pres[line3]=pres; OPLSnum[line3]=numberOPLS; VDWnum[line3]=numberVDW;

140
line3+-r; }//end of while
i=0; while (inFi!e4»temp) {
inFile4»psg»pep; OPLSsg[i]=psg; OPLSep[i]=pep; i-H-;
}//end of while }
void assignVolume 0 //for those atoms on surface, the Voronoi volumes are //incalculable, so assign the von der Waals volumes to them
{ inti,j, k; double v, pi. vdwR[7]; pi=3.1415926; //give the vdw radius vdwR[0]=2.00; vdwR[l]=1.75; vdwR[2]=1.40; vdwR[3]=1.55; vdwR[4]=1.55; vdwR[5]=1.40; vdwR[6]=2.00;
// calculate the center points of the mating molecule xCenter[0]=symx 1 * cellA+symx2* xCenter[ l]+transA; y Center [0]=symy 1 * cellB+symy 2* y Center [ 1 ]+transB ; zCenter[0]=symz 1 * cellC+symz2 * zCenter [ 1 ]+transC;
cout«" "«xCenter[0]«" "<<yCenter[0]«" "<<zCenter[0]«endl; cout«" "<<xCenter[l ]«" "«yCenter[ 1 ]«" "«zCenter[ 1 ]«endl;
// assign volume for the surface atom and calculate the coordinates for the // mating molecule for(i=0;i<linesl ;i++) {
dlx[i]=symxl *cellA+symx2*d2x[i]+transA; d 1 y [i]=symy 1 * cellB+symy2 *d2y [i J+transB ; dlz[i]=symzl *cellC+symz2*d2z[i]+transC; dlv[i]=d2v[i];
if(d2v[i]=-l) {
for(j=0 y <line3 y ++) {
if(atom [i] =PatomO]&&res [i]=Pres 0 ] )

141
{ k=VDWnum[j]-l; v=4.*pi*pow(vdwR[k],3)/3.; dlv[i]=v; d2v[i]=v;
} }
} }
}
void assignOPLS 0 H assign the OPLS parameter for each atom {
int i, j, k; for(i=0;i<lines 1 ;i++) {
forG=0y<line3y++) {
if(atom[i]=Patom[j]&&res[i]=PresQ]) {
k=OPLSnum[j]-l; dlsg[i]=OPLSsg[k]; dlep[i]=OPLSep[k]; d2sg[i]=OPLSsg[k] ; d2ep[i]=OPLSep[k] ;
} }
} }
// calculate interaction energy for two atoms double energyCAL(double xl, double yl, double zl, double vl, double sgl, double epl, double x2, double y2, double z2, double v2, double sg2, double ep2) {
double energy; double dx2, dy2, dz2,rij, sgij, epij; double H, pi;
pi=3.1415926; H=3.1; dx2=(x 1 -x2)*(x 1 -x2); // calculate the distance between two atoms dy2=(y 1 -y2)*(y I -y2); dz2=(z 1 -z2)*(z 1 -z2) ; rij=sqrt(dx2+dy2+dz2);
if(rij>6) {
energy=-H*vl*v2/(pi*pi*pow(rij,6)); }

142
else {
sgij=sqrt(sgl *sg2); epij=sqrt(ep 1 *ep2); double tl=pow(sgij/rij,12); double t2=pow(sgij7rij,6); energy=0.5*4.*epij*(tl-t2)*4.2* 1 e3/(6.02* 1.381 *298.15);
} return energy;
}
/'/ calculate the rotation matrix double rotate(double alpha, double beta, double gamma) {
A[0] [O]=cos(alpha)*cos(beta); A [0] [ 1 ] =cos(alpha) *sin(beta)* sin(gamma)-sin(alpha) * cos(gamma) ; A[0][2]=cos(alpha)*sin(beta)*cos(gamma)+sin(alpha)*sin(gamma); A[ 1 ] [0]=sin(alpha)* cos(beta); A[1 ] [1 ]=sin(alpha)*sin(beta)*sin(gamma)+cos(alpha)*cos(gamma); A[ 1 ] [2]=sin(alpha)*sin(beta)*cos(gamma)-cos(alpha)*sin(gamma); A[2] [0]=-sin(beta); A[2] [ 1 ]=cos(beta)*sin(gamma); A[2] [2]=cos(beta)*cos(gamma);
}
// calculate the interaction free energy of two protein molecules double IFEcal(double gap, double dx, double dy, double dz, double ccd) {
int ij,k; double interEnergy, newCenter[3]; double xl,yl,zl; //coordinates of molecule 1 located in the origin double xln,yln,zln; //new coordinates of molecule 1 after rotation double x2,y2,z2; //coordinates of molecule2 after translation
interEnergy=0.0; // initialize the energy
newCenter[0]=dx*gap/ccd; // calculate the center after translation newCenter[ 1 ]=dy*gap/ccd; newCenter[2]=dz*gap/ccd;
for (i=0;i<linesl;i++) {
//put the center of mass of molecule 1 as the original x 1 =d 1 x [i] -xCenter [0] ; y 1 =d 1 y [i] -yCenter [0] ; z 1 =d 1 z[i] -zCenter [0] ;
//rotate the molecule 1 according to alpha, beta and gamma

143
x 1 n=x 1 * A[0] [0]+y 1 * A[0] [ 1 ]+z 1 * A[0] [2] ; yln=xl*A[l][0]+yl*A[l][l]+zl*A[l][2]; zln=xl*A[2][0]+yl*A[2j[l]+zl*A[2][2];
for (j=0y<lines2y'-H-) //calculate total energy { // calculate new coordinates for molecule 2 after translation
x2=d2x [j ] -xCenter [ 1 ]+newCenter [0] ; y2=d2y[)]-yCenter[ 1 ]+newCenter [ 1 ] ; z2=d2z[j ] -zCenter [ 1 ]+newCenter[2] ;
double a=energyCAL(x 1 n,y 1 n,z 1 n,d 1 v[i],d 1 sg[i], dlep[i],x2,y2,z2,d2v[j],d2sg[j],d2ep[j]); interEnergy=interEnergy+a;
} } return interEnergy;
}
void mainCALQ {
int i, j, k, angStep, Ni, Nj, Nk; double alpha, beta, gamma; double dx, dy, dz, ccd; //ccd is the distance of two centers double gapA, gapB, gapC, gapD, gapMin; double alFE, bIFE, cIFE, dIFE, minlFE; double pi, gold, errorGap;
//calculate the origional center-center distance between molecules dx=xCenter[ 1 ]-xCenter [0] ; dy=y Center [ 1 ]-yCenter[0] ; dz=zCenter[ 1 ] -zCenter[0] ; ccd=sqrt(dx* dx+dy* dy+dz*dz) ;
outFilel«" alpha beta gamma gap IFE"«endl; angStep=20; // rotation interval pi=3.1415926; gold=2/(l+sqrt(5)); // the parameter of golden section searching
errorGap=0.02; // the accuracy for determining the optimum gap Ni=360/angStep; Nj=180/angStep; Nk=Ni;
for(i=0;i<4;i++) {

144
alpha=i*angStep*pi/l 80.; for(j=0 y <Nj y ++•) {
beta=j * angStep*pi/180.; for(k=0;k<Nk;k++) {
gamma=k*angStep*pi/l 80.;
//calculate the rotate matrix rotate(alpha, beta, gamma);
//Golden section searching; gapA=35.0; gapD=70.0; gapB=gapD-gold* (gapD-gap A); gapC=gapA+gold*(gapD-gapA); bIFE=IFEcal(gapB,dx,dy,dz,ccd); cIFE=IFEcal(gapC,dx,dy,dz,ccd);
do {
if(bIFE>cIFE) {
gapA=gapB; gapB=gapC; bIFE=cIFE; gapC=gapA+gold*(gapD-gapA); cIFE=IFEcal(gapC,dx,dy,dz,ccd);
} else {
gapD=gapC; gapC=gapB; cIFE=bIFE; gapB=gapD-gold*(gapD-gapA); bIFE=IFEcal(gapB ,dx,dy,dz,ccd) ;
} } while(fabs(gap A-gapD)>errorGap) ;
gapMin=(gapA+gapD)/2; minIFE=IFEcal(gapMin, dx, dy, dz, ccd);
outFilel«" "<<i«" "<<j«" "«k «" "<<gapMin«" " <<minIFE«endl;
} }
}

145
}
-calculationQ {
inFile LcIoseO; inFile2.close(); inFile3.closeO; inFile4.c!ose(); outFilel.closeO;
} };
// main program int main( int argc, char *argv[] ) {
if (argc! =3) {
cout«"\nYou should run the program like this:"«endl; cout«" exefile datal.txt data2.txt" «endl; return -1;
} strcpy(in_file 1 ,argv[ 1 ]); strcpy(in_file2,argv [2] ) ; calculation xjpan; xjpan.ReadQ; xjpan.assignVolumeQ; xjpan.assignOPLSQ; xj pan.mainC AL() ;
return 0; }

146
APPENDIX B: COMPUTER PROGRAM FOR DETERMINATION OF THE EFFECTIVE HAMAKER CONSTANT IN CHAPTER 6
This program calculated the effective Hamaker constant by fitting the calculated second virial coefficients (Bca|) and the experimental values (Bexp). This program used NAG subroutine D01AHF to calculate integral. The error function was the square root of the square summation of the difference between Bexp and Bcai- Golden section searching was used to find the mininum error and determine the effective Hamaker constant.
Parameter.. INTEGER NOUT,NN PARAMETER (NOUT=6,NN=5) .. Scalars in Common DOUBLE PRECISION H,Is,Cs,kk,z, pi,NA,k,T,e,eps,ep,a,d23,M .. Arrays in Local DOUBLE PRECISION expI(NN),expB(NN),expZ(NN) .. Local Scalars.. DOUBLE PRECISION ep0,d3, AA,AB,AC,AD,gold, OptiA, BERROR,CERROR .. External Functions.. DOUBLE PRECISION DO 1 AHF, FUNCT1, FUNCT2, ERROR EXTERNAL DO 1 AHF, FUNCT1, FUNCT2, ERROR ..External Subroutines.. EXTERNAL D01AMF, CALB data expZ/8.895,9.031,9.232,9.365,9.402/ data expI/0.1,0.2,0.5,1.0,1.5/ data expB/2.12,0.13,-1.78,-2.39,-4.59/ .. Common Blocks .. COMMON /PARA/H,Is,Cs,kk,z COMMON /PARA2/pi,NA,k,T,e,eps,ep,a,d23,M
.. Give parameters .. pi=3.1415926 NA=6.02D23 k=1.381D-23 T-298.15 e=1.602D-19 ep0=8.854D-12 ep=4*pi*78.3*ep0 eps=4*pi*4*ep0 M=26695 a=24.7 d3=4.4 d23=a+d3/2

147
* .. Golden Section Searching .. gold=2/( 1+SQRT (5.0)) AA=1.0 AD=10.0 AB=AD-gold*(AD-AA) AC=AA+gold*(AD-AA)
H=AB BERROR=ERROR(NN,expI,expB,expZ) H=AC CERROR=ERROR(NN,expI,expB,expZ)
10 IF (BERROR.GE.CERROR) THEN AA=AB AB=AC BERROR=CERROR AC=AA+gold* ( AD-AA) H=AC CERROR=ERROR(NN,expI,expB,expZ)
ELSE AD=AC AC=AB CERROR=BERROR AB=AD-gold*(AD-AA) H=AB BERROR=ERROR(NN,expI,expB,expZ)
END IF
IF (ABS(AD-AA).GT.0.1 ) GOTO 10 OptiA = (AD+AA)/2.0 WRITE(NOUT,*) WRITE(NOUT,99998)'The Effect Hamaker Constant is',optiA STOP
*
99998 FORMAT (lx,A,F8.4) END
* .. Function to calculate error .. DOUBLE PRECISION FUNCTION ERROR(NN, expl, expB,expZ)
* .. Local scalars .. INTEGER NN,I DOUBLE PRECISION expI(NN),expB(NN),expZ(NN) DOUBLE PRECISION Vx,Vxx,y
* .. Scalars in Common DOUBLE PRECISION H,Is,Cs,kk,z

148
DOUBLE PRECISION pi,NA,k,T,e,eps,ep,a,d23,M .. Common Blocks.. COMMON /PARA/H,Is,Cs,kk,z COMMON /P ARA2/pi,NA,k,T,e,eps,ep,a,d23 ,M y=0 Do 20,1=1,NN
Is=expI(I) Cs=2.*Is kk=SQRT(Is)/3.04 z=expZ(I) CALL CALB(Vxx) Vx=Vxx* lOOOO.-expB(I) y=y+Vx*Vx
CONTINUE ERROR=y RETURN END
.. calculate the second virial coefficient.. SUBROUTINE CALB(q) .. Parameter.. INTEGER LIW,LW, NOUT PARAMETER (LW=800,LIW=LW/4) PARAMETER (NOUT=6) .. Local scalars.. DOUBLE PRECISION q,ql,q2,wl,r, boundA,B,C, EPSR, RELERR DOUBLE PRECISION boundA,B,C, EPSR, RELERR INTEGER IF AIL, N, NLIMIT, INF DOUBLE PRECISION W(LW) INTEGER IW(LIW) DOUBLE PRECISION DO 1 AHF, FUNCT1, FUNCT2 EXTERNAL DO 1 AHF, D01AMF, FUNCT1, FUNCT2 .. Scalars in Common DOUBLE PRECISION H,Is,Cs,kk,z DOUBLE PRECISION pi,NA,k,T,e,eps,ep,a,d23,M .. Common Blocks .. COMMON /PARA/H,Is,Cs,kk,z COMMON /PARA2/pi,NA,k,T,e,eps,ep,a,d23,M
wl=4*(4/3)*pi*a**3*le-24*NA/M/M boundA=2*a* 1 eO B=2*d23*le0 NLIMIT=0 EPSR = 1 .Oe-5 IF AIL = 1

149
q 1 =D01 AHF(boundA,B,EPSR,N,RELERR,FUNCTl ,NLIMIT,IFAIL)
C=1000.0 IFAIL=1 q2=D01 AHF(B,C,EPSR,N, RELERR, FUNCT2,NLIMIT, IF AIL)
IF (IFAIL.NE.O) THEN WRITE (NOUT.l 1 111) 'IF AIL = IF AIL WRITE (*,*)
END IF
q=wl-ql/2-q2/2 11111 FORMAT (IX,A,14)
RETURN END
DOUBLE PRECISION FUNCTION FUNCTl(r) .. Local scalars .. DOUBLE PRECISION r,yl,y2,y3,s .. Scalars in Common DOUBLE PRECISION H,Is,Cs,kk,z DOUBLE PRECISION pi,NA,k,T,e,eps,ep,a,d23,M .. Common Blocks .. COMMON /PARA/H,Is,Cs,kk,z COMMON /PARA2/pi,NA,k,T,e,eps,ep,a,d23 ,M
yl=(z*e)**2*EXP(-kk*(r-2*a))/(ep*r*le-10*(l+kk*a)**2) s=r/(a-l) y2=-(H*k*T/6)*(2/s**2+2/(s*s-4)+LOG((s*s-4)/s/s)) y3=-(4/3)*pi*((d23*lD-9)**3)*(Cs*NA*k*T)*(l-3*r/4/d23+((r/d23)**3/16))
FUNCT 1 =(EXP(-(y 1 +y2+y3 )/k/T)- l)*4*pi*r*r*l e-24*N A/M/M WRITE (*,*) ' FUNCT 1 FUNCTl,'r=',r RETURN END
DOUBLE PRECISION FUNCTION FUNCT2(r) ..Local scalars .. DOUBLE PRECISION r, yl,y2,y3,s DOUBLE PRECISION .. Scalars in Common DOUBLE PRECISION H,Is,Cs,kk,z DOUBLE PRECISION pi,NA,k,T,e,eps,ep,a,d23,M .. Common Blocks.. COMMON /PARA/H,Is,Cs,kk,z COMMON /PARA2/pi,NA,k,T,e,eps,ep,a,d23 ,M

150
yl=(z*e)**2*EXP(-kk*(r-2*a))/(ep*r*le-10*(l+kk*a)**2) s=r/(a-l) y2=-(H*k*T/6)*(2/s**2+2/(s*s-4)+LOG((s*s-4)/s/s)) FUNCT2=(EXP(-(yl+y2)/k/T>1 )*4*pi*r*r* 1 e-24*NA/M/M WRITE (*,*) 'FUNCT2—, FUNCT2,'r=',r RETURN END

151
ACKNOWLEDGMENTS
I would like to thank Dr. Glatz for his guidance and support throughout the course of
this work.
I would like to thank my committee members Dr. Seagrave, Dr. Honzatko, Dr.
Andreotti, Dr. Youngquist for their help suggestions.
I would like to thank Dr. Aleshin for his help for mounting crystals for x-ray
diffraction.
I would like to thank Dr. Fox for the use of computational facility.
I would like to thank Rick Bott at Genencor International, Inc. for the determination
of crystal structure, and Todd Becker at Genencor International, Inc. for the supplement of
subtilisin mutants.
I would like to thank members of Dr. Glatz's group for helpful discussion
Finally, I would like to thank my family and all my friends at ISU for their
encouragement and help.