SOLID SURFACE LAMINATE by Salasar Laminates Pvt. Ltd, Ahmedabad

Copyright © 2013 Evans Analytical Group
Surface and Interface Characterization of
Polymer Films
Jeff Shallenberger, Evans Analytical Group
104 Windsor Center Dr., East Windsor NJ
Outline
• Introduction to surface chemical techniques
– X-ray photoelectron spectroscopy (XPS/ESCA)
– Time-of-flight secondary ion mass spectrometry
(TOF-SIMS)
• Selected examples from polymer surfaces
– Identification of Defects on Metallized Polymer-PSA
Laminate
– Failed Heat Seal from medical packaging
• Examining the sub-surface
– New technology available
Copyright © 2013 Evans Analytical Group 2
© Copyright 2010 Evans Analytical
Group LLC
3
Surface chemistry related phenomena
• Wetting (hydrophobic vs. hydrophillic)
• Corrosion/oxidation
• Coatings
• Appearance (stains, hazes, residues, etc.)
• Adhesion
• Blooming, additive migration
© Copyright 2010 Evans Analytical Group LLC 4
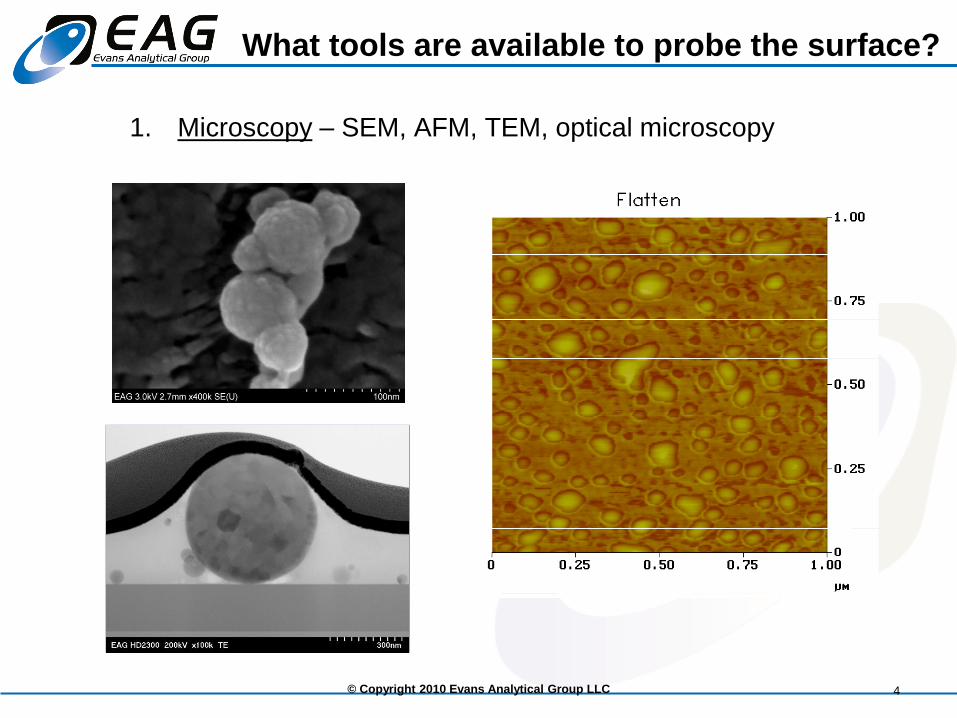
What tools are available to probe the surface?
1. Microscopy – SEM, AFM, TEM, optical microscopy
© Copyright 2010 Evans Analytical
Group LLC
5
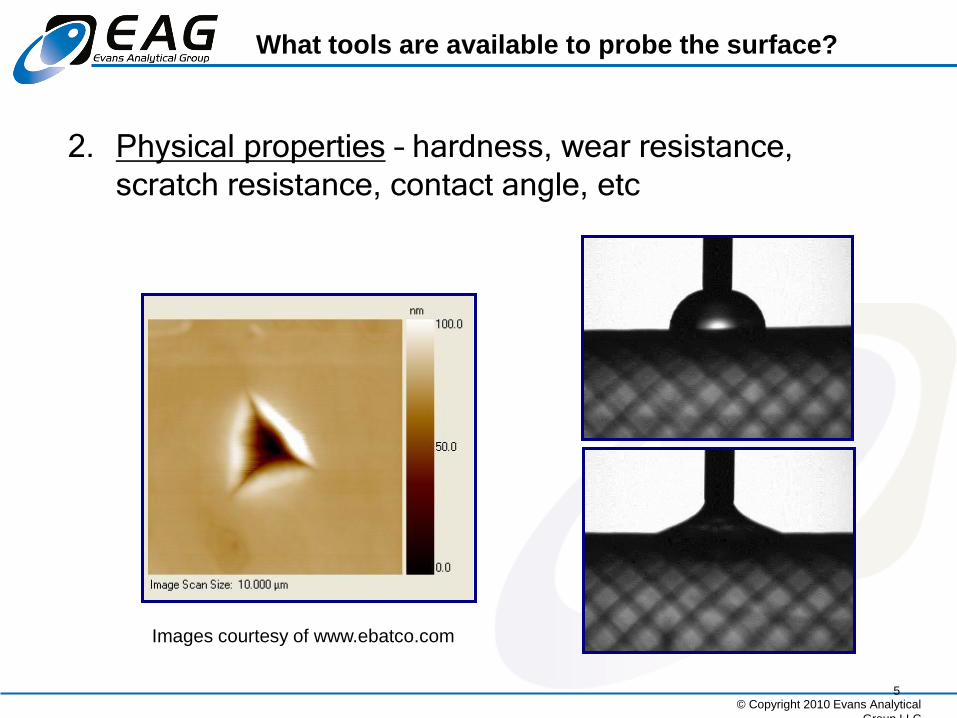
What tools are available to probe the surface?
2. Physical properties – hardness, wear resistance,
scratch resistance, contact angle, etc
Images courtesy of www.ebatco.com
© Copyright 2010 Evans Analytical Group LLC 6
What tools are available to probe the surface?
282284286288290292294296
0
1000
2000
3000
4000
5000
6000
7000
CO
O
C*F
2
-CF
2
In
ten
sity (
CP
S)
Binding energy (eV)
1/75/10, 90°
-CF
3
C-C
C*C
OO
C-O
an
d C
*H-C
F2
0 200 400 600 800 1000 1200 1400 1600 1800 2000 2200
Kinetic Energy (eV)
first derivative
E N(E)
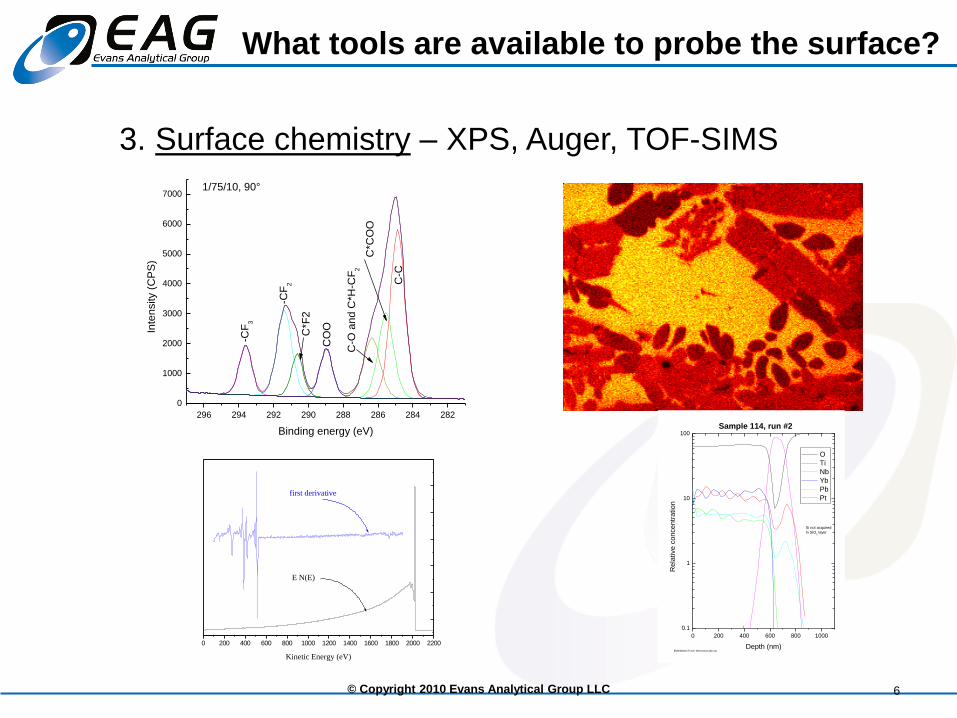
3. Surface chemistry – XPS, Auger, TOF-SIMS
0 200 400 600 800 1000
0.1
1
10
100
Si not acquired
in SiO2 layer
EMS/MatSci/Trolier-McKinstry/114b.opj
Sample 114, run #2
Re
lative
co
nce
ntr
atio
n
Depth (nm)
O
Ti
Nb
Yb
Pb
Pt
© Copyright 2010 Evans Analytical
Group LLC
7
• Indirect “surface” techniques
– Extraction approaches followed by GC/MS, ICP,
ICP-MS, etc.
• “Bulk” techniques
– XRF, SEM-EDS, XRD, ICP-MS, FTIR, Raman….
Other techniques…
© Copyright 2010 Evans Analytical
Group LLC
8
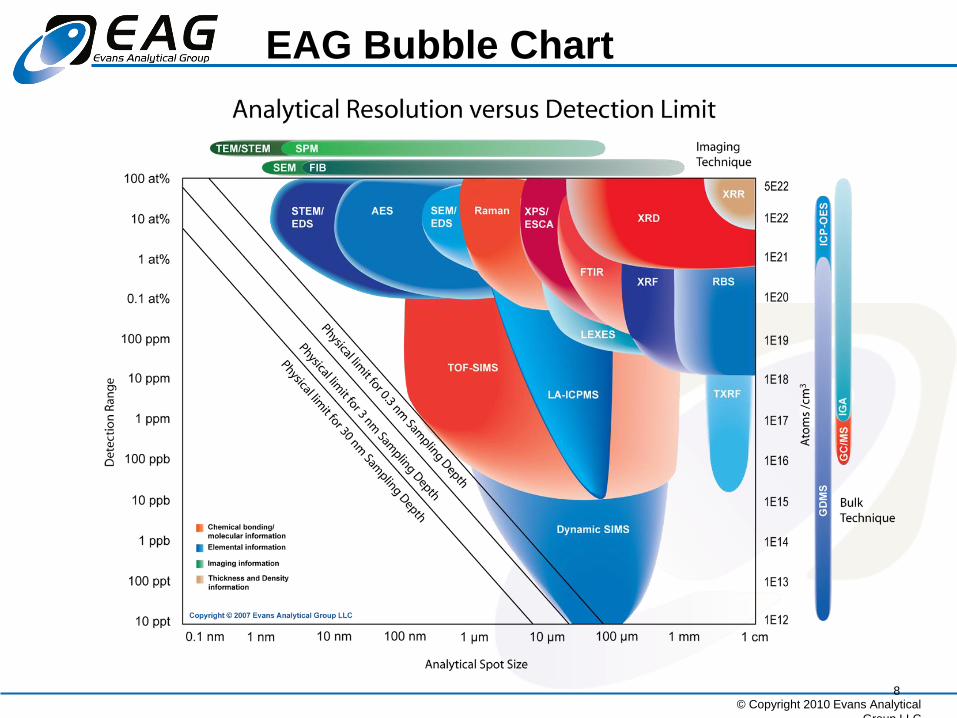
EAG Bubble Chart
© Copyright 2010 Evans Analytical
Group LLC
9
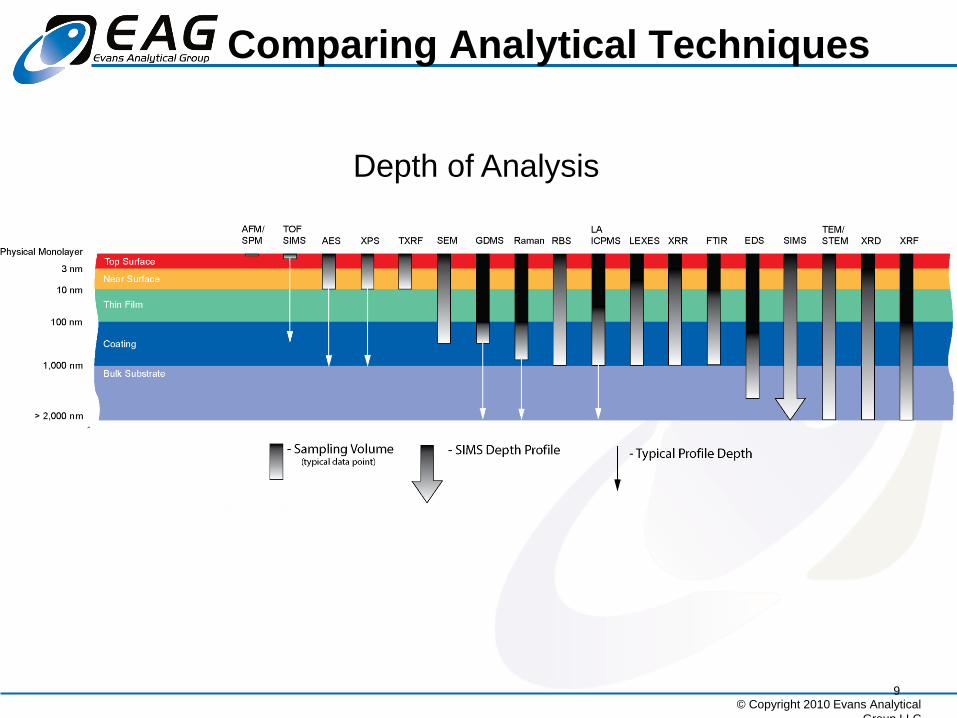
Comparing Analytical Techniques
Depth of Analysis
~
~
~
~
© Copyright 2010 Evans Analytical
Group LLC
10
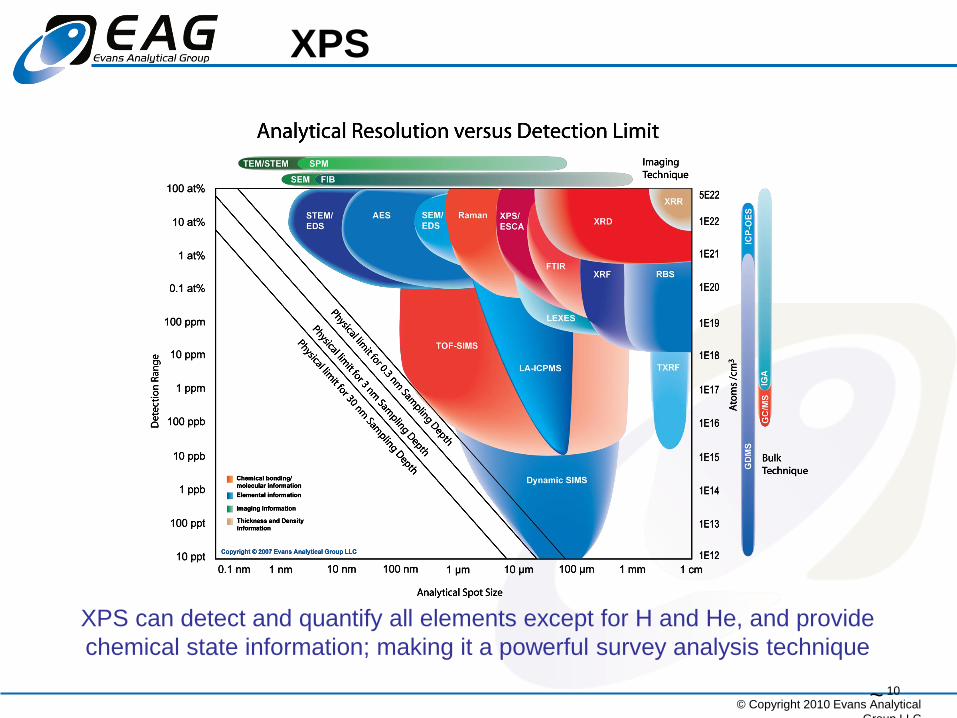
XPS
XPS can detect and quantify all elements except for H and He, and provide
chemical state information; making it a powerful survey analysis technique
~
© Copyright 2010 Evans Analytical
Group LLC
11
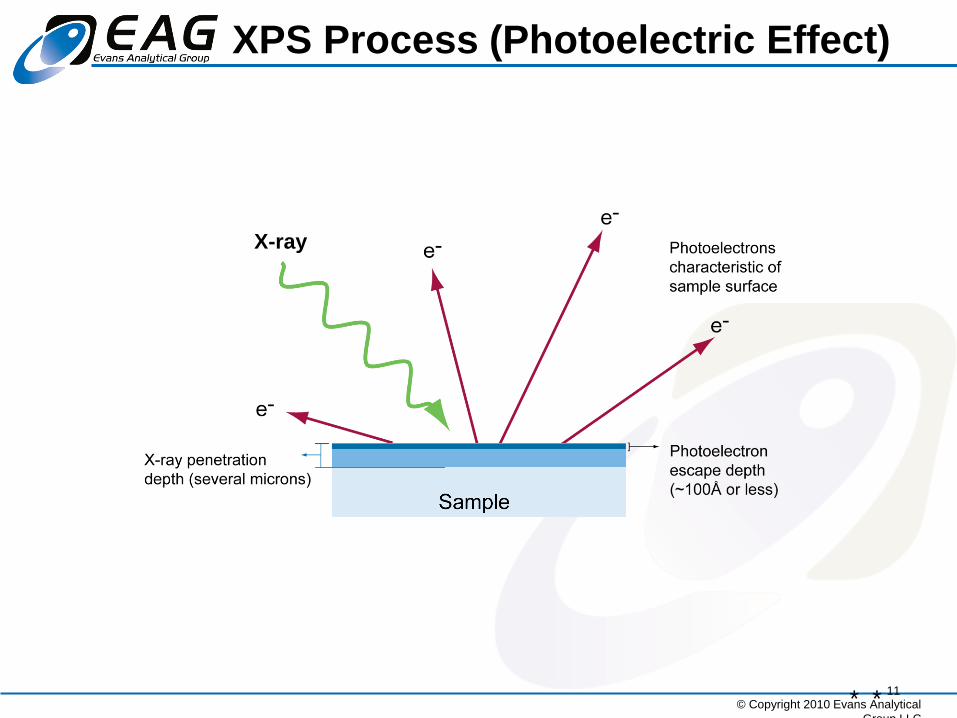
XPS Process (Photoelectric Effect)
X-ray
* *
Copyright © 2013 Evans Analytical Group 12
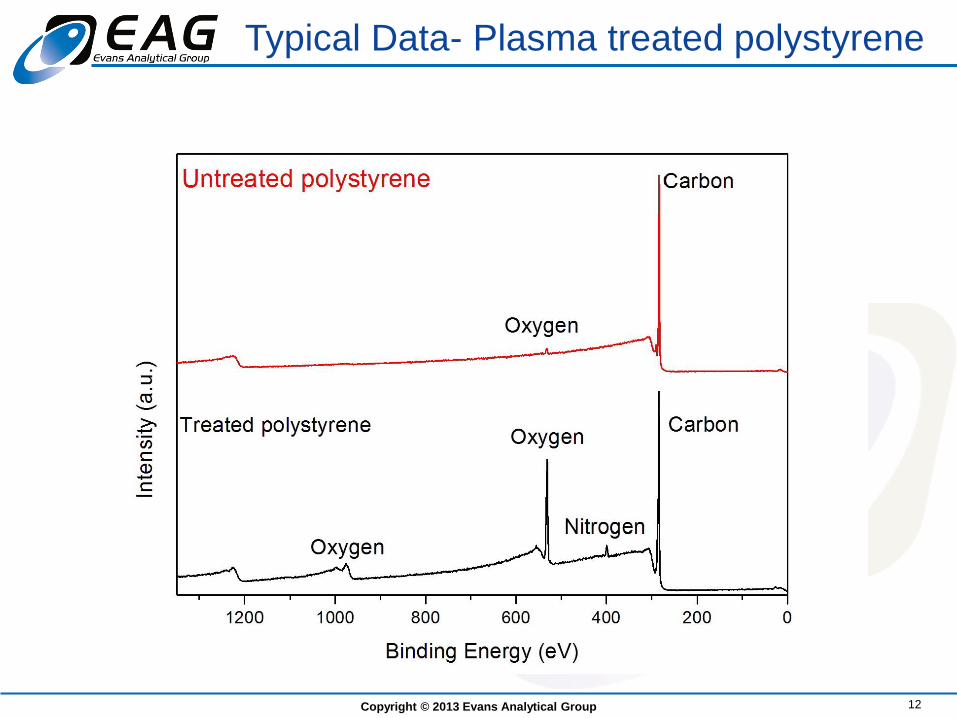
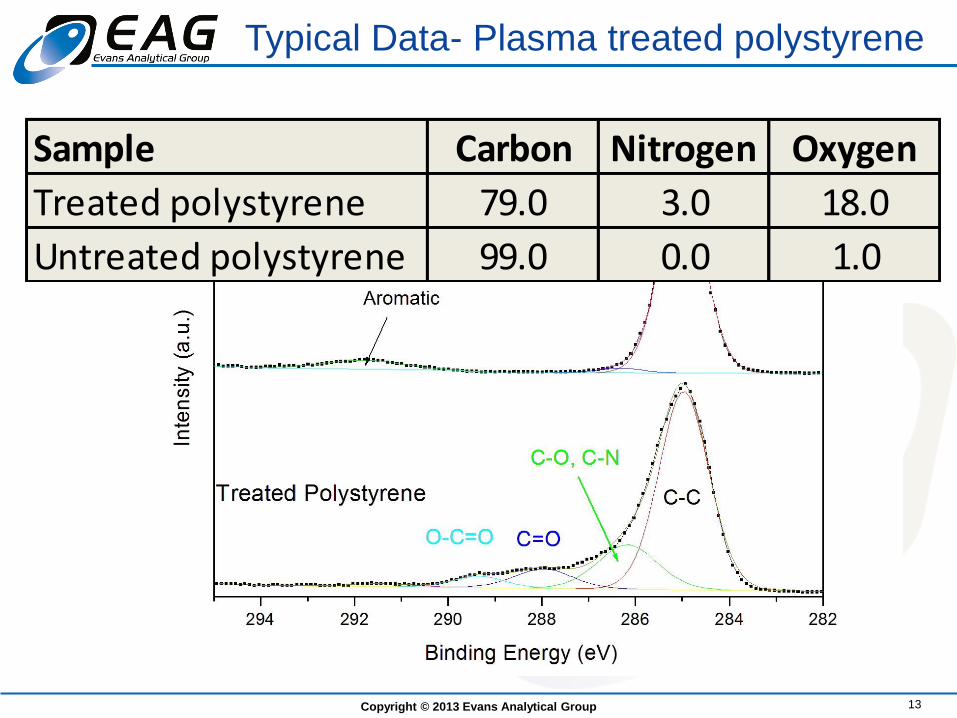
Typical Data- Plasma treated polystyrene
Copyright © 2013 Evans Analytical Group 13
Typical Data- Plasma treated polystyrene
Sample Carbon Nitrogen Oxygen
Treated polystyrene 79.0 3.0 18.0
Untreated polystyrene 99.0 0.0 1.0
XPS Summary
• Strengths
– Elemental identification of all elements except H and He
– Chemical state identification (oxidation state)
– Quantitative analysis
– Can analyze insulating samples
• Limitations
– Detection limits typically ~500 ppm
– Smallest analytical area ~10 µm
– Limited organic information
– UHV technique
Copyright © 2012 Evans Analytical Group 14
© Copyright 2013 Evans Analytical
Group LLC
15
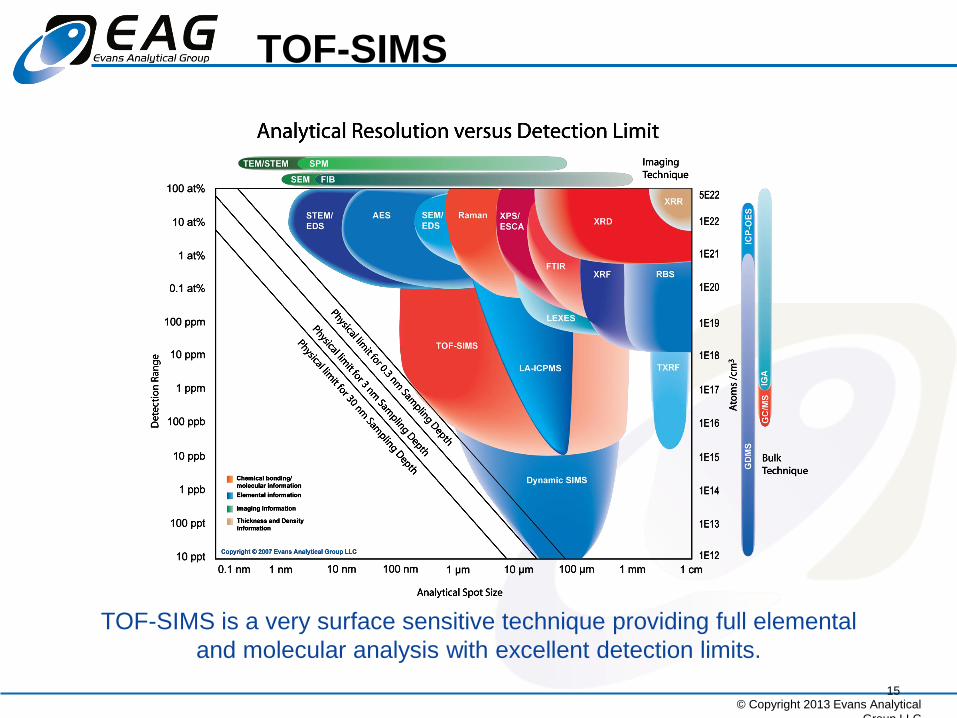
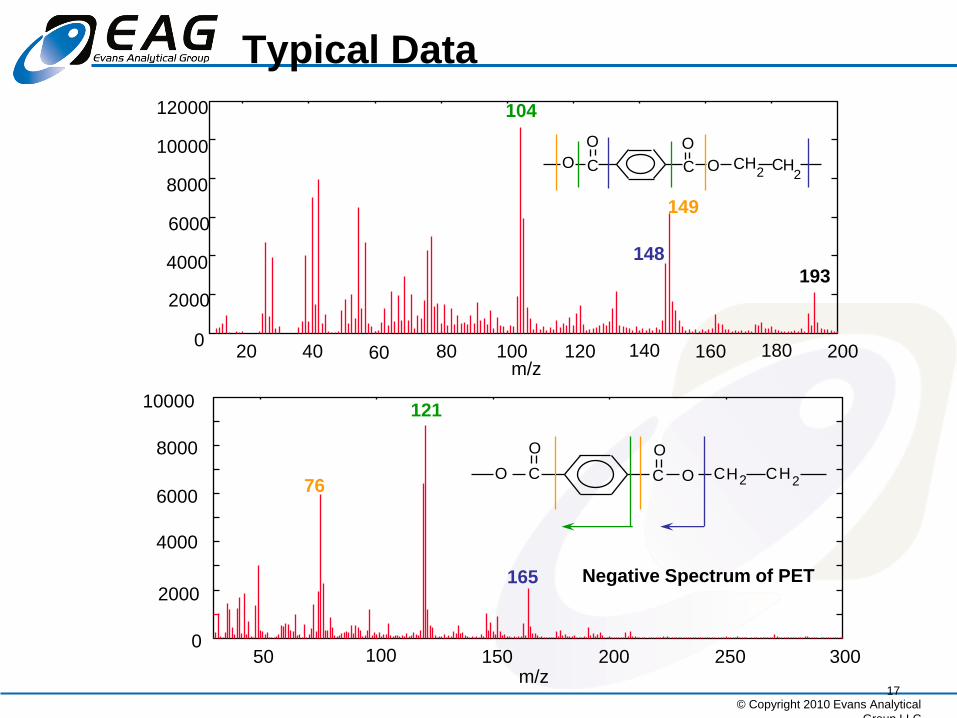
TOF-SIMS
TOF-SIMS is a very surface sensitive technique providing full elemental
and molecular analysis with excellent detection limits.
© Copyright 2010 Evans Analytical
Group LLC
16
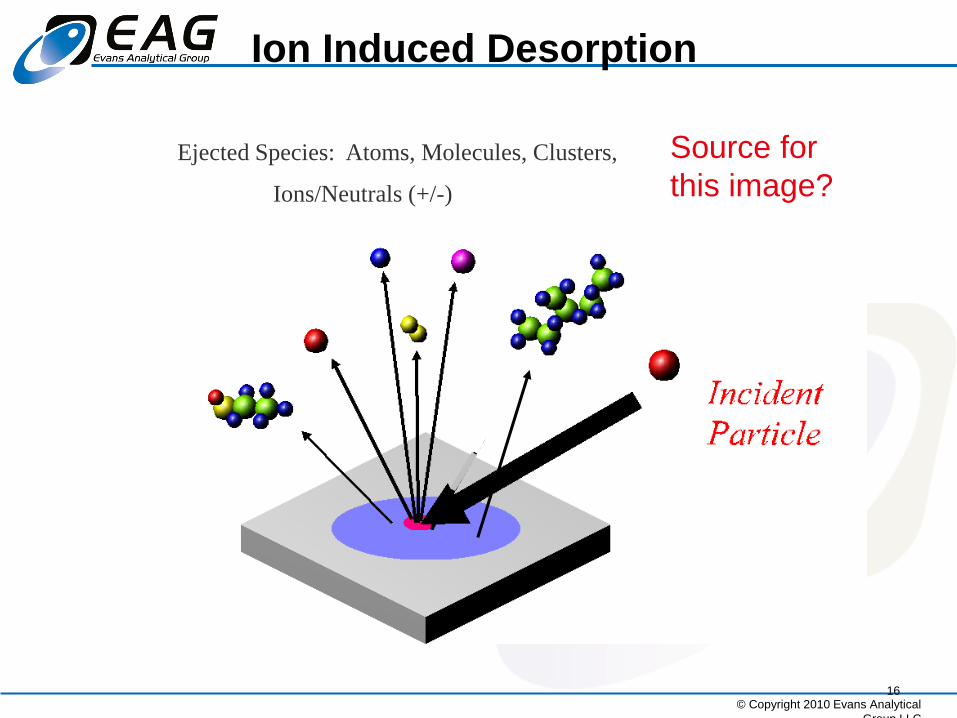
Ion Induced Desorption
Ejected Species: Atoms, Molecules, Clusters,
Ions/Neutrals (+/-)
Source for
this image?
© Copyright 2010 Evans Analytical
Group LLC
17
0
2000
4000
6000
8000
10000
12000
20 40 60 80 100 120 140 160 180 200 m/z
104
148
149
193
0
2000
4000
6000
8000
10000
50 100 150 200 250 300 m/z
76
121
165
C C O O
O O
C H 2
C H 2
C C O O
O O
C H 2 C H 2
Negative Spectrum of PET
Typical Data
© Copyright 2010 Evans Analytical
Group LLC
18
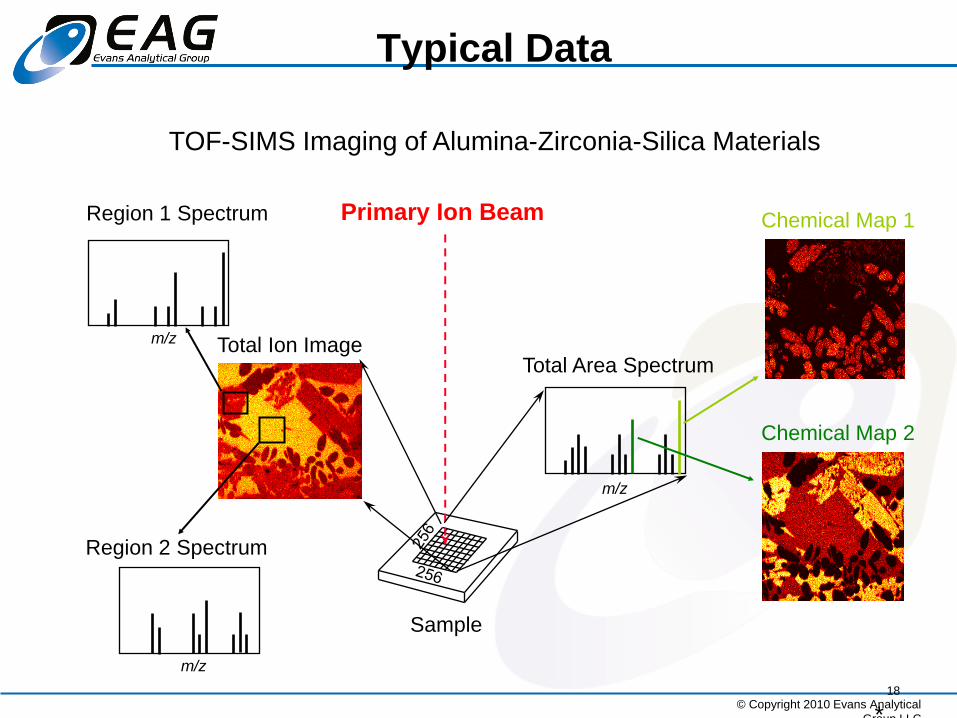
Typical Data
Primary Ion Beam
Sample
Total Area Spectrum
m/z
Total Ion Image
Chemical Map 2
Chemical Map 1
m/z
Region 2 Spectrum
m/z
Region 1 Spectrum
TOF-SIMS Imaging of Alumina-Zirconia-Silica Materials
*
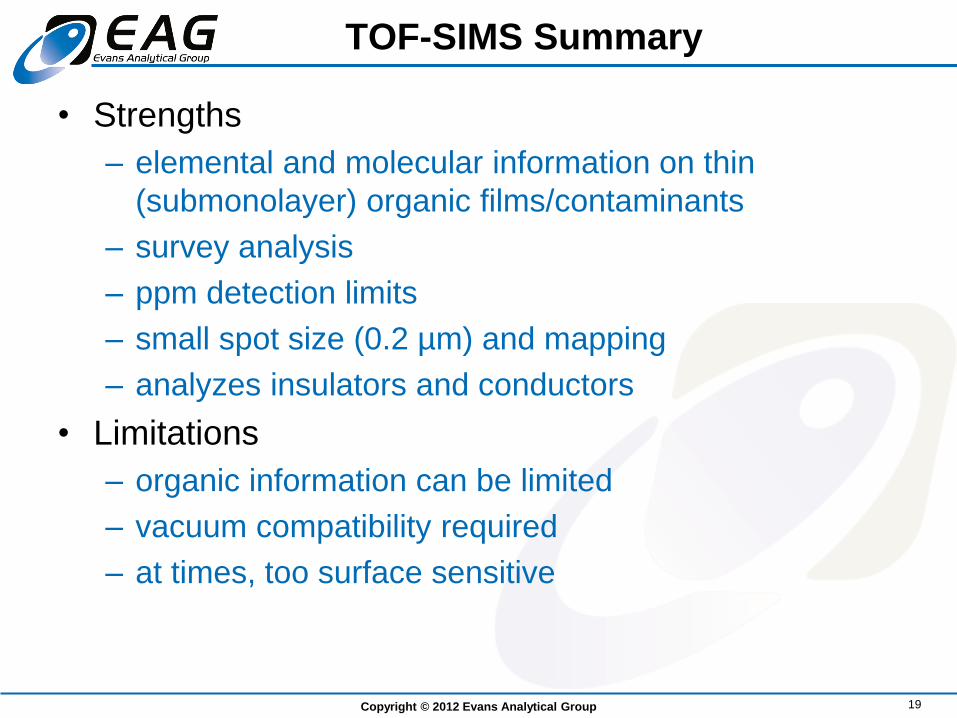
TOF-SIMS Summary
• Strengths
– elemental and molecular information on thin
(submonolayer) organic films/contaminants
– survey analysis
– ppm detection limits
– small spot size (0.2 µm) and mapping
– analyzes insulators and conductors
• Limitations
– organic information can be limited
– vacuum compatibility required
– at times, too surface sensitive
Copyright © 2012 Evans Analytical Group 19
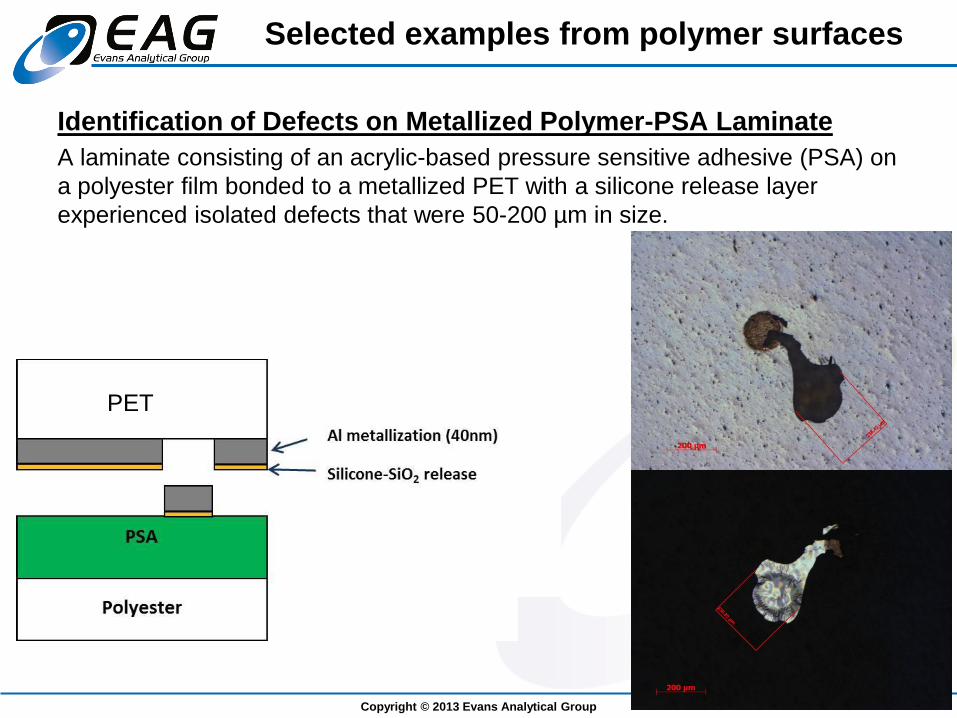
Selected examples from polymer surfaces
Identification of Defects on Metallized Polymer-PSA Laminate
A laminate consisting of an acrylic-based pressure sensitive adhesive (PSA) on
a polyester film bonded to a metallized PET with a silicone release layer
experienced isolated defects that were 50-200 µm in size.
Copyright © 2013 Evans Analytical Group 20
PET PET
Identification of Defects on Metallized
Polymer-PSA Laminate
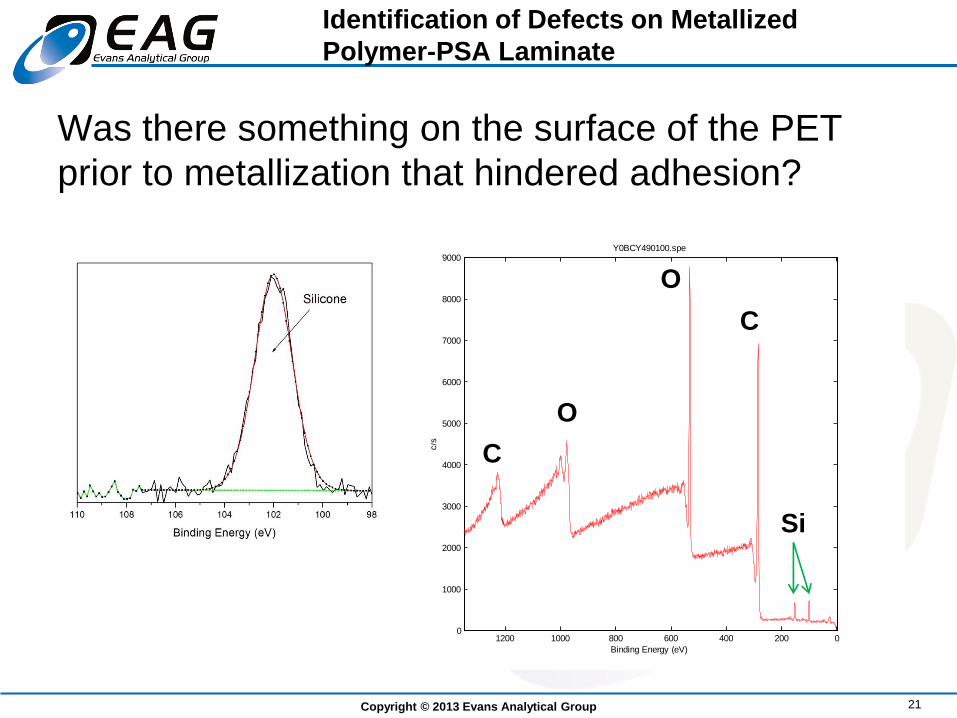
Was there something on the surface of the PET
prior to metallization that hindered adhesion?
Copyright © 2013 Evans Analytical Group 21
Y0BCY490100.spe: V6C063-090-230050 www.eag.com
2011 Apr 20 Al mono 12.5 W 50.0 µ 45.0° 187.85 eV 8.7894e+003 max 29.28 min
Su1s/Point1: Metal side larger feature/1
0200400600800100012000
1000
2000
3000
4000
5000
6000
7000
8000
9000Y0BCY490100.spe
Binding Energy (eV)
c/s
Si
C
C
O
O
Copyright © 2013 Evans Analytical Group 22
Identification of Defects on Metallized
Polymer-PSA Laminate
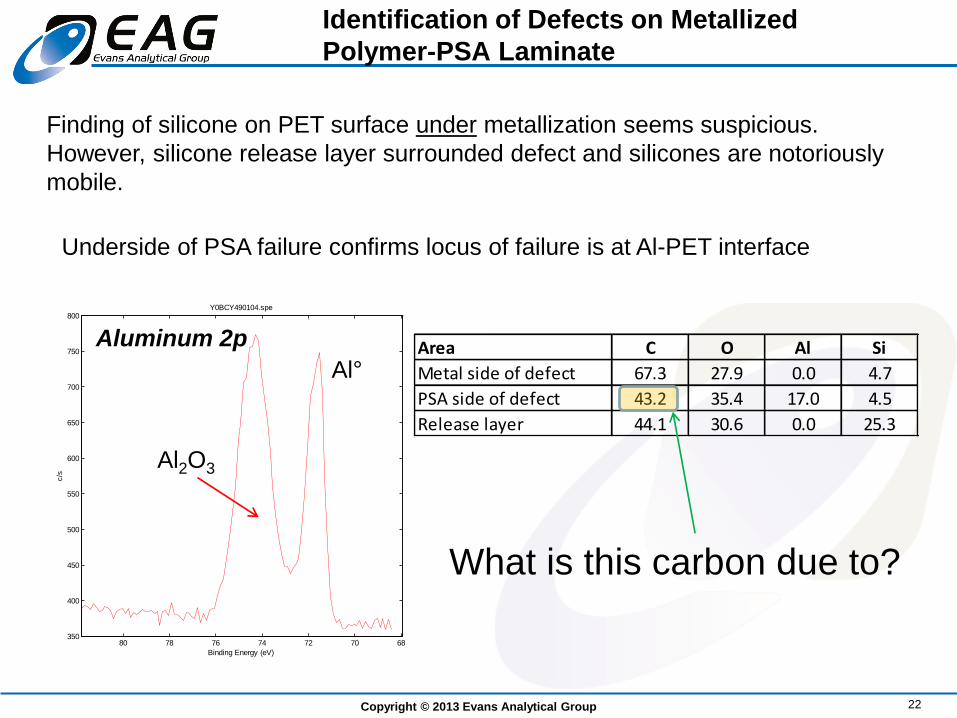
Finding of silicone on PET surface under metallization seems suspicious.
However, silicone release layer surrounded defect and silicones are notoriously
mobile.
Y0BCY490104.spe: V6C063-090-230050 www.eag.com
2011 Apr 20 Al mono 12.5 W 50.0 µ 45.0° 29.35 eV 7.7352e+002 max 15.84 min
Al2p/Point3: Pigment side of failure/1 (Shft)
68707274767880350
400
450
500
550
600
650
700
750
800Y0BCY490104.spe
Binding Energy (eV)
c/s
Aluminum 2p
Al2O3
Al°
Underside of PSA failure confirms locus of failure is at Al-PET interface
Area C O Al Si
Metal side of defect 67.3 27.9 0.0 4.7
PSA side of defect 43.2 35.4 17.0 4.5
Release layer 44.1 30.6 0.0 25.3
What is this carbon due to?
Copyright © 2013 Evans Analytical Group 23
Identification of Defects on Metallized
Polymer-PSA Laminate
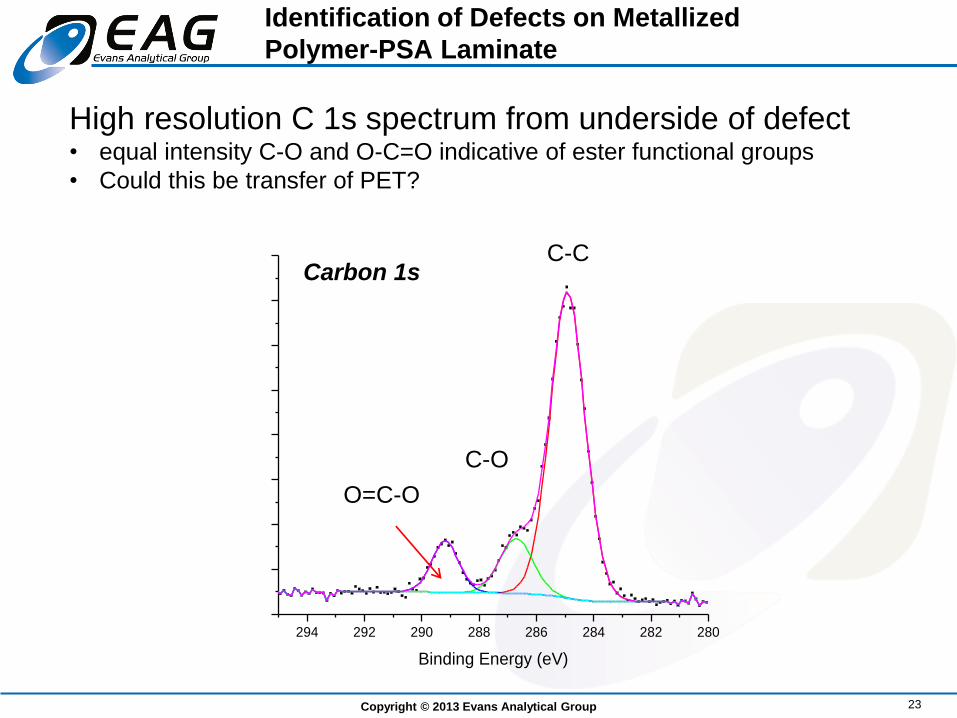
294 292 290 288 286 284 282 280
Binding Energy (eV)
C-C
C-O
O=C-O
Carbon 1s
High resolution C 1s spectrum from underside of defect • equal intensity C-O and O-C=O indicative of ester functional groups
• Could this be transfer of PET?
Copyright © 2013 Evans Analytical Group 24
Identification of Defects on Metallized
Polymer-PSA Laminate
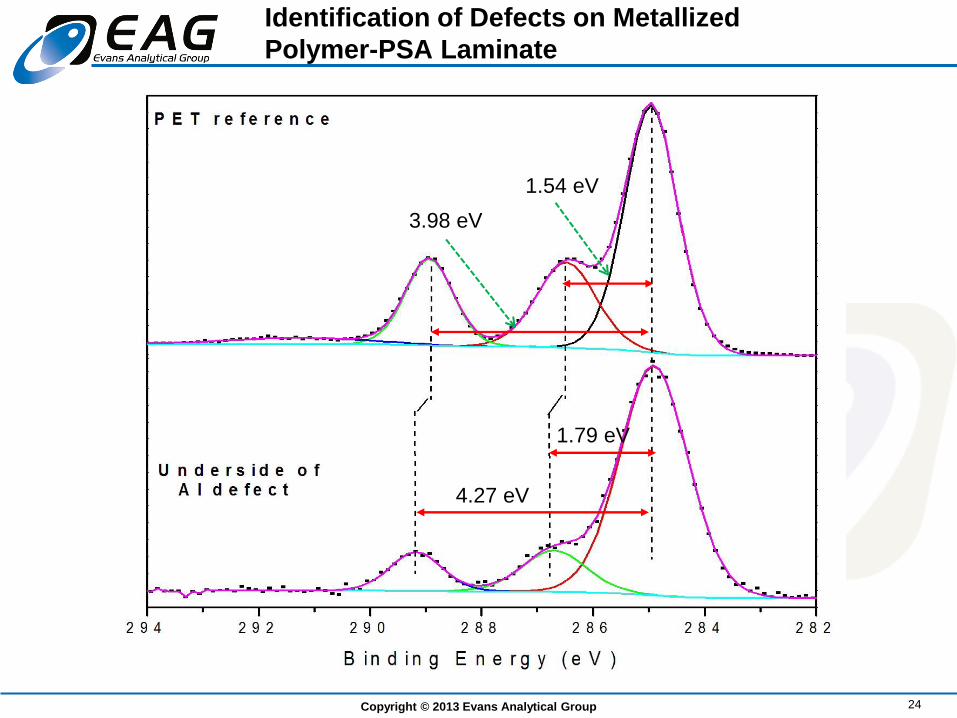
1.79 eV
1.54 eV
4.27 eV
3.98 eV
• C 1s peak positions are consistent with aliphatic
ester, not PET
– PET surface was contaminated with some
aliphatic ester prior to metallization
– Silicones contaminated the PET after the
adhesion failure
Copyright © 2013 Evans Analytical Group 25
Identification of Defects on Metallized
Polymer-PSA Laminate
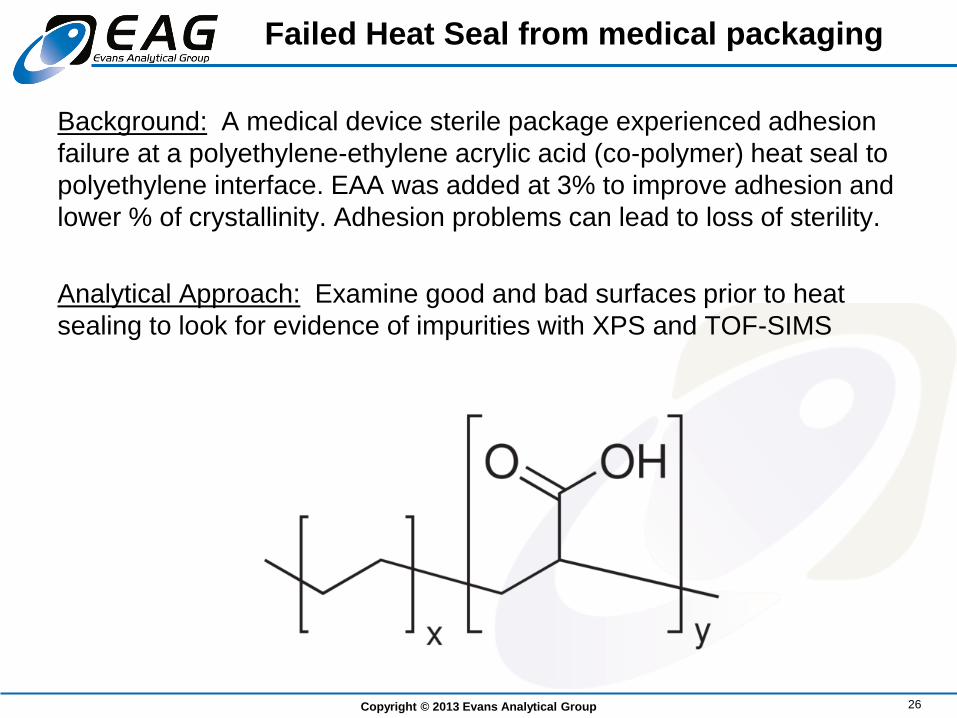
Failed Heat Seal from medical packaging
Background: A medical device sterile package experienced adhesion
failure at a polyethylene-ethylene acrylic acid (co-polymer) heat seal to
polyethylene interface. EAA was added at 3% to improve adhesion and
lower % of crystallinity. Adhesion problems can lead to loss of sterility.
Analytical Approach: Examine good and bad surfaces prior to heat
sealing to look for evidence of impurities with XPS and TOF-SIMS
Copyright © 2013 Evans Analytical Group 26
Copyright © 2013 Evans Analytical Group 27
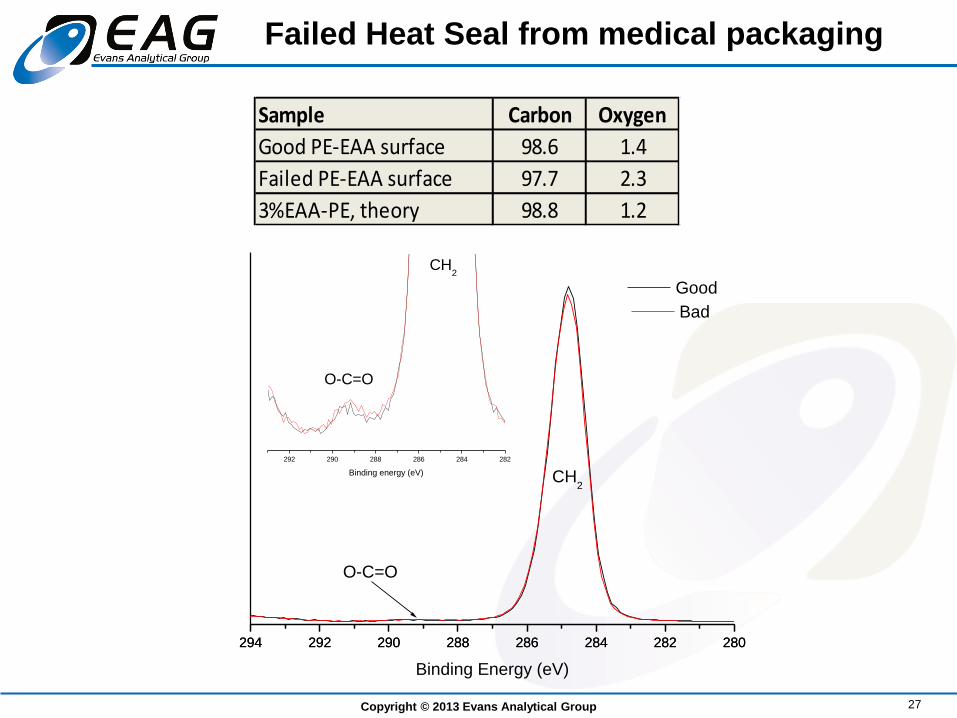
Failed Heat Seal from medical packaging
294 292 290 288 286 284 282 280294 292 290 288 286 284 282 280
292 290 288 286 284 282
Binding Energy (eV)
Good
O-C=O
CH2
Bad
CH2
O-C=O
Binding energy (eV)
Sample Carbon Oxygen
Good PE-EAA surface 98.6 1.4
Failed PE-EAA surface 97.7 2.3
3%EAA-PE, theory 98.8 1.2
XPS only finds only C-C and O-C=O
• Measurable difference in amount of total O suggests
either:
– (a) difference in the amount of EAA at the surface or,
– (b) presence of some other O-C=O containing
compound on the surface of the bad heat seal
• XPS unable to distinguish between these two scenarios
Copyright © 2013 Evans Analytical Group 28
Failed Heat Seal from medical packaging
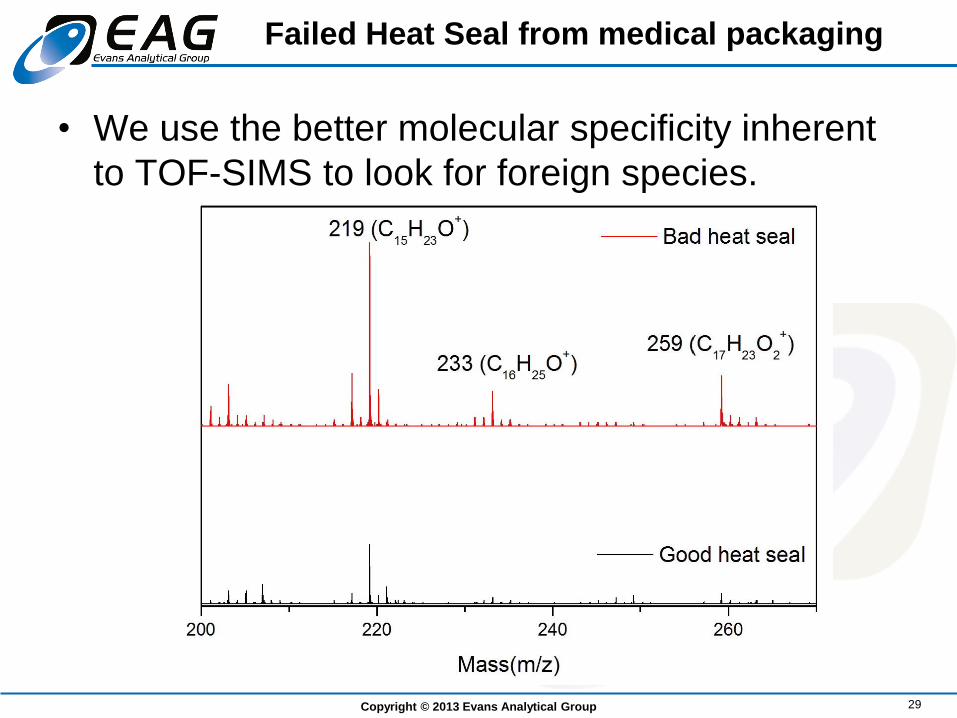
• We use the better molecular specificity inherent
to TOF-SIMS to look for foreign species.
Copyright © 2013 Evans Analytical Group 29
Failed Heat Seal from medical packaging
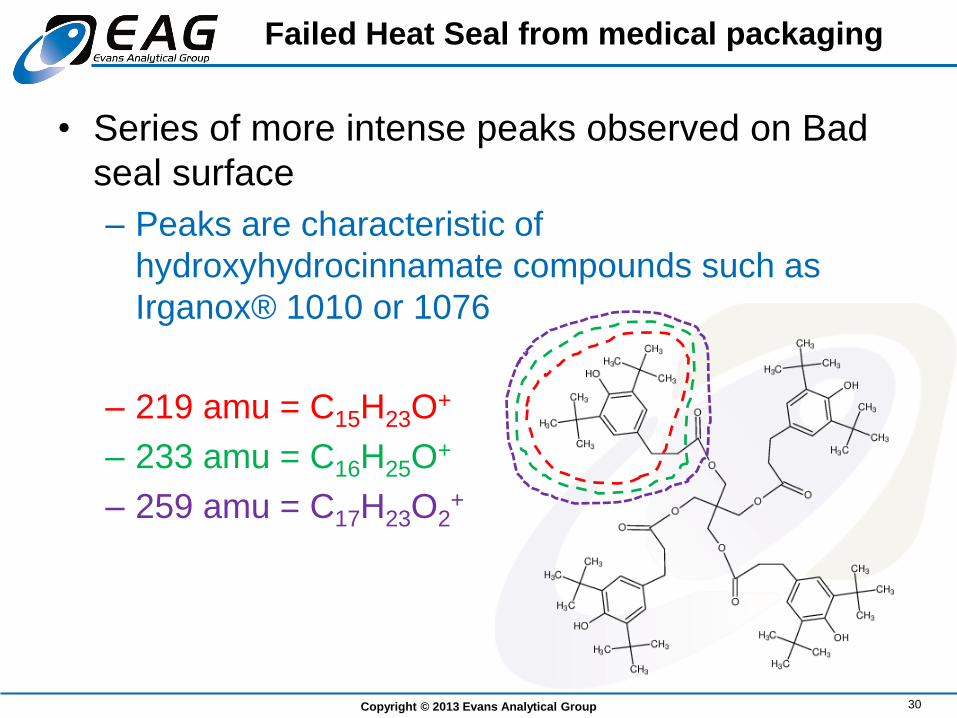
• Series of more intense peaks observed on Bad
seal surface
– Peaks are characteristic of
hydroxyhydrocinnamate compounds such as
Irganox® 1010 or 1076
– 219 amu = C15H23O+
– 233 amu = C16H25O+
– 259 amu = C17H23O2+
Copyright © 2013 Evans Analytical Group 30
Failed Heat Seal from medical packaging
• XPS flagged the higher O levels, but could not
determine the root cause of the problem
• TOF-SIMS found clear evidence of
hydroxyhydrocinnamate compounds on Bad
surface
– Low levels of hydroxyhydrocinnamate found on
Good surface
Copyright © 2013 Evans Analytical Group 31
Failed Heat Seal from medical packaging
Examining the sub-surface
Copyright © 2013 Evans Analytical Group 32
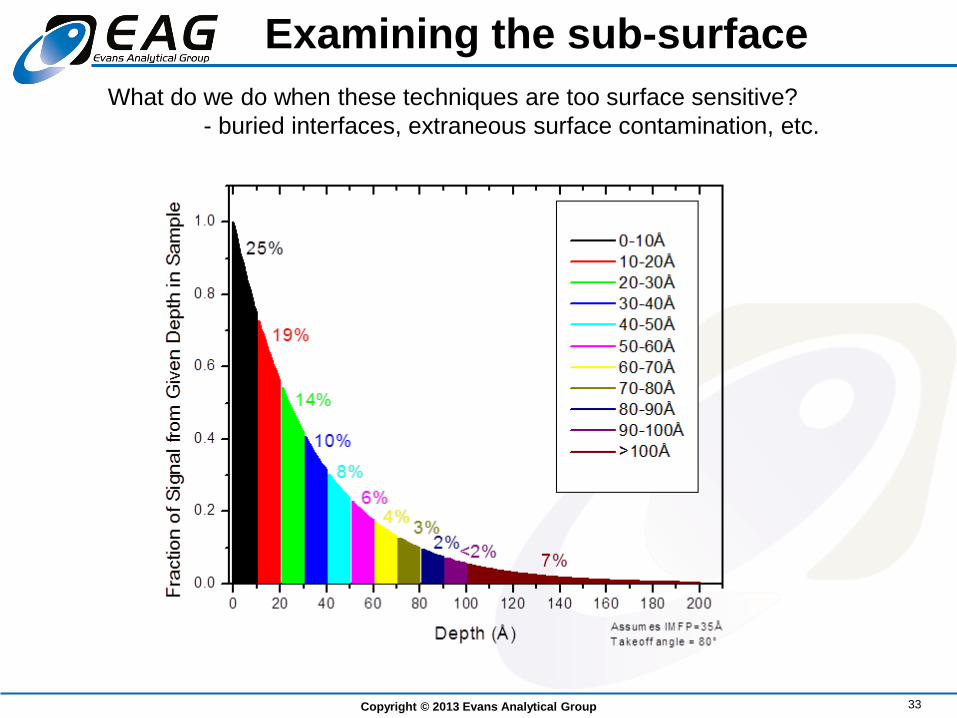
Examining the sub-surface
Copyright © 2013 Evans Analytical Group 33
What do we do when these techniques are too surface sensitive?
- buried interfaces, extraneous surface contamination, etc.
Copyright © 2013 Evans Analytical Group 34
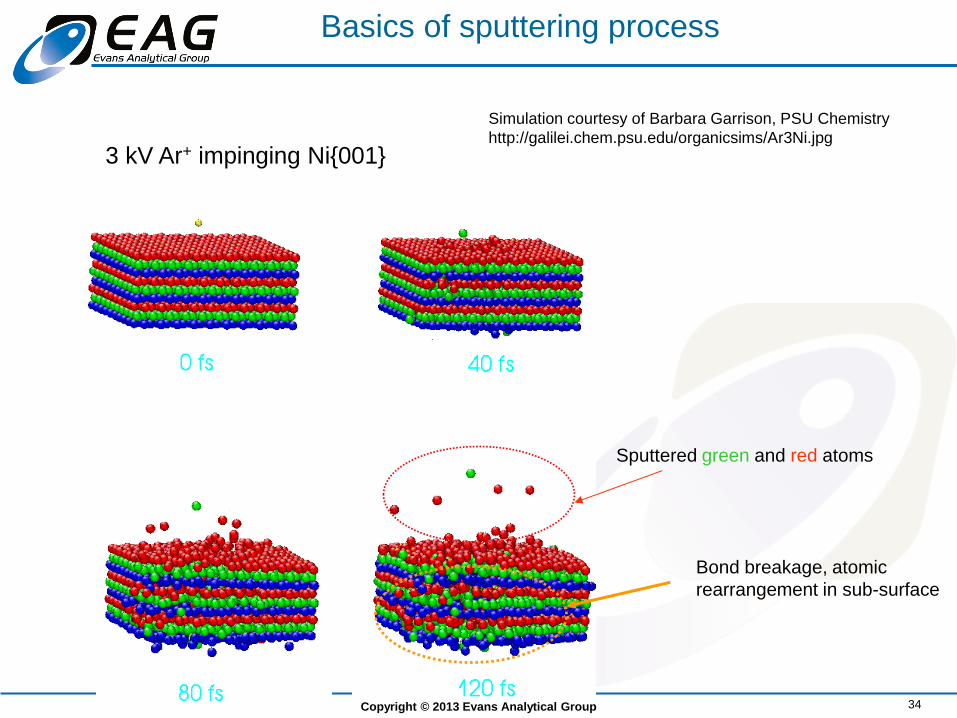
Simulation courtesy of Barbara Garrison, PSU Chemistry
http://galilei.chem.psu.edu/organicsims/Ar3Ni.jpg
Sputtered green and red atoms
Bond breakage, atomic
rearrangement in sub-surface
3 kV Ar+ impinging Ni{001}
Basics of sputtering process
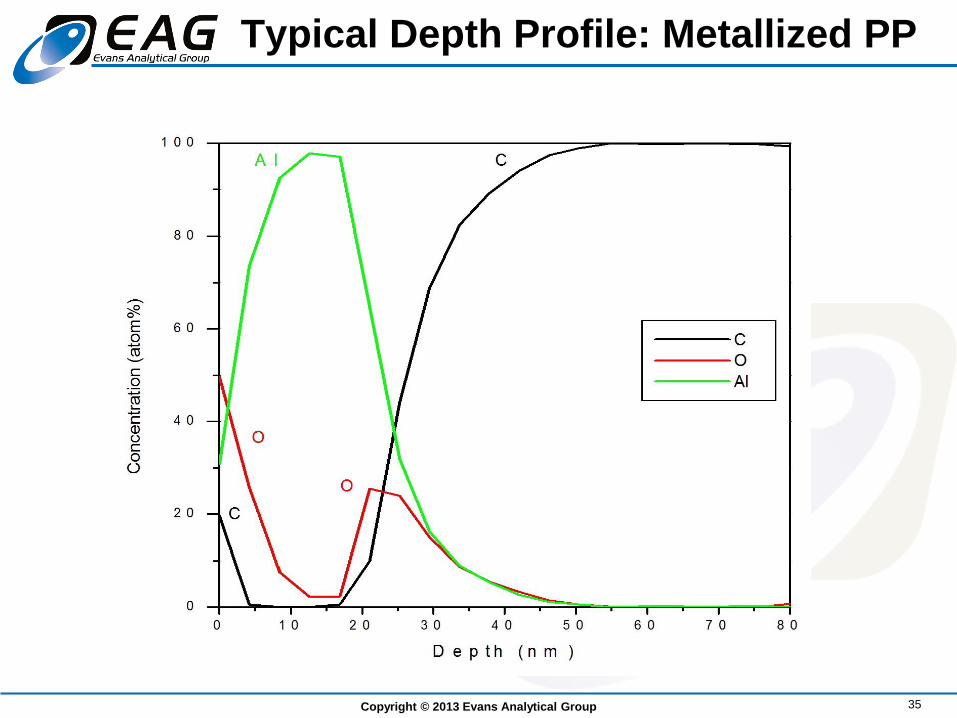
Typical Depth Profile: Metallized PP
Copyright © 2013 Evans Analytical Group 35
aimcal105.pro: AIMCAL research www.eag.com
2013 Sep 10 Al mono 50.1 W 200.0 µ 45.0° 46.95 eV 4.8350e+003 max 14.91 min
Al2p/Point3: Al coated polymer/1 (Shft)
65
70
75
80
85
02
46
810
12
0
2000
4000
6000
8000
10000
12000
14000
Binding Energy (eV)
c/s
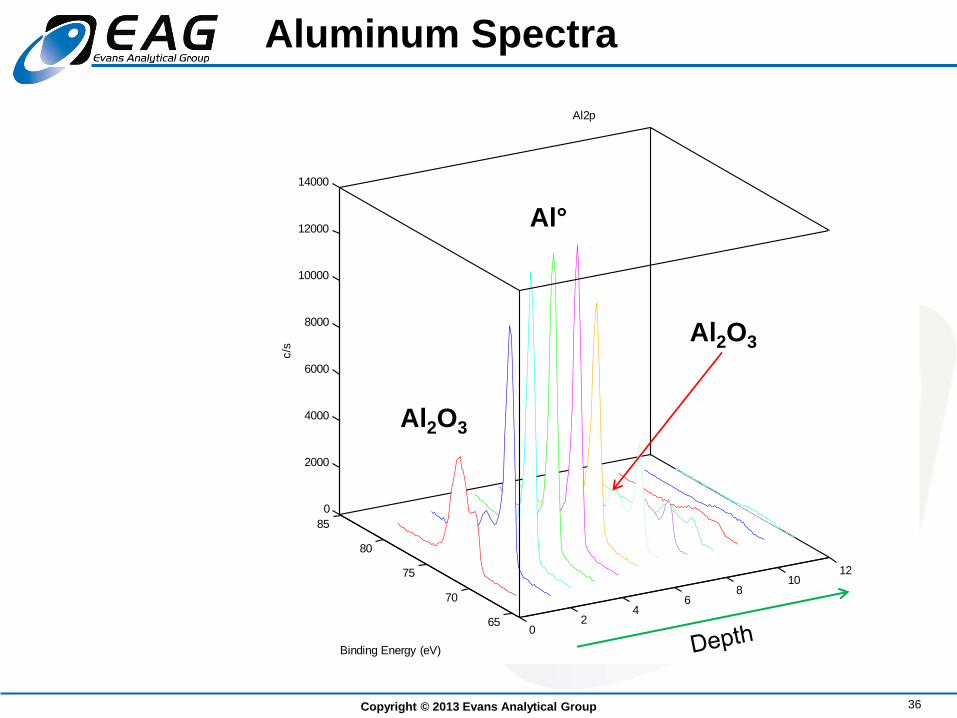
Al2p
Aluminum Spectra
Copyright © 2013 Evans Analytical Group 36
Al2O3
Al°
Al2O3
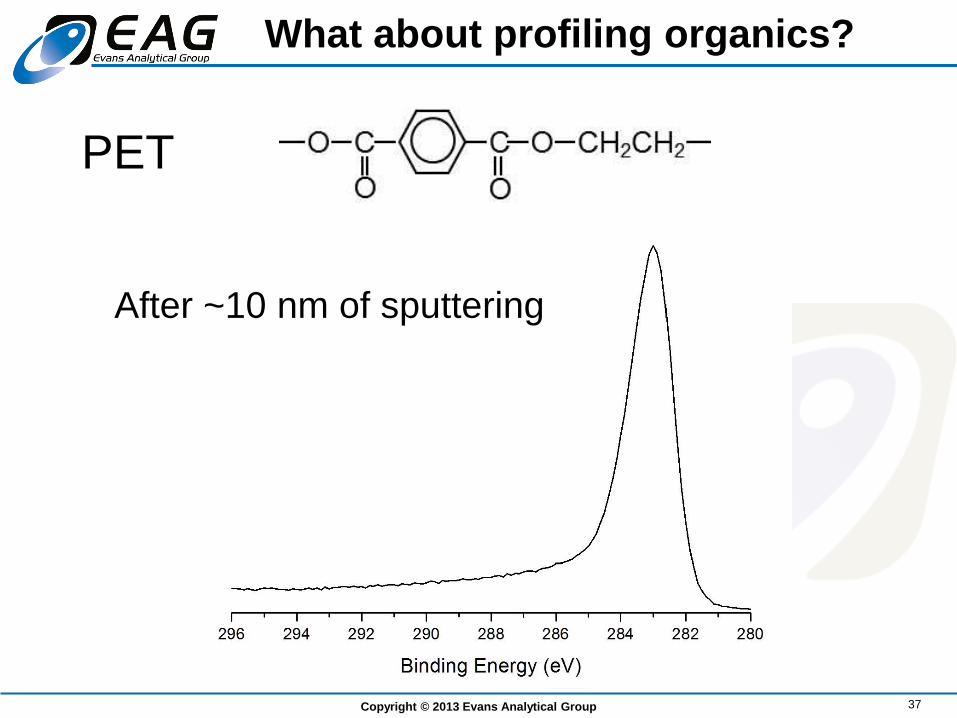
What about profiling organics?
Copyright © 2013 Evans Analytical Group 37
PET
After ~10 nm of sputtering
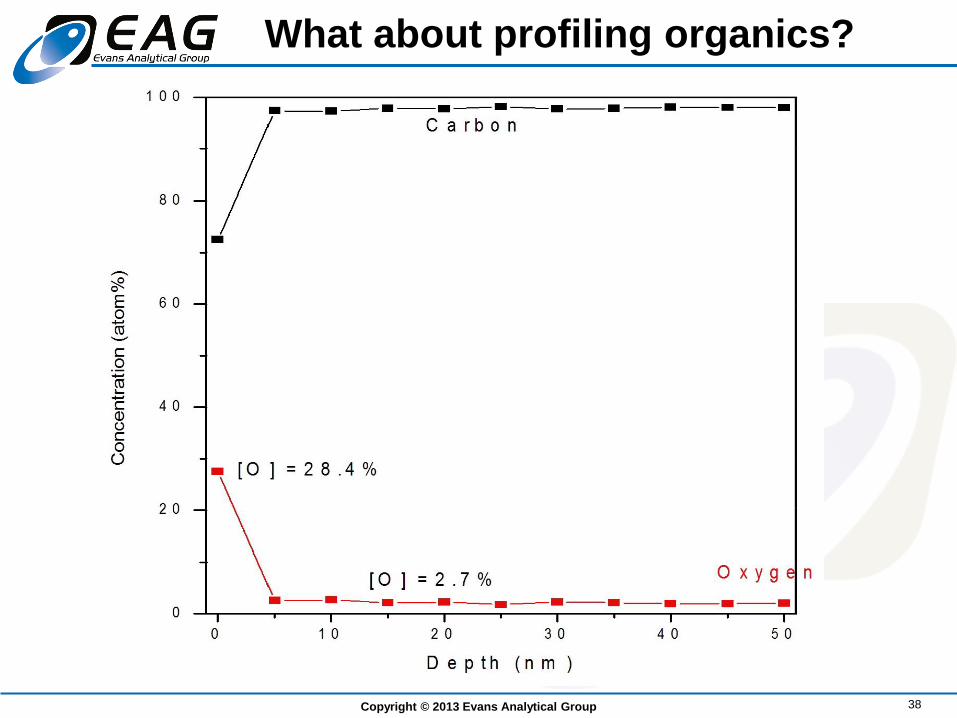
Copyright © 2013 Evans Analytical Group 38
What about profiling organics?
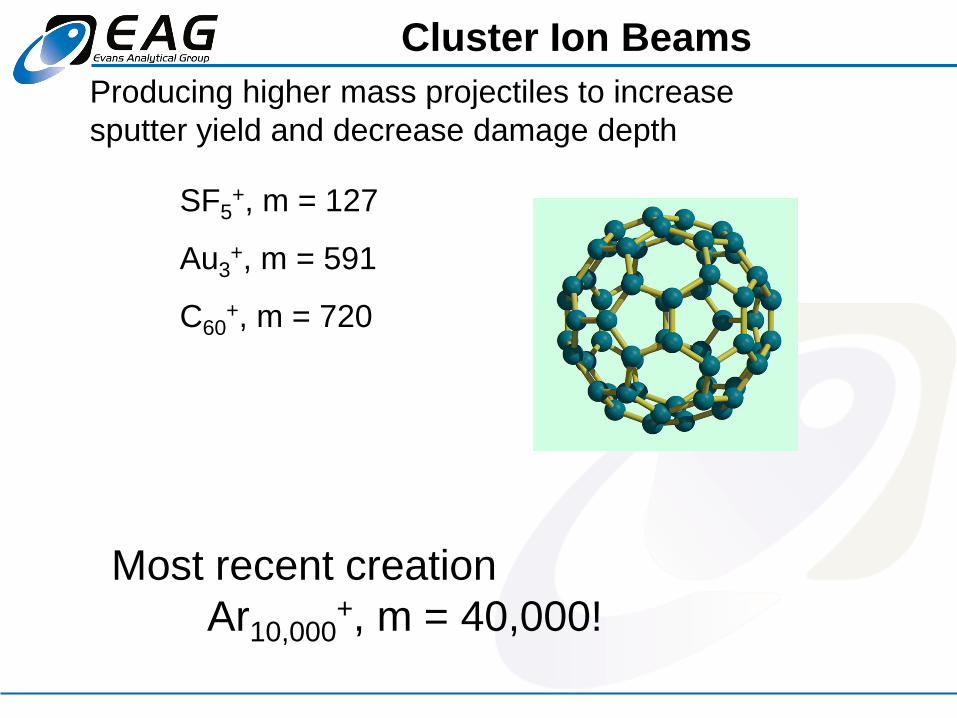
Producing higher mass projectiles to increase
sputter yield and decrease damage depth
SF5+, m = 127
Au3+, m = 591
C60+, m = 720
Cluster Ion Beams
Most recent creation
Ar10,000+, m = 40,000!
Copyright © 2013 Evans Analytical Group 40
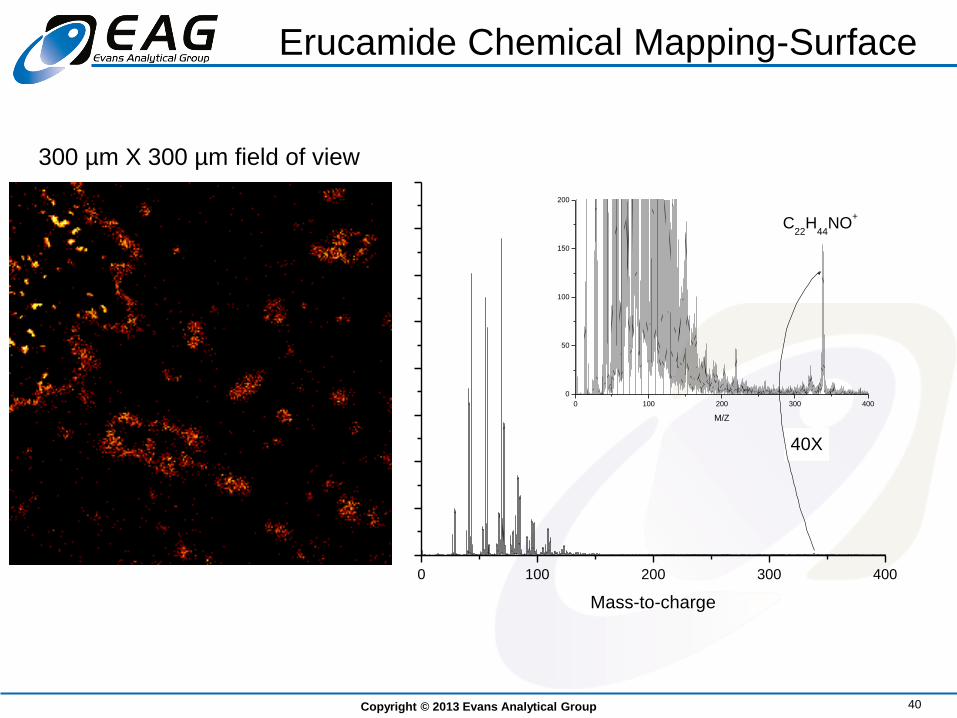
0 100 200 300 400
0 100 200 300 400
0
50
100
150
200
40X
Co
un
ts
Mass-to-charge
C22
H44
NO+
M/Z
Erucamide Chemical Mapping-Surface
300 µm X 300 µm field of view
Copyright © 2013 Evans Analytical Group 41
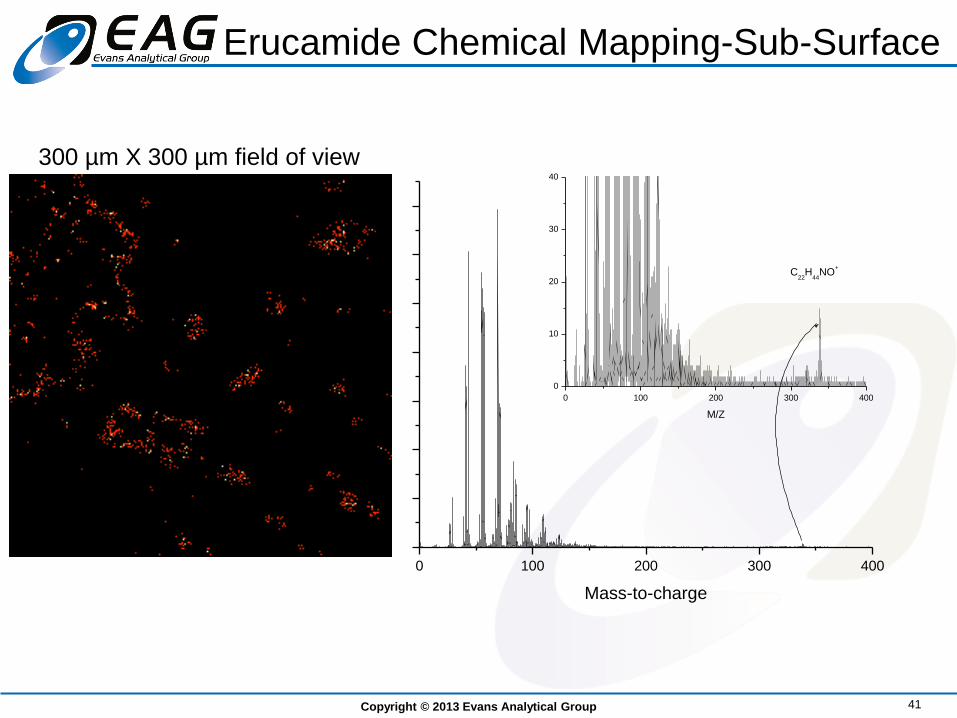
0 100 200 300 400
0 100 200 300 400
0
10
20
30
40
Mass-to-charge
C22
H44
NO+
M/Z
300 µm X 300 µm field of view
Erucamide Chemical Mapping-Sub-Surface
Copyright © 2013 Evans Analytical Group 42
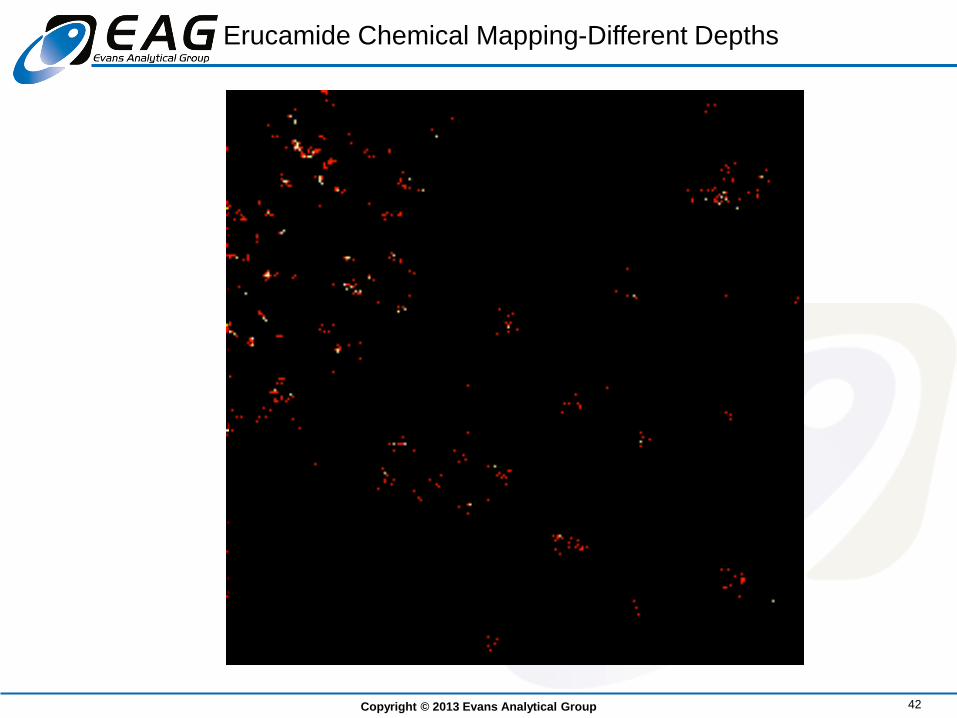
Erucamide Chemical Mapping-Different Depths
Copyright © 2013 Evans Analytical Group 43
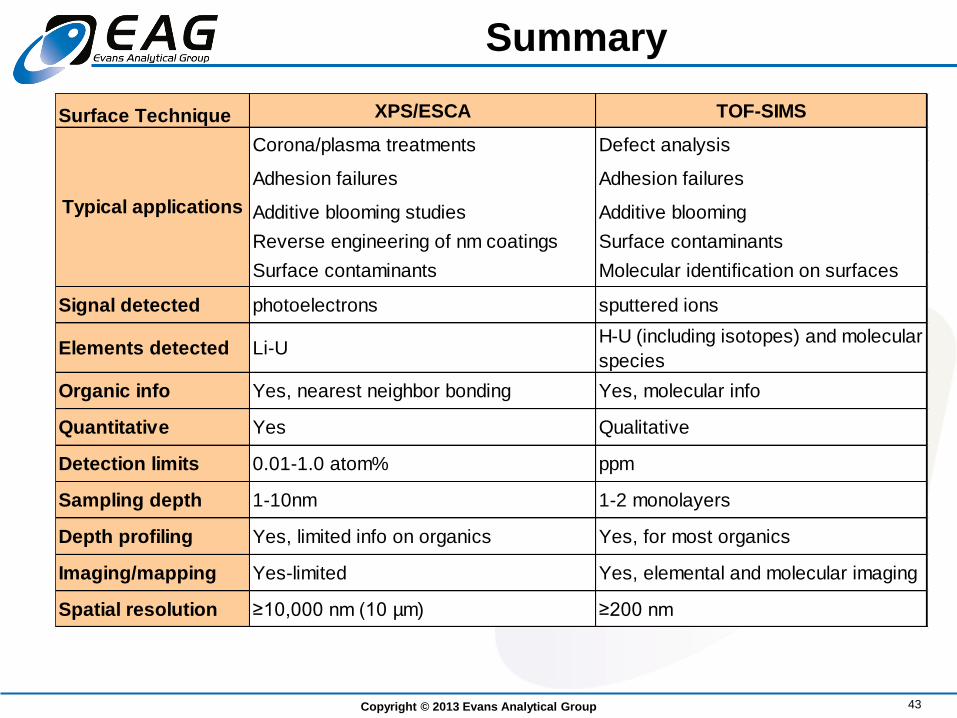
Summary
Surface Technique XPS/ESCA TOF-SIMS
Corona/plasma treatments Defect analysis
Adhesion failures Adhesion failures
Additive blooming studies Additive blooming
Reverse engineering of nm coatings Surface contaminants
Surface contaminants Molecular identification on surfaces
Signal detected photoelectrons sputtered ions
Elements detected Li-UH-U (including isotopes) and molecular
species
Organic info Yes, nearest neighbor bonding Yes, molecular info
Quantitative Yes Qualitative
Detection limits 0.01-1.0 atom% ppm
Sampling depth 1-10nm 1-2 monolayers
Depth profiling Yes, limited info on organics Yes, for most organics
Imaging/mapping Yes-limited Yes, elemental and molecular imaging
Spatial resolution ≥10,000 nm (10 µm) ≥200 nm
Typical applications

Copyright © 2013 Evans Analytical Group 44
Questions Welcome
www.eag.com