
Suresh Aavin Project
109
A STUDY ON FINANCIAL PERFORMANCE OF SALEM DISTRICT CO-OPERATIVE MILK PRODUCERS UNION LIMITED AT SALEM PROJECT REPORT Submitted by SURESH.R Register No: 108001655091 In Partial Fulfillment for the Award of the Degree of MASTER OF BUSINESS ADMINISTRATION OF ANNA UNIVERSITY OF TECHNOLOGY, COIMBATORE IN GNANAMANI INSTITUTE OF MANAGEMENT STUDIES NAMAKKAL.DT
-
Upload
suresh-mba -
Category
Documents
-
view
2.979 -
download
0
Transcript of Suresh Aavin Project
A STUDY ON FINANCIAL PERFORMANCE OF SALEM
DISTRICT CO-OPERATIVE MILK PRODUCERS
UNION LIMITED AT SALEM
PROJECT REPORT
Submitted by
SURESH.R
Register No: 108001655091
In Partial Fulfillment for the Award of the Degree of
MASTER OF BUSINESS ADMINISTRATION
OF
ANNA UNIVERSITY OF TECHNOLOGY, COIMBATORE
IN
GNANAMANI INSTITUTE OF MANAGEMENT STUDIES
NAMAKKAL.DT
JUNE-2012
GNANAMANI INSTITUTE OF MANAGEMENT STUDIES
PACHAL
NAMAKKAL
MASTER OF BUSINESS ADMINISTRATION
PROJECT WORK
JUNE -2012
This is to certify that the project entitled
A STUDY ON FINANCIAL PERFORMANCE OF SALEM DISTRICT
CO-OPERATIVE MILK PRODUCERS UNION LIMITED AT SALEM
Is the bonafide record of project work done by
SURESH.R
Register No: 108001655091
MASTER OF BUSINESS ADMINISTRATION during the year 2010-2012
…………………….. ………………………….. …………………………..
Faculty Guide Head of the Department Professor Head
Submitted for the Project Viva-voce examination held on ………
………………….. …………………….

Internal Examiner External Examiner
ACKNOWLEDGEMENT
I express my gratitude to Dr. T.ARANGANNAL, Chairman, and P. MALA LEENA chairperson of
GNANAMANI EDUCATIONAL INSTITUTIONS, PACHAL for `giving me an opportunity to study
MBA course during the year of 2010-2011.
I express my profound gratitude and special thanks to MR. K. VIVEKANANDAN, CEO,
GNANAMANI EDUCATIONAL INSTITUTIONS, for giving me the opportunity to undertake this
Internship Training.
I would like to express my sincere gratitude to Dr. V.BASKARAN, Principal, Gnanamani College of
Technology for his encouragement in this regard.
I would like to express my sincere gratitude to Dr. P. AMALANATHAN, Professor & Head,
Department of Management Studies for his valuable suggestions in completing this training.
I am thankful to H.O.D Dr. S. MARIMUTHU,MBA., DEPARTMENT OF MANAGEMENT
STUDIES, PACHAL for his constant advice throughout the training.
I express my sincere thanks to my guide MR.M.PRAVIN KUMAR, Assistant professor for his
valuable guidance throughout the Project report.
I would like to thank the employees of SALEM DISTRICT CO-OPERATIVE MILK
PRODUCERS UNION LIMITED AT SALEM management and my friends for their advice and
assistance for completing the project work successfully.

SURESH.R
DECLARARION
I affirm that, “A STUDY ON FINANCIAL PERFORMANACE OF
SALEM DISTRICT CO-OPERATIVE MILK PRODUCERS UNION
LIMITED AT SALEM” being submitted in partial fulfilment for the award of MASTER
OF BUSINESS ADMINSTRATION is the original work carried out by me, it has not formed
the part of any other report submitted for award of any degree or diploma. Either in this or any
other university
............................
Signature of the student
SURESH.R
Register no 108001655091
I certified that the declaration made above by the candidate is true
……………………….
Signature of the guide
Mr. M. PRAVIN KUMAR,

(ASSOCIATE PROFESSOR)
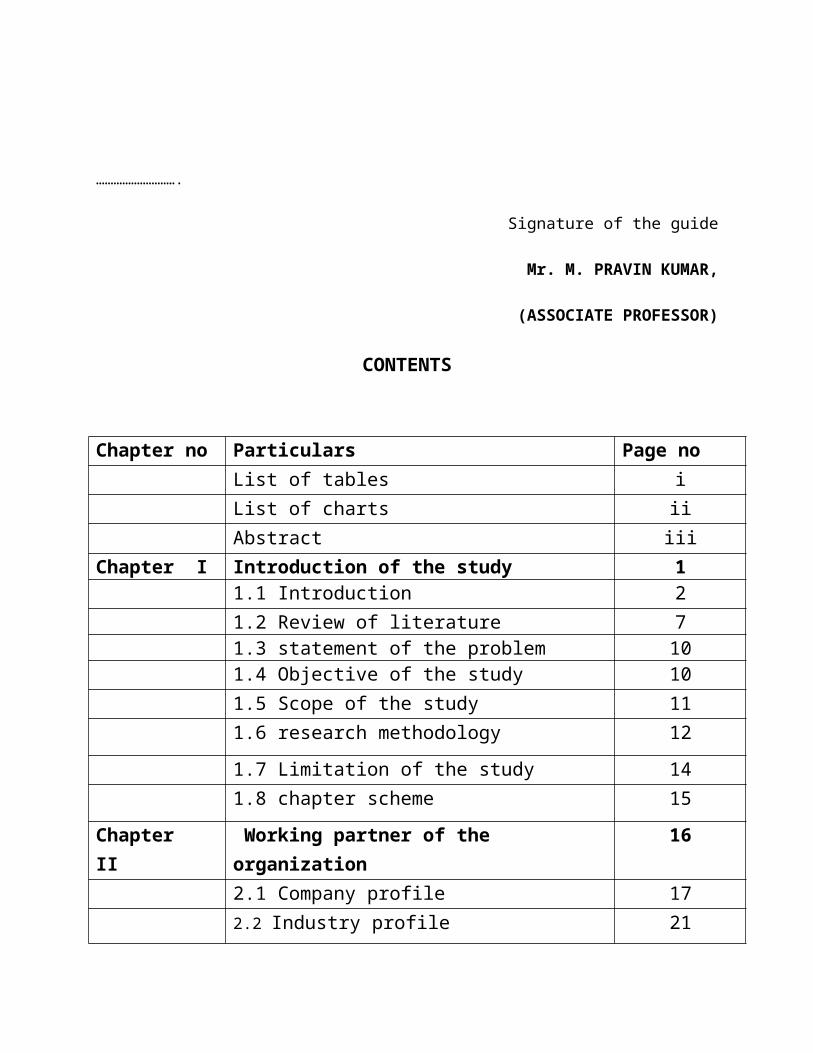
CONTENTS
Chapter no Particulars Page noList of tables iList of charts iiAbstract iii
Chapter I Introduction of the study 11.1 Introduction 21.2 Review of literature 71.3 statement of the problem 101.4 Objective of the study 101.5 Scope of the study 111.6 research methodology 12
1.7 Limitation of the study 141.8 chapter scheme 15
Chapter II Working partner of the organization 162.1 Company profile 172.2 Industry profile 21
Chapter III Data analysis and interpretation 24
3.1 Ratio analysis 313.2 Comparative balance sheet 55
Chapter V Finding, suggestion & Conclusion 614.1Findings 624.2 Suggestions 634.3 Conclusion 64Bibliography 65Appendix 67
LIST OF TABLES
Table no Particulars Page no1 Current Ratio 32
2 Debtors Turnover Ratio 34
3 Average Collection period Ratio 36
4 Creditors Turnover Ratio 39
5 Average Payment Period Ratio 41
6 Fixed Asset turnover Ratio 43
7 Net Capital Turnover Ratio 46
8 Current Asset to Sales Ratio 48
9 Proprietary Ratio 5110 Debtors to Assets Ratio 5311 Comparative balance sheet as on 2006&2007 5612 Comparative balance sheet as on 2007&2008 5713 Comparative balance sheet as on 2008&2009 5814 Comparative balance sheet as on 2009&2010 5915 Comparative balance sheet as on 2010&2011 60
i

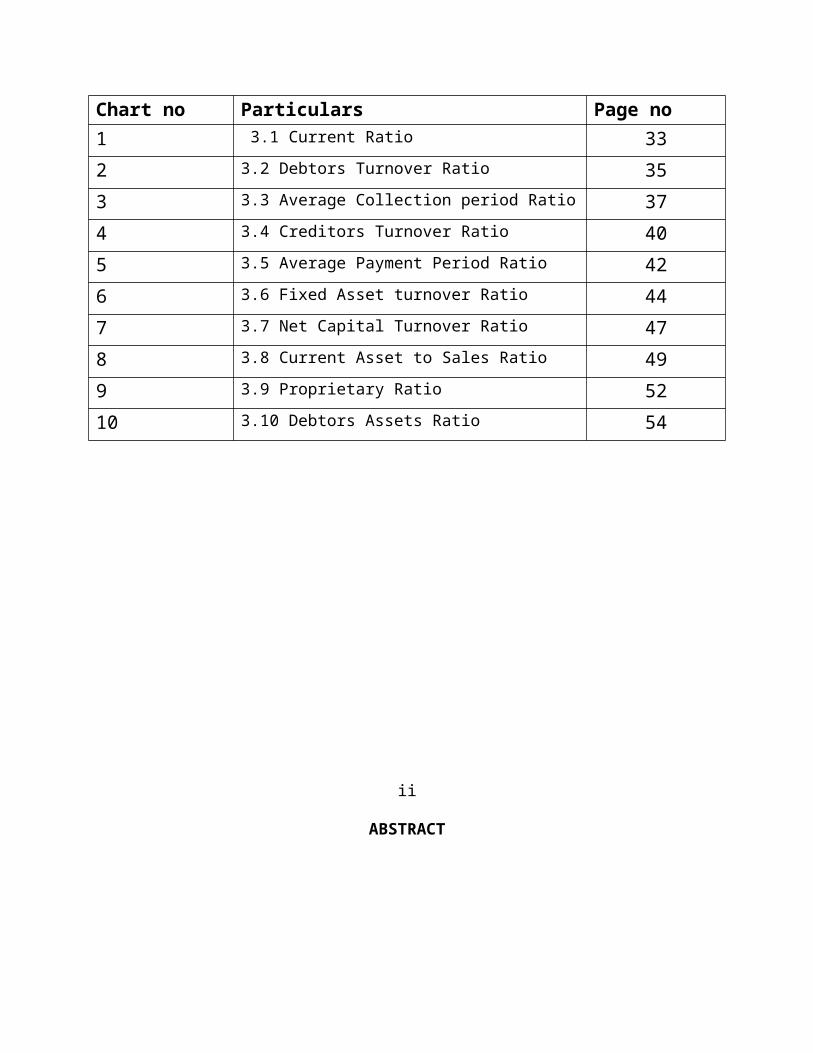
LIST OF CHARTS
Chart no Particulars Page no1 3.1 Current Ratio 33
2 3.2 Debtors Turnover Ratio 35
3 3.3 Average Collection period Ratio 37
4 3.4 Creditors Turnover Ratio 40
5 3.5 Average Payment Period Ratio 42
6 3.6 Fixed Asset turnover Ratio 44
7 3.7 Net Capital Turnover Ratio 47
8 3.8 Current Asset to Sales Ratio 49
9 3.9 Proprietary Ratio 52
10 3.10 Debtors Assets Ratio 54
ii
ABSTRACT

The researcher as part of curriculum has conducted a study to find out the financial
performance of the company. The data utilized for the study is secondary in nature. The
required data is collected from the budgeted formats, Flash results and six- year annual diary of
the company. The data has been collected for a period of six years from 2006-07 to 2010 –11.
This is the main motive of the project. The first objective of the study is to study the finance
structure of organization. How practically operating functions going on, To study about the
Inventory Management in consultation with centralized Materials Management and Material
Budget Coordination groups and To study the Credit policies, Receivables and their
relationships through discussion in Commercial Co-ordination and Accounts Department.
Through this study I suggest the company should aim at minimizing cost by implementing
strict cost control and maintain cost records for each department to identify the risk in
controllable costs It is also advised to the company to make review of all fixed assets to
identify and surplus capacity that can higher to other uses in the industry at a price.
iii
1.1 INTRODUCTION

In our present day economy, finance is the provision of money at the time when it is
required. Every enterprise whenever big, medium or small needs finance to carry on its
operations and to achieve its target. In fact, finance is so essential today that it is rightly said that,
it is the life blood of an enterprise without adequate finance, no enterprise can possible
accomplish.
Finance guides and regulates investments decisions may be pertaining to capital
expenditure and revenue expenditure. To get the best out of the available funds is the major task
of financial management. The finance manager should perform his task most effectively.
“Finance is the lifeblood of business. It is rightly termed as the science of money. We
hold finance for the production of goods and services as their distribution”. The term business
finance indicates an activity or a process, which is concerned with acquisition of funds,
allocation of funds and finance controls.
The finance requirements of a company can be broadly classified into a long term,
medium term and short-term finance. Long term finance is needed for buying machinery and
equipment or for the provision of land, factory building and other fixed assets. Medium term
finance is needed for small tools, implements and major repairs. Short term finance is required
for new months for the purchase of raw materials for processing and meeting expenses like
wages, salaries etc. in order words to meet its working capital requirements.
Accounting and other business functions. The wastage of funds can be avoided. The
finance functions is not just a service function through it is generally viewed as one of the most
important decisions on the basic of availability of funds. In the finance function bended with
productions marketing, personal.
IMPORTANCE OF FINANCE

Finance is regarding as the lifeblood of a business enterprise. This is because in the
modern money-oriented economy. Finance is one of the basic foundations of all the sources for
being employed in manufacturing and merchandising activities. It has rightly been said that
business needs money to make more money. However, it is also true that money begets more
money only when it is properly managed. Hence, efficient management of every business
enterprise is closely linked with efficient management of its finances.
FINANCIAL STATEMENT:
A financial statement is an organized collection of data according to logical and
consistent accounting procedures. Its purpose is conveying an understanding of some financial
aspects of a business firm. It may show position at a moment in time, as in the case of a balance
sheet or may reveal a series of activities over a given period of time, as in the case of income
statements. Thus the term financial statement generally refers to the two statements.
The position statement (or) the balance sheet.
The income statement (or) the profit & loss account.
FINANCIAL PERFORMANCE
INTRODUCTION
Analysis is the process of critically examining in detail accounting information given in
the financial statements. For the purpose of analysis individual items are studied, their
interrelationship with other related figures established, the data is sometimes rearranged ton have
a better understanding of the information with the help of different techniques of tools for the
purpose. Interpretation means explaining the meaning and significance of the data so simplified.
However both analysis and interpretation are interlinked.
Financial analysis is the process of identifying the financial strengths and weakness of the
firm by properly establishing relationship between the items of the balance sheet and the profit
and loss account analysis and interpretation of financial statements refers to such a treatment of
data found in the financial statements so as to provide a full diagnosis of the profitability.
And financial position of an enterprise. Finance is a pre-requisite for mobilizing real
resources to organize production and marketing. Finance is rightly described as the life blood of
any industry. Thus financial analysis of any organization becomes very important.
Financial analysis is the starting point for making plans before using any sophisticated
forecasting and budgetary procedures. It is their overall responsibility to see that the resources of
enterprise are used more efficiently and effectively.
According to John .N.MYER, the balance sheet reflect the assets, liabilities and capital as
on a certain data and the income statement should the results of operation during a certain period.
Financial analysis is helpful in assessing the financial position and profitability of a concern.
This is done through comparison by ratios for the same concern. This is done through
comparison by ratios for the same concern over a period of years. For one concern against of
financial statements helps in assessing.
The present and future earning capacity or profitability of the concern.
The operation efficiency of the concern a as whole.
The financial stability of a business concern.
Then real meaning and significance of financial data.
The long term liquidity of its funds etc.,
RATIO ANALYSIS
Ratio analysis is powerful tool of financial analysis. A ratio is a statistical yard stick that
provides measures of relationship between two accounting figures. The term “ratio” refers to a
simple arithmetic expression of one number to another.
DEFINITION
According to Kennedy, ratio may be defined as “the indicated quotient of two
mathematical expressions and as the relationship between two or more things”.
According to wixon, kell and Bedford, a ratio is defined as “an expression of the
quantitative relationship between two numbers”.

RATIOS:
Ratio analysis is one of the techniques of financial analysis where ratio is used a as
measure for evaluating for financial conditions and performance of a firm.
INCOME AND EXPENDITURE STATEMENT:
The income statement provides details regarding anticipated sales revenues and expenses
for a future period. The earnings revenue is called expense.
FINANCIAL STATEMENT
There are number ratios, which can be calculated from the information given in the profit
and loss account and balance sheet. The selection of particular ratio dependents upon the purpose
of firm which it is calculated by the analyst.
RATIO ANALYSIS INVOLVES THE FOLLOWING STEPS:
Selection of relevant data from the financial statement depending upon the
analysis.
Calculation of calculated ratio with the standard ratio or with the past ratio of the
same Concern or projected ratio.
Interpretation based on comparison.
IMPORTANCE OF RATIOS
Importance of ratio analysis lies in the fact that it present facts on a comparative basic
and enables the sawing of inferences regarding the performance off a firm.
Difficulty in comparison
Impact of inflation
Conceptual diversity

BALANCE SHEET:
Balance sheet has been defined by kholer as a statement of financial position and an
economic unity disclosing as at a given movement of time its assets, at cost depreciated cost, on
their incited value; its liabilities; and its ownership equities usually, the balance sheet is
prospered by a firm to present a summary of financial position at the end of financial year. It
balances the assets of a firm against its financing.
CURRENT ASSESTS:
Current assets which are changed to liquid assets of the firm are convertible into cash
within an accounting period. Cash in hand, cash at bank and other short term investments
constitute these assets.
FIXED ASSESTS:
Assets acquired for utilization and not for resale are termed as fixed or permanent assets,
are those assets, which are intended to be held for a long period.
CURRENT LIABILITIES:
The current liabilities are those liabilities, which are expected to be discharged within a
period of one year.
LIABILITIES:
A liability is an amount which a business is legally bound to pay. It is a claim by an
outsider on the assets of a business.
1.2 REVIEW LITERATURE:
In this chapter some of the earlier work on ratio analysis considered as a part of this
research work. Brief reviews of all those works are given below i.e., research name, his name of
university, his objectives methodology and his major finding and suggestions are referred.
P.V vasudeevan, in the research main objective is to analysis the financial performance of
the company, to study the funds the flow patterns, to judge the solvency of the company. And to
study the trends in financial performance analysis of the company. The research adopted
financial statement analysis, ratio analysis and comparative balance sheet analysis.
The company need to reduce the funds locked up in inventory (application funds). Then
source for such finds awaited from the funds is constituted by financial performance facilities
availed from commercial banks.
The role of faster cash accuracy in the efficient management of financial performance has
been illustrated by the performance during 1986-86 crushing reasons. When deposits a higher
levels of inventory, he has still been as appreciable reduction in the interest cost.
K.Srinivas the researcher’s main objective are to critically examine and high lights the
financial performance of the company for the period 1981-82 to 1985-86 to study the liquidity
and profitability of the company and to study.
To the expected level. It needs to be improved by effective utilization and control of
current assets.
Dr.Sukumal it was found trident is the highest profit earning concern. It has sufficient
working capital all the year, their decrease in refer and surplus is mainly due to issue to bonus
shared.
This above the study was prepared Dr.Sumumal the management account I.C.WA.I in
(November 1995) vol, 30, number11, page 826.
Dr.Debasish banerjee and manish kumar from 1985-86 to 1989-90. It was observed that
the company has taken funds for financing performance analysis in all the years.
These are no consistent relation between the growth of sales and working capital. The
capital is efficient in working capital management.
Another study Dr.Debasish banerjee, financial performance analysis of Grasim industries
ltd. The management the cost volume profit analysis.
The researcher adopted financial statement analysis, break even analysis, trend analysis,
common-size balance sheet analysis, comparative balance sheet analysis.
For better earnings, the occupancy ration must be increased by rationalizations of routes
revision of time and efficient fleet utilization.
Dr.P.Indrasana reddy and K.Somaswar ratio. This study was based on the data and
information obtained from the annual report of the Hindustan company ltd 1989-90 to 1993-94.
This study reveals that the liquidity position of HCL is satisfactory as if current ration that the
quick ratio remained above the standard norms throughout period of study.
The proportion of inventory to current assets. Increased and to after reserve trends is
observed. The financial performance analysis is not accounts of institute of cost and works
accounts of India may 1997, vol27, number5, page336.
Mr.M.P.Chakravarthy and A.K.Das this information is collected from journal on
accounting and financial research development association. it has been found that ECL operate
on a negative working capital and that the management should be careful to keep on the positive
trends otherwise it may sleep down again into trap to negative working capital, which may
referred the further progress of the company.
Mr.wasswa hannington on of the main objectives of this project study, to conduct risk
return analysis are financial performance position, to assess the financial liquidity position of the
company, to determine this structure and utilization of working capital and its various
components. And to assess the implementation of the London committee norms with regard to
working capital and also by doing analysis the financial performance.
Capital and cash management schedules of charges in working capital include funds flow
statement and fund flow cycle. And financial performance like trade credit working capital
advances by commercial bank, short-term financial institution.
Accounting to sec.58 (a) of the component act 1956 a company can accept public
deposits amounting to 25 percent of its net worth which is the case of vantage leather (India) ltd.,
amount to rs.1 core. So it is strongly recommended that the company explore this type of
financing as it does not request attaching any of the assets of the company as security.
Since over 90 percent of the company’s are shipped to one single buyer in Germany, the
company can consider the option of making this major client and equity holders in the company
so that the problem of lack of funds can be made lights.
Vantage being exports with an international record, it can consider borrowing from
foreign commercial banks. Also instead of borrowing from banks with in India only.
Mr. Suresh the research’s main objectives of his project study is to determine the amount
of financial performance employed by the company and analysis the working capital
management by the company for specified period of four years (1985-86) to assess the
implementation of tendon committee norms in regard to working capital management by the
company. The company has not been able to maintain the desired stock level due to liquidity
problems which in term has affected the capacity utilization of machine and loss quality
production.

1.3 STATEMENT OF THE PROBLEM
This is to find out the financial performance of the co-operative milk producer including
Trading, Profit and Loss account and Balance sheet of the co-operative milk producer. It is to
analyze the financial performance and its position of sithanur primary agricultural Co-operative
society by using financial performance analysis.
1.4 OBJECTIVES OF THE STUDY
To know the liquidity position of the concern by considering the position of current
asset and current liabilities
To study the profitability position of the company by analyzing the various factors
influencing the profitability
To analyze the financial performance of the co-operative milk producer for five years
1.5 SCOPE OF THE STUDY
The scope of this study is to provide an insight into concept of financial performance
analysis and illustrated it by actually financial performance.
In our present day economics, finance is defined as the provision of money at the
when it is required every industry whether big medium or small needs finance to carry
on its operations and to achieve is target.
Finance is therefore viewed as the most important area in every industry therefore the
management requires giving special attention on this the conventional approach to
finance function in business high light the procurement of funds on the most economic
and favorable terms to concern.
The basic for financial planning and analysis financial information, financial need to
predict compare and evaluate the forms earning ability.
It contains summarized information of the firm’s financial affairs, organized
systematically.
1.6 RESEARCH METHODOLOGY
For every comprehensive research a proper research methodology is indispensable it has
to be properly conceived. The methodology is followed. The research design refers to
preplanning of what a researcher dose in his study. The design adopted in the study comes under
exploratory and evaluator research .since the data collected from the financial statements of the
company is analyzed under various financial and tactical tools.
SOURCES OF DATA:
The data require for the study have been collected from the secondary sources
Primary Data:
Primary data is the first hand information that is collected during the period of research.
Primary data has been collected through discussions held with the staffs in the accounts
department. Some types of information were gathered through oral conversations with the
cashier, taxation officer etc.
Secondary Data:
The secondary data are those data that are already collected and published. The financial
statements published & other publications relevant to the analysis are used as a basis for the
secondary data. Data necessary for the study are acquired by collecting second hand information
i.e. secondary data. In this present context the secondary data necessary for the analysis are
acquired through 5 consecutive years.(2007 TO 2011)
ANALYTICAL TOOLS
Ratio analysis
Comparative balance sheet
RATIO ANALYSIS
Current Ratio
Debtors Turnover Ratio
Average Collection period Ratio
Creditors Turnover Ratio
Average Payment Period Ratio
Fixed Asset turnover Ratio
Net Capital Turnover Ratio
Current Asset to Sales Ratio
Proprietary Ratio
Debtors Assets Ratio
1.7 LIMITATIONS OF THE STUDY
This analysis is based on the published annual reports.
This study is based on the secondary data basis.
Due to lack of time, this analysis of study is of short nature.
The financial analysis based on such financial statements on accounting figures would
not portray the effect of price level changes over the period.
The limitation of the annual reports may, therefore, affect the result of the study.

1.8 .CHAPTER SCHEME
The first chapter consists of brief introduction of the study,
The second chapter consists of company profile.
The third chapter consists of data analysis and interpretation.
The fourth chapter consists of findings, suggestion and conclusions.


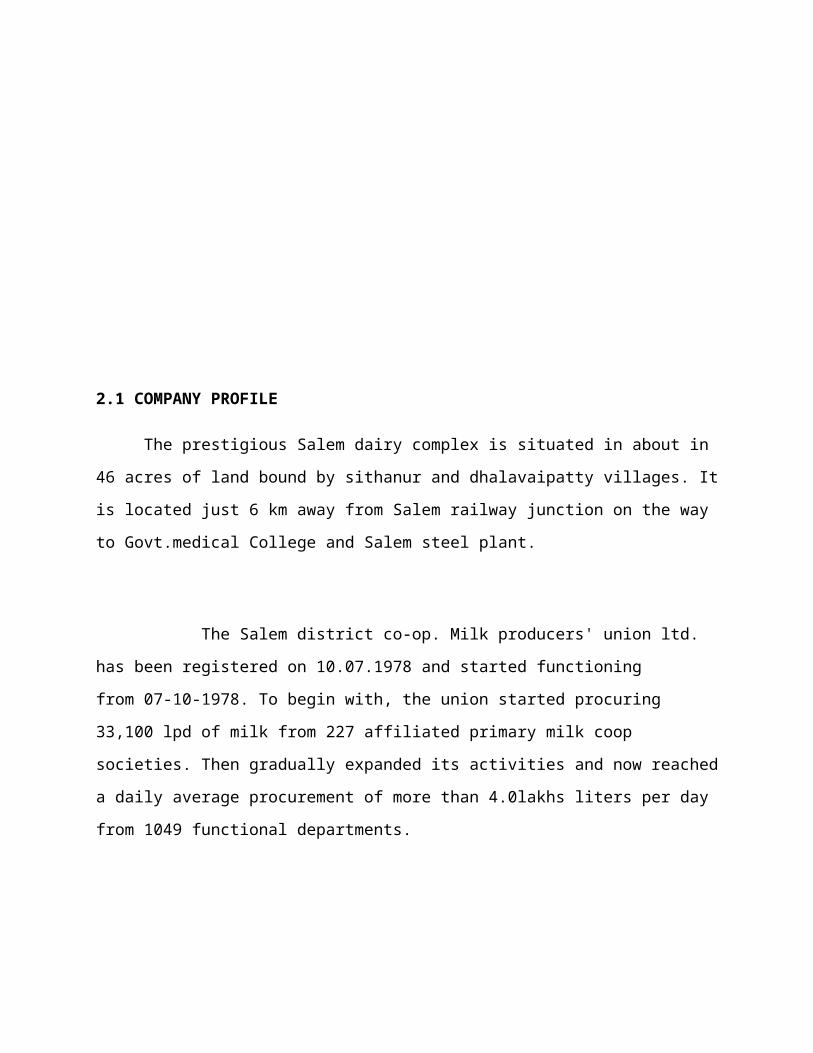
2.1 COMPANY PROFILE
The prestigious Salem dairy complex is situated in about in 46 acres of land bound by
sithanur and dhalavaipatty villages. It is located just 6 km away from Salem railway junction on
the way to Govt.medical College and Salem steel plant.
The Salem district co-op. Milk producers' union ltd. has been registered on 10.07.1978
and started functioning from 07-10-1978. To begin with, the union started procuring 33,100 lpd
of milk from 227 affiliated primary milk coop societies. Then gradually expanded its activities
and now reached a daily average procurement of more than 4.0lakhs liters per day from 1049
functional departments.
It is a feeder balancing dairy i.e. converting surplus milk solids into products like butter, ghee
and skim milk powder. The commercial production of products viz. Butter, ghee and skim milk
powder started on 16-08-1983. All the union activities are fully computerized.
Dairy is place where handling of milk and milk products done. Technology refers to the
applications of scientific knowledge for practical purpose. Dairy technology has been defined as
that branch of dairy science, which deals with the processing of milk manufacturing of milk
products on industrial scale.
In developed countries such as the USA the year 1850, is seen as the dividing line between
farm and factory scale production. Various factors contributed to this changes in these countries,
via concentration of population in cities where job were plentiful, rapid industrialization
improvement of transportation facilities, development of machine & technologies, etc. Whereas
rural areas were identified for milk production, the urban centers were selected for the location of
milk processing plants & product manufacturing factories.
The Indian diary industry has made rapid progress since independence. A large number of
modern milk plants and product factories have been established these organized dairies have
been successfully engaged in the routine commercial production of pasteurized bottle milk and
various dairy products. With modern knowledge of the protection of milk during transportation,
it becomes possible to locate dairies where land was less expensive and corps could be growth
more economically.
In India, the market milk technology maybe considered to have commenced 1950, with the
functioning of airy milk colony, and milk product technology in 1956 with the establishment of
AMUL dairy ANAND. The Salem district co-operative milk producer’s union ltd. was registered
on 10-07-1978 under Tamilnadu co-operative society’s act and stared functioning form 07-10-
1978. The object of the union is to carry out activities conducive to the economic development of
agriculturists and agricultural tenants and laborers by organizing effectively production,
processing and marketing of milk commodities. The commercial production of products viz.
butter, ghee and skim milk powder started on 16-08-1983.
.
DAIRY INDUSTRY IN INDIA
More than 2500 million people economically active in agriculture in the world. Probably
75% of them are wholly or partly dependent on livestock farming. India which has 66% of
economically active population engaged in agriculture. It derives 31% of GDP from agriculture.
The share of livestock is estimated at 21% of total agriculture sector.

OBJECTIVES:
To purchase pool process, manufacturing, distribute and sell, milk and milk by products
to the members of the affiliated societies and other private organization without affecting
the interests of the affiliated societies and their members.
To provide vender artificial insemination services, medicines and undertake cattle
insurance.
To buy animals on behalf of the affiliated societies and their members.
To purchase of cattle feed at whole sale rate distribution to members.
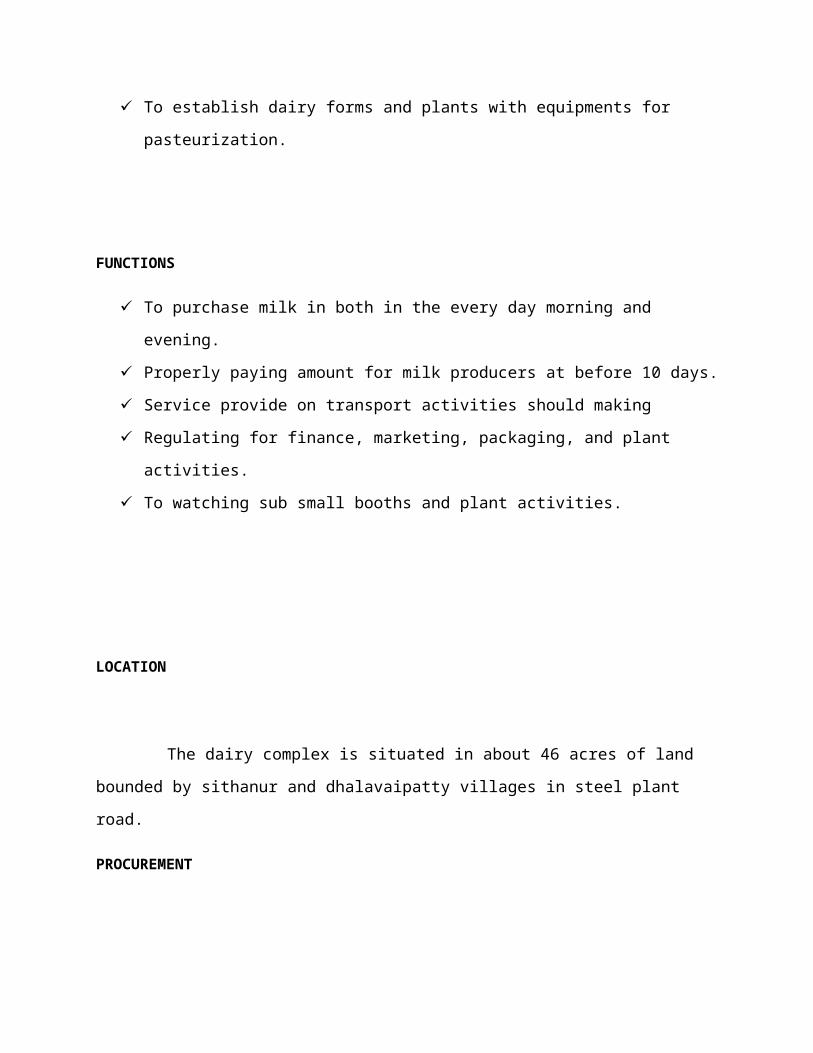
To establish dairy forms and plants with equipments for pasteurization.
FUNCTIONS
To purchase milk in both in the every day morning and evening.
Properly paying amount for milk producers at before 10 days.
Service provide on transport activities should making
Regulating for finance, marketing, packaging, and plant activities.
To watching sub small booths and plant activities.
LOCATION
The dairy complex is situated in about 46 acres of land bounded by sithanur and
dhalavaipatty villages in steel plant road.

PROCUREMENT
In total 1100 milk producer’s co-operative societies are affiliated and 932 societies are
functioning. The milk is collected through 55 milk routes daily ranging from 2.5 lacks liters of
milk per day depending on the season.
The procurement and input operation are managed through8 milk procurement team offices
at Salem, sankari, namakkal, p.velur, attur, rasipuram, mettur, and valapady. The milk is
delivered at the dock of the three chilling centers at namakkal, p.velur, attur and the main dairy at
Salem for chilling.
INPUT
Artificial insemination service input veterinary service and emergency veterinary service
and being provided to the animals of the producers in societies by the veterinarians of this union.
Further, artificial inseminations with exotic, cross bred and murrah bull semen are being
undertaken through the 564 artificial insemination sub-centers of the primary societies / union
and doing on an average of 26,000 artificial insemination per month. Nutritious cattle feed is
being supplied to the members at par rate.
FODDER
The union has taken up cultivation of fodder crops like cumbu Napier, hail grass, buffaloes
grass, subabul, sithakathi cholam, cumbu, maize, cowpea and hedge Lucerne etc. for distribution
of seed materials to the milk producers through milk co-operative societies at free of cost/at
nominal cost.

TRAINING CENTRE
The union had setup a training center in the year 1985 under operation flood. The training
center is imparting training to the DCS personnel of our union and also forms periyar,
Coimbatore and nilgiris unions.
The training centre conducts the programmers such as:
Secretary training
Milk tester training
A.H.Worker
Management committee members
Dairy animal management training
A.I.Refresher training
Cluster A.I. Training
2.2 INDUSTORY PROFILE
It is proposed to organized and assist 25 women dairy co-operatives both in Salem and
namakkal districts during the period from 2002 to 2005, involving 1750 women members
through self help groups. The proposed 25 dairy co-operative will have 70 members in each
society and they will be identified, trained in all aspects of dairying and monitored continuously
for their economic enlistment.
The dairy has installed capacity to process 3lakhs liters of milk per day, to produce 10 MT
of skim milk powder 9 MT of butter and 6 MT of ghee. The quantity of milk available after local
sales and dispatch to Chennai is converted into products viz., butter, ghee and skim milk powder.
Ghee and skim milk powder are being solid in the markets all over India through the Tamil nadir
co-op.
Milk producers federation Ltd., Chennai with “Agmark” and “ISI” grades respectively. Our
products bear the famous brand name of “AAVIN”. I.S.O. 9002 Certificate also obtained for
production and supply of milk, skim milk powder, butter, ghee and UHT milk in tetra pack.

ASEPTIC PACKAGING STATION
Ultra high temperature treated milk has a shelf life of 120 days at room temperature without
refrigeration. For ultra high temperature treatment, milk of low bacteriological count is taken and
is subjected to high temperature of 140 degree C gradually (Exposed for 2 seconds”) and cooled
back to ambient temperature and packed in sterile aluminum foil polythene paper in the shape of
brick.
The main advantages of ultra high temperature treated milk are:
No refrigeration is required.
Very hygienic and no adulteration can be done.
Single way transportation, easy for storage, pilfer-proof and convenience to consume.
Reasonable price.
QUALITY CONTROL
The role of the lab is to assist in stage-wise testing and reporting the quality status of milk
processed and standardized so that milk of the correct standards are prepared and marketed.
Similarly cream, butter, butter-milk, ghee and skim milk powder are tested at regular intervals
both during production and storage to check that there is no quality deterioration.
Water, cleaning chemicals asking materials, etc., are also tested regularly to ensure their
conformity to pre-set standards. The bacteriologists check incoming and processed in milk and
also milk products in addition to water & environmental air to ensure that they are they also
check the sterility of plant and equipment to ensure their hygienic status. The dairy has an
effluent treatment plant. The effluent is tested periodically to ensure that it satisfies the standards
prescribed by the Tamilnadu pollution control board.

CANTEEN
The company provides canteen facilities for all employees satisfying their physiological
needs at subsidized rate.
SAFETY
The company through safety committee provides safety measures to workers in the company.
There is first-aid and provide firing equipments.

3.1 RATIO ANALYSIS
The primary uses of financial statement are evaluating past performance and predicting
future performance and both of these are facilitated by comparison. Therefore the focus of
financial analysis is always on the crucial information contained in the financial statements. This
depends on the objectives and performance of such analysis. The purpose of evaluating such
financial statement is different from person to person depending on its relationship. In other
words, even though the business unit itself and shareholders, debentures holders, investors, etc.
all undertake the financial analysis, the purpose, means and extent of such analysis differs. For
example, trade creditors may be interested primarily in the liquidity of the firm because the
ability of the business unit to the business unit to pay their claims are best judged by means of
through analysis of its liquidity.
The shareholder and the potential investors may be interested in the present and the
further earnings per share, the stability of such earnings and comparison of these earnings with
other units in the industry. Similarly the debenture holders and the financial institution lending
long term loans term may be concerned with the cash flow ability of the business unit to pay
pack the debt in the long run. The management of the business unit, in contrast, looks to the
financial statement from various angles. These statement are required not only for the
management own evaluation and decision making but also for internal control and overall
performance of the firm. Thus the scope, extent and means of any financial analysis are a part of
the larger information processing system which from the very basic of any “decision making”
process.
The financial analysts always need certain yardstick to evaluate the efficiency and
performance of any business unit. The one of the most frequently used yardstick is ratio analysis.
Ratio analysis involves the use of various methods for calculating and interpreting financial
ratios of assess the performance and status of the business unit. It is a tool of financial analysis,
which studies the numerical or quantitative relationship between two variables and item. A ratio
can be worked out by dividing one of the variables of the relationship with other variable and
such ratio value is compared with standards/ norms. In other words, ratio is relative figures
reflection the relationship between variables and enable the analysis to draw conclusion
regarding the financial operations.

This is the measure of inter relationship between different sections of the financial
statement which then is compared with the budgeted or forecasted results, prior year results and
or the industrial results. To be most important ratios must include a study of underlying data.
Ratios should be taken as guides that are useful in evaluating a company’s financial position and
operations and making comparison with results in previous year of with other companies. The
primary purpose of ratios is to point out areas needing further investigations. A part from the
ratios other information which should be looked at includes.
MEANING
Ratio simply means one number expressed in terms of another. A ratio is statistical
yardstick by means of which relationship between two or various figures can be compared or
measured. Ratios are relationship expressed in mathematical terms between figures, which are
connected with each other in some manner. An accounting ratio shows the relationship in
mathematical terms between two interrelated accounting figures.
DEFINITION
According to Wixon, Kell and Bedford, “A ratio is an expression of the quantitative
relationship between two numbers”.
NATURE
Ratio analysis is a technique of analysis and interpretation of financial statement. It is the
most important tool available to financial analysis for their work. It is the process of establishing
and interpreting various ratios for helping in making certain decisions. However, ratio analysis is
not an end in itself. It is only a means of better understanding of financial strength and weakness
of a firm. It is expressed either in the form of a coefficient or as a percentage or as a proportion.

TYPES OF RATIO:
Several ratios calculated from the accounting data, can be grouped into various classes
according to financial activity or function to be evaluated, as stared earlier, the parties interested
in financial analysis are short-term and long-term creditors. Owners and management interest is
in liquidity position or the short-term solvency of the firm. Long-term creditors, on the other
hand, more interested in the long- term solvency and profitability of the firm.
Similarly owners concentrate on the firm profitability and financial condition.
Management is interested in evaluating every aspect of the firm’s performance. In view of the
requirements of the various users of ratios, classifying into following four important categories.
Current Ratio
Debtors Turnover Ratio
Average Collection period Ratio
Creditors Turnover Ratio
Average Payment Period Ratio
Fixed Asset turnover Ratio
Net Capital Turnover Ratio
Current Asset to Sales Ratio
Proprietary Ratio
Debtors Assets Ratio
COMPARATIVE BALANCE SHEET
The single balance sheet shows assets and liabilities as on a particular data. The
comparative balance sheet shows the value of assets and liabilities on two different data if helps
in comparison a comparative balance sheet has two columns to record the record the figures of
the current year and the previous year. A third column is used to show the increase or decrease in
figures. A fourth column may be added for giving percentage of increase or decrease.
Thus while in the balance sheet the emphasis is on status in the comparative balance
sheet it is on change comparative balance sheet indicates whether the business is moving in a
favorable or unfavorable direction. It is very useful for studying the trends in an enterprise.

ANALYSIS AND INTERPRETATION OF FINANCIAL PERFORMANCE
Analysis and interpretation of financial statement is the most important step in
accounting. To have very clear understanding of profitability and financial position of the
company. The financial statements have to be analyzed and interpreted. Analysis refers to the
methodological classification of the data given in the financial statement.
The term interpretation means explaining the meanings and significance of the data so
arranged. It is the study of the relationship between various functional factors. The relationship
between profit and capital employed, current asset and current liabilities and gross profit have to
be explained further to make interpretation more meaningful comparisons have to be made.
Comparison of relationship between various financial factors of the same company over a period
of time can be made.
TIPS TO IMPROVE YOUR FINANCIAL HEALTH.
Author: Bill Hudley
Spend less money, or save more money or do both. If the annual income does nothing
more than remain constant, your financial condition will improve.
The above statement may sound come across as flippant, but it’s a fact of life, regardless.
Needless to say we all have different personalities and different responses to needs and desires in
life.
A very important yardstick, in my view, is the growth rate of personal assets. If you sit
down to all of the savings accounts, investment accounts and properly values and the total value
is greater than the same time of the previous year, it stands to improve that the financial health
intact and possibly improved.
STEPS TO IMPROVE FINANCIAL PERFORMANCE
Author: Terry Peltes
Given the challenges facing physicians, successful practices must take proactive steps to
combat negative trends and improve their overall financial performance.
To improve practice operations, processes can be streamlined to reduce costs;
productivity improvements can be implemented by physicians and employees to increase
revenue; a reporting structure can be created that allows for better decision making by physicians
and employees; and a rewards system can be implemented to recognize hard-working
employees.
To determine how you can improve your medical practice's performance, consider the
following management procedures.
1) Internal Cost Reduction Strategies
Cost reduction strategies focus on reducing the internal costs generated by medical
services provided to the marketplace.
2) External Cost Reduction Strategies
These strategies include the cost of services purchased from outside consultants or
vendors.
3) Asset and Credit Management Strategies
These strategies ensure that you are getting the most value from the resources invested in
your practice.
4) Personnel Resources
When managed properly, personnel costs and productivity can have a substantial impact
on practice profitability.

5) Management Reporting
The use of timely, relevant, properly formatted reports to manage your practice cannot be
overstated. This is a crucial link between setting financial and operational goals and managing
the practice to achieve them.
6) Revenue Enhancement
Physicians can improve their financial performance by improving their ability to
negotiate favorable managed care contracts and reducing practice expenses as a percentage of
revenue.
EXCELLENCE IN FINANCIAL MANAGEMENT
Author: Matt H. Evans
Ratio analysis can be used to determine the time required to pay accounts payable
invoices. If the average number of days is close to the average credit terms, this may indicate
aggressive working capital management; i.e. using spontaneous sources of financing. However,
if the number of days is well beyond the average credit terms, this could indicate difficulty in
making payments to creditors.
ANALYZE INVESTMENTS QUICKLY WITH RATIOS
Author: Jonas Elmerraji
The information you need to calculate ratios is easy to come by: Every single number or
figure you need can be found in a company's financial statements. Once you have the raw data,
you can plug in right into your financial analysis and put those numbers to work for you.
Everyone wants an edge in investing but one of the best tools out there frequently is
frequently misunderstood and avoided by new investors. When you understand what ratios tell
you, as well as where to find all the information you need to compute them, there's no reason
why you shouldn't be able to make the numbers work in your favor.

LIQUIOD RATIOS
3.1 Current Ratio
One of the liquidity ratios is current ratio. Current ratio explains relationship between
firm’s current assets, and current liabilities.
Current assets means. Which can be converted into cash within a year. Current liabilities
mean those obligations maturing within a year. Ideal value of current ratio is 2:1. It means every
one rupee of current assess less then Rs.2, it shows inefficiency to manage current assets.
The following formula is used to find out the current ratio.
Current assets
Current ratio =
Current liabilities
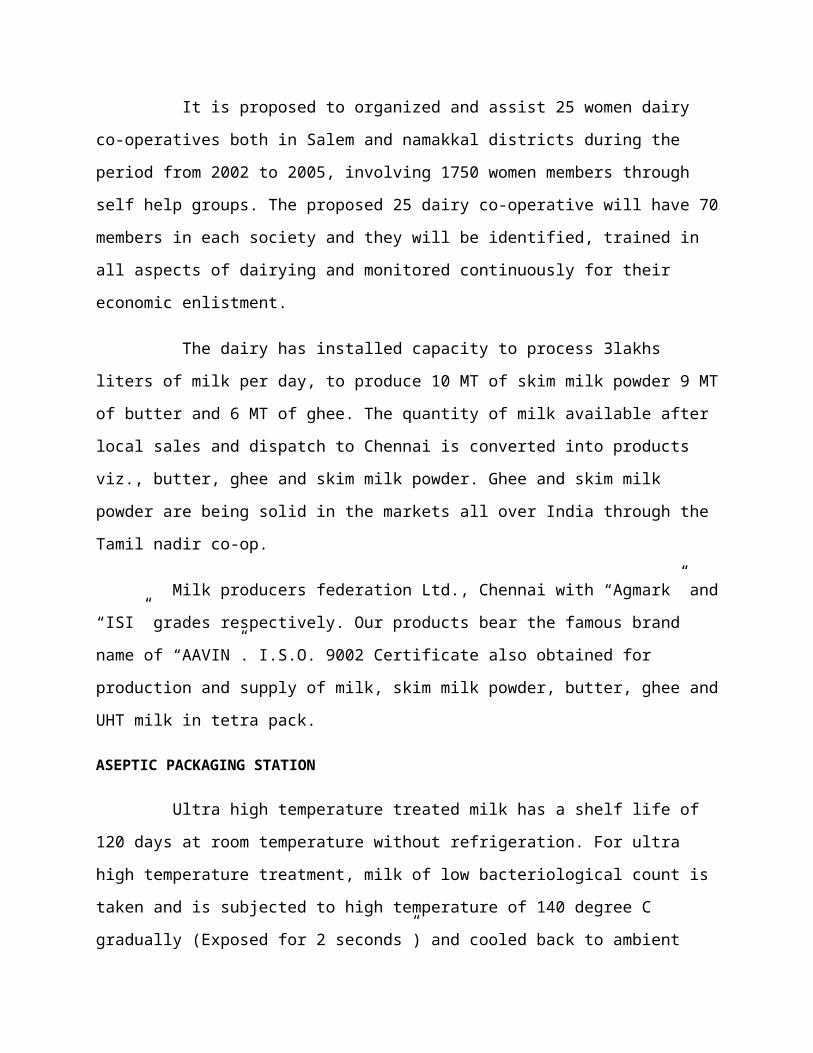
Table No 3.1
Statement showing Current Ratio
(in Rs)
Year Current Assets Current Liabilities Ratio (time)
2006 – 2007 151110482.05 66483513.70 2.27
2007 – 2008 161989791.89 56843702.79 2.85
2008 – 2000 87245320.79 68032549.49 1.28
2009 – 2010 57813761.71 101115361.55 0.57
2010 – 2011 40257368.34 56311171.40 0.71
Source: Secondary data

Figure No.3.1
CURRENT RATIO
2006 – 2007 2007 – 2008 2008 – 2000 2009 – 2010 2010 – 2011
Ratio (time)
243 226 127 76 81
25
75
125
175
225
275
Ratio (time)
Curr
ent R
atio
INTERPRETATION
Table 3.1 shows that the current ratio of the firm is satisfactory during the years 2006-07
to 2010-11. For all the periods taken for study shows that the current assets are more than current
liabilities and hence the organization’s ability to meet current obligations is increased, resulting
in excellent short term solvency position an also greater safety of funds to short term investors.
Though there is marginal decrease in the year 2010-11 comparing with 2007-08.
RECEIVABLE RATIO

3.2 Debtors Turnover Ratio
Debtor’s turnover Ratio indicates the velocity of debt collection of firm. In simple words,
it indicates the number of times average debtors (receivables) are turned over during a year.
Total Sales
Debtors Turnover Ratio =
Debtors
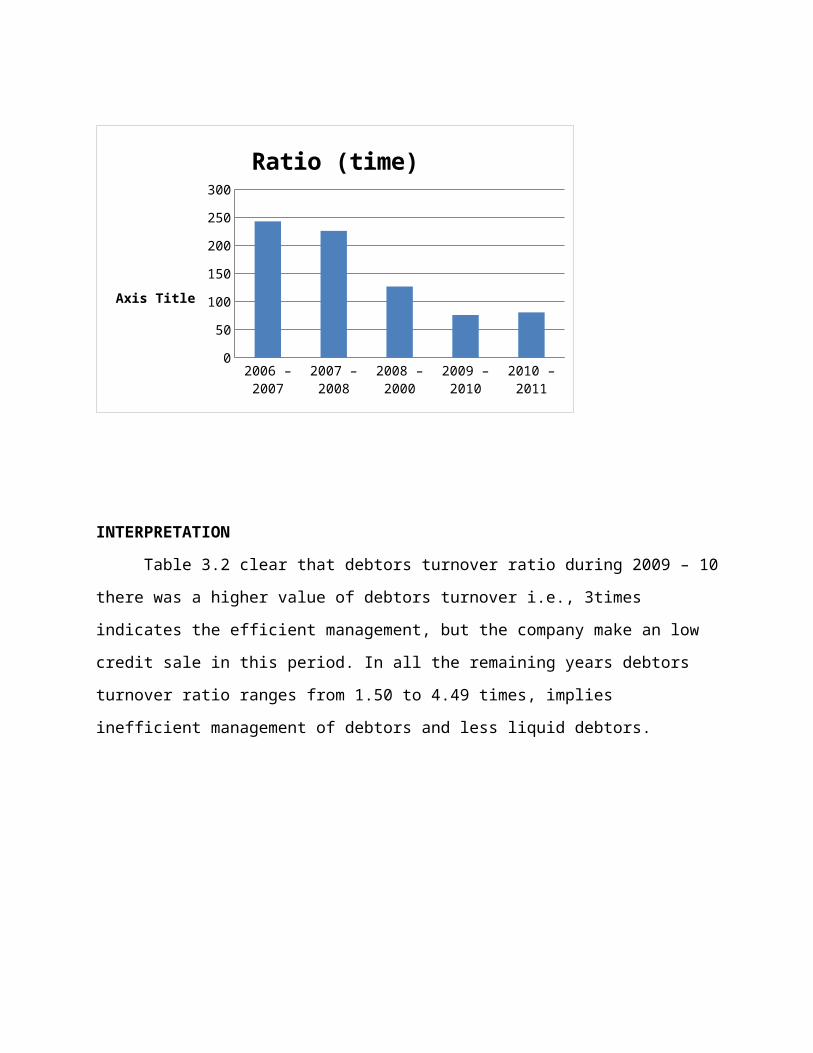
Table No 3.2
Statement showing Debtors Turnover Ratio
(in Rs)
Year Sales Debtors Ratio (time)
2006 – 2007 226703457.27 151110482.05 1.50
2007 – 2008 260477758.44 161989791.89 1.60
2008 – 2009 250268050.50 87245320.79 2.87
2009 – 2010 276689822.53 57813761.71 4.79
2010 – 2011 180901425.79 40257368.34 4.49
Source: Secondary data

Figure No 3.2
DEBTORS TURNOVER RATIO
2006 – 2007
2007 – 2008
2008 – 2000
2009 – 2010
2010 – 2011
Ratio (time)
243 226 127 76 81
25
75
125
175
225
275
Ratio (time)
Axis Title
INTERPRETATION
Table 3.2 clear that debtors turnover ratio during 2009 – 10 there was a higher value of
debtors turnover i.e., 3times indicates the efficient management, but the company make an low
credit sale in this period. In all the remaining years debtors turnover ratio ranges from 1.50 to
4.49 times, implies inefficient management of debtors and less liquid debtors.
3.3 Average Collection period Ratio
The Average Collection period represents the average number of days for which a firm
has to wait before its receivables are converted into cash. It measures the quality of debtors.
Debtors
Collection Period Ratio = x No of working days
Sales
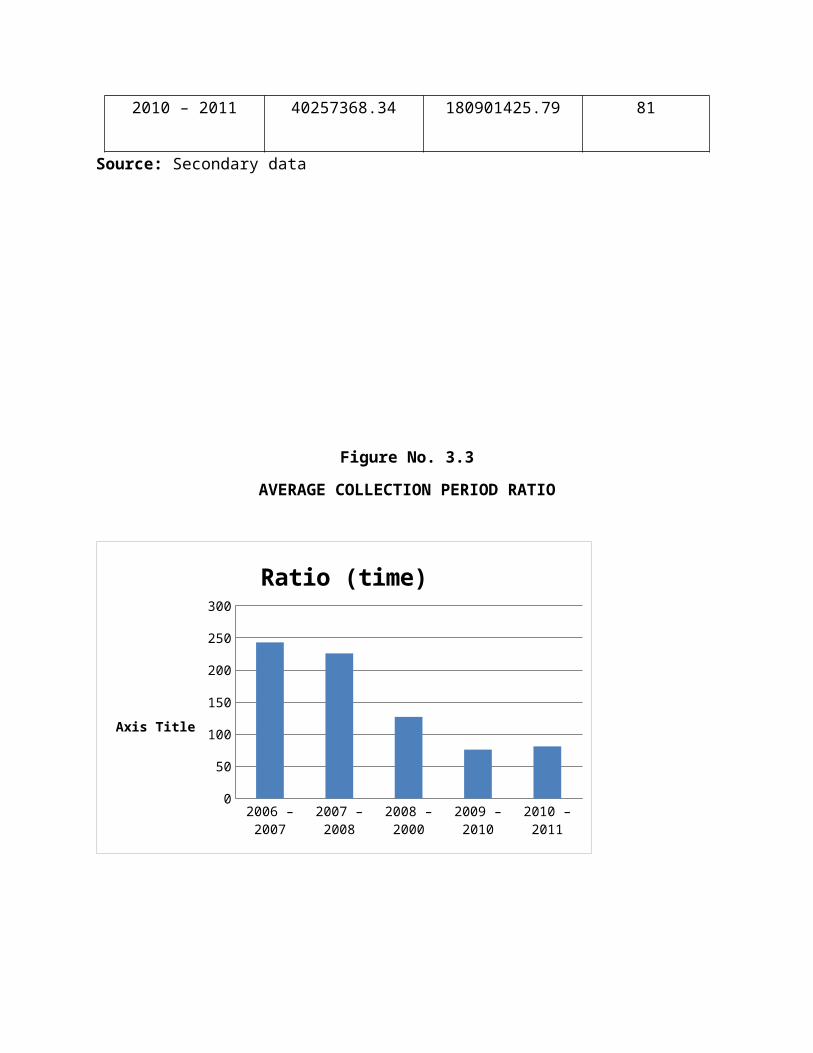
Table No 3.3
Statement showing Average collection period Ratio
(in Rs)
Year Debtors Sales Ratio (time)
2006 – 2007 151110482.05 226703457.27 243
2007 – 2008 161989791.89 260477758.44 226
2008 – 2009 87245320.79 250268050.50 127
2009 – 20010 57813761.71 276689822.53 76
2010 – 2011 40257368.34 180901425.79 81
Source: Secondary data

Figure No. 3.3
AVERAGE COLLECTION PERIOD RATIO
2006 – 2007
2007 – 2008
2008 – 2000
2009 – 2010
2010 – 2011
Ratio (time)
243 226 127 76 81
25
75
125
175
225
275
Ratio (time)
Axis Title
INTERPRETATION
Table 3.3 clear that the average collection period during 2009 – 10, 2008 -09 and 2010-
11, have minimum number of days, so there is a quick payment by the debtors. 2006 -07 and
2007 – 08 implies the inefficient collection performance.
PAYABLE RATIO
3.4 Creditors Turnover Ratio
This ratio indicates the velocity with which the creditors are turned over in relation to
purchases. The analysis of creditors turnover ratio is basically is the same as the debtors turnover
ratio except that in place of trade debtors, trade creditors is taken as one of the components of the
ratio and in place of sales, purchases where taken.
Total Purchases
Creditors Turnover Ratio =
Creditors
Table No 3.4
Statement showing Creditors Turnover Ratio
(in Rs)
Year Total purchases Creditors Ratio (time)
2006 – 2007 44588143.94 41085661.70 1.09
2007 – 2008 43289324.61 32714624.79 1.32
2008 – 2009 53496799.69 38714577.49 1.38
2009 – 2010 52123691.06 71350077.50 0.73
2010 – 2011 55015067.40 25209924.40 2.18
Source: Secondary data

Figure No 3.4
CREDITORS TURNOVER RATIO
2006 – 2007 2007 – 2008 2008 – 2009 2009 – 2010 2010 – 2011
Ratio (time)
0.07 0.670000000000006
0.47 0.25 0.13
0.05
0.15
0.25
0.35
0.45
0.55
0.65
0.75
Ratio (time)Cr
edito
rs T
urno
ver R
atio
INTERPRETATION
Table 3.4 clear that Creditors turnover ratio ranges from 0.73 to 2.18 times during the
study period. During 2010 – 11 there was a favorable result and 2006 – 07 to 2010- 11 was
lower creditor’s velocity, are less favorable.
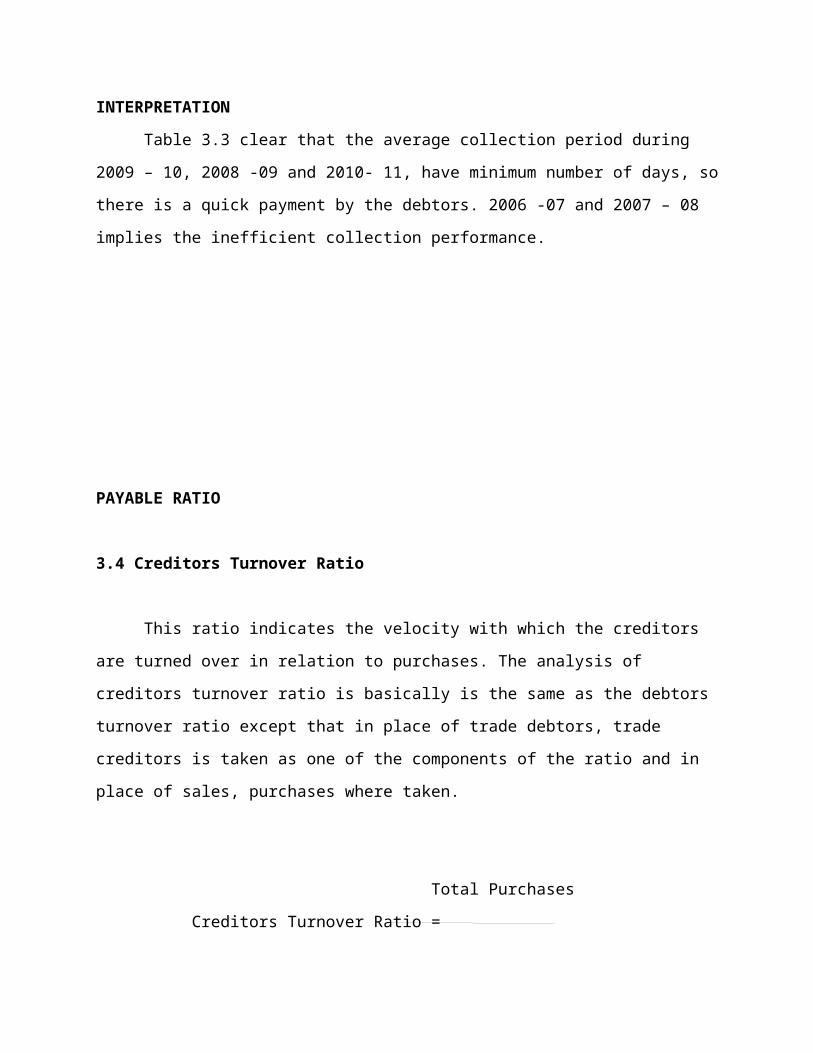
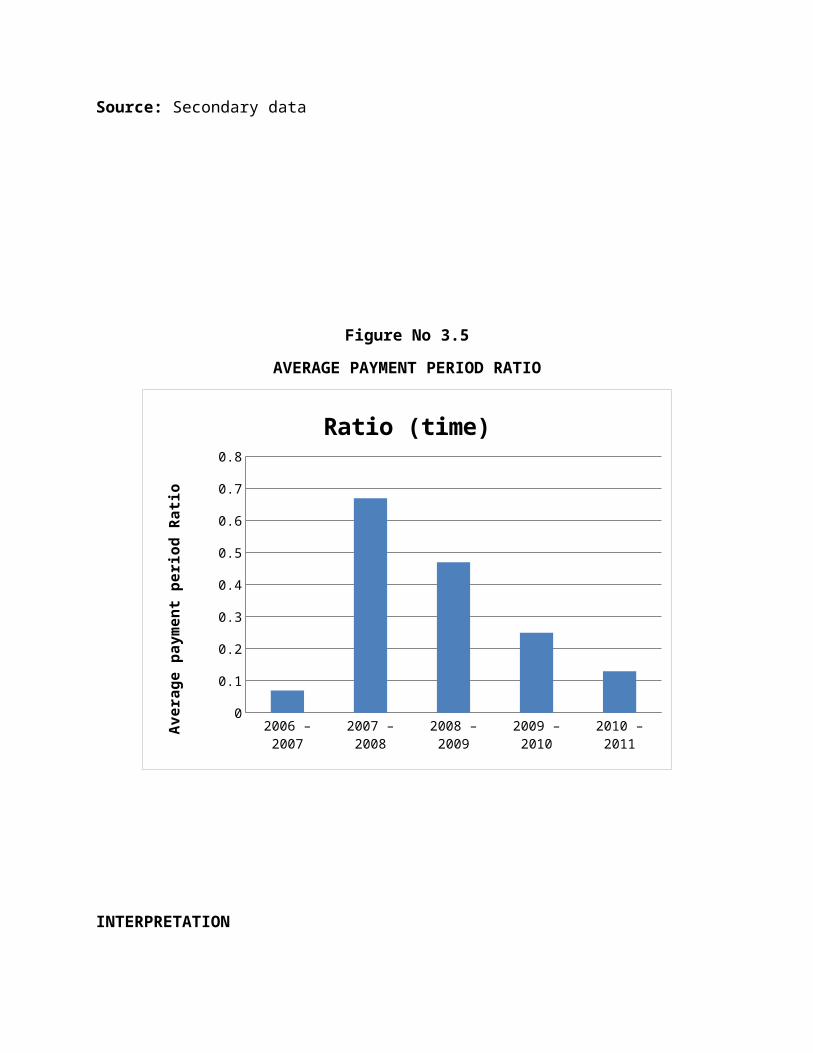
3.5 Average Payment Period Ratio
The Average payment period represents the average number of days taken by a firm to
pay its creditors. Generally lower the ratio, the better is the liquidity position of the firm and
higher the ratio, less liquidity is the position of the firm.
Creditors
Average payment period = × No of working days
Purchases
Table No 3.5
Statement showing Average payment period Ratio
(in Rs)
Year Creditors Total purchases Days
2006 – 2007 41085661.70 44588143.94 336.32
2007 – 2008 32714624.79 43289324.61 275.83
2008 – 2009 38714577.49 53496799.69 264.14
2009 – 2010 71350077.50 52123691.06 449.63
2010 – 2011 25209924.40 55015067.40 167.26
Source: Secondary data
Figure No 3.5

AVERAGE PAYMENT PERIOD RATIO
2006 – 2007 2007 – 2008 2008 – 2009 2009 – 2010 2010 – 2011
Ratio (time)
0.07 0.670000000000006
0.47 0.25 0.13
0.05
0.15
0.25
0.35
0.45
0.55
0.65
0.75
Ratio (time)A
vera
ge p
aym
ent p
erio
d Ra
tio
INTERPRETATION
Table 3.5 clear that Average payment period ratio during 2006-07, 2008-09 and 2010-11
implies greater credit period enjoyed by the company, but during 2007-08 to 2009-10 company
has better liquidity position.
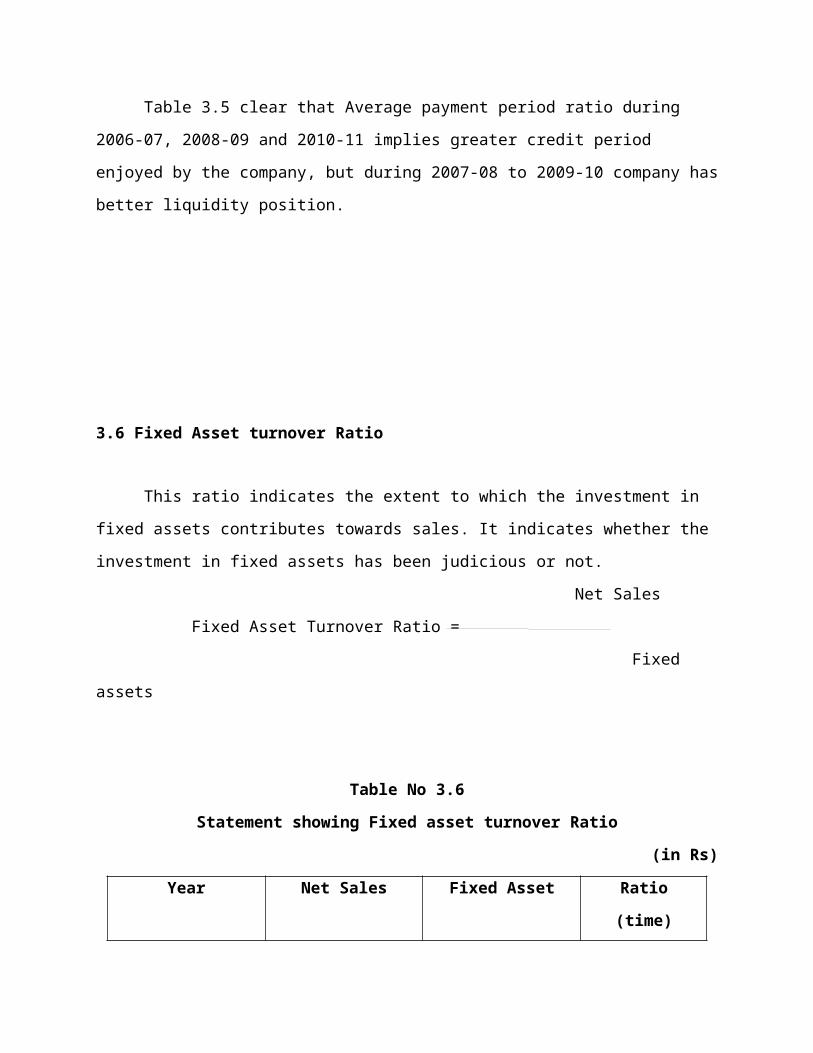
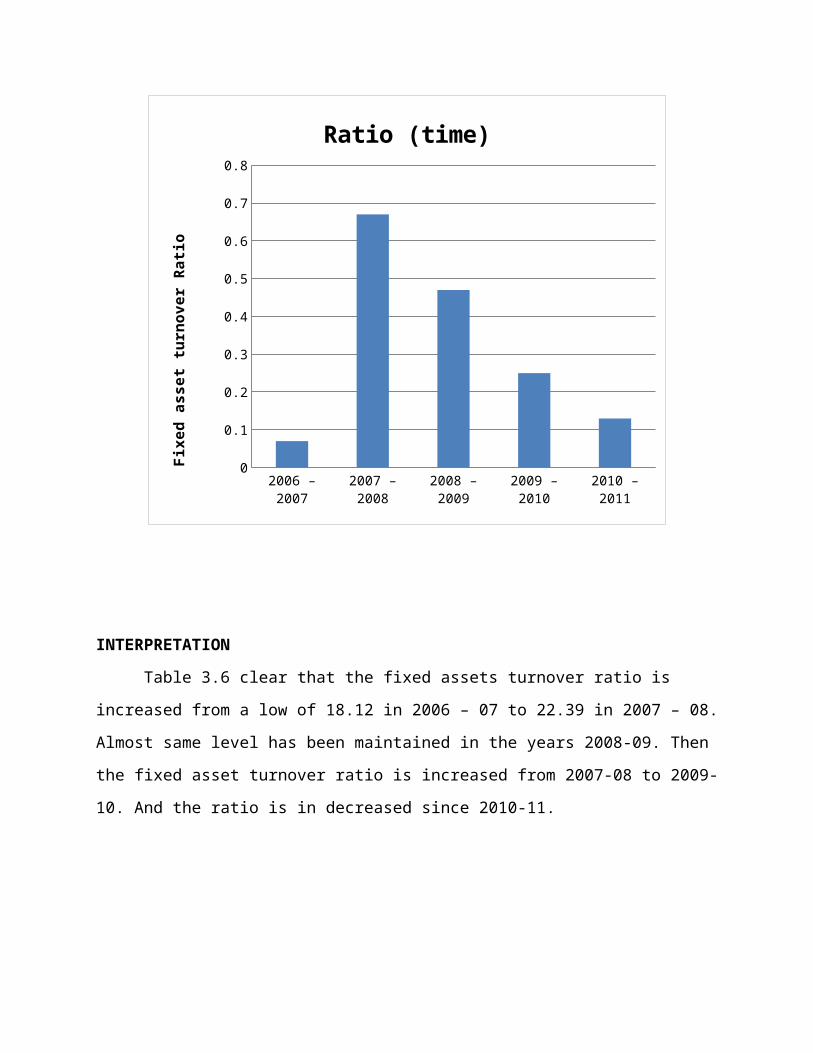
3.6 Fixed Asset turnover Ratio
This ratio indicates the extent to which the investment in fixed assets contributes towards
sales. It indicates whether the investment in fixed assets has been judicious or not.
Net Sales
Fixed Asset Turnover Ratio =
Fixed assets
Table No 3.6
Statement showing Fixed asset turnover Ratio
(in Rs)
Year Net Sales Fixed Asset Ratio (time)
2006 – 2007 226703457.27 125105884.13 18.12
2007 – 2008 260477758.44 11635325.60 22.39
2008 – 2009 250268050.50 1105344.51 22.64
2009 – 2010 276689822.53 77056152.57 35.90
2010 – 2011 180901425.79 112718261.02 16.09
Source: Secondary data
Figure – 3.6
Fixed Asset Turnover Ratio
2006 – 2007 2007 – 2008 2008 – 2009 2009 – 2010 2010 – 2011
Ratio (time)
0.07 0.670000000000006
0.47 0.25 0.13
0.05
0.15
0.25
0.35
0.45
0.55
0.65
0.75
Ratio (time)Fi
xed
asse
t tur
nove
r Rati
o
INTERPRETATION
Table 3.6 clear that the fixed assets turnover ratio is increased from a low of 18.12 in
2006 – 07 to 22.39 in 2007 – 08. Almost same level has been maintained in the years 2008-09.
Then the fixed asset turnover ratio is increased from 2007-08 to 2009-10. And the ratio is in
decreased since 2010-11.
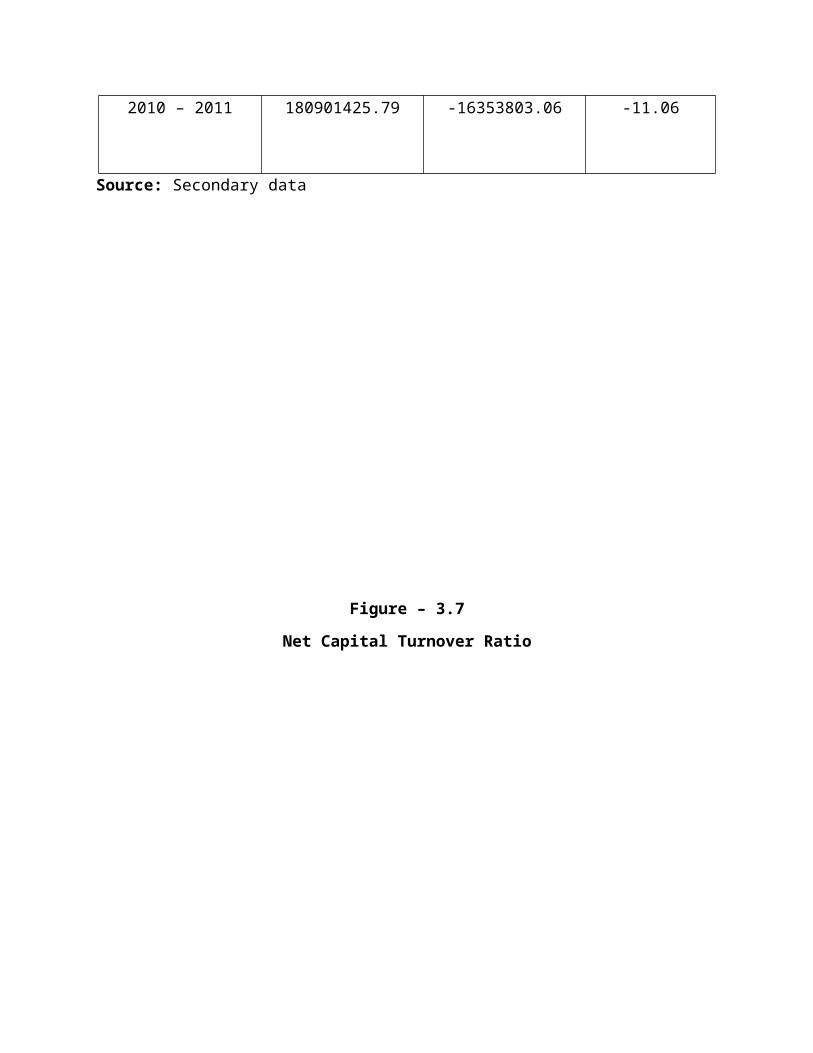
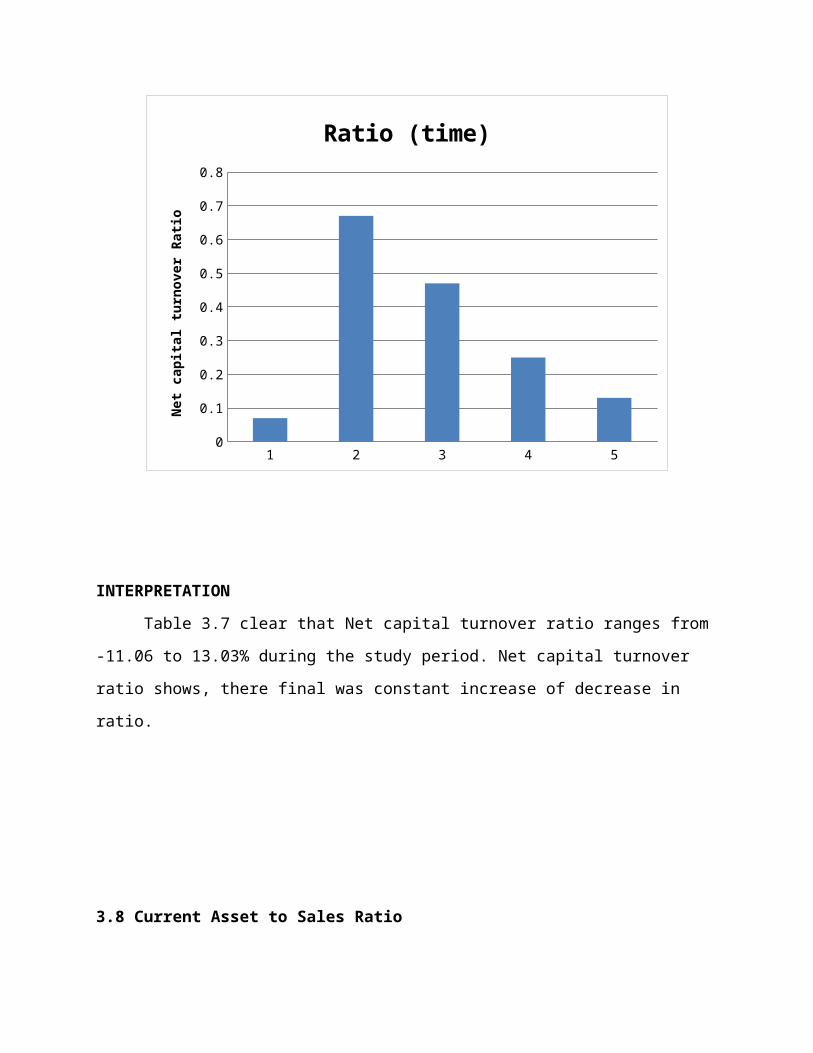
3.7 Net Capital Turnover Ratio

To understand the relationship between net profit and sales, the net profit is being
calculated which indicate the efficiency of the management in manufacturing, administering and
selling the products. This ratio measures the overall of the overall ability of the firm to turn each
rupee of sales into net profit. The net profit is measured by dividing net profit by sales.
Net Capital Turnover Ratio is the relationship between cost of sales (or) sales and Capital
Employed in the business. This ratio is calculated to measure the efficiency or effectiveness with
which a firm utilizes its resources or the capital employed.
Net Sales
Net capital Turnover Ratio =
Net Working Capital

Table No 3.7
Statement showing Net capital turnover Ratio
(in Rs)
Year Net Sales Net working capital Ratio (time)
2006 – 2007 226703457.27 84626968.3 2.68
2007 – 2008 260477758.44 10514608.9 2.48
2008 – 2009 250268050.50 19212771.3 13.03
2009 – 2010 276689822.53 -43301605.79 -6.39
2010 – 2011 180901425.79 -16353803.06 -11.06
Source: Secondary data

Figure – 3.7
Net Capital Turnover Ratio
1 2 3 4 5
Ratio (time) 0.07 0.670000000000006
0.47 0.25 0.13
0.05
0.15
0.25
0.35
0.45
0.55
0.65
0.75
Ratio (time)
Net
capi
tal t
urno
ver R
atio
INTERPRETATION
Table 3.7 clear that Net capital turnover ratio ranges from -11.06 to 13.03% during the
study period. Net capital turnover ratio shows, there final was constant increase of decrease in
ratio.
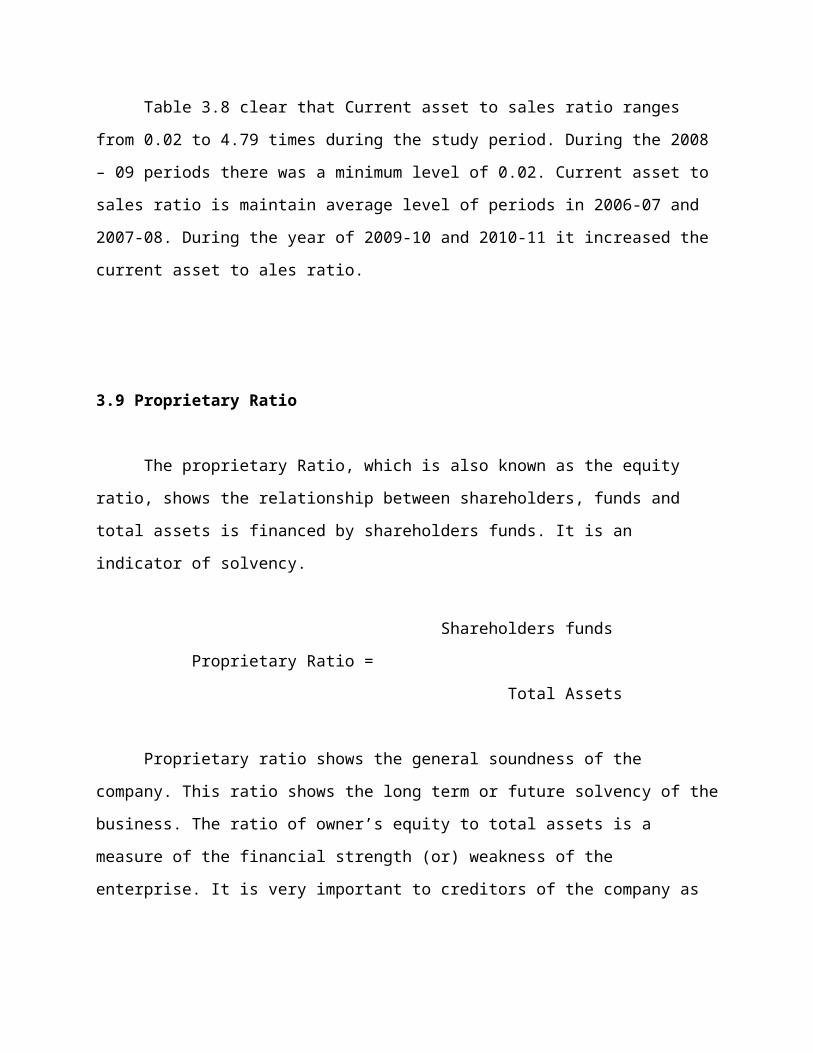
3.8 Current Asset to Sales Ratio

Current Asset to sales Ratio is indicates
Sales
Current assets to sales Ratio =
Current Assets
Table No 3.8
Statement showing Current Asset to Sales Ratio
(in Rs)
Year Net Sales Current Assets Ratio (time)
2006 – 2007 226703457.27 151110482.05 1.50
2007 – 2008 260477758.44 161989791.89 1.60
2008 – 2009 250268050.50 87245320.79 0.02
2009 – 2010 276689822.53 57813761.71 4.79
2010 – 2011 180901425.79 40257368.34 4.49
Source: Secondary data
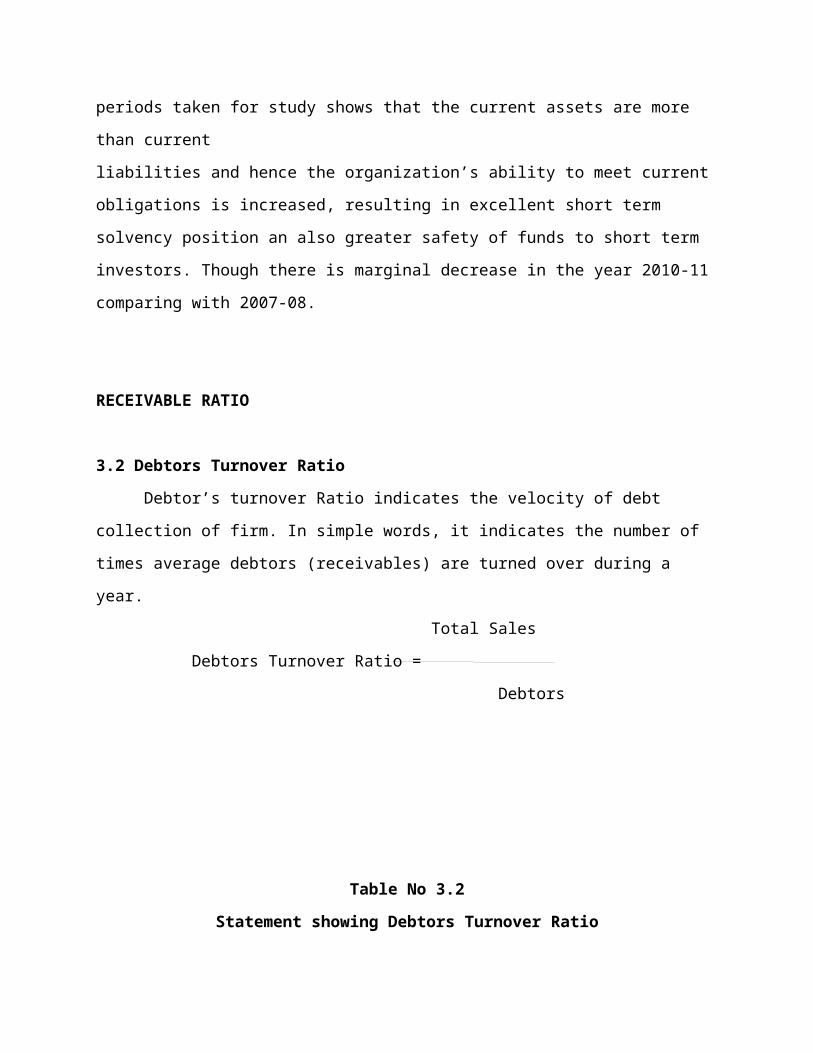
Figure – 3.8
Current Assets to Sales Ratio
2006 – 2007 2007 – 2008 2008 – 2009 2009 – 2010 2010 – 2011
Ratio (time)
0.07 0.670000000000006
0.47 0.25 0.13
0.05
0.15
0.25
0.35
0.45
0.55
0.65
0.75
Ratio (time)Cu
rren
t Ass
et to
Sal
es R
atio
INTERPRETATION
Table 3.8 clear that Current asset to sales ratio ranges from 0.02 to 4.79 times during the
study period. During the 2008 – 09 periods there was a minimum level of 0.02. Current asset to
sales ratio is maintain average level of periods in 2006-07 and 2007-08. During the year of 2009-
10 and 2010-11 it increased the current asset to ales ratio.
3.9 Proprietary Ratio

The proprietary Ratio, which is also known as the equity ratio, shows the relationship
between shareholders, funds and total assets is financed by shareholders funds. It is an indicator
of solvency.
Shareholders funds
Proprietary Ratio =
Total Assets
Proprietary ratio shows the general soundness of the company. This ratio shows the long
term or future solvency of the business. The ratio of owner’s equity to total assets is a measure of
the financial strength (or) weakness of the enterprise. It is very important to creditors of the
company as it helps them to ascertain the shareholder’s funds in the total assets of the business.
The acceptable norms of this ratio are 1:3. A high ratio indicates safety to the creditors
and a low ratio shows greater risk to the creditors. The shareholders funds are equity share
capital, preference share capital, undistributed profits, reserves and surplus. Out of this amount,
accumulated losses should be deduced. The total assets on the other hand denote total resources
of the concern.
A ratio below 0.5 is alarming for the creditors since they have to lose heavily in the
event of company’s liquidation as it indicates more of creditor’s funds and less of shareholder’s
funds in the total assets of the company.
Table No 3.9
Statement showing Proprietary Ratio
(in Rs)
Year Shareholders’ funds Total Assets Ratio (time)
2006 – 2007 26348000.00 214837267.08 0.12
2007 – 2008 26348000.00 241851761.64 0.10
2008 – 2009 26348000.00 183931582.04 0.14
2009 – 2010 26348000.00 228557881.24 0.12
2010 – 2011 26348000.00 306963670.07 0.08
Source: Secondary data

Figure – 3.9
Proprietary Ratio
2006 – 2007 2007 – 2008 2008 – 2009 2009 – 2010 2010 – 2011
Ratio (time)
0.07 0.670000000000006
0.47 0.25 0.13
0.05
0.15
0.25
0.35
0.45
0.55
0.65
0.75
Ratio (time)
Prop
rieta
ry R
atio
INTERPRETATION
Table 3.9 shows that the proprietary ratio a higher proprietary ratio in the year of 2008-
09 is 0.14 and the lower proprietary ratio is 0.08 in the year 2009-10. During the 2006-07,
2007-08 and 2009-10 are maintain the Average level of the proprietary ratio.
3.10 Debtors to Assets Ratio
Total Debtors
Debtors Assets Ratio =
Total Assets
Table No 3.10
Statement showing Debtors Asset Ratio
(in Rs)
Year Debtors Total Assets Ratio (time)
2006 – 2007 151110482.05 214837267.08 0.07
2007 – 2008 161989791.89 241851761.64 0.67
2008 – 2009 87245320.79 183931582.04 0.47
2009 – 2010 57813761.71 228557881.24 0.25
2010 – 2011 40257368.34 306963670.07 0.13
Source: Secondary data
Figure – 3.10
Debtors Assets Ratio
2006 – 2007 2007 – 2008 2008 – 2009 2009 – 2010 2010 – 2011
Ratio (time)
0.07 0.670000000000006
0.47 0.25 0.13
0.05
0.15
0.25
0.35
0.45
0.55
0.65
0.75
Ratio (time)De
btor
s Ass
et R
atio
INTERPRETATION
Table 3.10 shows Debtors assets ratio 2007-08 highest ratio of 0.67. During the period of
2006-07 minimum rate of debtors assets ratio. Debtor’s assets ratio is decreased to during the
year of 2008-09 to 2010-11.
3.2 STATEMENT OF COMPARATIVE BALANCE SHEET ANALYSIS

Any financial statement that reports the comparison of data of two or more consecutive
accounting periods is known as comparative financial statements. The comparative financial
statements are statements of the financial position at different periods of time. The elements of
financial position are shown in a comparative form so as to given an idea of financial position at
two or more periods. Any statement prepared in a comparative form will be covered in
comparative statements.
The comparative statement may show:
Absolute figures
Changes in absolute figures
Absolute data in terms of percentages
Increase or decrease in terms of percentages
According to A.F.FOULKE “Comparative financial statements are the statements of
the financial position of a business so designed as to provide time prospective to the
consideration of various elements of financial position embedded in such statements”.
COMPARATIVE BALANCE SHEET
The comparative balance sheet analysis is the study of the trend of the same items, group
of items and computed items in two or more balance sheets of the same business enterprise on
different dates. The changes in periodic balance sheet items reflect the conduct of a business.
The changes can be observed by comparison of the balance sheet at the beginning and at the end
of a period and these changes can help in forming an opinion about the progress of an enterprise.
COMPARATIVE BALANCE SHEET AS AT 31 MARCH 2007

Particular As at 31.03.07 As at 31.03.06
Increase or Decrease
I. SOURCES OF FUNDS
a) share holders funds
i) Share capital 26348000.00 26348000.00 -
ii) Reserve & Surplus 1975833.43 1975899.43 -66.00
iv) Secured loans 1452143.87 12983758.37 11531615.50
v) Unsecured loans 171991927.80 125423083.10 46568844.70
Total 214837267.10 166730740.90 48106526.20
II.APPLICATION OF FUNDS
a) Fixed assets
i) Gross block 114780992.10 121072080.80 -6291088.70
ii) Less: Depreciation reserve 102270108.00 107393977.00 -5123869.00
iii) Net block 12510884.13 13678429.82 -1167545.69
Total 12510884.13 13678109.82 -1167225.69
b) investments 100.00 100.00 -
c) Current assets loan & advance
i)Inventories 36726328.48 26347147.56 10379180.92
ii)Sundry debtors 12004681.15 1492761.47 10511919.68
iii) Cash and bank balance 84868.11 1126782.31 -1041914.20
iv) other current assets 88806313.93 97286913.19 -8480599.26
v) Loans & advances 12724476.38 12415929.67 308546.71
Total 151110482.10 138669534.20 12440947.90
Current liabilities and provision
i)Current liabilities 41085661.70 47586632.52 -6500970.82
ii)Provisions 25397852.00 2205211.00 23192641.00
Total 66483513.70 69638643.52 -3155129.82
Net C.A / liabilities (A-B) 84626968.35 69030892.68 15596075.67
Differed tax assets
Profit loss & Account 117699314.60 84024640.37 33674674.23
Total 214837267.10 166730140.90 48107126.20
COMPARATIVE BALANCE SHEET AS AT 31 MARCH 2008
Particular As at 31.03.08 As at 31.03.07Increase or Decrease

I. SOURCES OF FUNDS
a) share holders funds
i) Share capital 26348000.00 26348000.00 -
ii) Reserve & Surplus 1975899.43 1975833.43 66.00
iii) Secured loans 1756769.78 1452143.87 304625.91
vi) Unsecured loans 21177192.43 171991927.80 150814735.37
Total 241851761.64 214837267.10 27014494.54
II.APPLICATION OF FUNDS
a) Fixed assets
i) Gross block 11468505.60 114780992.10 -103312486.50
ii) Less: Depreciation reserve 103049734.00 102270108.00 779626.00
iii) Net block 11635325.60 12510884.13 - 875558.53
Total 11635325.60 12510884.13 -875558.53
b) investments 100.00 100.00 -
c) Current assets loan & advance
i)Inventories 32573629.16 36726328.48 -4152699.32
ii)Sundry debtors 8177223.59 12004681.15 -3827457.56
iii) Cash and bank balance 493743.83 84868.11 408875.72
iv) other current assets 110338152.63 88806313.93 21531838.70
v) Loans & advances 1040742368.00 12724476.38 1028017891.62
Total 161989791.89 151110482.10 10879309.79
Less
Current liabilities and provision
i)Current liabilities 32714684.79 41085661.70 -8370976.91
ii)Provisions 24129078.00 25397852.00 -1268774.00
Total B 56843702.79 66483513.70 -9639810.91
Net C.A / liabilities (A-B) 105146089.10 84626968.35 20519120.75
Profit loss & Account 125070246.94 - 125070246.94
Balance as per annual account 245665458.81 117699314.60 127966144.21
Total 241851761.64 214837267.10 27014494.54
COMPARATIVE BALANCE SHEET AS AT 31 MARCH 2009
particular As at 31.03.09 As at 31.03.08Increase or Decrease

I. SOURCES OF FUNDS
Head office funds 26348000.00 26348000.00 -
Reserve & surplus 1975899.43 1975899.43 -
Loan & funds
Secured loans 10040596.47 1756769.78 8283826.69
Unsecured loans 145567086.14 211771092.43 -66204006.29
Total 183931582.24 241851761.64 -57920179.40
II.APPLICATION OF FUNDS
a) Fixed assets 115130573.71 11468505.60 103662068.11
i) Less: Depreciation reserve 104077229.20 103049734.00 1027495.20
ii) Capital W.I.P - 11635325.60 -11635325.60
Total 11053344.51 11635325.60 -581981.09
b) investments 100.00 100.00 -
c) Current assets loan & advance
i)Inventories 60161085.84 32573629.16 27587456.68
ii)Sundry debtors 11899360.49 8177223.59 3722136.90
iii) Cash and bank balance 466642.33 493743.83 -27101.50
iv) other current assets 8214737.78 110338152.63 -102123414.85
v) Loans & advances 6503494.35 1040742368.00 -1034238873.65
Total 87245320.79 161989791.89 -74744471.10
Less
Current liabilities and provision
i)Current liabilities 38714577.49 32714684.79 5999892.70
ii)Provisions 29317972.00 24129078.00 5188894.00
Total 68032549.49 56843702.79 11188846.70
Net C.A / liabilities (A-B) 19212771.30 105146089.10 -85933317.80
Profit loss & Account 153665366.23 125070246.94 28595119.29
Balance as per annual account - 245665458.81 -245665458.81
Total 183931582.04 241851761.64 -57920179.60
COMPARATIVE BALANCE SHEET AS AT 31 MARCH 2010
particular As at 31.03.10 As at 31.03.09Increase or Decrease
I. SOURCES OF FUNDS
a) share holders funds
i) Share capital 26348000.00 26348000.00 -
ii) Reserve & Surplus 1975899.43 1975899.43 -
iii) Secured loans 136988.26 10040596.47 -9903608.21
iv) Unsecured loans 200096993.55 145567086.14 54529907.41
Total 228557881.24 183931582.24 44626299
II.APPLICATION OF FUNDS
a) Fixed assets
i) Gross block 136720699.37 115130573.71 21590125.66
ii) Less: Depreciation reserve 103931483.18 104077229.20 -145746.02
iii) Net block 32789216.19 - 32789216.19
iv) Capital W.I.P 44266936.38 - 44266936.38
Total 77056152.57 11053344.51 66002808.06
b) investments 100.00 100.00 -
i)Inventories 3954924.54 60161085.84 -56206161.3
ii)Sundry debtors 7278916.00 11899360.49 -4620444.49
iii) Cash and bank balance 938363.02 466642.33 471720.69
iv) other current assets 8014014.24 8214737.78 -200723.54
v) Loans & advances 2033221.91 6503494.35 -4470272.44
Total 57813761.71 87245320.79 -29431559.08
Current liabilities and provision
i)Current liabilities 71350077.50 38714577.49 32635500.01
ii)Provisions 29765284.05 29317972.00 447312.05
Total 101115361.55 68032549.49 33082812.06
Net C.A / liabilities (A-B) 43301599.84 19212771.30 24088828.54
d) inter sub-office C.A/C 358246.00 - 358246.00
Inter-unit current account 8215908.48 - 8215908.48
Balance as per annual account 186229074.03 153665366.23 32563707.8
Total 228557881.24 183931582.04 44626299.2
COMPARATIVE BALANCE SHEET AS AT 31 MARCH 2011
Particular As at 31.03.11 As at 31.03.10Increase or Decrease
I. SOURCES OF FUNDS
a) share holders funds
i) Share capital 26348000.00 26348000.00-
ii) Reserve & Surplus 1975899.43 1975899.43-
iii) Secured loans 509655.46 136988.26372667.20
iv) Unsecured loans 278130115.00 200096993.5578033121.45
Total 306963670.07 228557881.2478405788.83
II.APPLICATION OF FUNDS
a) Fixed assets
i) Gross block 211113843.97 136720699.3774393144.60
ii) Less: Depreciation reserve 1052111537.18 103931483.18948180054
iii) Net block 105902306.79 32789216.1973113090.60
iv) Capital W.I.P 6815954.23 44266936.38-37450982.15
Total 77056152.57 77056152.57-
b) investments 100.00 100.00-
i)Inventories 25324162.41 3954924.5421369237.87
ii)Sundry debtors 5780936.84 7278916.00-1497979.16
iii) Cash and bank balance 49209.72 938363.02-889153.30
iv) other current assets 8442328.07 8014014.24428313.83
v) Loans & advances 660737.30 2033221.91-1372484.61
Total 40257398.34 57813761.71-17556363.37
Current liabilities and provision
i)Current liabilities 25209924.40 71350077.50-46140153.1
ii)Provisions 31101247.00 29765284.051335962.95
Total 56311171.40 101115361.55-44804190.15
Net C.A / liabilities (A-B) 16053803.06 43301599.84-27247796.78

d) inter sub-office C.A/C - 358246.00 -358246.00
Inter-unit current account 35366346.70 8215908.4827150438.22
Balance as per annual account 245665458.81 186229074.0359436384.78
Total 303963670.07 228557881.2475405788.83
4.1 FINDINGS
The position of gross profit ratio of the company is decreased only in first year but it
shows an increasing trend for the remaining 4 years and it shows the company is in good
level.
The position of net Capital ratio shows five years shows decreasing trend
The current assets and current liabilities are increasing year by year.
In the debt equity ratio it can be noted that the actual debt equity ratio is below than
standards level
Cash position of the company is changing its value year to year.
The company’s balance sheet amount was fluctuated (increase or decrease) in fixed asset
to current assets. So the firm’s liabilities are increased compare the year to year.
The company’s stock turnover ratio level was increasing year to year. So stock level was
increasing 2006 - 2011.
The fixed assets turnover ratio is in increasing trend starting from 35.90 in 2009 - 2010,
to decrease of 16.09 in 2010-2011.
The average current payment ratio is shows that decreasing trend on 2006-07 to 2009-10.
The year of 2010-11 is slightly decreasing trend.

4.2 SUGGESTION / RECOMMENDATIONS
The company’s net profit should increase in forthcoming financial
The current ratio is satisfactory. So the company should maintain this level in future.
The company can also improve its services by acquiring updated techniques and ideas.
The company should refocus on their goals. The employees and management should
focus more on achieving the goal.
Everything necessary should be done for them to achieve their goal. Goals are very
important since this leads the company to a better status.
Proper inventory management.
Modern inventory management system should be introduced in the organization. Through
this we can avoid wastages
Speed up collection period.
The company can speed up the collection period. Through this company has able to get
debtor balance immediately and it will improve the financial position.
Company can improve the inter unit relationship. This helps the company at the time of
shortage of raw material and shortage of finance.

4.3 CONCLUSION
The Salem milk producer’s co-operative union ltd. Salem this company undertaken by
government of Tamilnadu and ministry of milk development department. It is not a profit
oriented company. Aavin is only service based company because this plant’s is owned by
government. So due to this the company is facing lot of problems which are difficult to handle
and the researcher has given some solutions for solving its financial.
In any concern, aavin cooperatives milk (Salem) face a lot of problems. Nowadays milk
dairy in Salem running on a loss. The present study is to measure the financial performance of
aavin cooperatives milk dairy (Salem).
This study covers the period of five years, in these years company running on a Loss .But
from 2007 to 2008 it shows a decreasing trend and loss is reduced from 2007 to 2011. This
indicates the improvement in financial performance.
But in 2010 financial position is very weak, in that year loss is maximum. But in this year
huge amount of assets purchased so it will help the company in coming years to reduce the loss
and increase the sales.
Due to assets expansion in 2010 company may overcome the loss in forth coming years.
But joint efforts of employee-management are very essential to improve the financial position.
BOOKS AND WEBSITES
1. Balu.V.Dr.& Sakthivel Murugan.M.Dr., Management accounting,
2. Srivenkateswara publications, Chennai, 2001.
3. James C.Van Horne & Hohn M. Wachowicz, Jr., fundamentals of Financials management, prentice-hall of India private limited, New Delhi, 1997.
4. Khan.M.Y., Jain.P.I, Financial management, Tata McGraw-hill publishing company ltd, New Delhi, 1999.
5. Kuchhal.S.C. Financial management, chaitanya publishing house, Allahabad, 2001.
6. Mahaswari.S.N. Financial Management Sultan & Sons Publication, New Delhi, 2004.
7. Maheswari.S.N.Dr., Sultan hand & sons, financial statement analysis, New Delhi, 1994.
8. Pandy I.M., Financial management Vikas publishing house private ltd, 1989.
9. Prasanna Chandra, Financial management, Himalaya publishing house, New Delhi, 2000.
10. Sasi K. Gupta and Sharma, Financial Management, Kalyani publisher, 2000.
11. Shiva Kumar.M. & Prakash...M., Guidelines on project report, Himalayan publishing house, Delhi, 2002


SALEM DISTRICT CO-OPERATIVE MILK PRODUCERS UNION LIMITED BALANCE SHEET AS ON 31 MARCH 2007
Particular Schedule No As at 31.03.07 As at 31.03.06I. SOURCES OF FUNDSa) share holders fundsi) Share capital 1 26348000.00 26348000.00iii) Reserve & Surplus 2 1975833.43 1975899.43V) Secured loans 3 1452143.87 12983758.37vi) Unsecured loans 4 171991927.80 125423083.10Total 214837267.10 166730740.90II.APPLICATION OF FUNDSa) Fixed assets 5i) Gross block 114780992.10 121072080.80ii) Less: Depreciation reserve 102270108.00 107393977.00iii) Net block 12510884.13 13678429.82iV) Capital W.I.PTotal 12510884.13 13678109.82b) investments 6 100.00 100.00c) Current assets loan & advancei)Inventories 7 36726328.48 26347147.56ii)Sundry debtors 8 12004681.15 1492761.47iii) Cash and bank balance 9 84868.11 1126782.31iv) other current assets 10 88806313.93 97286913.19v) Loans & advances 11 12724476.38 12415929.67Total 151110482.10 138669534.20Current liabilities and provisioni)Current liabilities 12 41085661.70 47586632.52ii)Provisions 13 25397852.00 2205211.00Total 66483513.70 69638643.52Net C.A / liabilities (A-B) 84626968.35 69030892.68
Deferred tax assetsProfit loss & Account 117699314.60 84024640.37
Total 214837267.10 166730140.90SALEM DISTRICT CO-OPERATIVE MILK PRODUCERS UNION
LIMITED BALANCE SHEET AS ON 31 MARCH 2008Particular Schedule No As at 31.03.08 As at 31.03.07I. SOURCES OF FUNDSa) share holders fundsi) Share capital 1 26348000.00 26348000.00iii) Reserve & Surplus 2 1975899.43 1975833.43V) Secured loans 3 1756769.78 1452143.87vi) Unsecured loans 4 21177192.43 171991927.80Total 241851761.64 214837267.10II.APPLICATION OF FUNDSa) Fixed assets 5i) Gross block 11468505.60 114780992.10ii) Less: Depreciation reserve 103049734.00 102270108.00iii) Net block 11635325.60 12510884.13Total 11635325.60 12510884.13b) investments 6 100.00 100.00c) Current assets loan & advancei)Inventories 7 32573629.16 36726328.48ii)Sundry debtors 8 8177223.59 12004681.15iii) Cash and bank balance 9 493743.83 84868.11iv) other current assets 10 110338152.63 88806313.93v) Loans & advances 11 1040742368 12724476.38Total 161989791.89 151110482.10LessCurrent liabilities and provisioni)Current liabilities 12 32714684.79 41085661.70ii)Provisions 13 24129078.00 25397852Total B 56843702.79 66483513.70Net C.A / liabilities (A-B) 105146089.10 84626968.35Profit loss & Account 125070246.94 -
Balance as per annual account 245665458.81 117699314.60Total 241851761.64 214837267.10
SALEM DISTRICT CO-OPERATIVE MILK PRODUCERS UNION LIMITED BALANCE SHEET AS ON 31 MARCH 2009
Particular Schedule No As at 31.03.09 As at 31.03.08I. SOURCES OF FUNDSHead office funds 1 26348000.00 26348000.00Reserve & surplus 2 1975899.43 1975899.43Loan & fundsSecured loans 3 10040596.47 1756769.78Unsecured loans 4 145567086.14 211771092.43Total 183931582.24 241851761.64II.APPLICATION OF FUNDSa) Fixed assets 5 115130573.71 11468505.60i) Less: Depreciation reserve 104077229.20 103049734.00ii) Capital W.I.P - 11635325.60Total 11053344.51 11635325.60b) investments 6 100.00 100.00c) Current assets loan & advancei)Inventories 7 60161085.84 32573629.16ii)Sundry debtors 8 11899360.49 8177223.59iii) Cash and bank balance 9 466642.33 493743.83iv) other current assets 10 8214737.78 110338152.63v) Loans & advances 11 6503494.35 1040742368.00Total 87245320.79 161989791.89LessCurrent liabilities and provisioni)Current liabilities 12 38714577.49 32714684.79ii)Provisions 13 29317972.00 24129078.00Total 68032549.49 56843702.79Net C.A / liabilities (A-B) 19212771.30 105146089.10Profit loss & Account 153665366.23 125070246.94Balance as per annual account - 245665458.81Total 183931582.04 241851761.64

SALEM DISTRICT CO-OPERATIVE MILK PRODUCERS UNION LIMITED BALANCE SHEET AS ON 31 MARCH 2010
Particular Schedule No As at 31.03.10 As at 31.03.09I. SOURCES OF FUNDSa) share holders fundsi) Share capital 1 26348000.00 26348000.00iii) Reserve & Surplus 2 1975899.43 1975899.43i) Secured loans 3 136988.26 10040596.47ii) Unsecured loans 4 200096993.55 145567086.14Total 228557881.24 183931582.24II.APPLICATION OF FUNDSa) Fixed assets 5i) Gross block 136720699.37 115130573.71ii) Less: Depreciation reserve 103931483.18 104077229.20iii) Net block 32789216.19 -iV) Capital W.I.P 44266936.38 -Total 77056152.57 11053344.51b) investments 6 100.00 100.00i)Inventories 7 3954924.54 60161085.84ii)Sundry debtors 8 7278916.00 11899360.49iii) Cash and bank balance 9 938363.02 466642.33iv) other current assets 10 8014014.24 8214737.78v) Loans & advances 11 2033221.91 6503494.35Total 57813761.71 87245320.79Current liabilities and provisioni)Current liabilities 12 71350077.50 38714577.49ii)Provisions 13 29765284.05 29317972.00Total 101115361.55 68032549.49Net C.A / liabilities (A-B) 43301599.84 19212771.30d) inter sub-office C.A/C 14 358246.00 -Inter-unit current account 14A 8215908.48 -Balance as per annual account 186229074.03 153665366.23Total 228557881.24 183931582.04

SALEM DISTRICT CO-OPERATIVE MILK PRODUCERS UNION LIMITED BALANCE SHEET AS ON 31 MARCH 2011
Particular Schedule No As at 31.03.11 As at 31.03.10I. SOURCES OF FUNDSa) share holders fundsi) Share capital 1 26348000.00 26348000.00iii) Reserve & Surplus 2 1975899.43 1975899.43i) Secured loans 3 509655.46 136988.26ii) Unsecured loans 4 278130115.00 200096993.55Total 306963670.07 228557881.24II.APPLICATION OF FUNDSa) Fixed assets 5i) Gross block 211113843.97 136720699.37ii) Less: Depreciation reserve 1052111537.18 103931483.18iii) Net block 105902306.79 32789216.19iv) Capital W.I.P 6815954.23 44266936.38Total 77056152.57 77056152.57b) investments 6 100.00 100.00i)Inventories 7 25324162.41 3954924.54ii)Sundry debtors 8 5780936.84 7278916.00iii) Cash and bank balance 9 49209.72 938363.02iv) other current assets 10 8442328.07 8014014.24v) Loans & advances 11 660737.30 2033221.91Total 40257398.34 57813761.71Current liabilities and provisioni)Current liabilities 12 25209924.40 71350077.50ii)Provisions 13 31101247.00 29765284.05Total 56311171.40 101115361.55Net C.A / liabilities (A-B) 16053803.06 43301599.84 inter sub-office C.A/C 14 - 358246.00Inter-unit current account 14A 35366346.70 8215908.48Balance as per annual account 245665458.81 186229074.03Total 303963670.07 228557881.24


