Supporting information for the manuscript The plastidial ... · AT1G09795 2,03E+05 8,41E+06 4...
14
Supporting information for the manuscript “The plastidial Arabidopsis thaliana NFU1 binds and delivers [4Fe-4S] clusters to specific client proteins” Mélanie Roland 1 , Jonathan Przybyla-Toscano 1† , Florence Vignols 2† , Nathalie Berger 2† , Tamanna Azam 3 , Loick Christ 1 , Véronique Santoni 2 , Hui-Chen Wu 2,a , Tiphaine Dhalleine 1 , Michael K. Johnson 3 , Christian Dubos 2 , Jérémy Couturier 1 , Nicolas Rouhier 1 Figure S1. Comparison of the UV-visible absorption and CD and resonance Raman spectra of A. thaliana NFU1 and NFU2. (A) UV-visible absorption and CD spectra of reconstituted [4Fe-4S] cluster-bound NFU1 (black lines) and NFU2 (red lines). The and values for the UV-visible absorption and CD spectra, respectively, are based on NFU1 and NFU2 monomer concentrations. (B) Resonance Raman spectra for NFU1 (black line) and NFU2 (red line) recorded using a droplet of protein (~2 mM in clusters) frozen at 17 K, using 457.9 nm laser excitation. Each spectrum is the sum of 100 scans with each scan involving counting protons for 1 s every 0.5 cm 1 , with 7 cm 1 spectral resolution. Bands due to the frozen buffer solution have been subtracted. Figure S2. Validation of the plastidial targeting of gNFU1-GFP and CTPNFU3-GFP fusion proteins in Arabidopsis leaf protoplasts. Constructs expressing gNFU1-GFP and CTPNFU3-GFP fusion proteins under the control of NFU1 and 35S promoters, respectively, were transfected in leaf protoplasts and analyzed for GFP fluorescence 24h post-transfection. Overlap of GFP fluorescence recorded between 500- 550 nm with the autofluorescence of the chlorophyll recorded between 680-720 nm validated the plastidial targeting of both proteins. Images were acquired at high resolution using an argon (488 nm) laser with intensities representative of two independent transfection assays. Scale bars correspond to 10 μm. Image acquisition parameters were similar to that used for BiFC experiments and are indicated below the confocal microscopy data. Figure S3. Summary of acquisition parameters used for BiFC experiments. Image resolution selected for image scanning and acquisition parameters are show for all BiFC assays performed in the study. All observations were performed using a HC-PL-APO-CS2 40x/1.10 Water objective. Figure S4. BiFC assays between Arabidopsis NFU1 and its putative interactors in Arabidopsis leaf protoplasts, continued. Additional panels showing positive BiFC assays described in Figure 4 (see corresponding legend) together with the absence of YFP fluorescence in BiFC assays involving co- transfections of either -N or -C fusions proteins with empty vectors as negative controls. None of the protein tested was able to restore YFP fluorescence when expressed alone without protein partner. Scale bar: 10 μm. Figure S5. Comparison of the UV-visible absorption spectrum of holo-ISPG (A) and - THIC (B) after in vitro reconstitution or Fe-S cluster transfer from NFU1. UV-visible absorption spectra of apo- (grey line) and enzymatically-reconstituted holo-ISPG or THIC (dark line) are compared with those obtained (red line) for the same proteins after a Fe-S cluster transfer from NFU1. The values are based on NFU1, THIC and ISPG monomer concentrations.
Transcript of Supporting information for the manuscript The plastidial ... · AT1G09795 2,03E+05 8,41E+06 4...

Supporting information for the manuscript
“The plastidial Arabidopsis thaliana NFU1 binds and delivers [4Fe-4S] clusters to specific
client proteins”
Mélanie Roland1, Jonathan Przybyla-Toscano1†, Florence Vignols2†, Nathalie Berger2†,
Tamanna Azam3, Loick Christ1, Véronique Santoni2, Hui-Chen Wu2,a, Tiphaine
Dhalleine1, Michael K. Johnson3, Christian Dubos2, Jérémy Couturier1, Nicolas
Rouhier1
Figure S1. Comparison of the UV-visible absorption and CD and resonance Raman
spectra of A. thaliana NFU1 and NFU2. (A) UV-visible absorption and CD spectra of
reconstituted [4Fe-4S] cluster-bound NFU1 (black lines) and NFU2 (red lines). The and
values for the UV-visible absorption and CD spectra, respectively, are based on NFU1 and
NFU2 monomer concentrations. (B) Resonance Raman spectra for NFU1 (black line) and
NFU2 (red line) recorded using a droplet of protein (~2 mM in clusters) frozen at 17 K, using
457.9 nm laser excitation. Each spectrum is the sum of 100 scans with each scan involving
counting protons for 1 s every 0.5 cm1, with 7 cm1 spectral resolution. Bands due to the frozen
buffer solution have been subtracted.
Figure S2. Validation of the plastidial targeting of gNFU1-GFP and CTPNFU3-GFP fusion
proteins in Arabidopsis leaf protoplasts.
Constructs expressing gNFU1-GFP and CTPNFU3-GFP fusion proteins under the control of
NFU1 and 35S promoters, respectively, were transfected in leaf protoplasts and analyzed for
GFP fluorescence 24h post-transfection. Overlap of GFP fluorescence recorded between 500-
550 nm with the autofluorescence of the chlorophyll recorded between 680-720 nm validated
the plastidial targeting of both proteins. Images were acquired at high resolution using an argon
(488 nm) laser with intensities representative of two independent transfection assays. Scale bars
correspond to 10 µm. Image acquisition parameters were similar to that used for BiFC
experiments and are indicated below the confocal microscopy data.
Figure S3. Summary of acquisition parameters used for BiFC experiments.
Image resolution selected for image scanning and acquisition parameters are show for all BiFC
assays performed in the study. All observations were performed using a HC-PL-APO-CS2
40x/1.10 Water objective.
Figure S4. BiFC assays between Arabidopsis NFU1 and its putative interactors in
Arabidopsis leaf protoplasts, continued.
Additional panels showing positive BiFC assays described in Figure 4 (see corresponding
legend) together with the absence of YFP fluorescence in BiFC assays involving co-
transfections of either -N or -C fusions proteins with empty vectors as negative controls. None
of the protein tested was able to restore YFP fluorescence when expressed alone without protein
partner. Scale bar: 10 μm.
Figure S5. Comparison of the UV-visible absorption spectrum of holo-ISPG (A) and -
THIC (B) after in vitro reconstitution or Fe-S cluster transfer from NFU1.
UV-visible absorption spectra of apo- (grey line) and enzymatically-reconstituted holo-ISPG
or THIC (dark line) are compared with those obtained (red line) for the same proteins after a
Fe-S cluster transfer from NFU1. The values are based on NFU1, THIC and ISPG monomer
concentrations.

Supplemental Figure S1

Supplemental Figure S2
GFP Chlorophyll Bright fieldMerged Overlay
Pro35S::CTPNFU3-GFP(Laser: 1%)
ProNFU1::gNFU1-GFP(Laser: 10%)
Pro35S::CTPNFU3-GFP
ProNFU1::gNFU1-GFP

Supplemental Figure S3
Empty-C / NFU1-N
NFU1-C / Empty-N
NFU1-C / NFU1-N
Empty-C / THIC-N
NFU1-C / SUFE3-N
NFU1-C / THIC-N
Empty-C / SUFE3-N
NFU1-C / SUFA1-N
Empty-C / cLIP-N
Empty-C / SUFA1-N
NFU1-C / cLIP-N
NFU1-C / ISPG-N
Empty-C / ISPG-N

NFU1-C / Empty-N(Laser: 3%)
NFU1-C / NFU1-N(Laser: 3%)
Empty-C / NFU1-N(Laser: 3%)
A YFP Chlorophyll Bright fieldMerged Overlay
YFP Chlorophyll Bright fieldMerged OverlayB YFP
NFU1-C / THIC-N(Laser: 2%)
Empty-C / THIC-N(Laser: 2%)
NFU1-C / ISPG-N(Laser: 2%)
Empty-C / ISPG-N(Laser: 2%)
Supplemental Figure S4

YFP Chlorophyll Bright fieldMerged Overlay
Empty-C / cLIP-N(Laser:12%)
NFU1-C / cLIP-N(Laser: 12%)
Supplemental Figure S4 continued
Empty-C / SUFE3-N(Laser: 10%)
NFU1-C / SUFA1-N(Laser: 8%)
Empty-C / SUFA1-N(Laser: 8%)
NFU1-C / SUFE3-N(Laser: 10%)

0
10
20
30
40
50
60
70
80
260 360 460 560
ε(m
M-1
.cm
-1)
Wavelength (nm)
Apo-ISPG
Holo-ISPG
ISPG aftertransfer
0
20
40
60
80
100
120
260 360 460 560
ε (m
M-1
cm-1
)
Wavelength (nm)
Apo-THIC
Holo-THIC
THIC aftertransfer
A B
Supplemental Figure S5

Gene IDs
moy_intensity
Pro35S::CTP NFU3-
GFP
moy_intensity
ProNFU1::gNFU1-
GFP
Number of
peptidesSymbol Protein name Function Localization Fe-S cluster type Sequence
coverage [%]
AT5G50210 0,00 1,87E+07 8 SUFE3 quinolinate synthase SUFE3 NAD synthesis plastid 4Fe-4S 17.3
AT1G62180 0,00 1,09E+07 7 APR2 5’adenylyl-phosphosulfate reductase 2 sulfate assimilation plastid 4Fe-4S 30
AT2G29630 7,80E+04 1,05E+07 5 THIC thiamin C biosynthesis thiamine biosynthesis plastid 4Fe-4S 11.3
AT2G41220 1,17E+05 1,10E+06 8 GLU2 glutamate synthase 2 nitrogen assimilation plastid 3Fe-4S 6.4
AT2G38270 8,86E+04 2,64E+06 2 GRXS16 glutaredoxin S16 Fe-S cluster assembly machinery plastid 2Fe-2S, 4Fe-4S 16.7
AT3G24430 1,61E+05 1,83E+07 9 HCF101 high-chlorophyll fluorescence 101 Fe-S cluster assembly machinery plastid 4Fe-4S 27.3
AT2G43100 0,00 6,92E+06 6 IPMI2 isopropylmalate isomerase 2 glucosinolate and leucine biosynthesis plastid none 29.3
AT3G58990 0,00 5,76E+06 4 IPMI1 isopropylmalate isomerase 1 glucosinolate and leucine biosynthesis plastid none 23.3
AT2G43090 1,54E+05 1,18E+07 8 IPMI3 isopropylmalate isomerase 3 glucosinolate and leucine biosynthesis plastid none 42.6
AT5G10920 0,00 1,64E+06 2 none argininosuccinate lyase amino acid biosynthesis (arginine) plastid none 6.6
AT4G01900 1,99E+05 9,41E+06 6 GLB1 nitrogen regulatory protein P-II homolog amino acid biosynthesis (arginine) plastid none 39.3
AT1G58080 0,00 8,08E+06 3 ATP-PRT1 ATP phosphoribosyl transferase 1 amino acid biosynthesis (histidine) plastid none 12.9
AT1G09795 2,03E+05 8,41E+06 4 ATP-PRT2 ATP phosphoribosyl transferase 2 amino acid biosynthesis (histidine) plastid none 13.6
AT5G14060 8,63E+04 9,41E+06 7 AK2 aspartokinase 2 amino acid biosynthesis (lysine and threonine) plastid none 15.1
AT3G59890 6,06E+04 2,41E+06 2 DAPB2 dihydrodipicolinate reductase 2 amino acid biosynthesis (lysine) plastid none 5.8
AT4G33680 7,21E+04 2,85E+06 5 DAP L-diaminopimelate aminotransferase amino acid biosynthesis (lysine) plastid none 16.1
AT1G08250 4,35E+04 4,89E+06 5 ADT6 arogenate dehydratase 6 amino acid biosynthesis (phenylalanine) plastid none 19.9
AT5G05590 0,00 1,40E+06 3 PAI2 phosphoribosylanthranilate isomerase 2 amino acid biosynthesis (tryptophan) plastid none 18.2
AT5G17990 1,05E+05 7,36E+06 5 PAT1 phosphoribosylanthranilate transferase 1 amino acid biosynthesis (tryptophan) plastid none 14.4
AT1G15710 2,41E+05 9,03E+06 3 TyrAAT2 arogenate dehydrogenase 2 amino acid biosynthesis (tyrosine) plastid none 10.9
AT3G25660 1,57E+05 3,14E+06 4 GATA glutamyl-tRNA(Gln) amidotransferase subunit A amino acid metabolism (glu and gln) plastid, mitochondrion none 11.4
AT4G33510 1,46E+05 4,71E+06 5 DHS2 3-deoxy-d-arabino-heptulosonate 7-phosphate synthase aromatic amino acid biosynthesis plastid none 11
AT5G52100 1,79E+05 7,02E+06 3 CRR1 chlororespiratory reduction 1 biogenesis/stabilization of the NDH complex plastid none 13.4
AT5G64380 9,81E+04 1,48E+06 2 FBPase2 fructose biphosphatase like protein 2 Calvin-Benson cycle plastid none 6.9
AT4G14210 0,00 7,17E+06 3 PDS3 phytoene desaturase 3 carotenoid biosynthesis plastid none 6.4
AT3G04870 3,97E+04 2,16E+06 3 ZDS zeta-carotene desaturase carotenoid biosynthesis plastid none 6.6
AT4G19170 2,26E+04 4,06E+05 3 NCED4 nine-cis-epoxycarotenoid dioxygenase 4 carotenoid catabolism plastid none 6.2
AT5G59370 0,00 2,63E+07 6 ACT4 actin4 cellular architecture cytosol none 17
AT1G36390 1,66E+05 3,00E+06 2 CGE2 chloroplast GrpE chaperone plastid none 7.2
AT1G80030 1,03E+05 5,48E+06 4 DJA7 DNA J protein A7 chaperone plastid none 11
AT2G22360 3,11E+04 1,68E+06 6 DJA6 DNA J protein A6 chaperone plastid none 20.1
AT3G04550 2,03E+05 9,27E+06 6 RAF1 rubisco accumulation factor 1 chaperone plastid none 19.6
AT5G55220 1,99E+05 3,14E+07 15 TIG1 trigger factor-like protein chaperone plastid none 33.6
AT4G18480 1,07E+06 8,08E+07 19 CHLI1 magnesium-chelatase l subunit 1 chlorophyll biosynthesis plastid none 50.2
AT4G16390 0,00 1,14E+07 9 SVR7 suppressor of variegation 7 chloroplast biogenesis plastid none 15.7
AT1G69200 0,00 1,54E+06 2 FLN2 fructokinase-like 2 chloroplast organization plastid none 4.9
AT2G24020 3,49E+05 2,02E+07 8 STIC2 suppressor of TIC40 chloroplast protein import plastid none 57.2
AT4G01800 2,36E+05 2,56E+07 15 SECA1 protein translocase subunit chloroplast Sec translocation machinery plastid none 20.1
AT1G48860 7,05E+04 1,16E+07 16 EPSPS 5-enolpyruvylshikimate-3-phosphate synthase chorismate biosynthesis plastid none 36.5
AT5G66120 1,14E+05 2,77E+06 5 unknown 3-dehydroquinate synthase chorismate biosynthesis plastid none 17.2
AT2G21385 2,46E+04 7,00E+06 6 CGLD11 conserved in the green lineage and diatoms 11 cpATPase biogenesis plastid none 22.2
AT1G79050 0,00 5,65E+06 6 RECA1 homolog of bacterial RecA DNA metabolism plastid none 19.6
AT1G14410 5,98E+04 3,17E+06 4 WHY1 whirly 1 DNA metabolism plastid none 22.4
AT1G32440 3,55E+05 5,37E+06 6 PKP3 plastidial pyruvate kinase 3 fatty acid biosynthesis plastid none 13.5
AT2G43710 0,00 1,19E+06 5 SSI2 suppressor of SA insensitive 2 fatty acid desaturation plastid none 18.7
AT5G51820 1,10E+05 1,98E+06 2 PGMP phosphoglucomutase glucose isomerisation plastid none 6.4
AT4G15560 0,00 1,44E+06 2 DXS 1-deoxy-D-xylulose 5-phosphate synthase isoprenoid biosynthesis plastid none 5.9
AT5G62790 3,16E+05 1,21E+07 6 DXR 1-deoxy-D-xylulose 5-phosphate reductoisomerase isoprenoid biosynthesis plastid none 18.7
AT2G26930 1,58E+05 8,05E+06 3 ISPE/CMK 4-diphosphocytidyl-2-C-methyl-D-erythritol kinase isoprenoid biosynthesis plastid none 9.7
AT4G21210 0,00 8,84E+06 5 RP1 PPDK regulatory protein 1 kinase activity plastid none 16.1
AT1G66430 6,12E+04 3,75E+06 4 FRK6 fructokinase 6 kinase activity plastid none 10.4
AT1G74030 4,22E+05 1,12E+07 5 ENO1 enolase 1 monosaccharide metabolism plastid none 16.1
AT3G02360 1,18E+04 4,15E+06 3 PGD2 6-phosphogluconate dehydrogenase 2 monosaccharide metabolism peroxisome none 8.4
AT2G21660 9,34E+05 4,60E+06 3 GRP7 glycine-rich RNA-binding protein 7 mRNA processing nucleus none 26.7
AT1G51100 2,74E+04 5,07E+06 3 CRR41 chlororespiratory reduction 41 NDH subcomplex A assembly plastid none 16.1
AT1G11790 1,61E+05 8,27E+06 4 ADT1 arogenate dehydratase 1 phenylalanine biosynthesis plastid none 19.6
AT5G13120 1,45E+05 4,18E+06 3 PNSl5 photosynthetic NDH subcomplex L 5 photosynthesis, chlororespiration plastid none 17.6
AT3G55250 6,83E+04 3,23E+06 4 PSA3 Photosystem I assembly factor 3 Photosystem I assembly plastid none 18.4
AT1G70070 0,00 1,65E+06 3 ISE2 increased size exclusion limit 2 plasmodesmata formation plastid, cytosol, nucleus none 4
AT2G21280 0,00 4,09E+06 2 GC1 giant chloroplast 1 plastid division plastid none 7.8
AT5G24020 0,00 1,54E+06 2 ARC11 accumulation and replication of chloroplasts 11 plastid division plastid none 7.1
AT4G13670 0,00 3,57E+07 10 PTAC5 plastid transcriptionally active 5 plastid gene expression plastid none 39.5
AT2G02740 2,03E+04 4,88E+06 4 PTAC11 plastid transcriptionally active 11 plastid gene expression plastid none 20.2
AT4G20130 3,62E+04 2,02E+06 4 PTAC14 plastid transcriptionally active 14 plastid gene expression plastid none 12.6
AT1G80480 0,00 1,49E+07 7 PTAC17 plastid transcriptionally active 17 plastid gene expression plastid none 26.1
AT3G12080 7,05E+04 5,85E+06 5 EMB2738 GTP-binding family protein plastid gene expression plastid none 9.4
AT5G13630 0,00 7,04E+06 5 GUN5 genomes uncoupled 5 plastid-to-nucleus signal transduction plastid none 6.1
AT3G56290 4,01E+04 2,83E+06 2 none potassium transporter potassium transporter plastid none 12.7
AT1G02560 0,00 1,96E+07 4 CLPP5 nuclear encoded CLP protease 5 protease plastid none 15.4
AT1G53280 1,59E+05 4,57E+06 3 DJ1B class I glutamine amidotransferase-like superfamily protein protease plastid none 14.6
AT2G47940 5,47E+04 6,50E+06 5 DEGP2 degradation of periplasmic proteins 2 protease plastid none 14

AT5G51070 5,89E+04 3,47E+06 4 ERD1 early responsive to dehydration 1 protease plastid none 4
ATCG00670 7,77E+04 9,61E+06 2 CLPP1 caseinolytic protease P 1 protease plastid none 21.4
AT3G20330 5,57E+05 3,35E+06 3 PYRB pyrimidine B pyrimidine ribonucleotide biosynthesis plastid none 9.5
AT3G17810 9,16E+04 5,30E+06 3 PYD1 dihydropyrimidine dehydrogenase pyrimidine ribonucleotide degradation plastid none 10.6
AT4G20960 0,00 3,19E+06 4 PYRD pyrimidine deaminase riboflavin biosynthesis plastid none 16
ATCG00810 0,00 3,44E+06 2 RPL22 ribosomal protein L22 ribosomal protein plastid none 17.5
AT1G78630 0,00 9,60E+06 2 emb1473 embryo defective 1473 ribosomal protein plastid, cyto, mito none 13.3
AT3G49010 3,98E+05 2,53E+06 2 RPL13B 60S ribosomal protein L13-1 ribosomal protein cytosol none 17.2
ATCG00160 1,97E+05 9,79E+06 2 RPS2 ribosomal protein S2 ribosomal protein plastid none 10.2
ATCG00790 7,24E+04 3,21E+06 2 RPL16 ribosomal protein L16 ribosomal protein plastid none 21.5
AT3G12930 0,00 4,72E+06 2 DG238 delayed greening 238 ribosome availability plastid none 10.9
AT3G62910 0,00 2,19E+06 3 CPRF1 chloroplast ribosome release factor 1 ribosome availability plastid none 10.4
ATCG00180 0,00 1,48E+06 2 RPOC1 RNA polymerase beta' subunit-1 RNA polymerase plastid none 3.8
ATCG00190 0,00 2,78E+06 3 RPOB RNA polymerase subunit β RNA polymerase plastid none 3.8
ATCG00740 0,00 2,87E+06 3 RPOA RNA polymerase subunit α RNA polymerase plastid none 10.9
AT1G06190 1,73E+05 4,96E+06 4 RHON1 Rho termination factor RNA processing plastid, nucleus none 21.9
AT3G23700 1,32E+05 7,03E+06 4 SRRP1 S1 RNA-binding ribosomal protein 1 RNA processing plastid none 14.3
AT3G48110 4,89E+04 4,92E+06 5 EDD1 glycine-tRNA ligase RNA processing plastid none 6.3
AT5G13030 0,00 5,78E+06 7 SELO selenoprotein O ROS regulation plastid none 12
AT1G12800 2,76E+04 7,00E+06 7 SDP S1 domain containing RBP rRNA processing plastid none 13.3
AT5G51110 1,24E+05 1,95E+07 7 RAF2 rubisco assembly factor 2 rubisco assembly plastid none 58.5
AT1G32900 0,00 5,81E+06 8 GBSS1 granule bound starch synthase 1 starch biosynthesis plastid none 19.7
AT5G24300 0,00 7,06E+06 5 SS1 starch synthase 1 starch biosynthesis plastid none 10.1
AT4G18240 1,27E+05 4,79E+06 2 SSA starch synthase 4 starch biosynthesis plastid none 2.5
AT3G01180 1,73E+05 8,24E+06 6 SS2 starch synthase 2 starch biosynthesis plastid none 10.7
AT3G52180 1,38E+05 8,12E+06 5 SEX4 starch excess 4 starch degradation plastid none 12.9
AT5G26570 9,30E+04 8,27E+06 7 PWD phosphoglucan water dikinase starch degradation plastid none 9.5
AT5G43780 0,00 2,67E+06 7 ATPS4 ATP sulfurylase 4 sulfate assimilation plastid none 19
AT2G14750 5,59E+04 5,44E+06 4 APK1 adenosine-5'-phosphosulfate kinase sulfate assimilation plastid none 18.8
AT3G21200 0,00 2,47E+06 2 PGR7 proton gradient regulation 7 tetrapyrrole biosynthesis plastid none 11.4
AT5G08280 2,93E+05 1,61E+07 8 HEMC hydroxymethylbilane synthase tetrapyrrole biosynthesis plastid none 20.4
AT3G56940 2,25E+05 3,58E+06 4 CRD1 magnesium-protoporphyrin IX monomethyl ester cyclase tetrapyrrole biosynthesis plastid none 12.5
AT4G25080 7,51E+05 5,04E+06 3 CHLM magnesium-protoporphyrin IX methyltransferase tetrapyrrole biosynthesis plastid none 13.9
AT1G22940 0,00 5,07E+05 2 TH1 thiamine requiring 1 thiamine biosynthesis plastid none 5
AT3G06730 0,00 2,07E+06 2 TRXZ thioredoxin Z thioredoxin plastid none 15.8
AT4G29670 0,00 4,71E+06 2 ACHT2 atypical cys his rich thioredoxin 2/TRX-lilium2 thioredoxin plastid none 16.6
AT5G65840 0,00 6,78E+06 4 none none thioredoxin plastid none 14.9
AT2G41680 2,39E+05 1,30E+07 8 NTRC NADPH-dependent thioredoxin reductase C thioredoxin plastid none 26.3
AT2G42220 0,00 8,84E+06 5 STR9 sulfurtransferase 9 thiosulfate metabolism plastid none 26.1
AT3G08920 0,00 3,14E+06 3 STR10 sulfurtransferase 10 thiosulfate metabolism mitochondrion none 17.8
AT5G19370 0,00 1,46E+07 9 STR12 sulfurtransferase 12 thiosulfate metabolism plastid none 37.8
AT4G27700 0,00 8,26E+06 4 STR14 sulfurtransferase 14 thiosulfate metabolism plastid none 24.1
AT1G03160 0,00 1,58E+06 3 FZL FZO-like thylakoid organization plastid none 4.8
AT2G45770 2,26E+05 8,47E+06 4 CPFTSY cell division protein FtsY homolog thylakoid organization plastid none 17.5
AT1G17220 2,17E+05 7,07E+06 8 FUG1 translation initiation factor 2 translation initiation plastid none 11.8
AT3G63190 3,46E+05 4,89E+06 4 RRF ribosome recycling factor translation process plastid, cytosol none 19.3
AT5G08650 4,83E+04 5,62E+06 5 none translation factor GUF1 homolog translation process plastid none 9.4
AT4G33760 0,00 3,88E+06 4 OKI okina kuki tRNA synthesis plastid, cyto, mito none 8.9
AT1G07780 9,11E+04 9,15E+06 3 PAI1 phosphoribosylanthranilate isomerase 1 tryptophan biosynthesis plastid none 23.5
AT1G23180 0,00 1,97E+06 3 none ARM repeat superfamily protein unknown plastid, nucleus none 6.6
AT3G62530 0,00 7,67E+06 4 none ARM repeat superfamily protein unknown plastid, mitochondrion none 23.5
AT2G13440 0,00 1,59E+06 2 none glucose-inhibited division family A protein unknown plastid, mitochondrion none 4.8
AT5G07190 0,00 5,14E+06 3 ATS3 seed gene 3 unknown extracellular none 27.6
AT1G02150 6,96E+04 1,13E+07 6 TPR tetratricopeptide repeat-like superfamily protein unknown plastid none 13.9
AT1G52510 1,21E+05 1,52E+07 6 none alpha/beta-hydrolases superfamily protein unknown plastid none 27.8
AT1G70820 1,07E+05 3,99E+06 4 none phosphoglucomutase unknown plastid none 9.1
AT1G73060 7,84E+04 8,32E+06 6 LPA3 low PSII accumulation 3 unknown plastid none 31
AT2G27680 1,36E+05 5,58E+06 4 none NAD(P)-linked oxidoreductase superfamily protein unknown plastid none 13.8
AT2G35410 3,90E+05 1,42E+07 5 none RNA-binding family protein unknown plastid, nucleus none 25
AT3G08840 3,77E+04 2,63E+06 2 none D-alanine ligase family unknown plastid none 4.4
AT3G10350 4,60E+04 8,26E+06 4 GET3b P-loop containing NTP hydrolases superfamily protein unknown plastid none 15.1
AT3G44100 4,83E+04 3,79E+06 2 none MD-2-related lipid recognition domain-containing protein unknown extracellular none 21.1
AT3G44620 8,36E+04 1,12E+07 3 none protein tyrosine phosphatases unknown plastid none 10.5
AT4G25450 6,00E+04 2,19E+06 2 NAP8 non-intrinsic ABC protein 8 unknown plastid none 8.3
AT4G28030 3,29E+04 8,56E+05 2 none acyl-CoA N-acyltransferases superfamily protein unknown plastid none 10.3
AT5G17670 7,78E+04 5,06E+06 4 none alpha/beta-hydrolases superfamily protein unknown plastid none 23.6
AT5G27560 4,46E+04 1,80E+06 2 none DUF1995 containing protein unknown plastid none 8.5
Table S1. Potential NFU1 partners obtained with co-immunoprecipitation experiments and their assigned or presumed function. Proteins were considered as interactors if they were identified in coIP experiments in at least 3 replicates using
ProNFU1::gNFU1-GFP lines and either not identified in the 4 replicates using Pro35S::CTPNFU3-GFP lines (a value of 0 is thus found in the column 2 (Pro35S::CTPNFU3-GFP) for 49 candidates) or identified in only one replicate using Pro35S::CTPNFU3-
GFP lines (a value is indicated in the column 2 (Pro35S::CTPNFU3-GFP) for 89 candidates).
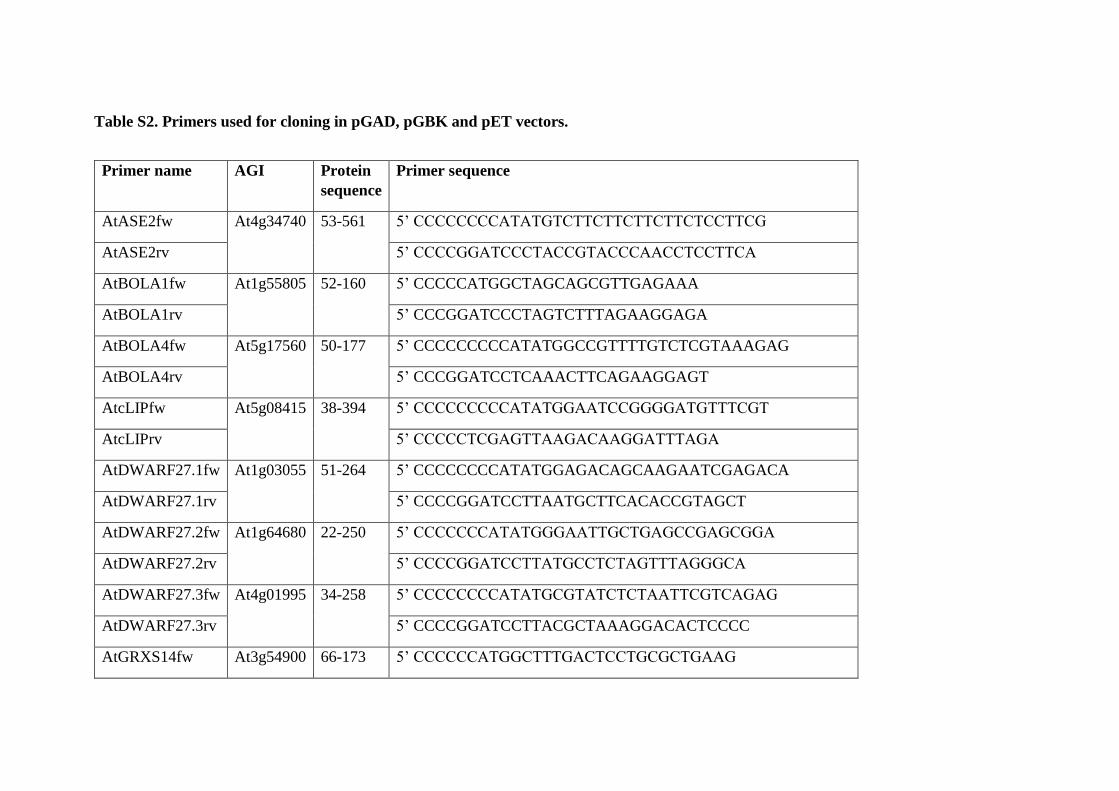
Table S2. Primers used for cloning in pGAD, pGBK and pET vectors.
Primer name AGI Protein
sequence
Primer sequence
AtASE2fw At4g34740 53-561 5’ CCCCCCCCATATGTCTTCTTCTTCTTCTCCTTCG
AtASE2rv 5’ CCCCGGATCCCTACCGTACCCAACCTCCTTCA
AtBOLA1fw At1g55805 52-160 5’ CCCCCATGGCTAGCAGCGTTGAGAAA
AtBOLA1rv 5’ CCCGGATCCCTAGTCTTTAGAAGGAGA
AtBOLA4fw At5g17560 50-177 5’ CCCCCCCCCATATGGCCGTTTTGTCTCGTAAAGAG
AtBOLA4rv 5’ CCCGGATCCTCAAACTTCAGAAGGAGT
AtcLIPfw At5g08415 38-394 5’ CCCCCCCCCATATGGAATCCGGGGATGTTTCGT
AtcLIPrv 5’ CCCCCTCGAGTTAAGACAAGGATTTAGA
AtDWARF27.1fw At1g03055 51-264 5’ CCCCCCCCATATGGAGACAGCAAGAATCGAGACA
AtDWARF27.1rv 5’ CCCCGGATCCTTAATGCTTCACACCGTAGCT
AtDWARF27.2fw At1g64680 22-250 5’ CCCCCCCATATGGGAATTGCTGAGCCGAGCGGA
AtDWARF27.2rv 5’ CCCCGGATCCTTATGCCTCTAGTTTAGGGCA
AtDWARF27.3fw At4g01995 34-258 5’ CCCCCCCCATATGCGTATCTCTAATTCGTCAGAG
AtDWARF27.3rv 5’ CCCCGGATCCTTACGCTAAAGGACACTCCCC
AtGRXS14fw At3g54900 66-173 5’ CCCCCCATGGCTTTGACTCCTGCGCTGAAG

AtGRXS14rv 5’ CCCCGGATCCTCAAGAGCACATTGCCTT
AtGRXS16fw At2g38270 63-293 5’ CCCCCCATGGCTTCCGCCGTCAAATCTCTAACG
AtGRXS16rv 5’ CCCCGGATCCTTATTTTTTGAAGTGACCGGCGAG
AtHCARfw At1g04620 30-462 5’ CCCCCCGGTCTCCCATGAATCTAGAGCCAAAAAAGAAGG
AtHCARrv 5’ CCCCGGATCCTCATTTCTTGGAGAGCATTTT
AtHCF101fw At3g24430 65-532 5’ CCCCCCCCATATGGCTCAAGCTAGTAGTAGTGTT
AtHCF101rv 5’ CCCCCCGAATTCCTAGACTTCGACTGGAGA
AtIBA57.2fw At1g60990 61-432 5’ CCCCCCATGGCTTCTTCCGATTCGTTG
AtIBA57.2rv 5’ CCCCCCGGATCCTCAAGAACTCGAGTTGGC
AtIPMIfw At4g13430 49-509 5’ CCCCCCCCATATGGCTCCTCAAAAGGATCGG
AtIPMIrv 5’ CCCCGAATTCTTACTGCAAGAACTCCCTTGG
AtISPGfw At5g60600 50-741 5’CCCCCCGGTCTCCCATGTCAAACCAAGGCTCTGATTTA
AtISPGrv 5’ CCCCGGATCCTTACTCATCAGCCACGGGCGGGTC
AtISPGrv2 5’ CCCCCTCGAGCTCATCAGCCACGGGCGGGTC
AtISPHfw At4g34350 40-466 5’ CCCCCCGGTCTCCCATGTCGTCTGGCGATGAGAACGCT
AtISPHrv 5’ CCCCGGATCCTTAAGCCAGCTGCAATAACTCT
AtMiaBfw At4g36390 87-640 5’ CCCCCCATGGCTAGTTCCGGTAAGTTT
AtMiaBrv 5’ CCCCCCGAATTCTTAACTTGCACAAGACGC
AtNFU1fw At4g01940 73-231 5’ CCCCCCCCCATATGGTATCTTCAGGTTTATATTCA

AtNFU1rv 5’ CCCCGGATCCCTAGCTTGTAAAGGTTACATT
AtNFU2fw At5g49940 73-235 5’ CCCCCCATGGCTGTAGCAACCCCAGACCCC
AtNFU2rv 5’ CCCCGGATCCCTATATAAGTTGAACAGC
AtNFU3fw At4g25910 72-236 5’ CCCCCCCCCATATGCGAACAGTATTTGGTCACGTG
AtNFU3rv 5’ CCCCGGATCCTCACTCAAGAAGCTGGACTGC
AtNiRfw At2g15620 28-586 5’ CCCCCCCCATATGGCCGCTCAGACCACAGCTCCG
AtNiRrv 5’ CCCCGGATCCTTAATCTTCATTCTCTTCTC
AtSiRfw At5g04590 63-642 5’ CCCCCCCCATATGGTCTCCACTCCTGCGAAGCCT
AtSiRrv 5’ CCCCCCGGTCTCGGATCCTTATTGAGAAACTCCTTTGTA
AtSUFA1fw At1g10500 54-180 5’ CCCCCCATGGCTGTTCGATCCGCTTCGGTT
AtSUFA1rv 5’ CCCCGGATCCTCACATCTCGGCAGCAAA
AtSUFBfw At4g04770 53-557 5’ CCCCCCCCCATATGGCTGATGTTGGAATCGATTCTCGT
AtSUFBrv 5’ CCCCGGATCCTTAACCCACTGATCCTTC
AtSUFCfw At3g10670 73-338 5’ CCCCCCCCCATATGGCTGTCGATTCGGATTCG
AtSUFCrv 5’ CCCCCTCGAGCTAACCGGATATCGCTTTGTA
AtSUFDfw At1g32500 37-475 5’ CCCCCCCCCATATGGCTCAAGCTTCGTTCTCTGAC
AtSUFDrv 5’ CCCCCTCGAGTCAGAGCAAGCCTTTGACGTG
AtTHICfw At2g29630 55-644 5’ CCCCCCCCATATGACTTTGACGTTTGATCCA
AtTHICrv 5’ CCCCCTCGAGTTATTTCTGAGCAGCTTTGAC

Table S3. Primers used for cloning in pUC-SPYCE/SPYNE vectors.
Primer
name
AGI Protein
sequence
Primer sequence
AtcLIPfw At5g08415 1-394 5’ CCCCTCTAGAATGATGCATCATTGCTCAAT
AtcLIPrv 5’ CCCCCTCGAGAGACAAGGATTTAGA
AtISPGfw At5g60600 1-741 5’ CCCCTCTAGAATGGCGACTGGAGTATTGCCA
AtISPGrv 5’ CCCCCTCGAGCTCATCAGCCACGGGCGGGTC
AtNFU1fw At4g01940 1-231 5’ CCCCGGATCCATGATGGCTTCTCTCGCG
AtNFU1rv 5’ CCCCCTCGAGGCTTGTAAAGGTTACATT
AtSUFA1fw At1g10500 1-180 5’ CCCCTCTAGAATGGCTTTCGCTACTGGAATC
AtSUFA1rv 5’ CCCCCTCGAGCATCTCGGCAGCAAAAGAC
AtSUFE3fw At5g50210 1-718 5’ CCCCTCTAGAATGGCGTTAGCTCTCTCC
AtSUFE3rv 5’ CCCCCTCGAGTCTCTTGCTCTCACA
AtTHICfw At2g29630 1-644 5’ CCCCCGTCTCTCTAGAATGGCTGCTTCAGTACACTGT
AtTHICrv 5’ CCCCCTCGAGTTTCTGAGCAGCTTTGACATA

Table S4. Titration of Fe and acid-labile sulfide on ISPG and THIC after Fe-S cluster transfer from NFU1.
The results are means (± SD) of 3 to 6 replicates from at least 2 independent Fe-S cluster transfer experiments. Considering the expected values of
4 for a single [4Fe-4S] cluster per ISPG or THIC monomer, we deduced an Fe-S cluster transfer efficiency from holo-NFU1 to acceptor proteins
of ⁓50% for ISPG and 75% for THIC after one hour.
Acceptor
proteins
mole of Fe and acid-labile S
per mole of protein monomer
Fe-S cluster
transfer efficiency
ISPG 2.34 ± 1.16 (Fe)
1.91 ± 0.81(S)
⁓ 50%
THIC 2.92 ± 0.59 (Fe)
3.34 ± 0.12 (S)
⁓ 75%