Supporting Information. Electrochemical probing of ... Information. Electrochemical probing of...
18
S1 Supporting Information. Electrochemical probing of hydrogelation induced by the self-assembly of a donor-acceptor complex comprising pyranine and viologen Sougata Datta, a,b,c Nilanjan Dey, a and Santanu Bhattacharya *a,b a Department of Organic Chemistry, Indian Institute of Science, Bangalore 560 012, India. b Director’s Research Unit (DRU), Indian Association for the Cultivation of Science, Jadavpur, Kolkata 700 032, India. c Present Address: Department of Chemistry, University of Utah, 315 South 1400 East, RM 2020, Salt Lake City, Utah 84112, USA. E-mail: [email protected] Table of Contents Page no. (a) Physical measurements and instrumentation S2-S3 (b) Materials and reagents S3 (c) Scheme S1. The synthetic route to individual component S4 (d) Synthesis S4 (e) Figure S1-S6. 1 H-NMR and 13 C-NMR spectra S6-S10 (f) Figure S7. SEM image S11 (g) Figure S8. AFM image S11 (h) Figure S9. UV-Vis spectra S12 (i) Figure S10. Fluoresence spectra S12 (j) Figure S11. Rheology experiment S13 (k) Figure S12. Cyclic Voltammetry S13 (l) Figure S13. Fluoresence titration S14 (m) Figure S14. Selectivity of S 2 O 4 2- S15 (n) Figure S15. Cyclic Voltammetry S16 (o) Table S1. Electrochemistry data S17 (p) Table S2. Calculation of diffusion coefficients S17 (q) References S18 Electronic Supplementary Material (ESI) for ChemComm. This journal is © The Royal Society of Chemistry 2017
Transcript of Supporting Information. Electrochemical probing of ... Information. Electrochemical probing of...
S1
Supporting Information.
Electrochemical probing of hydrogelation induced by the self-assembly of a
donor-acceptor complex comprising pyranine and viologen
Sougata Datta,a,b,c Nilanjan Dey,a and Santanu Bhattacharya*a,b aDepartment of Organic Chemistry, Indian Institute of Science, Bangalore 560 012, India. bDirector’s Research Unit (DRU), Indian Association for the Cultivation of Science, Jadavpur, Kolkata 700 032, India. cPresent Address: Department of Chemistry, University of Utah, 315 South 1400 East, RM 2020, Salt Lake City, Utah 84112, USA.
E-mail: [email protected]
Table of Contents Page no.
(a) Physical measurements and instrumentation S2-S3
(b) Materials and reagents S3
(c) Scheme S1. The synthetic route to individual component S4
(d) Synthesis S4
(e) Figure S1-S6. 1H-NMR and
13C-NMR spectra S6-S10
(f) Figure S7. SEM image S11
(g) Figure S8. AFM image S11
(h) Figure S9. UV-Vis spectra S12
(i) Figure S10. Fluoresence spectra S12
(j) Figure S11. Rheology experiment S13
(k) Figure S12. Cyclic Voltammetry S13
(l) Figure S13. Fluoresence titration S14
(m) Figure S14. Selectivity of S2O42-
S15
(n) Figure S15. Cyclic Voltammetry S16
(o) Table S1. Electrochemistry data S17
(p) Table S2. Calculation of diffusion coefficients S17
(q) References S18
Electronic Supplementary Material (ESI) for ChemComm.This journal is © The Royal Society of Chemistry 2017
S2
(a) Physical Measurements and Instrumentation. Milli-Q grade water was used for all
physical measurements.
Gelation Studies. In a typical two component gelation test, a stock aqueous solution of desired
concentration of Py3-
was prepared. Different aliquots of this stock solution were diluted with
Milli-Q water to get Py3-
solution of required concentration into each of which was added a
weighed amount of acceptor (P+-16, CH3-V
2+-12 and CH3-V
2+- CH3). Then, the suspension was
bath sonicated in Transsonic T460/H at 60-70 ºC for 15 min to get a practically homogeneous
solution. The clear suspension was incubated at room temperature for 15 min to check the
stability of the gel using inverse flow method. Each experiment was performed in duplicate. If a
gel was formed, it was evaluated quantitatively by determining the minimum gelator
concentration (MGC) which has been defined as the minimum amount of hydrogelator required
to immobilize 1 mL water.
Scanning Electron Microscopy (SEM). 20 µL of each representative sample was carefully was
transferred onto brass stub. The sample was freeze-dried, then coated with 10-nm thick gold
films using a BAL-TEC SSD-500 sputter coater instrument. Finally, the morphology of the
sample was imaged on a FEI-Quanta 200 SEM operated at 25 kV.
Atomic Force Microscopy (AFM). AFM image the hydrogel was obtained by using Bruker
Dimension ICON with ScanAsyst instrument. The hydrogel was heated to form sol and 50 μL of
each representative sol was drop casted on freshly cleaved mica and air dried at room
temperature. Each of the samples was analyzed using Veeco Innova instrument (made in
Germany).
UV-Vis, Fluorescence and Raman Spectroscopy. The UV-Vis and fluoresence spectra of
aqueous solutions were recorded on a Shimadzu model 2100 spectrophotometer and Hitachi F-
4500 spectrofluorimeter respectively. The Raman spectra were recorded on a Raman
spectrometer (Renishaw inVia model). The 785 nm laser diode of 300 mW was used as an
excitation source.

S3
Electrochemical Measurement. The cyclic voltammetry experiments were carried out in
CH608C, CH instrument with a conventional three-electrode cell (solution volume of 5 mL).
Teflon stopper (provided with holes for insertion of the electrodes) was used as cover to exclude
atmospheric oxygen. The working electrode was a glassy carbon electrode with a geometrical
area of 0.09 cm2 and mounted in Teflon. The electrode was polished before each experiment
with 3 and 0.3 μm alumina pastes followed by extensive rinsing with ultrapure Milli-Q water.
Platinum wire was used as the counter electrode and saturated calomel electrode, SCE, as
reference electrode. 0.1 M LiCl solution in Milli-Q water was used as supporting electrolyte and
was routinely deoxygenated by argon bubbling. All potential values are given versus the calomel
saturated electrode SCE. Cyclic voltammetry experiments were conducted within the potential
range of -0.2 to -1.2 V at a scan rate of 0.1 V s-1
.
Rheological Studies. For rheological measurement of the samples, an Anton Paar 100 rheometer
using a cone and plate geometry (CP 25-2) with an adjustable peltier temperature controlling
system was used. All the measurements were done fixing the gap distance between the cone and
the plate at 0.05 mm. The gels were scooped on the plate of the rheometer. An oscillatory stress
amplitude sweep experiment was performed at a constant oscillation frequency of 1 Hz for the
applied stress range 0.01-150 Pa at 20 °C. The software US-200 converted the torque
measurements into either G’ (the storage modulus) and G” (the loss modulus) and represent G’
and G” with either strain or shear stress.
(b) Materials and Reagents. 4,4’-Bipyridine, 1-bromododecane, methyl iodide and cetyl
pyridinium bromide were bought from Aldrich. 8-Hydroxy-1,3,6-pyrene-trisulphonic acid
trisodium salt was procured from Eastman Kodak company, USA. All other chemicals, solvents
and silica gel for TLC and column chromatography were obtained from the well-known
commercial sources and were used without further purification, as appropriate. Solvents were
distilled and dried by standard procedure before use. 1H-NMR and
13C-NMR spectra were
recorded in Bruker-400 Avance NMR spectrometer at 400 and 100 MHz respectively.

S4
(c) Scheme S1.
(i) n-C12H25Br, CH3CN, reflux, 18 h, yield = 62%; (ii) CH3I, CH3CN, reflux, 24 h, yield = 78%;
(iii) CH3I, CH3CN, reflux, 24 h, yield = 68%.
(d) Synthesis. Compounds 1, 2 and 3 were synthesized according to scheme S1 as reported
previously.1-4
N N N N C12H25
+
Br_
N N C12H25
+
Br_
+I
_
(i)
(iii)
(3)
CH3-V2+-12 (2)
(ii)
N N++
I
_
CH3-V2+-CH3 (1)
I
_

S5
Figure S1. 1H-NMR spectrum of compound 1 in D2O.
S6
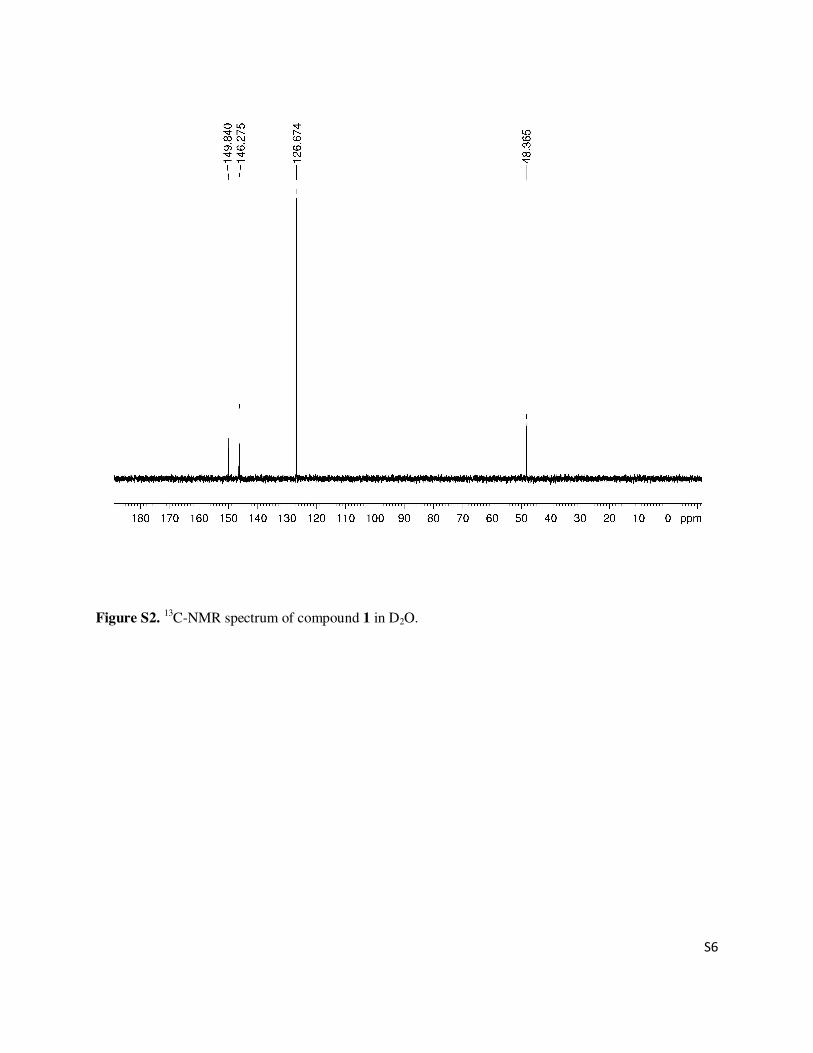
Figure S2. 13
C-NMR spectrum of compound 1 in D2O.
S7
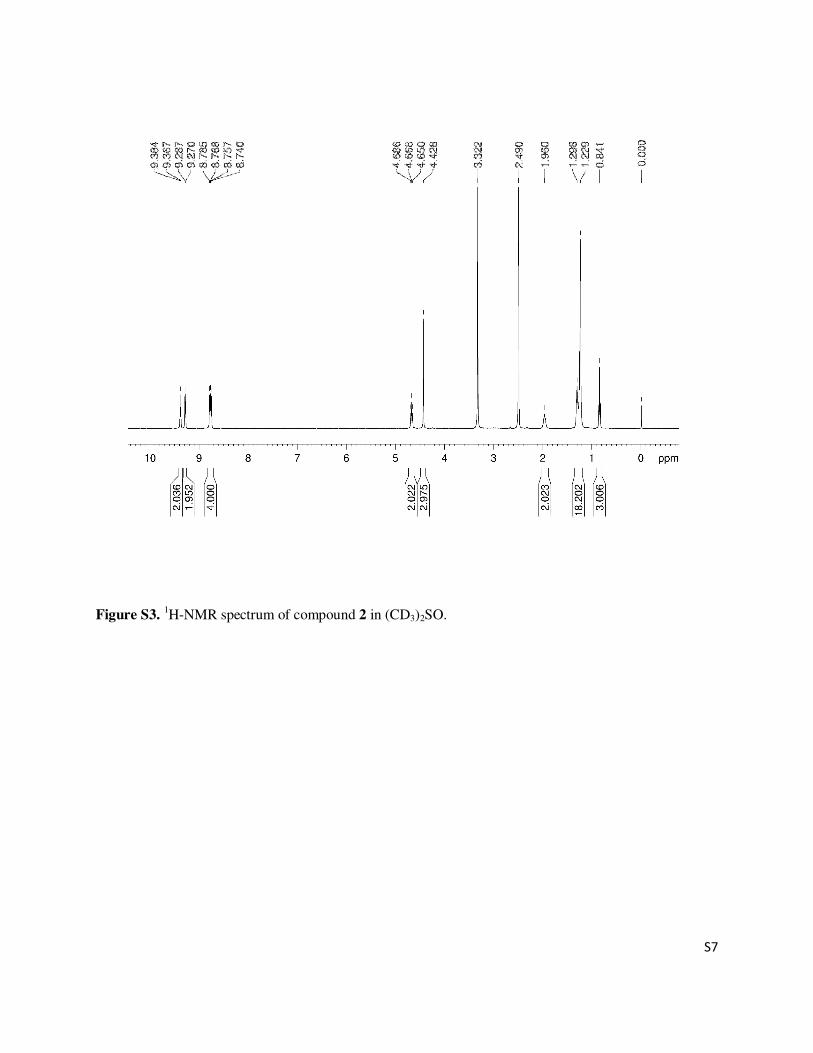
Figure S3. 1H-NMR spectrum of compound 2 in (CD3)2SO.

S8
Figure S4. 13
C-NMR spectrum of compound 2 in (CD3)2SO.

S9
Figure S5. 1H-NMR spectrum of compound 3 in CDCl3.
S10
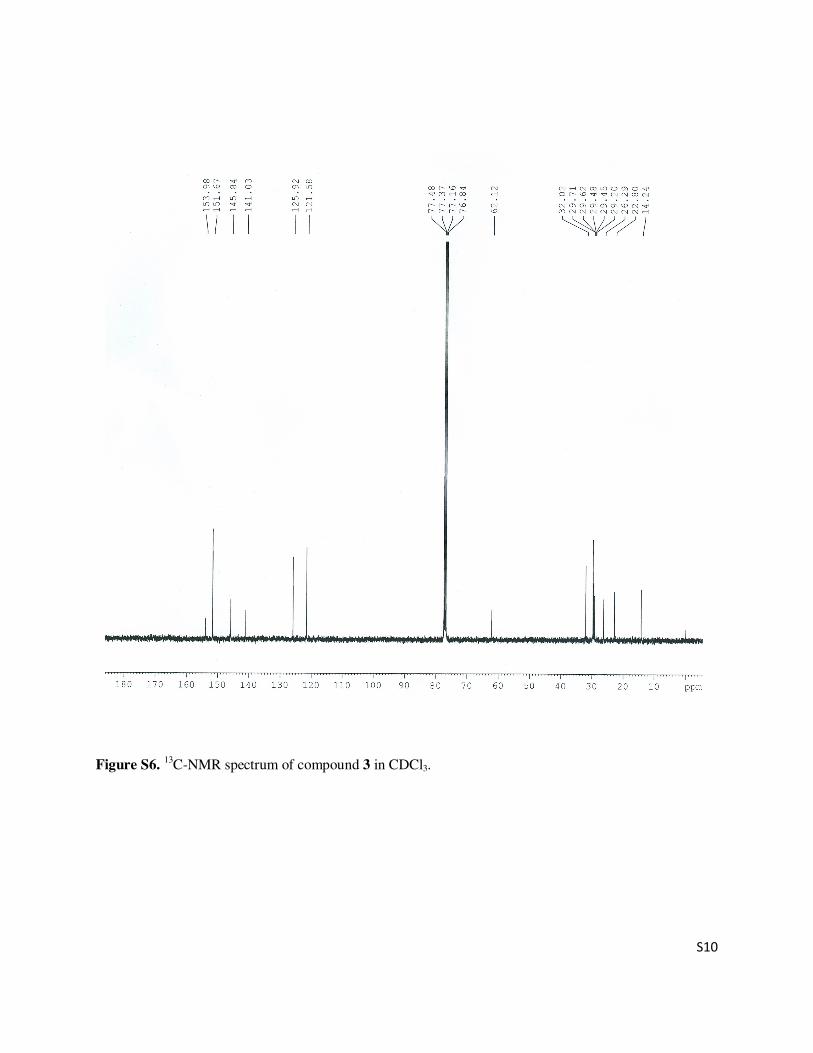
Figure S6. 13
C-NMR spectrum of compound 3 in CDCl3.
S11
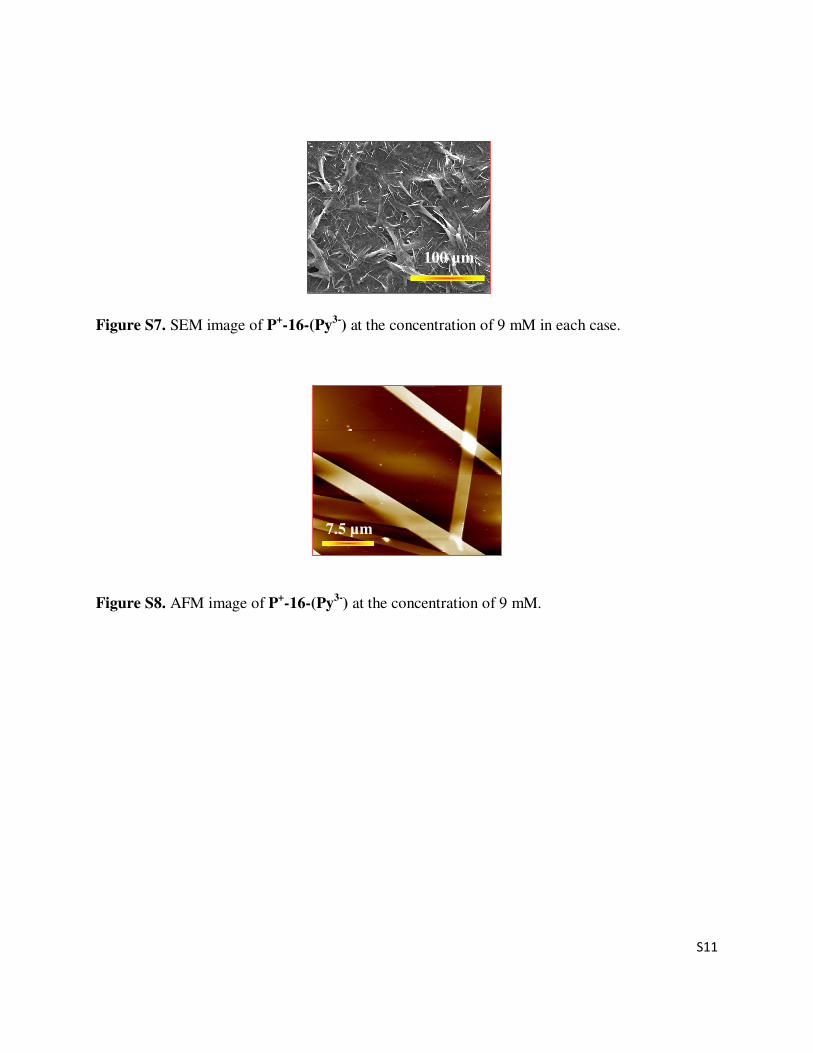
Figure S7. SEM image of P+-16-(Py
3-) at the concentration of 9 mM in each case.
Figure S8. AFM image of P+-16-(Py
3-) at the concentration of 9 mM.
7.5 µm
100 µm

S12
Figure S9. (a) UV-Vis spectra of aq. solutions of CH3-V2+
-12, Py3-
and CH3-V2+
-12-(Py3-
) at
the concentration of 0.05 mM in each case; Inset shows magnification for clarity. Photographs of
aq. solution of (b) CH3-V2+
-12, (c) Py3-
and (d) CH3-V2+
-12-(Py3-
) are shown in the right.
Figure S10. (a) Stoichiometry-dependent changes in the emission spectra of aq. solutions of
(CH3-V2+
-12)n-Py3-
[n = 0, 0.5 and 1]; Concentration of Py3-
is 0.05 mM in each case;
Photographs of aq. solution of (b) Py3-
and (CH3-V2+
-12)n-Py3-
[n = (c) 0.5 and (d) 1] under long
UV-light (365 nm) are shown in the right.
(b) (c) (d
)
200 250 300 350 400 450 500 5500.0
0.5
1.0
1.5
2.0
Ab
sorb
an
ce
Wavelength (nm)
CH3-V
2+-12
Py3-
CH3-V
2+-12-(Py
3-)
(a)
450 475 500 5250.000
0.025
0.050
0.075
Ab
sorb
an
ce
Wavelength (nm)
(d) (c) (b)
450 500 550 600 6500
100
200
300
400
Flu
ore
sen
ce I
nte
nsi
ty (
a.u
.)
Wavelength (nm)
(CH3-V2+-12)1-Py3-
(CH3-V2+-12)0.5-Py3-
Py3-
(a)
S13
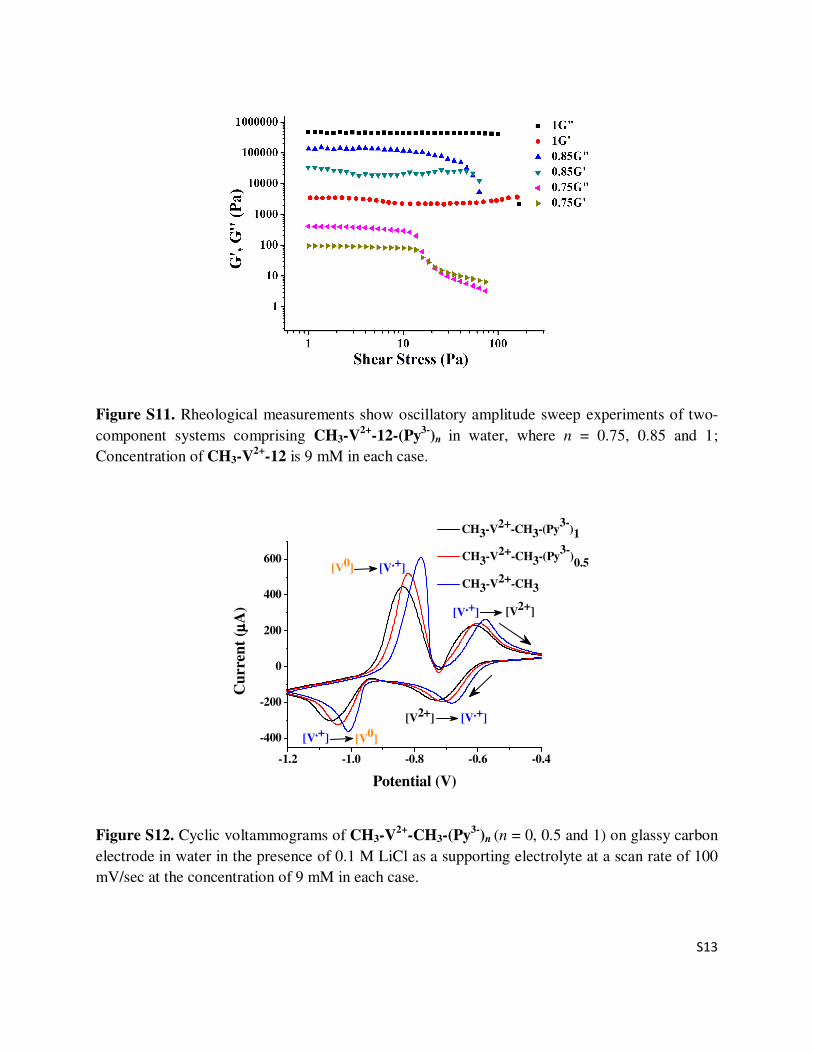
Figure S11. Rheological measurements show oscillatory amplitude sweep experiments of two-
component systems comprising CH3-V2+
-12-(Py3-
)n in water, where n = 0.75, 0.85 and 1;
Concentration of CH3-V2+
-12 is 9 mM in each case.
Figure S12. Cyclic voltammograms of CH3-V2+
-CH3-(Py3-
)n (n = 0, 0.5 and 1) on glassy carbon
electrode in water in the presence of 0.1 M LiCl as a supporting electrolyte at a scan rate of 100
mV/sec at the concentration of 9 mM in each case.
-1.2 -1.0 -0.8 -0.6 -0.4
-400
-200
0
200
400
600
[V2+][V.+]
[V.+][V0]
[V0][V.+]
[V.+][V2+]
Cu
rre
nt
( µµ µµA
)
Potential (V)
CH3-V2+-CH3-(Py3-
)1
CH3-V2+-CH3-(Py3-
)0.5
CH3-V2+-CH3

S14
Figure S13. (a) Photographs and (b) emission spectra of Py3-
, CH3-V2+
-12-(Py3-
) and CH3-V2+
-
12-(Py3-
) + 1 equiv. S2O42-
; (c) Changes in the emission spectra of CH3-V2+
-12-(Py3-
) upon
gradual addition of S2O42-
; concentration is 9 mM in each case.
450 500 550 600 6500.0
0.2
0.4
0.6
0.8
1.0
Flu
ore
sen
ce I
nte
nsi
ty (
a. u
.)
Wavelength (nm)
Py3-
CH3-V2+
-12-(Py3-
)
CH3-V2+-12-(Py3-
) + 1 equiv. S2O42-
(b)
450 500 550 600 6500.0
0.2
0.4
0.6
0.8
1.0
Flu
ore
sen
ce I
nte
nsi
ty (
a. u
.)
Wavelength (nm)
CH3-V2+
-12-(Py3-
)
+ S2O42-
0.08 equiv.
+0.16
+0.24
+0.32
+0.40
+0.48
+0.56
+0.64
+0.72
+0.80
+0.88
+0.96
+1.04
+1.12
+1.2 equiv.
(c)
(a)
Py3-
CH3-V2+
-12-(Py3-
)
CH3-V2+
-12-(Py3-
) + 1 equiv. S2O42-

S15
Figure S14. (a) Images showing the changes in the fluoresence emission of CH3-V2+
-12-(Py3-
)
under 365 nm UV lamp upon addition of different anions (1 equiv.); (b) fluoresence spectra and
(c) changes in the emission intensity at 511 nm of CH3-V2+
-12-(Py3-
) upon addition of 1 equiv.
of different anions; concentration is 9 mM in each case.
450 500 550 600 6500.0
0.2
0.4
0.6
0.8
1.0 CH3-V
2+-12-(Py
3-)
+AcO- 1 equiv.
+Br-
+Cl-
+CN-
+F-
+H2PO
4
-
+S2O
4
2-
+I-
+N3
-
+NO2
-
+S2-
+HPO4
2-
+SCN-
+SO4
2-
Flu
ore
sen
ce I
nte
nsi
ty (
a.
u.)
Wavelength (nm)
(b)
)3-
-12-
(Py
2+
-V3
CH
-
+ AcO
-
+ Br
-
+ Cl
-
+ CN
-
+ F-4
PO2
+ H
2-
4O2
+ S
-
+ I-3
+ N-2
+ NO
2-
+ S2-
4
+ HPO
-
+ SC
N2-
+ SO
4
0.0
0.2
0.4
0.6
0.8
1.0
Anions added (1 equiv.)
Norm
ali
zed
F.
I. a
t 5
11
nm
(c)
CT-Complex + F- + Cl
- + Br
- + I
- + AcO
- + CN
- + N3
-
+ H2PO4- + HPO4
- + SCN
- + S2O4
2- + SO4
2- + S2
2- + NO2
- + NO3
-
(a)

S16
Figure S15. Changes in the cyclic voltammograms of CH3-V2+
-12-(Py3-
) on glassy carbon
electrode in water upon addition of 1 equiv. of different anions in the presence of 0.1 M LiCl as a
supporting electrolyte at a scan rate of 100 mV/sec at the concentration of 9 mM in each case.
S17
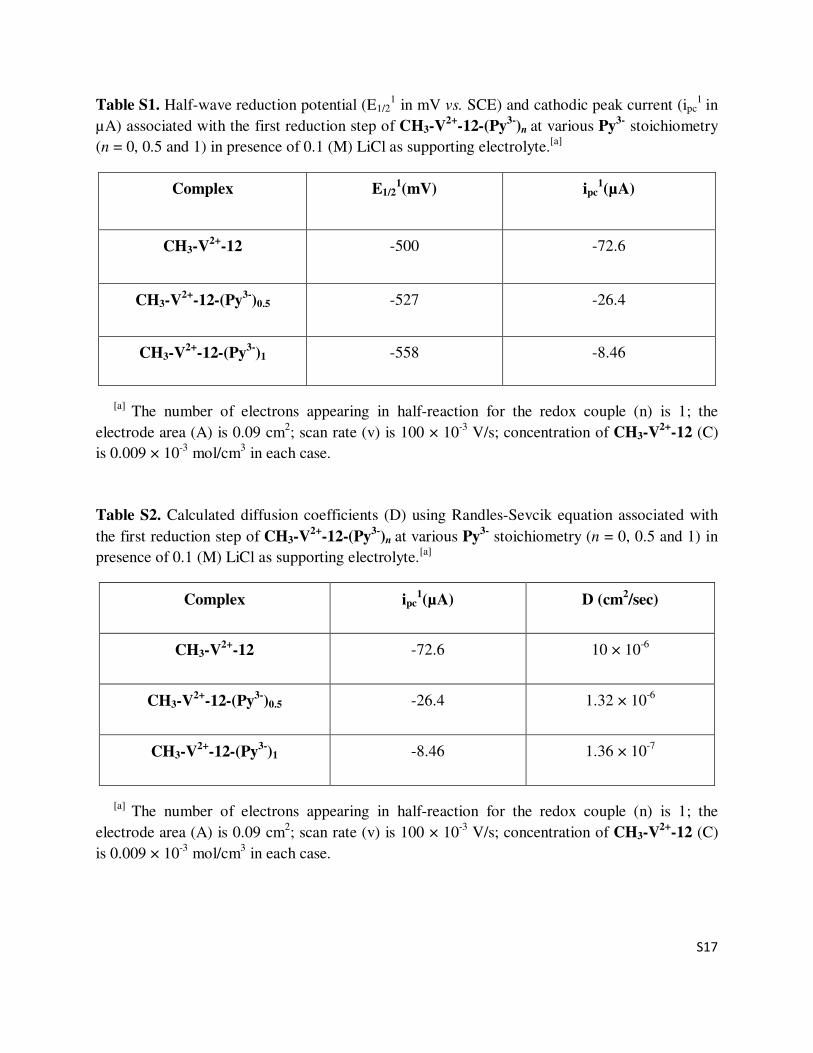
Table S1. Half-wave reduction potential (E1/21 in mV vs. SCE) and cathodic peak current (ipc
1 in
µA) associated with the first reduction step of CH3-V2+
-12-(Py3-
)n at various Py3-
stoichiometry
(n = 0, 0.5 and 1) in presence of 0.1 (M) LiCl as supporting electrolyte.[a]
Complex E1/21(mV) ipc
1(µA)
CH3-V2+
-12 -500 -72.6
CH3-V2+
-12-(Py3-
)0.5 -527 -26.4
CH3-V2+
-12-(Py3-
)1 -558 -8.46
[a] The number of electrons appearing in half-reaction for the redox couple (n) is 1; the
electrode area (A) is 0.09 cm2; scan rate (v) is 100 × 10
-3 V/s; concentration of CH3-V
2+-12 (C)
is 0.009 × 10⁻³
mol/cm3 in each case.
Table S2. Calculated diffusion coefficients (D) using Randles-Sevcik equation associated with
the first reduction step of CH3-V2+
-12-(Py3-
)n at various Py3-
stoichiometry (n = 0, 0.5 and 1) in
presence of 0.1 (M) LiCl as supporting electrolyte.[a]
Complex ipc1(µA) D (cm
2/sec)
CH3-V2+
-12 -72.6 10 × 10-6
CH3-V2+
-12-(Py3-
)0.5 -26.4 1.32 × 10⁻⁶
CH3-V2+
-12-(Py3-
)1 -8.46 1.36 × 10⁻⁷
[a] The number of electrons appearing in half-reaction for the redox couple (n) is 1; the
electrode area (A) is 0.09 cm2; scan rate (v) is 100 × 10
-3 V/s; concentration of CH3-V
2+-12 (C)
is 0.009 × 10⁻³
mol/cm3 in each case.

S18
References.
1. M. F. Pepitone, G. G. Jernigan, J. S. Melinger and O.–K. Kim, Org. Lett., 2007, 9, 801.
2. C. Wang, Y. Guo, Z. Wang and X. Zhang, Langmuir, 2010, 26, 14509.
3. K. V. Rao, K. Jayaramulu, T. K. Maji and S. J. George, Angew. Chem., Int. Ed., 2010, 49,
4218.
4. Y. Liu, Y. Yu, J. Gao, Z. Wang and X. Zhang, Angew. Chem., Int. Ed., 2010, 49, 6576.
![Electrochemical miRNA Biosensors: The Benefits of ...€¦ · electrochemical nanobiosensors [6, 7]. The electrochemical nanobiosensors are pulling together the advantages of electrochemical](https://static.fdocuments.net/doc/165x107/5f5dab2fa5702b13b4580399/electrochemical-mirna-biosensors-the-benefits-of-electrochemical-nanobiosensors.jpg)