Supporting Information (Appendix 1) for
27
1 Supporting Information (Appendix 1) for Patterns of nitrogen-fixing tree abundance in forests across Asia and America Duncan N. L. Menge, Ryan A. Chisholm, Stuart J. Davies, Kamariah Abu Salim, David Allen, Mauricio Alvarez, Norm Bourg, Warren Y. Brockelman, Sarayudh Bunyavejchewin, Nathalie Butt, Min Cao, Wirong Chanthorn, Wei-Chun Chao, Keith Clay, Richard Condit, Susan Cordell, João Batista da Silva, H. S. Dattaraja, Ana Cristina Segalin de Andrade, Alexandre A. de Oliveira, Jan den Ouden, Michael Drescher, Christine Fletcher, Christian P. Giardina, C. V. Savitri Gunatilleke, I. A. U. Nimal Gunatilleke, Billy C. H. Hau, Fangliang He, Robert Howe, Chang-Fu Hsieh, Stephen P. Hubbell, Faith M. Inman- Narahari, Patrick A. Jansen, Daniel J. Johnson, Lee Sing Kong, Kamil Král, Chen-Chia Ku, Jiangshan Lai, Andrew J. Larson, Xiankun Li, Yide Li, Luxiang Lin, YiChing Lin, Shirong Liu, Shawn K. Y. Lum, James A. Lutz, Keping Ma, Yadvinder Malhi, Sean McMahon, William McShea, Xiangcheng Mi, Michael Morecroft, Jonathan A. Myers, Anuttara Nathalang, Vojtech Novotny, Perry Ong, David A. Orwig, Rebecca Ostertag, Geoffrey Parker, Richard P. Phillips, Kassim Abd. Rahman, Lawren Sack, Weiguo Sang, Guochun Shen, Ankur Shringi, Jessica Shue, Sheng-Hsin Su, Raman Sukumar, I-Fang Sun, H. S. Suresh, Sylvester Tan, Sean C. Thomas, Pagi S. Toko, Renato Valencia, Martha I. Vallejo, Alberto Vicentini, Tomáš Vrška, Bin Wang, Xihua Wang, George D. Weiblen, Amy Wolf, Han Xu, Sandra Yap, Li Zhu, Tak Fung * * Correspondence: E-mail: [email protected] This Appendix includes further details of the statistical analyses used, together with additional figures (Figures S1 to S13) and an additional table (Table S1).
Transcript of Supporting Information (Appendix 1) for
1
Supporting Information (Appendix 1) for
Patterns of nitrogen-fixing tree abundance in forests across Asia and America
Duncan N. L. Menge, Ryan A. Chisholm, Stuart J. Davies, Kamariah Abu Salim, David Allen, Mauricio Alvarez, Norm Bourg, Warren Y. Brockelman, Sarayudh Bunyavejchewin, Nathalie Butt, Min Cao,
Wirong Chanthorn, Wei-Chun Chao, Keith Clay, Richard Condit, Susan Cordell, João Batista da Silva, H. S. Dattaraja, Ana Cristina Segalin de Andrade, Alexandre A. de Oliveira, Jan den Ouden, Michael
Drescher, Christine Fletcher, Christian P. Giardina, C. V. Savitri Gunatilleke, I. A. U. Nimal Gunatilleke, Billy C. H. Hau, Fangliang He, Robert Howe, Chang-Fu Hsieh, Stephen P. Hubbell, Faith M. Inman-Narahari, Patrick A. Jansen, Daniel J. Johnson, Lee Sing Kong, Kamil Král, Chen-Chia Ku, Jiangshan
Lai, Andrew J. Larson, Xiankun Li, Yide Li, Luxiang Lin, YiChing Lin, Shirong Liu, Shawn K. Y. Lum, James A. Lutz, Keping Ma, Yadvinder Malhi, Sean McMahon, William McShea, Xiangcheng Mi,
Michael Morecroft, Jonathan A. Myers, Anuttara Nathalang, Vojtech Novotny, Perry Ong, David A. Orwig, Rebecca Ostertag, Geoffrey Parker, Richard P. Phillips, Kassim Abd. Rahman, Lawren Sack, Weiguo Sang, Guochun Shen, Ankur Shringi, Jessica Shue, Sheng-Hsin Su, Raman Sukumar, I-Fang Sun, H. S. Suresh, Sylvester Tan, Sean C. Thomas, Pagi S. Toko, Renato Valencia, Martha I. Vallejo, Alberto Vicentini, Tomáš Vrška, Bin Wang, Xihua Wang, George D. Weiblen, Amy Wolf, Han Xu,
Sandra Yap, Li Zhu, Tak Fung*
* Correspondence: E-mail: [email protected]
This Appendix includes further details of the statistical analyses used, together with additional figures (Figures S1 to S13) and an additional table (Table S1).

2
Further details of statistical analyses To test the hypothesis that different fractions of habitat that are intrinsically N-limited (i.e., N-limited in the absence of N-fixing trees) can explain differences in relative N-fixing tree abundance (basal area) between the Asian and American tropics, we adapted a model from Menge, Lichstein, and Ángeles-Pérez (2014) and applied it independently to data from our Asian and American tropical forest plots. The differences in the model between Menge et al. (2014) and the present work are that in the present work we used the older of the three age distributions in Menge et al. (2014) to reflect the mature state of our forests, we did not use latitude as a driver (because we were only examining tropical data), and we did not use N-fixation strategy as a driver. The model in Menge et al. (2014) included two types of N-fixation strategy (facultative and obligate), and was used to show that dominance of different N-fixation strategy types at low and high latitudes in the Americas could explain the latitudinal gradient in N-fixing abundance in that region (Menge et al. 2014). Dominance of different N-fixation strategy types could also explain the lower relative abundance of N-fixing trees in tropical Asian forests compared to tropical American forests, but we focus on the degree of intrinsic N limitation.
Our model uses input from a successional dynamics model that simulates time-series of relative N-fixing tree biomass (which we assume is proportional to basal area) in habitats that would or would not be N-limited in the absence of N-fixing trees. The successional dynamics model (Menge et al., 2014) assumes that N-fixing trees are facultative (i.e., they adjust their N fixation to meet their N demand after taking up soil available N), and simulates relative biomass of N-fixing vs. non-fixing trees through succession. The underlying model is a series of ordinary differential equations that tracks biomass of N-fixing trees, biomass of non-fixing trees, and nitrogen and phosphorus in two forms in the soil: available nutrients (i.e., inorganic nutrients and small organic molecules that can be taken up) and unavailable nutrients (i.e., large organic molecules in litter and detritus). Plants in the model can be limited by nitrogen, phosphorus, or both. Underlying environmental conditions (primarily inputs of nitrogen vs. phosphorus) determine whether a parameterization of the ecosystem would be N-limited without N-fixing trees, which we can assess in the model by running a simulation without N-fixing trees.
For the purposes of our analysis we simulated two versions of the model, one for a habitat that would be N-limited without N-fixing trees and another for a habitat that would not (hereafter, habitats with and without intrinsic N limitation, respectively). The two versions correspond to different parameterizations of the model. Specifically, the parameterizations have different inputs of nitrogen and phosphorus, but the same values of the other parameter values. The values of these other parameters were chosen to reflect a generic forest with a typical C:N ratio, C:P ratio, leaf life-span, steady-state tree biomass, steady-state N flux, and steady-state P flux (Menge, Levin, & Hedin, 2009; Menge et al., 2014). Simulations of the two model versions provide time-series of N-fixing and non-fixing tree biomasses for habitats with and without intrinsic N limitation, which are then weighted by an appropriate age distribution of forests in a region to compute a single value of relative N-fixing tree biomass in each habitat type. Because the CTFS-ForestGEO plots are primarily mature forests, we used the mature age distribution of forests from Menge et al. (2014) (twice the age distribution of plots from government forest inventories in the USA) to generate the relative N-fixing tree biomass values that we use as inputs to the next stage of the model (0% of total tree biomass in habitats without intrinsic N limitation is N-fixing trees; 41% of total tree biomass in habitats with intrinsic N limitation is N-fixing trees).

3
Given the simulated relative N-fixing tree biomass values in different habitats, we use a mixing model and least squares (Menge et al., 2014) to fit the fraction of habitat with intrinsic N limitation to relative abundance data of N-fixing trees from the CTFS-ForestGEO plots in each of the Asian and American tropics. 95% confidence intervals were computed by generating 1000 random draws from the approximate normal parameter distributions (Menge et al., 2014). The main outputs from the fitting process are predictions of the fraction of habitat with intrinsic N limitation that are required to explain the observed data in each region. We compared these predictions to those from fitting the dynamic model to data from government forest inventories in Mexico (Menge et al., 2014). Lastly, we also examined the size distributions of N-fixing vs. non-fixing trees in our forest plots, because this can offer insights into their demographic history. To examine differences in size structure between N-fixing and non-fixing trees, for each census at each plot with at least one N-fixing main stem in one census, we first binned the main stems into 1 cm DBH classes and derived frequency distributions for the DBH structure of non-fixing main stems and N-fixing main stems. For 32 of the 38 plots, the DBH classes were centered on 1, 2, 3… cm, whereas for the remaining six plots (Jianfengling, Kuala Belalong, Lanjenchi, LDW, Nonggang, Tiantongshan), they were centered on 1.5, 2.5, 3.5… cm. For plots with more than one census, we averaged the frequency distributions across censuses. We then calculated the maximum absolute difference between the two distributions across all DBH classes, denoted by Do, where the subscript o refers to “observed”. To assess the statistical significance of Do, we generated a null distribution of D by randomly assigning stems in the DBH classes as N-fixer stems (the same number as observed) 1,000 times and then calculating the corresponding 1,000 D values. The probability of the null values being greater than or equal to Do was used as a measure of statistical significance, with Do used as a measure of biological significance (Figure S13). Our use of the maximum absolute difference means that a large difference in only one of the DBH classes was required to detect significant differences in distributions – therefore, our finding of a general lack of significant differences using this metric was a robust result.

4
Figure S1. Relative genus richness of N-fixing trees in the CTFS-ForestGEO plots. Figure details are the same as Figure 1 except that plot color indicates the % of tree genera in a plot that are N-fixing genera (see color bar). The % of tree genera for Palamanui (13.3%) is off the color scale and is assigned the color corresponding to the highest value on the scale. The three plots in Panama and two plots in Hawaii are offset slightly for visual clarity.

5
Figure S2. Relative number of stems and relative species richness. Details as in Figure 2.

6
Figure S3. Relative abundances of N-fixing trees as functions of relative diversity in the CTFS-ForestGEO plots. American plots are shown in black, Asian plots in grey, tropical plots in closed circles, and extratropical plots in open circles. The dotted line is the 1:1 line. The other lines are linear regressions forced through the origin.

7
Figure S4. Relative abundances of N-fixing trees and N-fixing legume trees in the CTFS-ForestGEO plots with at least one N-fixer tree. American plots are shown in black, Asian plots in grey, and plots elsewhere in red. Tropical plots are shown in closed circles and extratropical plots in open circles. The dotted line is the 1:1 line. (B) and (D) are the same as (A) and (C) respectively, except with a smaller x-axis range.
8
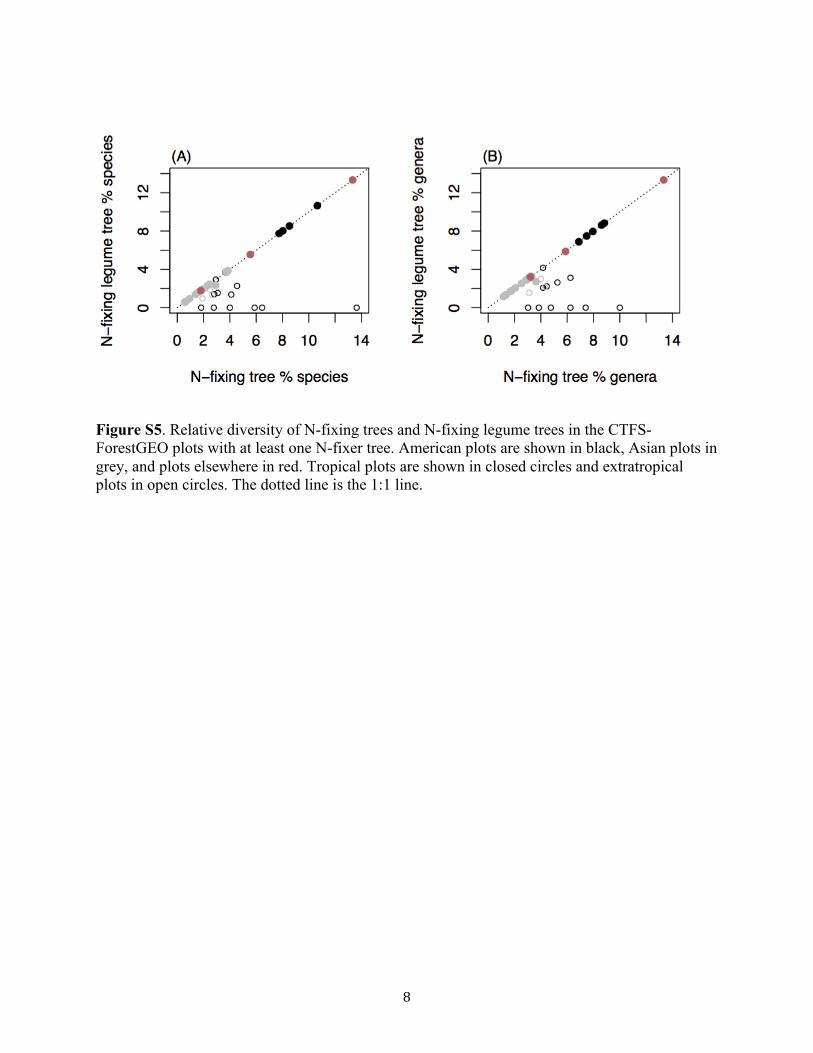
Figure S5. Relative diversity of N-fixing trees and N-fixing legume trees in the CTFS-ForestGEO plots with at least one N-fixer tree. American plots are shown in black, Asian plots in grey, and plots elsewhere in red. Tropical plots are shown in closed circles and extratropical plots in open circles. The dotted line is the 1:1 line.

9
Figure S6. Relative abundance and diversity of legume trees and N-fixing legume trees in the CTFS-ForestGEO plots with at least one legume tree. American plots are shown in black, Asian plots in grey, and plots elsewhere in red. Tropical plots are shown in closed circles and extratropical plots in open circles. The dotted line is the 1:1 line.

10
Figure S7. Absolute basal area of N-fixing trees in the CTFS-ForestGEO plots. Figure details are the same as Figure 1 except that plot color indicates the basal area of N-fixing trees per unit area in a plot (see color bar). The absolute basal area for Palamanui (6.10 m2 ha-1) is off the color scale and is assigned the color corresponding to the highest value on the scale. The three plots in Panama and two plots in Hawaii are offset slightly for visual clarity.

11
Figure S8. Absolute genus richness of N-fixing trees in the CTFS-ForestGEO plots. Figure details are the same as Figure 1 except that plot color indicates the number of genera of N-fixing trees per unit area in a plot (see color bar). The three plots in Panama and two plots in Hawaii are offset slightly for visual clarity.

12
Figure S9. Absolute basal area and genus richness of N-fixing trees in the CTFS-ForestGEO plots. Details as in Figure 2.

13
Figure S10. Absolute number of stems and species richness of N-fixing trees in the CTFS-ForestGEO plots. Details as in Figure 2.

14
Figure S11. Relative demographic rates of N-fixing vs. non-fixing trees in the CTFS-ForestGEO plots. Vertical axes are differences between N-fixing and non-fixing tree instantaneous rates of (A) recruitment, (B) mortality, and (C) growth. Data are divided into latitudinal and continental

15
groupings as in Figure 2, and are presented as means ± SE of plot-level values. There were no N-fixing trees in extratropical plots in Europe, so there are no corresponding demographic rates. Plots with the same letter are not significantly different according to Tukey’s HSD test at the plot level. (A) and (C) have no letters because there were no statistically significant differences between regions. An asterisk (*) indicates a difference between N-fixing and non-fixing tree rates in a category that is significantly different from zero (P values for recruitment in Tropical America, Tropical Asia, Oceania, Extratropical America, and Extratropical Asia are, respectively, 0.95, 0.29, 0.38, 0.34, 0.89; for mortality they are 0.58, 0.09, 0.66, 0.003, 0.95 and for growth they are 0.46, 0.78, 0.22, 0.20, 0.80).

16
Figure S12. Relative basal area of N-fixing trees against differences in demographic rates of N-

17
fixing vs. non-fixing tree species. American plots are shown in black, Asian plots in grey, tropical plots as filled circles, and extratropical plots as open circles. Main and interaction effects between rates of recruitment, growth, and mortality were insignificant (P values for main effects of recruitment, mortality, and growth are 0.91, 0.22, and 0.76, respectively; interaction effects for recruitment*mortality, recruitment*growth, mortality*growth, and recruitment*mortality*growth are, respectively, 0.64, 0.43, 0.25, and 0.23, respectively).

18

19

20
Figure S13. Proportions of non-fixer (black) and N-fixer (red) stems in each 1 cm DBH class, for the 38 forest plots studied with at least one N-fixing stem in one census. The plots are organised according to three biogeographic regions: America, Asia and Oceania. European plots are not shown because they have no N-fixing trees. Within each region, the plots are ordered according to latitude, from the most southern to the most northern. Labels next to the plot indicate whether they are tropical (T) or extratropical (ET). For each plot, results of the randomization test of differences between the distributions of non-fixing and fixing stems are presented, with statistically significant (P < 0.05) differences indicated by an asterisk. The test statistic is Do, which is the maximum distance between the distributions. Only extratropical America has a strong bias in N-fixing tree size vs. non-fixing tree size: N-fixing trees are distinctly smaller (P < 0.05, Do > 0.1) than non-fixing trees in five extratropical American plots (Yosemite, SERC, MBW, Harvard, Wabikon), similarly sized in five (Santa Cruz, Utah, SCBI, LDW, Wind River), and distinctly larger in only one (UMBC). N-fixing trees and non-fixing trees have similar size distributions in all six tropical American plots. In tropical Asia, N-fixing trees are distinctly smaller in two (Mudumalai and Lanjenchi), similarly sized in nine (Bukit Timah, Pasoh, Lambir, Kuala Belalong, Khao Chong, Palanan, Jianfengling, Xishuangbanna, and Hong Kong), and distinctly larger in three (Sinharaja, Mo Singto, and Nonggang) plots. In extratropical Asia, N-fixing trees are distinctly smaller in one (Donglingshan), similarly sized in one (Fushan), and distinctly larger than non-fixing trees in two (Gutianshan and Tiantongshan) plots. In tropical Oceania, N-fixing trees are similarly sized in two plots (Wanang and Palamanui) and distinctly larger in the third (Laupahoehoe).

21
Table S1. Plot-specific acknowledgements. Acknowledgements specific to the CTFS-ForestGEO plots considered in our study.
Forest plot Acknowledgement Barro Colorado Island (BCI)
The BCI forest dynamics research project was founded by S.P. Hubbell and R.B. Foster and is now managed by R. Condit, S. Lao, and R. Perez under the Center for Tropical Forest Science and the Smithsonian Tropical Research in Panama. Numerous organizations have provided funding, principally the U.S. National Science Foundation, and hundreds of field workers have contributed.
Fushan
Fushan FDP is supported by the Taiwan Forestry Bureau, the Taiwan Forestry Research Institute and the Ministry of Science and Technology of Taiwan. We thank the staff at Fushan Research Center for providing logistic support.
Harvard
Funding for the Harvard ForestGEO Forest Dynamics plot was provided by the Center for Tropical Forest Science and Smithsonian Institute’s Forest Global Earth Observatory (CTFS-ForestGEO), the National Science Foundation’s LTER program (DEB 06-20443 and DEB 12-37491) and Harvard University. Thanks to many field technicians who helped census the plot and Jason Aylward for field supervision, data screening and database management.
Huai Kha Khaeng
The Huai Kha Khaeng 50-hectare plot project has been financially and administratively supported by many institutions and agencies. Direct financial support for the plot has been provided by the Royal Thai Forest Department and the National Parks Wildlife and Plant Conservation Department, the Arnold Arboretum of Harvard University (under NSF award #DEB-0075334, and grants from USAID and the Rockefeller Foundation), the Smithsonian Tropical Research Institute, and the National Institute for Environmental Studies, Japan. The Huai Kha Khaeng Forest Dynamics Plot is part of the Center for Tropical Forest Science, a global network of large-scale demographic tree plots. We acknowledge the Royal Thai Forest Department for supporting and maintaining the project in Huai Kha Khaeng Wildlife Sanctuary, Thailand.

22
Lambir The 52-ha Long-Term Ecological Research Project is a collaborative project of the Forest Department of Sarawak, Malaysia, the Center for Tropical Forest Science of the Smithsonian Tropical Research Institute, the Arnold Arboretum of Harvard University, USA (under NSF awards DEB-9107247 and DEB-9629601), and Osaka City, Ehime & Kyoto Universities, Japan (under Monbusho grants 06041094, 08NP0901 and 09NP0901). The Lambir Forest Dynamics Plot is part of the Center for Tropical Forest Science, a global network of large-scale demographic tree plots. We acknowledge the Sarawak Forest Department for supporting and maintaining the project in Lambir Hills National Park.
Laupahoehoe, Palamanui
The Hawai‘i Permanent Plot Network thanks the USFS Institute of Pacific Islands Forestry (IPIF) and the Hawai‘i Division of Forestry and Wildlife/Department of Land and Natural Resources for permission to conduct research within the Hawai‘i Experimental Tropical Forest; and the Palāmanui Group, especially Roger Harris, for access to the lowland dry forest site. We also thank the Smithsonian Tropical Research Institute Center for Tropical Forest Science. This work is possible because of support provided by NSF EPSCoR (Grant Numbers EPS- 0554657 and EPS-0903833), the USDA Forest Service, the Pacific Southwest Research Station of the USFS, the University of Hawaii, and the University of California at Los Angeles. We thank the USDA Forest Service and State of Hawai‘i Department of Land and Natural Resources Division of Forestry and Wildlife for access to the Hawai‘i Experimental Tropical Forest.
Michigan Big Woods
We would like to thank the University of Michigan and Middlebury College students who have helped with all of the censuses of the Big Woods Plot. These censuses were supported by the Edwin S. George Reserve Fund, a USDA McIntyre-Stennis Grant, and the Middlebury College Millennium Fund.
Mo Singto
The 30-ha plot is supported by National Science and Technology Development Agency (Thailand); The Department of National Park, Wildlife and Plant Conservation; and Thai Ministry of Natural Resources and Environment.
Mudumalai
The 50 hectare Mudumalai Forest Dynamics plot was set up by

23
the Centre for Ecological Sciences, Indian Institute of Science, Bangalore. Most of the long-term funding for running the plot has come from the Ministry of Environment, Forest and Climate Change (Government of India). In recent years this has been supplemented with funding from the Department of Biotechnology (Government of India), the JC Bose National Fellowship (Department of Science and Technology), and the Divecha Centre for Climate Change, Indian Institute of Science. We acknowledge the support of Tamil Nadu Forest Department for this long-term monitoring.
Palanan
Research in the 16-ha Palanan Forest Dynamics Plot is collaboratively managed by the Institute of Biology, University of the Philippines Diliman and the Smithsonian Tropical Research Centre/Centre for Tropical Forest Science while additional grants were provided by the University of the Philippines Office of the Vice President For Academic Affairs, Commission on Higher Education, the Department of Science and Technology and the Energy Development Corporation. The assistance and continuing support of the Protected Areas Management Board of the Northern Sierra Madre Natural, the Department of Environment and Natural Resources and the local government unit of Palanan, Isabela as well as the local community are gratefully acknowledged.
Pasoh
Data from the Pasoh Forest Reserve was provided by the Forest Research Institute Malaysia – Smithsonian Tropical Research Centre/Centre for Tropical Forest Science collaborative research and support from the Negeri Sembilan State Forestry Department.
Smithsonian Conservation Biology Institute (SCBI)
Funding for the establishment of the SCBI ForestGEO Large Forest Dynamics Plot was provided by the Smithsonian Global Earth Observatory initiative, the Smithsonian Institution, National Zoological Park and the HSBC Climate Partnership. We especially thank the numerous technicians, interns and volunteers of the Conservation Ecology Center at the SCBI who were essential in assisting with plot establishment and data collection. Support for the original exclosure fence installation was provided by the Friends of the National Zoo and Earthwatch Foundation.

24
Sinharaja The 25-ha Long-Term Ecological Research Project at Sinharaja World Heritage Site is a collaborative project of the University of Peradeniya, the Center for Tropical Forest Science of the Smithsonian Tropical Research Institute and the Arnold Arboretum of Harvard University, USA, with supplementary funding received from the John D. and Catherine T. Macarthur Foundation, the National Institute for Environmental Science, Japan, and the Helmholtz Centre for Environmental Research-UFZ, Germany, for past censuses. The PIs gratefully acknowledge the Forest Department and the Post-Graduate Institute of Science at the University of Peradeniya, Sri Lanka for supporting this project, and the local field and lab staff who tirelessly contributed in the repeated censuses of this plot.
Tyson
The Tyson Research Center Forest Dynamics Plot (TRCP) is supported by Washington University in St. Louis’' Tyson Research Center. Funding was provided by the International Center for Advanced Renewable Energy and Sustainability (I-CARES) at Washington University in St. Louis, the National Science Foundation (DEB 1557094), and the Tyson Research Center. We thank the Tyson Research Center staff for providing logistical support, and the more than 100 high school students, undergraduate students, and researchers that have contributed to the project. The TRCP is part of the Center for Tropical Forest Science–Forest Global Earth Observatory (CTFS–ForestGEO), a global network of large-scale forest dynamics plots.
Utah
The Utah Forest Dynamics Plot is a collaborative project of Utah State University and the Utah Agricultural Experiment Station. We thank Cedar Breaks National Monument for providing logistical support, and the students, volunteers and staff individually listed at http://ufdp.org for data collection.
Wabikon
Major support for research at the Wabikon Forest Dynamics Plot has been provided by The 1923 Fund, the Smithsonian Tropical Research Institute, and the U.S. Forest Service. Gary Fewless, Kathryn Corio, and Juniper Sundance have been key contributors to research at the site, which has engaged more than 50 students from UW-Green Bay and other institutions.
Wanang
The 50-ha Wanang Forest Dynamics Plot is a collaborative
25
project of the New Guinea Binatang Research Center (Christensen Foundation 2016-8734), the Center for Tropical Forest Science of the Smithsonian Tropical Research Institute, the Forest Research Institute of Papua New Guinea, the Czech Academy of Sciences (GACR 16-18022S) and the University of Minnesota (NSF DEB-1027297 and NIH ICBG 5UO1TW006671). We acknowledge the government of Papua New Guinea and the customary landowners of Wanang for supporting and maintaining the plot.
Wind River
The Wind River Forest Dynamics Plot is a collaborative project of Utah State University, the University of Montana, the University of Washington, and Washington State University. Funding was provided by the Center for Tropical Forest Science of the Smithsonian Tropical Research Institute, Utah State University, and the University of Washington. We acknowledge the Gifford Pinchot National Forest and the Wind River Field Station for providing logistical support, and the students, volunteers and staff individually listed at http://wfdp.org for data collection. The Wind River Forest Dynamics Plot was made possible by a grant from Jennifer Walston Johnson to the Smithsonian ForestGEO.
Xishuangbanna
Funding for the establishment of XSBN FDP was provided by Chinese Forest Biodiversity Monitoring Network and Xishuangbanna Tropical Botanical Garden, Chinese Academy of Sciences. We especially thank Xishuangbanna Station of Tropical Rainforest Ecosystem Studies (National Forest Ecosystem Research Station at Xishuangbanna), Chinese Academy of Sciences for supporting and maintaining XSBN FDP.
Yasuni
The Yasuni plot establishment and censuses were supported by Pontifical Catholic University of Ecuador (Donaciones del Impuesto a la Renta from the government of Ecuador and PUCE grants L13251, M13373 in recent years) and the Center for Tropical Forest Science of the Smithsonian Tropical Research Institute. The continuous research in the Yasuni plot is endorsed by the Ministerio de Ambiente del Ecuador through several research permits.
Yosemite
The Yosemite Forest Dynamics Plot is a collaborative project of

26
Utah State University, the University of Montana, and Washington State University. Funding was provided by the Center for Tropical Forest Science of the Smithsonian Tropical Research Institute, Utah State University, and the University of Washington. We thank Yosemite National Park for providing logistical support, and the students, volunteers and staff individually listed at http://yfdp.org for data collection. The Yosemite Forest Dynamics Plot was made possible by a grant from Jennifer Walston Johnson to the Smithsonian ForestGEO.
Zofin
We acknowledge the Department of Forest Ecology of the Silva Tarouca Research Institute for supporting and maintaining the long-term monitoring of the Zofin Forest Dynamics Plot (under INTER-ACTION grant No. LTAUSA18200). The Zofin Forest Dynamics Plot is part of the Center for Tropical Forest Science–Forest Global Earth Observatory (CTFS-ForestGEO), a worldwide network of large, long-term forest dynamics plots and was established with the support of Smithsonian Institution.

27
References
1 Menge, D. N. L., Lichstein, W., & Ángeles-Pérez, G. (2014). Nitrogen fixation strategies can explain the latitudinal shift in nitrogen-fixing tree abundance. Ecology, 95, 2236–2245. https://doi.org/10.1890/13-2124.1
2 Menge, D. N. L., Levin, S. A., & Hedin, L. O. (2009). Facultative versus obligate nitrogen fixation strategies and their ecosystem consequences. American Naturalist, 174, 465–477. https://doi.org/10.1086/605377