Supporting Family Incomes: Getting the Balance Right - … · supporting family incomes getting the...
31
SUPPORTING FAMILY INCOMES GETTING THE BALANCE RIGHT MICHAEL SAVAGE, TIM CALLAN, MARK REGAN AND JOHN R. WALSH BUDGET PERSPECTIVES 2018 PAPER 1 June 2017 E V I D E N C E F O R P O L I C Y
Transcript of Supporting Family Incomes: Getting the Balance Right - … · supporting family incomes getting the...
SUPPORTING FAMILY INCOMESGETTING THE BALANCE RIGHT MICHAEL SAVAGE, TIM CALLAN, MARK REGAN AND JOHN R. WALSH
BUDGET PERSPECTIVES 2018PAPER 1June 2017
EVIDENCE FOR POLICY

SUPPORTING FAMILY INCOMES: GETTING THE BALANCE RIGHT
Michael Savage Tim Callan Mark Regan John R. Walsh
June 2017
BUDGET PERSPECTIVES 2018
PAPER 1
Available to download from www.esri.ie © The Economic and Social Research Institute Whitaker Square, Sir John Rogerson’s Quay, Dublin 2

ABOUT THE ESRI
The mission of the Economic and Social Research Institute is to advance evidence-based policymaking that supports economic sustainability and social progress in Ireland. ESRI researchers apply the highest standards of academic excellence to challenges facing policymakers, focusing on 12 areas of critical importance to 21st Century Ireland.
The Institute was founded in 1960 by a group of senior civil servants led by Dr T.K. Whitaker, who identified the need for independent and in-depth research analysis to provide a robust evidence base for policymaking in Ireland.
Since then, the Institute has remained committed to independent research and its work is free of any expressed ideology or political position. The Institute publishes all research reaching the appropriate academic standard, irrespective of its findings or who funds the research.
The quality of its research output is guaranteed by a rigorous peer review process. ESRI researchers are experts in their fields and are committed to producing work that meets the highest academic standards and practices.
The work of the Institute is disseminated widely in books, journal articles and reports. ESRI publications are available to download, free of charge, from its website. Additionally, ESRI staff communicate research findings at regular conferences and seminars.
The ESRI is a company limited by guarantee, answerable to its members and governed by a Council, comprising 14 members who represent a cross-section of ESRI members from academia, civil services, state agencies, businesses and civil society. The Institute receives an annual grant-in-aid from the Department of Public Expenditure and Reform to support the scientific and public interest elements of the Institute’s activities; the grant accounted for an average of 30 per cent of the Institute’s income over the lifetime of the last Research Strategy. The remaining funding comes from research programmes supported by government departments and agencies, public bodies and competitive research programmes.
Further information is available at www.esri.ie

THE AUTHORS Michael Savage is a Research Officer, Tim Callan is a Research Professor, Mark Regan is a Research Assistant and John R. Walsh is a Software Architect at the Economic and Social Research Institute (ESRI).
ACKNOWLEDGEMENTS We are grateful to the SILC team at CSO for facilitating access to a Research Microdata File used to construct the database for the SWITCH tax-benefit model. Funding from the SWITCH Research Programme (supported by the Departments of Public Expenditure and Reform, Social Protection, Health and Finance) is gratefully acknowledged. We thank two anonymous referees, and participants at an ESRI internal seminar for their insightful comments.
This paper has been accepted for publication by the Institute, which does not itself take institutional policy positions. The paper has been peer reviewed prior to publication. The authors are solely responsible for the content and the views expressed.

3
TABLE OF CONTENTS
ABSTRACT .............................................................................................................................................. 5
1. INTRODUCTION ............................................................................................................................. 5
2. MEASURING FINANCIAL WORK INCENTIVES ................................................................................ 6
2.1 The incentive to be in paid work ........................................................................................ 6
2.2 The incentive to progress.................................................................................................... 8
3. IN-WORK BENEFITS AND CREDITS: INTERNATIONAL EXPERIENCE ............................................... 9
3.1 The US and the Earned Income Tax Credit ......................................................................... 9
3.2 The UK experience ............................................................................................................ 12
3.3 Universal Credit in the UK ................................................................................................. 14
4. SUPPORT FOR WORKING FAMILIES: IRISH EXPERIENCE AND POTENTIAL REFORMS ................. 17
4.1 Potential reforms to Ireland’s in-work benefits................................................................ 19
4.2 Illustrative reforms to FIS: the balance between supporting low incomes and providing a financial incentive to work ............................................................................. 20
4.3 Summary and discussion ................................................................................................... 25
5. CONCLUSION ............................................................................................................................... 26
BIBLIOGRAPHY .................................................................................................................................... 27
4
LIST OF TABLES
Table 1 Exchequer cost and distributional impact of hypothetical FIS reforms – percentage change in household income............................................................................................... 23
Table 2 Incidence of high replacement rates under hypothetical FIS reforms – unemployed jobseekers in non-earnings couples with children .............................................................. 24
Table 3 Incidence of high replacement rates under hypothetical FIS reforms – unemployed jobseekers in one-earner couples with children ................................................................. 24
Table 4 Incidence of high METRS under hypothetical FIS reforms – workers with children ........... 25
LIST OF FIGURES
Figure 1 Earned Income Tax Credit (EITC), US 2017 .......................................................................... 10
Figure 2 Claimants and expenditure on the EITC, 1975-2013 ........................................................... 11
Figure 3 Average value of in-work benefit and number of recipients, UK, 1971-2003 .................... 14
Figure 4 Benefit entitlements under existing UK system and Universal Credit: lone parent with two children ................................................................................................................ 16
Figure 5 Number of recipients and average value of Family Income Supplement, Ireland, 1985-2015............................................................................................................................ 18
Figure 6 FIS entitlement under current structure and hypothetical reforms ................................... 22
5
SUPPORTING FAMILY INCOMES: GETTING THE BALANCE RIGHT
ABSTRACT
Policymakers in Ireland and internationally are faced with trade-offs in the design of income supports for families in and out of work. Policymakers have a strong interest in three key parameters: the level of income support for those without earnings, the rate at which such support is withdrawn through benefit reductions and/or taxes, and the aggregate cost to the Exchequer of income support. However, economic reality dictates that only two of the three parameters can be chosen by policy – the third is then automatically determined. In this paper, we first set out a framework in which these trade-offs can be understood, identifying two distinct forms of work incentive – the incentive to be in paid work, and the incentive to progress (i.e. the incentive to earn more). We then explore how, faced with these trade-offs, the choices made as regards the broad design of family income supports have varied across three countries (US, UK and Ireland) and over time. Finally, informed by this international experience, we consider a number of potential reforms to Ireland’s system of income support for working families. We suggest that the most fruitful direction for policy at present is to focus on the implementation of real-time reporting of payroll information. This will be of value both in diagnosing potential take-up problems related to the Family Income Supplement scheme, and in creating the infrastructure to support new and more efficient forms of in-work benefit.
1. INTRODUCTION
Policymakers in Ireland and internationally are faced with sharp trade-offs in the design of income supports for families in and out of work. Policymakers have a strong interest in three key parameters: the level of income support for those without earnings, the rate at which such support is withdrawn through benefit reductions and/or taxes, and the aggregate cost to the Exchequer of income support. However, economic reality dictates that only two of the three parameters can be chosen by policy – the third is then automatically determined. For example, if policymakers choose an income support level and a benefit withdrawal rate, then the aggregate cost is automatically determined by the labour supply choices of individuals and families facing the given system.
In this paper we first set out a framework in which these trade-offs can be understood, identifying two distinct forms of work incentive – the incentive to be in paid work, and the incentive to progress (i.e. the incentive to earn more). We then explore how, faced with these trade-offs, the choices made as regards the

6
broad design of family income supports have varied across three countries (US, UK and Ireland), and over time. Family income supports in these three countries have undergone substantial reforms in recent decades, and thus provide useful insights into the broad shape of the policy options which have been chosen and the reasons for so doing. Finally, informed by this international experience, we consider a number of potential reforms to Ireland’s system of income support for working families, some of which are relevant to the proposal for a Working Family Payment in the current Programme for Government.
2. MEASURING FINANCIAL WORK INCENTIVES1
Key concerns in the design of income support policy include the adequacy of the support provided, which relates to the anti-poverty objective, and the implications of the income support and its withdrawal for incentives to work. In this section, we clarify that two distinct dimensions are involved in work incentives, and that different measures are required for each. We distinguish between the incentive an individual faces at what economists term the extensive margin (the incentive to be in paid work) and the incentive an individual in paid work has to increase their earnings (the incentive to progress in work).2
2.1 The incentive to be in paid work
There are two main approaches to the measurement of the incentive to be in paid work. The replacement rate (RR) measures an individual’s out-of-work income as a percentage of their in-work income. This is the measure that has been most commonly used in analysis of the incentive to be in paid work in Ireland, and is defined as:
𝑅𝑅 = 100 ∗ 𝑛𝑛𝑛 𝑖𝑛𝑖𝑖𝑖𝑛 𝑖𝑜𝑛 𝑖𝑜 𝑤𝑖𝑤𝑤𝑛𝑛𝑛 𝑖𝑛𝑖𝑖𝑖𝑛 𝑖𝑛 𝑤𝑖𝑤𝑤
For example, an individual with out-of-work disposable income of €250, and disposable income when participating in employment of €500 would have a replacement rate of 50 per cent.
The Participation Tax Rate (PTR) measures the proportion of earnings that are taken away in tax or lower benefit entitlements when an individual starts work.
1 This section draws heavily on Callan et al. (2016). 2 The incentive to be in paid work and the incentive to progress in work both have implications for individuals’ and
families’ labour supply decisions. Both are affected crucially by the design of the tax-benefit system, thus both margins should be considered when making policy decisions.

7
Therefore,
𝑃𝑃𝑅 = 100 ∗ �1 −𝑛𝑛𝑛 𝑖𝑛𝑖𝑖𝑖𝑛 𝑖𝑛 𝑤𝑖𝑤𝑤 − 𝑛𝑛𝑛 𝑖𝑛𝑖𝑖𝑖𝑛 𝑖𝑜𝑛 𝑖𝑜 𝑤𝑖𝑤𝑤
𝐼𝑛𝐼𝑖𝐼𝑖𝐼𝑜𝐼𝐼 𝑔𝑤𝑖𝑔𝑔 𝑛𝐼𝑤𝑛𝑖𝑛𝑔𝑔�
In all cases, net income is measured at family level. Whether family or individual income is more appropriate depends on which is more important for the individual’s decisions. For example, a low-earning person living with a high-earning partner may have no independent income if he or she does not work, and therefore would have a very low RR – a strong financial incentive to work – when calculated using individual income. However, the same individual would have a very high RR when calculated using family income, because whether he or she works makes little difference proportionally to the family’s income. By contrast, the PTR for this individual is likely to be very low (if the individual is only paying income tax and employee social security contributions on a small portion of their earnings, and is in a family which has an income too great to be entitled to tax credits) regardless of whether individual or family income is used for the calculation.
In the case of both RR and PTR:
• Net income means income after benefits have been added and taxes and social security contributions are deducted. For individuals in couples, it is possible to calculate these incentive measures based on family income or on individual income. Previous Irish work and most UK work has focused on family income and we follow the same approach here. In all cases, partners’ behaviour is assumed to be held constant when calculating an individuals’ financial work incentive.
• For both the RR and the PTR, lower numbers indicate that the financial incentive to work is strong, and higher numbers indicate that the financial incentive to work is weak. A PTR of 0 per cent would indicate that an individual did not have to pay any tax on their earnings and did not lose any benefit entitlement when they started work, whereas a RR of 0 per cent would indicate that an individual would not receive any income if they did not work. A PTR or RR of 100 per cent would indicate that all of an individual’s earnings would be taken from them in tax or lower benefit entitlements if they worked, so they would be no better off working than not working.
Both of these measures attempt to capture the incentive to work or not, but the interpretation of the measures is somewhat different. Broadly speaking, the RR measures the absolute strength of financial incentives to work whereas the PTR

8
measures the effect of the tax and benefit system on work incentives. While the RR measures the disincentives caused by high taxes and low earnings power (and vice versa), the PTR distinguishes, to a greater extent, between whether a reduced reward to work is caused by higher taxes or lower wages. However, the PTR ignores the level of out-of-work income (focusing only on the difference between in-work and out-of-work income), even though the level of out-of-work income may well affect the decision to work. The RR does pick this up, and it can be important particularly for potential second earners, for whom the in-work income of the first earner plays the same role as an out-of-work source of income more generally. While both measures are of interest, and have been used by us in previous research, we focus in this paper mainly on the replacement rate measure when describing how incentives are affected by various policy decisions.
For the empirical analysis in Section 4, an estimate is required for non-workers of how much they would earn if they did work. The approach taken here is to estimate the hourly wage which an individual could command, based on characteristics such as age and educational qualifications. Further details on estimation of potential wages can be found in Callan et al. (2016).
2.2 The incentive to progress
The marginal effective tax rate (METR) is often used to estimate the incentive for an individual currently in work to increase their earnings. The METR measures what proportion of a small change in gross income is lost to tax payments and forgone state benefit entitlements. The METR therefore indicates the strength of the incentive for individuals to increase their earnings slightly, whether through working more hours, or through promotion, qualifying for bonus payments or getting a better-paid job. We use the term ‘incentive to earn more’ to describe this set of possibilities.
The METR is calculated as:
𝑀𝑀𝑃𝑅 = 100 × (1 −𝐶ℎ𝐼𝑛𝑔𝑛 𝑖𝑛 𝐷𝑖𝑔𝐷𝑖𝑔𝐼𝐷𝐼𝑛 𝐼𝑛𝑖𝑖𝑖𝑛𝐶ℎ𝐼𝑛𝑔𝑛 𝑖𝑛 𝐺𝑤𝑖𝑔𝑔 𝑀𝐼𝑤𝑛𝑖𝑛𝑔𝑔
)
The METR is analogous to the PTR, with the sole difference being that the METR is measured over a small increase in earnings for those already in work, whereas the PTR is measured over the margin of moving from non-employment into employment.
As with the incentive to work at all, low numbers mean stronger financial incentives. A METR of zero means that the individual keeps all of any small

9
change in what their employer pays, and a rate of 100 per cent means that the individual keeps none. High METRs amongst workers in low-income families are often referred to as the poverty trap.
3. IN-WORK BENEFITS AND CREDITS: INTERNATIONAL EXPERIENCE
Support schemes for low income individuals and families have undergone several large-scale reforms in both the UK and the US in the past decades, motivated at least in part by some of the issues discussed in the introduction. In this section, we discuss how the trade-off between poverty reduction, work incentives and overall cost interacted in the design and reform of relevant tax-benefit schemes in these countries.
3.1 The US and the Earned Income Tax Credit
The Earned Income Tax Credit (EITC) was first introduced in the US in 1975 as a relatively modest programme aimed at low income working families with children. At the time, debate in the US had focussed on the suitability of a negative income tax (NIT) as an anti-poverty tool. In the early 1970s, a NIT scheme called the Family Assistance Plan was introduced. It soon became unpopular however, largely on the grounds that it provided its largest benefits to those without earnings, and hence weakened the financial incentive to work for recipients (Hotz and Scholz, 2003). As an alternative, Senator Russell Long led the introduction of what was initially termed a ‘work bonus’ and later became the EITC, a 10 per cent supplement to wages up to $4,000, phased out between the $4,000 and $8,000 income range. In 1978, a flat range of income was added before which the credit began to be phased out.
Initially introduced as a modest scheme, the real value of the EITC decreased further during the early 1980s due to a failure to index the value of the payment to inflation. The first major expansion of the scheme came in the Tax Reform Act of 1986, which increased the value of the EITC and introduced indexation for inflation. Soon after, in 1991, the credit was made more generous for recipients with two or more children than for those with one child.
A second major expansion of the EITC came in the 1993 Budget package, which confirmed the role of the EITC not only as a ‘work bonus’ but also as a major anti-poverty tool. At the time, President Clinton committed that ‘if you work forty hours a week and you’ve got a child in the house, you will no longer be in poverty’. To achieve the target, between 1993 and 1996 the EITC was increased substantially, particularly for those with two or more children.
10
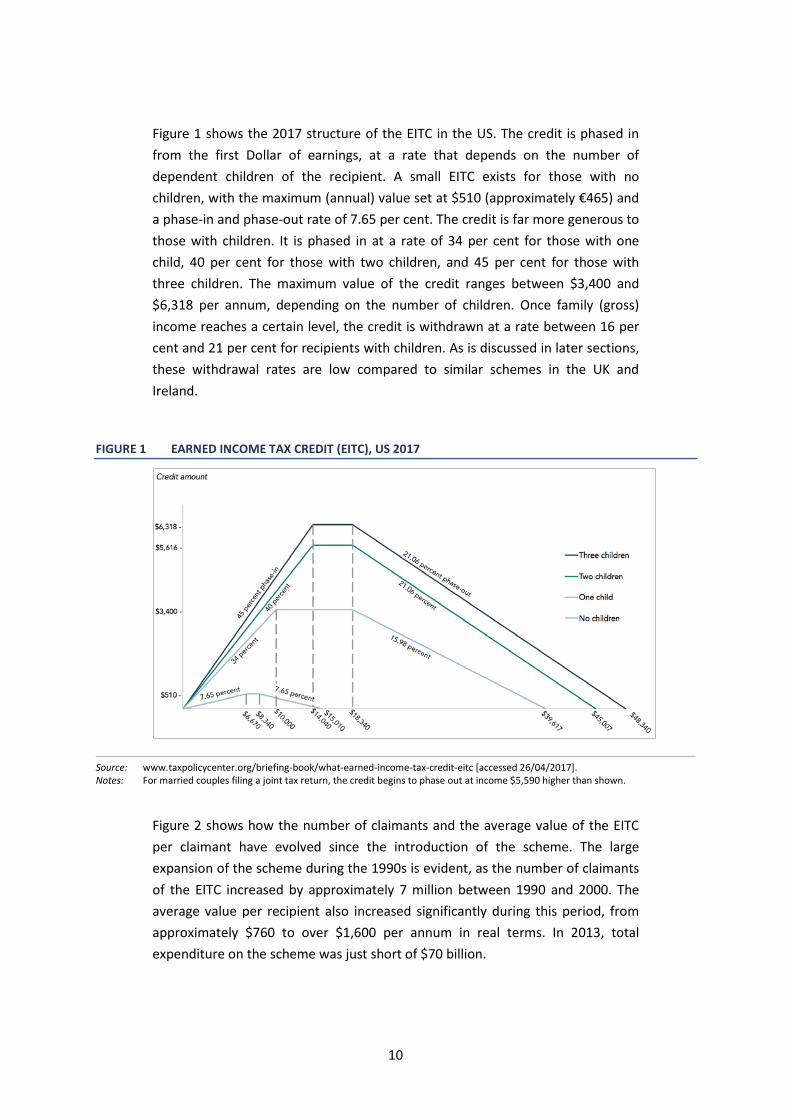
Figure 1 shows the 2017 structure of the EITC in the US. The credit is phased in from the first Dollar of earnings, at a rate that depends on the number of dependent children of the recipient. A small EITC exists for those with no children, with the maximum (annual) value set at $510 (approximately €465) and a phase-in and phase-out rate of 7.65 per cent. The credit is far more generous to those with children. It is phased in at a rate of 34 per cent for those with one child, 40 per cent for those with two children, and 45 per cent for those with three children. The maximum value of the credit ranges between $3,400 and $6,318 per annum, depending on the number of children. Once family (gross) income reaches a certain level, the credit is withdrawn at a rate between 16 per cent and 21 per cent for recipients with children. As is discussed in later sections, these withdrawal rates are low compared to similar schemes in the UK and Ireland.
FIGURE 1 EARNED INCOME TAX CREDIT (EITC), US 2017
Source: www.taxpolicycenter.org/briefing-book/what-earned-income-tax-credit-eitc [accessed 26/04/2017]. Notes: For married couples filing a joint tax return, the credit begins to phase out at income $5,590 higher than shown.
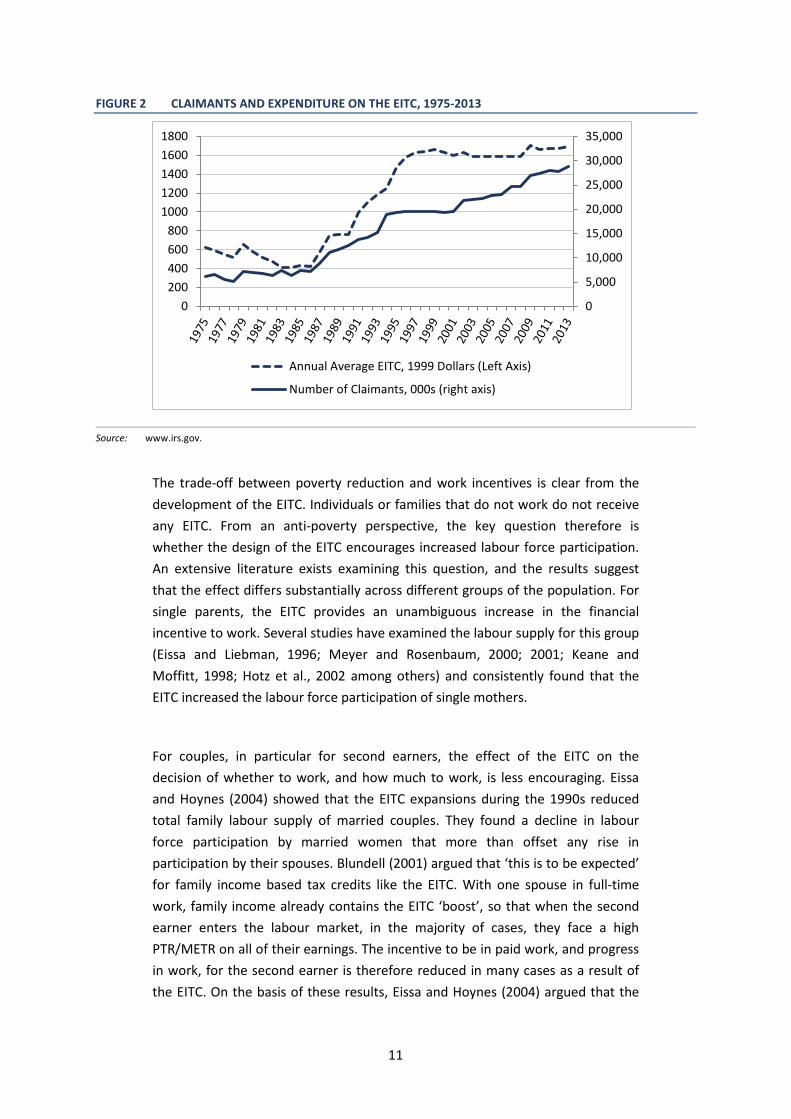
Figure 2 shows how the number of claimants and the average value of the EITC per claimant have evolved since the introduction of the scheme. The large expansion of the scheme during the 1990s is evident, as the number of claimants of the EITC increased by approximately 7 million between 1990 and 2000. The average value per recipient also increased significantly during this period, from approximately $760 to over $1,600 per annum in real terms. In 2013, total expenditure on the scheme was just short of $70 billion.
11
FIGURE 2 CLAIMANTS AND EXPENDITURE ON THE EITC, 1975-2013
Source: www.irs.gov.
The trade-off between poverty reduction and work incentives is clear from the development of the EITC. Individuals or families that do not work do not receive any EITC. From an anti-poverty perspective, the key question therefore is whether the design of the EITC encourages increased labour force participation. An extensive literature exists examining this question, and the results suggest that the effect differs substantially across different groups of the population. For single parents, the EITC provides an unambiguous increase in the financial incentive to work. Several studies have examined the labour supply for this group (Eissa and Liebman, 1996; Meyer and Rosenbaum, 2000; 2001; Keane and Moffitt, 1998; Hotz et al., 2002 among others) and consistently found that the EITC increased the labour force participation of single mothers.
For couples, in particular for second earners, the effect of the EITC on the decision of whether to work, and how much to work, is less encouraging. Eissa and Hoynes (2004) showed that the EITC expansions during the 1990s reduced total family labour supply of married couples. They found a decline in labour force participation by married women that more than offset any rise in participation by their spouses. Blundell (2001) argued that ‘this is to be expected’ for family income based tax credits like the EITC. With one spouse in full-time work, family income already contains the EITC ‘boost’, so that when the second earner enters the labour market, in the majority of cases, they face a high PTR/METR on all of their earnings. The incentive to be in paid work, and progress in work, for the second earner is therefore reduced in many cases as a result of the EITC. On the basis of these results, Eissa and Hoynes (2004) argued that the
0
5,000
10,000
15,000
20,000
25,000
30,000
35,000
0200400600800
10001200140016001800
Annual Average EITC, 1999 Dollars (Left Axis)
Number of Claimants, 000s (right axis)
12
EITC is effectively subsidising married mothers to stay home. This is a topic we return to in Section 4 of the paper.
3.2 The UK experience
The UK introduced a Family Income Supplement in 1971 as an in-work benefit, for families with an adult working at least 24 hours per week. The benefit was calculated as 50 per cent of the gap between family gross income and a target income depending on family size. The fact that the benefit was calculated with respect to gross income meant that for a €1 rise in income, the benefit fell by 50 pence, and tax rose by the then basic rate of 30 pence, meaning a total withdrawal rate of over 80 per cent when national insurance contributions were taken into account.
The high withdrawal rate associated with this approach was one of the factors which led to a reformed ‘Family Credit’ scheme introduced in 1986, based on net rather than gross income. Withdrawal rates remained high at 70 per cent of the increase in income net of income tax and national insurance contributions.
Working Family Tax Credit replaced Family Credit in 1999. WTFC was more generous than Family Credit in several ways, including a reduced taper rate (55 per cent rather than 70), which reduced the associated marginal effective tax rates. WFTC was itself replaced by a combination of Working Tax Credit and Child Tax Credit in 2003.
As Pope and Waters3 (2016) explain,
CTC provides means-tested support for families with children as a single integrated credit paid on top of child benefit. Families are eligible for CTC if they have at least one child aged under 16, or aged 16-19 and in full-time non-advanced education (such as A levels) or approved training. CTC is made up of a number of elements: a family element of £545 per year, a child element of £2,780 per child per year, a disabled child element worth £3,140 per child per year (payable in addition to the child element) and a severely disabled child element worth £1,275 per child per year (payable in addition to the disabled child element). Entitlement to CTC does not depend on employment status – both out-of-work families and lower-paid
3 Pope and Waters (2016) www.ifs.org.uk/uploads/publications/bns/bn09.pdf.

13
working parents are eligible for it – and it is paid directly to the main carer in the family (nominated by the family itself).
Working Tax Credit is aimed at providing in-work support for low-paid working adults with or without children. Pope and Waters summarise as follows:
WTC provides in-work support for low-paid working adults with or without children. It consists of a basic element worth £1,960 per year, with an extra £2,010 for couples and lone parents (i.e. everyone except single people without children). Single claimants working at least 30 hours a week are entitled to an additional £810 payment, as are couples with at least one child who jointly work at least 30 hours with one working at least 16 hours. Lone parents, couples where at least one partner is entitled to carer’s allowance, workers over 60 and workers with a disability are eligible for WTC provided at least one adult works 16 or more hours per week. Couples with children are eligible if they jointly work at least 24 hours per week, with one partner working at least 16 hours per week. For workers aged under 60 without children or a disability, at least one adult must be aged 25 or over and working at least 30 hours per week to be eligible. There are supplementary payments for disability. In addition, for families in which all adults work 16 hours or more per week, there is a childcare credit, worth 70 per cent of eligible childcare expenditure of up to £175 for families with one child or £300 for families with two or more children (i.e. worth up to £122.50 or £210).
A means test applies to child tax credit and working tax credit together. Currently, families with pre-tax family income below £6,420 per year (£16,105 for families eligible only for CTC) are entitled to the full CTC and WTC payments appropriate for their circumstances. Once family income exceeds this level, the tax credit award is reduced by 41p for every £1 of family income above this level. The main WTC entitlement is withdrawn first, followed by the childcare element of WTC, then the child and disability elements of CTC and finally the family element of CTC. This means that a family without any eligible childcare costs or disabilities will exhaust their entitlement to tax credits once their total income exceeds around £24,200 if they have one child, around £31,000 if they have two children or around £37,750 if they have three children.
The structure chosen for WTC and CTC pays greater attention than Family Credit to the incentive to progress, as the taper rate was reduced from 50 per cent to 40
14
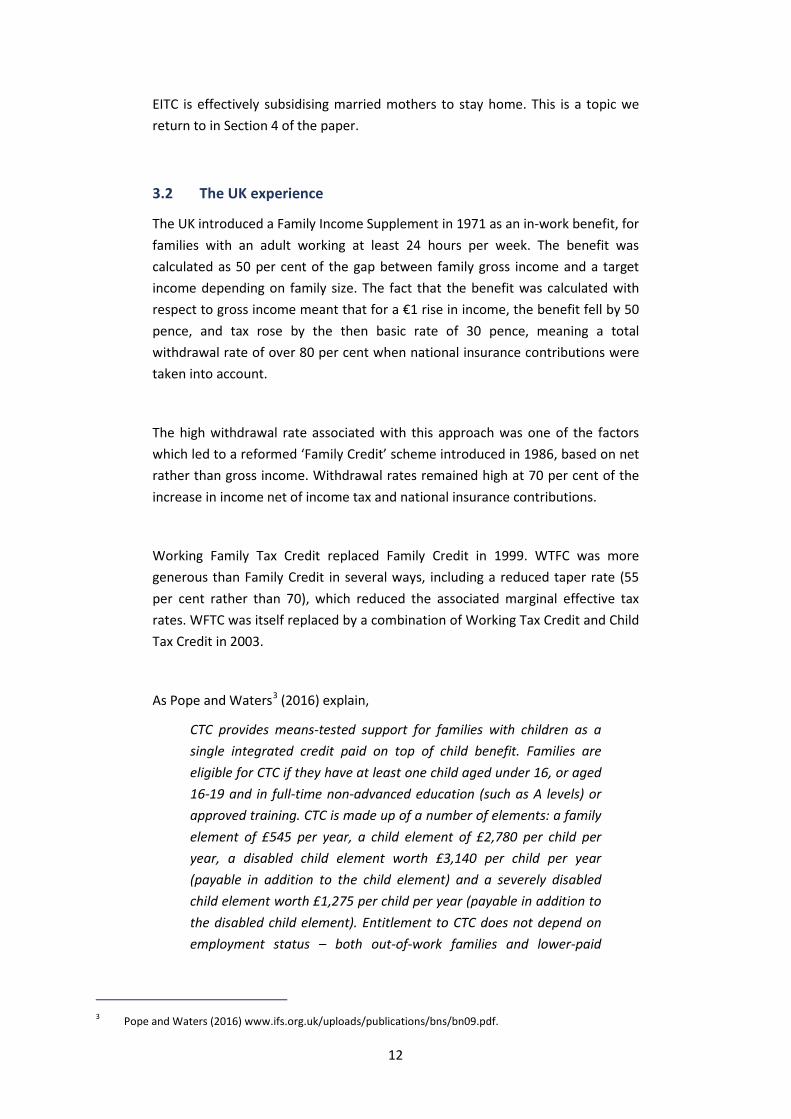
per cent. A key factor, however, is that the objective to reduce child poverty meant that levels of support were increased substantially during the period. This led both to increases in the numbers of recipients of these benefits, and to increases in the average value of the awards under the schemes, as illustrated in Figure 3.
FIGURE 3 AVERAGE VALUE OF IN-WORK BENEFIT AND NUMBER OF RECIPIENTS, UK, 1971-2003
Source: IFS Fiscal Facts, www.ifs.org.uk.
3.3 Universal Credit in the UK4
The tax-benefit system in the UK is currently undergoing a major reform with the introduction of Universal Credit. The Universal Credit will replace six means-tested benefits and tax credits for working age families. The motivation behind the reform is largely based in simplifying what has become quite a complex tax-benefit system, where withdrawal of multiple benefits and tax credits could lead to very high METRs for low income individuals and households. Browne et al. (2016) describe a system that is ‘largely the product of a history of separate decisions to layer new strands of support on top of what came before’. The central point of Universal Credit, they argue, is that it replaces a ‘jumble of separate and overlapping means-tests with one integrated assessment of families’ entitlements’.
4 This section is based largely on Browne et al. (2016).
£- £10 £20 £30 £40 £50 £60 £70 £80 £90 £100
0
200
400
600
800
1,000
1,200
1,400
1,600
01/0
5/19
7101
/10/
1972
01/0
3/19
7401
/08/
1975
01/0
1/19
7701
/06/
1978
01/1
1/19
7901
/04/
1981
01/0
9/19
8201
/02/
1984
01/0
7/19
8501
/12/
1986
01/0
5/19
8801
/10/
1989
01/0
3/19
9101
/08/
1992
01/0
1/19
9401
/06/
1995
01/1
1/19
9601
/04/
1998
01/0
9/19
9901
/02/
2001
01/0
7/20
02
Recipients Real Average Award (2003 Prices)

15
The basic structure of Universal Credit will be a maximum level of entitlement, to be received by those with the lowest incomes and assets. Once income exceeds a certain threshold, known as a work allowance, the Universal Credit begins to be withdrawn.
For most claimants the maximum entitlement is designed to match the level of payment received under the existing system. For the exceptions to this,5 where maximum out-of-work entitlement under Universal Credit is lower than existing entitlements, existing claimants will be entitled to maintain their existing benefit levels (in nominal terms) so that they do not lose out due to the introduction of Universal Credit. This entitlement is not available to new claimants or to existing claimants if their circumstances change.
One of the key features of the UK’s move from Working Tax Credits/Child Tax Credits to Universal Credit is a shift in the balance towards limiting the effective combined taper rate that claimants could face if simultaneously on tax credits plus other means-tested benefits, and, on average, somewhat lower income supports at all levels.6 The net result is a small average impact on work incentives, but with large impacts for the small group currently with the weakest work incentives. The proposed implementation of this structural reform also involves substantial cuts in spending: in the long run, Universal Credit is expected to cut benefit spending by £5 billion per year (Hood and Waters, 2017). Thus the particular implementation of the UC structure is not simply a revenue-neutral restructuring of the system, but involves lower average resource levels for beneficiaries. The impact of the reform is quite diverse across different household types. Browne et al. (2016) estimate that 3.2 million households will see their benefit entitlements decrease, with an average loss of £1,800 per year. Some 2.2 million households are expected to gain, with an average increase of £1,400 per year.
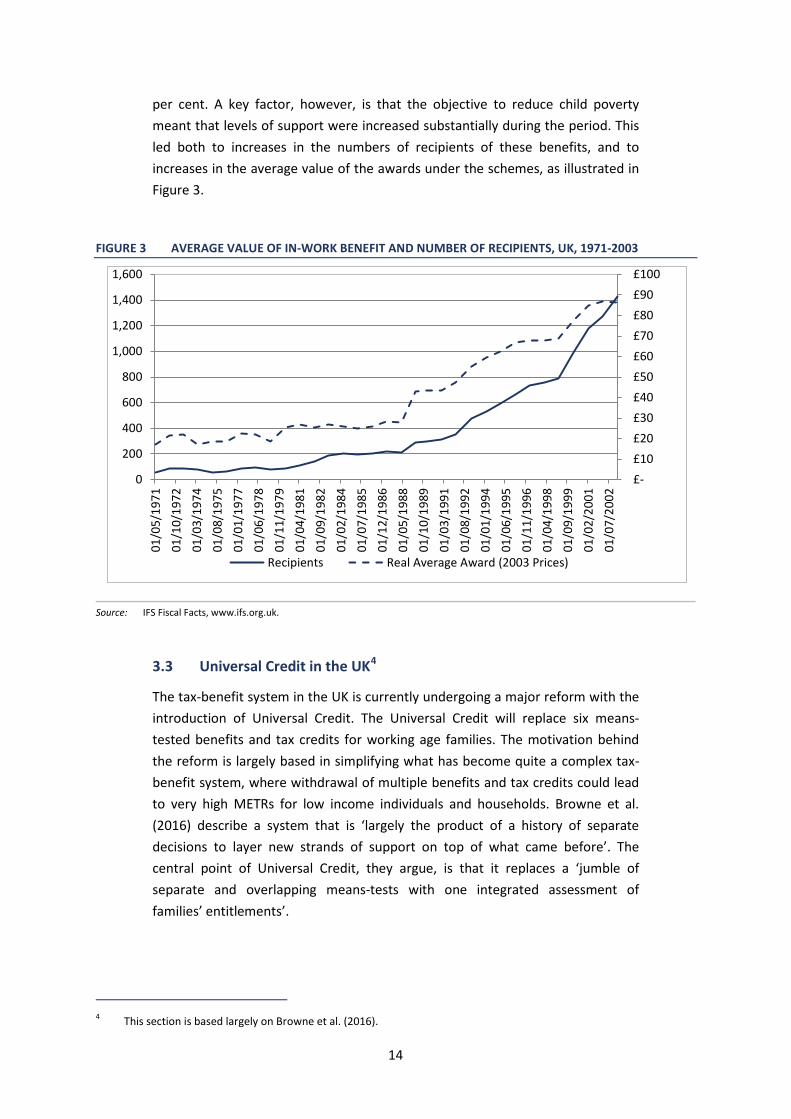
Figure 4 shows how the introduction of Universal Credit will affect a lone parent with two children under 5. At zero hours of work, Universal Credit provides an equivalent level of support as the existing system. Beyond three hours of work for this example case, the two systems differ significantly. Below 16 hours of work, Universal Credit is more generous than the current system. However, while the Working Tax Credit provided a ‘jump’ in the budget constraint at 16 hours, no
5 Key exceptions are: some disabled people due to restructuring of disability premia in out-of-work elements, and
couples where one member is above the ‘Pension Credit age’ and the other is below. 6 It also involved both administrative and non-financial changes including changes to conditionality for in-work
claimants, changes to rules about who in a household could receive the payment, changes in the frequency of payment, and a link to the real-time earnings information systems introduced by the revenue authorities.
16
such jump exists under Universal Credit, so that in this example the individual is worse off between 16 hours and full-time work.
FIGURE 4 BENEFIT ENTITLEMENTS UNDER EXISTING UK SYSTEM AND UNIVERSAL CREDIT: LONE PARENT WITH TWO CHILDREN
Source: Browne et al. (2016). Notes: Assumes two children aged under 5, no childcare costs, no unearned income, renting at the LHA rate in a median
rent area and paid the National Living Wage under the system we currently expect to be in place in 2019-2020. Ignores child benefit and council tax support.
While Figure 4 is based on a very specific example case, it makes clear the differences in design between Universal Credit and the existing tax-benefit system. The single withdrawal rate associated with the Universal Credit, initially set at 65 per cent and currently set at 63 per cent, removes the ‘jump’ in the budget constraint (at 16 hours for lone parents, 24 hours for couples with children or 30 hours for those without children) caused by the working tax credit. At the same time, very high METRs caused by the withdrawal of multiple benefits are removed. Analysing the impact of Universal Credit on a representative sample of the UK population, Browne et al. (2016) show that overall Universal Credit reduces the mean METR of workers receiving means-tested benefits from 62.2 per cent to 54.5 per cent. While there is substantial variation within the group depending on family composition, benefit entitlement and earnings, crucially from a work incentive point of view the highest METR possible for workers under Universal Credit is 76.2 per cent. This compares to some METRs close to 100 per cent under the existing UK system. Around 1 million workers in the UK who face METRs above this 76 per cent level under the existing system will therefore see a reduction in their METR due to the reform. Of course, many workers face an increase in their METRs due to the introduction of Universal Credit; these are largely workers who face relatively low METRs under the existing system.

17
In terms of its impact on the financial incentive to be in paid work, measured via the replacement rate and participation tax rate, again Universal Credit has very different effects on different groups of the population. Those with the highest PTRs under the existing system are again most likely to see a reduction in their PTR under Universal Credit. However, those with moderate PTRs under the existing system, on average, are most likely to see their financial incentive to be in paid work weaken.
Overall, despite the fact that Universal Credit will reduce the amount of in-work support for workers in the UK, the weakest incentives to work under the existing system are strengthened by the reform. Browne et al. (2016) regard the basic structural changes inherent in the design of Universal Credit as a ‘welcome simplification’ of what had become an overly complicated UK tax-benefit system.
4. SUPPORT FOR WORKING FAMILIES: IRISH EXPERIENCE AND POTENTIAL REFORMS
In Ireland, the Family Income Supplement (FIS) was introduced in large part as a response to the existence of high replacement rates for low-paid earners with children. Its primary aim, therefore, has been to ensure that incomes in work are significantly higher than incomes out of work for such families. Changes in the scheme over time, such as the increase in the multiplier/withdrawal rate and the removal of the maximum payment, have strengthened its role in providing a floor to incomes in work, which is above the income available if unemployed. Part of the trade-off for increasing this floor, without substantial increases in the cost of the scheme, has been an increase in effective marginal tax-cum-benefit-withdrawal rates facing such families.
There have been some developments in the structure of FIS which have helped to limit the impact on marginal effective tax rates. The change from assessment based on gross income to assessment based on income net of tax and PRSI helped to limit the METRs associated with the FIS scheme. Nevertheless, a comparison of in-work benefits in OECD countries (OECD, 2011) characterises the Irish system as one with a strong focus on poverty reduction,7 providing high levels of income support, and using a high withdrawal rate (METR) to limit the aggregate cost.
7 See Watson and Maître (2013) for an analysis of poverty over time in Ireland, with a particular focus of the impact of
the benefit system in reducing poverty levels.
18
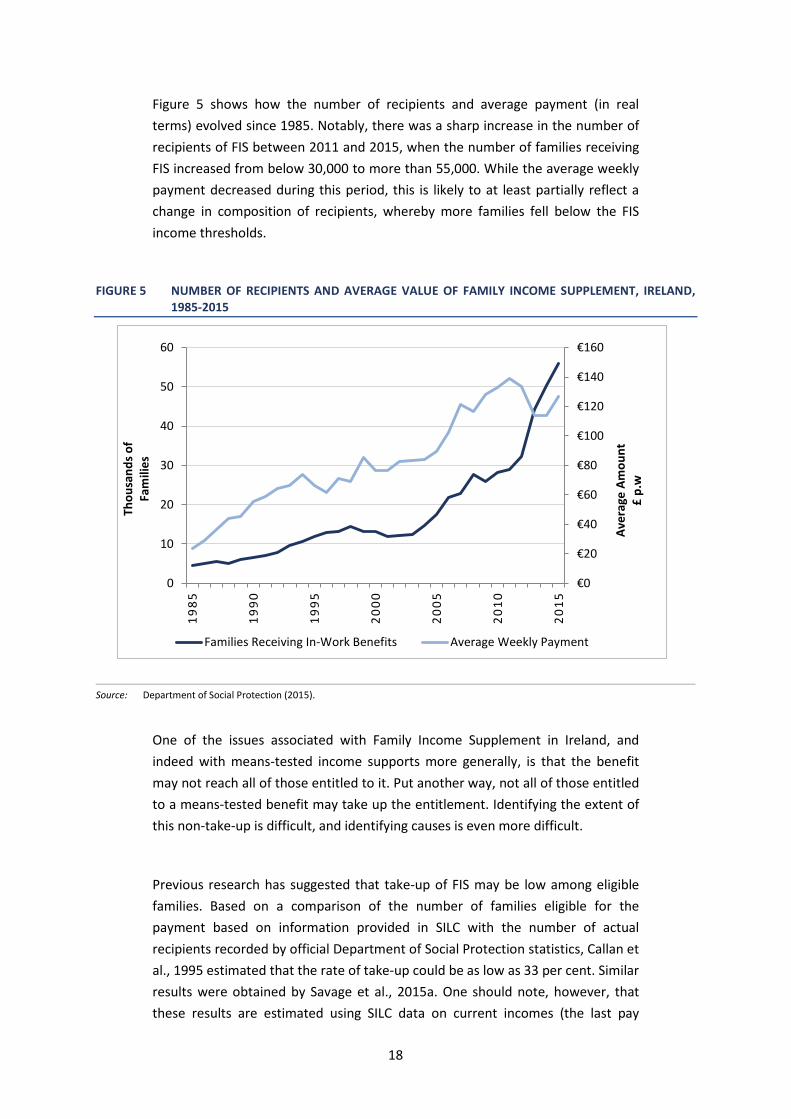
Figure 5 shows how the number of recipients and average payment (in real terms) evolved since 1985. Notably, there was a sharp increase in the number of recipients of FIS between 2011 and 2015, when the number of families receiving FIS increased from below 30,000 to more than 55,000. While the average weekly payment decreased during this period, this is likely to at least partially reflect a change in composition of recipients, whereby more families fell below the FIS income thresholds.
FIGURE 5 NUMBER OF RECIPIENTS AND AVERAGE VALUE OF FAMILY INCOME SUPPLEMENT, IRELAND, 1985-2015
Source: Department of Social Protection (2015).
One of the issues associated with Family Income Supplement in Ireland, and indeed with means-tested income supports more generally, is that the benefit may not reach all of those entitled to it. Put another way, not all of those entitled to a means-tested benefit may take up the entitlement. Identifying the extent of this non-take-up is difficult, and identifying causes is even more difficult.
Previous research has suggested that take-up of FIS may be low among eligible families. Based on a comparison of the number of families eligible for the payment based on information provided in SILC with the number of actual recipients recorded by official Department of Social Protection statistics, Callan et al., 1995 estimated that the rate of take-up could be as low as 33 per cent. Similar results were obtained by Savage et al., 2015a. One should note, however, that these results are estimated using SILC data on current incomes (the last pay
€0
€20
€40
€60
€80
€100
€120
€140
€160
0
10
20
30
40
50
60
1985
1990
1995
2000
2005
2010
2015
Aver
age
Amou
nt
£ p.
w
Thou
sand
s of
Fam
ilies
Families Receiving In-Work Benefits Average Weekly Payment

19
period, be it weekly or monthly). A study by Millward Brown for the DSP suggested much higher, and perhaps close to full take-up. This study was based instead on income for a full calendar year, as recorded by the tax authorities. However, our understanding is that the FIS assessment system uses both P60 and some months of recent payslips.8 Thus the true take-up figure is likely to lie between the estimate based on current income and that based on calendar year income.
It may be possible to come to a more precise picture of the extent of take-up or non-take-up when the real-time information systems envisaged by Revenue are put into place.
4.1 Potential reforms to Ireland’s in-work benefits
The previous sections examined how the trade-off between conflicting policy objectives has affected the design and reform of tax and welfare policy in the UK and US. In light of this discussion, in this section we examine how similar trade-offs can affect policy design in Ireland. We examine a number of hypothetical reforms to a major in-work benefit in Ireland and, using SWITCH, the ESRI tax-benefit model, show how reforms to the scheme can have conflicting effects on the distribution of income and financial work incentives.
In Ireland, the Family Income Supplement (FIS) is one of the primary in-work benefits for low income working families. The rules of the scheme are as follows: to be eligible to receive the benefit, a claimant must be working more than 38 hours per fortnight and must also have at least one child dependant. For couples, it is possible to combine the hours worked by both spouses/partners to reach the minimum hours requirement. For eligible claimants, FIS payments are then calculated as 60 per cent of the difference between the family’s net income and the relevant income limit for the family.9
The percentage rate applied to the difference between family income and the income limit performs two functions. First, it acts as a multiplier providing income support to low paid families by closing a portion of the gap between gross income and the income limit. Second, it also acts as a withdrawal rate which serves to gradually withdraw the benefit as net income gets closer to the income limit.
8 For applicants who recently entered employment, income is assessed based on average weekly income since starting
that employment. 9 In 2017, the FIS weekly income limits ranged between €511 for a family with one child to €1,308 to a family with
eight children.

20
Therefore, the higher the percentage rate applied, the more generous is the financial support offered, at the cost of increasing the amount of the benefit withdrawn for each additional Euro earned from employment.
To illustrate the trade-off between policy objectives in an Irish context, FIS therefore has two key parameters by which the balance between providing support to low income families and providing strong financial incentives to work can be altered. Reducing the multiplier/withdrawal rate will reduce METRs, thereby strengthening the incentive to progress in work. However, it would also reduce the level of support offered to low income recipients. Alternatively, the income limits can be changed; increasing the income limits, for example, would increase the support offered to low income families at the cost of increasing the income range over which FIS would be withdrawn. Some families’ METRs would then increase as the benefit is withdrawn, as would the overall cost of the scheme.
If it is the case that take-up of FIS is low – and we noted earlier that this is an open question, as current data sources are not well suited to answering it – then it is of interest to know what would happen if take-up could be increased. Efforts have already been made to advertise the existence of the scheme and encourage take-up. Further increases in the rate of take-up might, however, be possible if the new real-time information set to be gathered by Revenue could be used to streamline the application process or even make payments automatic.
We provide an initial assessment of the potential impact of non-take-up, which is subject to two main caveats. The first is simply the uncertainty surrounding the rate of take-up, as discussed above. The second is that our approach, at present, assigns take-up status randomly – results may differ if take-up is related to the size of the entitlement, for example.
4.2 Illustrative reforms to FIS: the balance between supporting low incomes and providing a financial incentive to work
In this section, we use SWITCH to examine a number of illustrative reforms to FIS. These reforms are not policy recommendations; they are hypothetical reforms to existing FIS parameters used to highlight how the trade-off between supporting low income families and providing a financial incentive to work can affect policy decisions in practice. The results presented below are based on cash or near-cash incomes and benefits. Non-cash benefits, such as the medical card, are not included in the analysis. See Savage et al. (2015b) for analysis of the impact of
21
medical cards on the financial incentive to work in Ireland, and O’Dea and Preston (2014) for discussion of valuing non-cash benefits in the UK.
The reforms we examine are as follows:
• Increasing the FIS income limits by €50 per week.
• A revenue neutral reform of FIS involving a €50 increase in the FIS income limits combined with a reduction in the FIS multiplier/withdrawal rate (to 46 per cent).
• Increasing the take-up of FIS to 100 per cent.
The final hypothetical ‘reform’ of increasing the take-up of FIS to 100 per cent is somewhat different to the other reforms analysed in that policymakers do not have direct control over the take-up of a scheme. However, developments currently under consideration in respect of real-time reporting of pay period information to Revenue may mean that FIS, or an alternative in-work payment, might in future be made payable on the basis of regularly supplied payroll information rather than requiring a specific application. This could raise the effective take-up rate substantially. For the moment, however, we abstract from how the take-up rate of the scheme could be increased, and analyse only how the increased take-up, if achieved, would impact the distribution of income and the financial incentive to work.
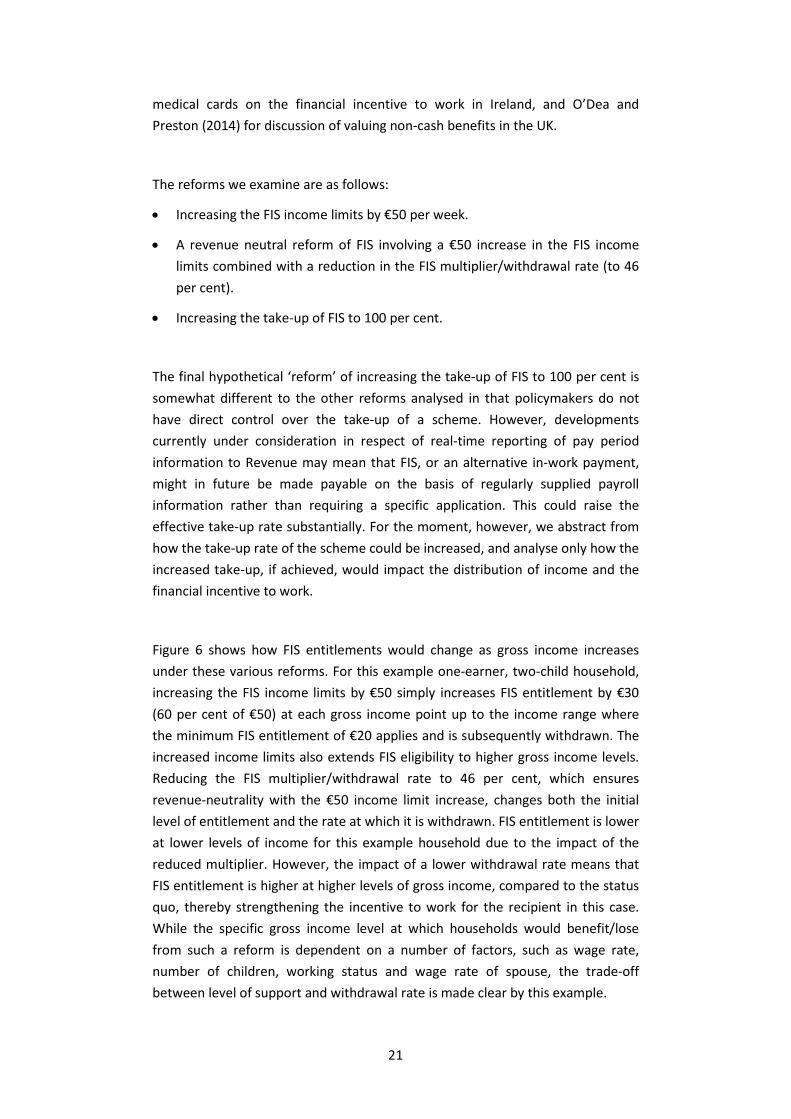
Figure 6 shows how FIS entitlements would change as gross income increases under these various reforms. For this example one-earner, two-child household, increasing the FIS income limits by €50 simply increases FIS entitlement by €30 (60 per cent of €50) at each gross income point up to the income range where the minimum FIS entitlement of €20 applies and is subsequently withdrawn. The increased income limits also extends FIS eligibility to higher gross income levels. Reducing the FIS multiplier/withdrawal rate to 46 per cent, which ensures revenue-neutrality with the €50 income limit increase, changes both the initial level of entitlement and the rate at which it is withdrawn. FIS entitlement is lower at lower levels of income for this example household due to the impact of the reduced multiplier. However, the impact of a lower withdrawal rate means that FIS entitlement is higher at higher levels of gross income, compared to the status quo, thereby strengthening the incentive to work for the recipient in this case. While the specific gross income level at which households would benefit/lose from such a reform is dependent on a number of factors, such as wage rate, number of children, working status and wage rate of spouse, the trade-off between level of support and withdrawal rate is made clear by this example.
22
FIGURE 6 FIS ENTITLEMENT UNDER CURRENT STRUCTURE AND HYPOTHETICAL REFORMS
Source: Authors’ calculations. Notes: Assumes a one-earner married couple, earner has wage of €10 per hour, two children under the age of seven, no
unearned income. Graph shows how FIS entitlement changes as earner increases hours of work.
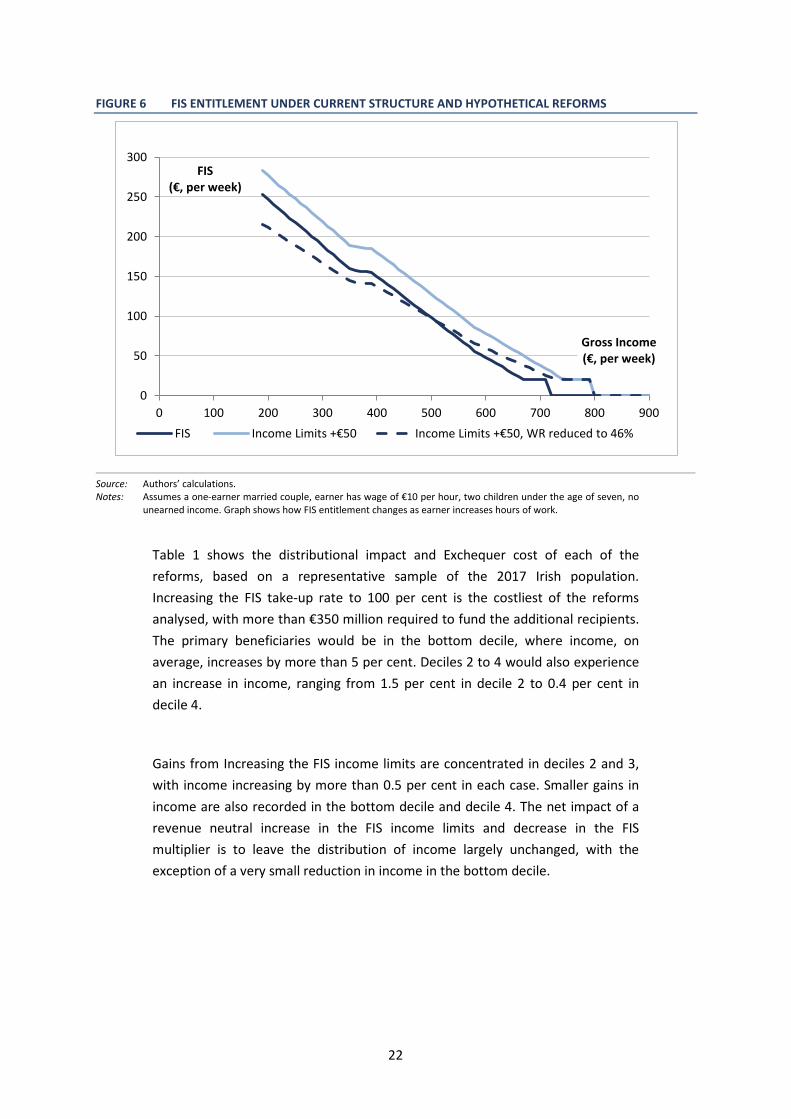
Table 1 shows the distributional impact and Exchequer cost of each of the reforms, based on a representative sample of the 2017 Irish population. Increasing the FIS take-up rate to 100 per cent is the costliest of the reforms analysed, with more than €350 million required to fund the additional recipients. The primary beneficiaries would be in the bottom decile, where income, on average, increases by more than 5 per cent. Deciles 2 to 4 would also experience an increase in income, ranging from 1.5 per cent in decile 2 to 0.4 per cent in decile 4.
Gains from Increasing the FIS income limits are concentrated in deciles 2 and 3, with income increasing by more than 0.5 per cent in each case. Smaller gains in income are also recorded in the bottom decile and decile 4. The net impact of a revenue neutral increase in the FIS income limits and decrease in the FIS multiplier is to leave the distribution of income largely unchanged, with the exception of a very small reduction in income in the bottom decile.
0
50
100
150
200
250
300
0 100 200 300 400 500 600 700 800 900
FIS (€, per week)
Gross Income (€, per week)
FIS Income Limits +€50 Income Limits +€50, WR reduced to 46%
23
TABLE 1 EXCHEQUER COST AND DISTRIBUTIONAL IMPACT OF HYPOTHETICAL FIS REFORMS – PERCENTAGE CHANGE IN HOUSEHOLD INCOME
Decile FIS 100% Take-up
FIS Income Limits +€50
Income Limit +€50, Withdrawal Rate reduced to 46%
Bottom 5.6 0.2 -0.1 2 1.5 0.7 0.0 3 0.8 0.5 0.0 4 0.4 0.3 0.0 5 0.1 0.0 0.0 6 0.0 0.0 0.0 7 0.0 0.0 0.0 8 0.0 0.0 0.0 9 0.0 0.0 0.0
Top 0.0 0.0 0.0 Exchequer Cost (€m) 353 97 0.0
Number of Recipients (families, 000s) 134 69 67
Source: Analysis based on SWITCH, the ESRI tax-benefit microsimulation model. Note: SWITCH estimates that approx. 60,000 families receive FIS in 2017, with an assumption of 33 per cent take-up.
This compares with DSP statistics indicating that approx. 56,000 families received FIS in 2015 (DSP (2015) – latest official statistics available).
The SWITCH model also allows us to examine the impact of these reforms on the financial incentive to work. First, we examine the impact on the financial incentive to be in paid work for unemployed jobseekers. We focus only on those with children, as these are the families that will be affected by reforms to FIS. Table 2 shows that increasing the take-up rate of FIS significantly improves the incentive to be in paid work for the first earner. The proportion of unemployed jobseekers in non-earning couples with a replacement rate of greater than 70 per cent falls from 60 per cent to 53 per cent. The proportion of the group with a very high replacement rate, greater than 90 per cent, falls from 22 per cent to just 6 per cent. Increasing the FIS income limits also reduces the risk of facing a high replacement rate for first earners, while the revenue neutral reform of increasing the income limits while reducing the multiplier leaves the overall distribution of replacement rates substantially unchanged.

24
TABLE 2 INCIDENCE (%) OF HIGH REPLACEMENT RATES UNDER HYPOTHETICAL FIS REFORMS – UNEMPLOYED JOBSEEKERS IN NON-EARNINGS COUPLES WITH CHILDREN
Replacement Rate 2017 FIS 100%
Take-up FIS Income Limits +€50
Income Limit +€50, Withdrawal Rate reduced to 46%
>70% 60 53 58 60 >80% 36 25 31 36 >90% 22 6 21 22 >100% 15 3 15 16
Source: Analysis based on SWITCH, the ESRI tax-benefit microsimulation model.
The impact of the same reforms on potential second earners in couples with children is quite different, as can be seen in Table 3. In this case, increasing the FIS take-up rate to 100 per cent significantly weakens the financial incentive to work for this group, with the proportion facing a replacement rate greater than 70 per cent increasing from 41 per cent to 55 per cent. This result is similar in nature to research on the EITC in the US discussed previously, and also has close parallels in the UK, where tax credits are good for the incentives of first earners but disimprove incentives facing (potential) second earners (Blundell and Hoynes, 2003). In-work benefits, like FIS, that are based on family income can weaken the financial incentive to work for the potential second earner as any additional income earned by the second earner is likely to be subject to benefit withdrawal from the first Euro. On the basis of similar results due to the EITC in the US, Eissa and Hoynes (2004) concluded that the EITC was effectively subsidising married mothers to stay at home. The other reforms have very little impact on the replacement rates of potential second earners, with the exception of the increased income limits significantly increasing the proportion of the group with a replacement rate above 100 per cent.
TABLE 3 INCIDENCE (%) OF HIGH REPLACEMENT RATES UNDER HYPOTHETICAL FIS REFORMS – UNEMPLOYED JOBSEEKERS IN ONE-EARNER COUPLES WITH CHILDREN
Replacement Rate 2017 FIS 100%
Take-up FIS Income Limits +€50
Income Limit +€50, Withdrawal Rate reduced to 46%
>70% 41 55 41 41 >80% 22 32 23 21 >90% 11 19 11 10
>100% 1 5 5 1
Source: Analysis based on SWITCH, the ESRI tax-benefit microsimulation model.
Turning our focus to the impact of the reforms on financial incentives to progress in work, Table 4 shows the clear trade-off between income support and providing work incentives to low income families with children. While increasing the FIS take-up rate to 100 per cent increased income significantly in the lowest deciles,
25
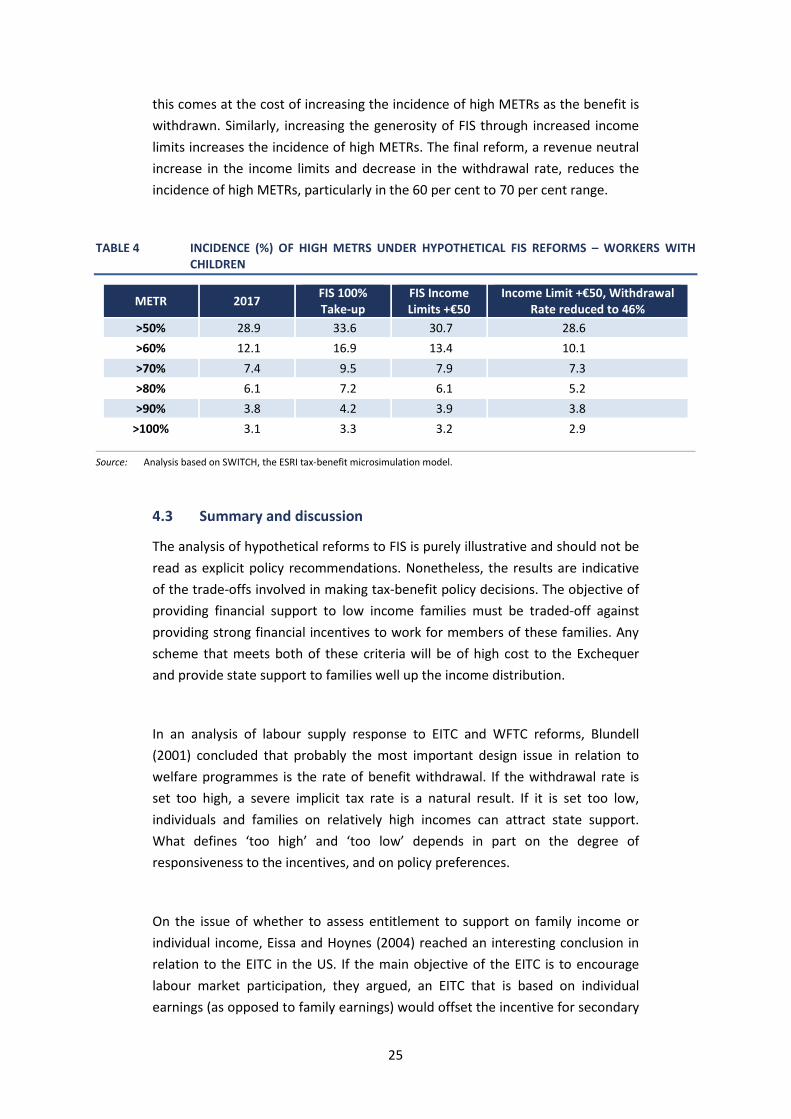
this comes at the cost of increasing the incidence of high METRs as the benefit is withdrawn. Similarly, increasing the generosity of FIS through increased income limits increases the incidence of high METRs. The final reform, a revenue neutral increase in the income limits and decrease in the withdrawal rate, reduces the incidence of high METRs, particularly in the 60 per cent to 70 per cent range.
TABLE 4 INCIDENCE (%) OF HIGH METRS UNDER HYPOTHETICAL FIS REFORMS – WORKERS WITH CHILDREN
METR 2017 FIS 100% Take-up
FIS Income Limits +€50
Income Limit +€50, Withdrawal Rate reduced to 46%
>50% 28.9 33.6 30.7 28.6 >60% 12.1 16.9 13.4 10.1 >70% 7.4 9.5 7.9 7.3 >80% 6.1 7.2 6.1 5.2 >90% 3.8 4.2 3.9 3.8
>100% 3.1 3.3 3.2 2.9
Source: Analysis based on SWITCH, the ESRI tax-benefit microsimulation model.
4.3 Summary and discussion
The analysis of hypothetical reforms to FIS is purely illustrative and should not be read as explicit policy recommendations. Nonetheless, the results are indicative of the trade-offs involved in making tax-benefit policy decisions. The objective of providing financial support to low income families must be traded-off against providing strong financial incentives to work for members of these families. Any scheme that meets both of these criteria will be of high cost to the Exchequer and provide state support to families well up the income distribution.
In an analysis of labour supply response to EITC and WFTC reforms, Blundell (2001) concluded that probably the most important design issue in relation to welfare programmes is the rate of benefit withdrawal. If the withdrawal rate is set too high, a severe implicit tax rate is a natural result. If it is set too low, individuals and families on relatively high incomes can attract state support. What defines ‘too high’ and ‘too low’ depends in part on the degree of responsiveness to the incentives, and on policy preferences.
On the issue of whether to assess entitlement to support on family income or individual income, Eissa and Hoynes (2004) reached an interesting conclusion in relation to the EITC in the US. If the main objective of the EITC is to encourage labour market participation, they argued, an EITC that is based on individual earnings (as opposed to family earnings) would offset the incentive for secondary

26
earners to leave the labour force. That option, however, could lead to scenarios whereby families with identical levels of earnings would receive different levels of state support, as well as increasing the cost of the scheme significantly.
A recent administrative reform in Ireland could have significant positive implications for the operation of FIS. The plan for the Office of the Revenue Commissioners to collect real-time information from employers regarding earnings – and possibly hours – for all of their staff develops potential for a benefit system that could automatically award in-work support based on real-time information. Currently, our understanding is that entitlement to FIS is determined on a hybrid of recent months’ payslips and income averaged over a 12-month period. From a research perspective, real-time information could provide for a more accurate and comprehensive analysis of take-up issues, which seem particularly relevant in light of the findings of the previous section of the paper.
5. CONCLUSION
Policymakers are faced with unavoidable trade-offs between levels of income support, the rate at which that support is withdrawn, and aggregate Exchequer costs. Over time and across countries the choices made in this respect have varied. In the UK and the US, in-work benefits have grown in scale, as policymakers have sought to provide sufficient income support, without imposing excessive marginal effective tax rates. More recent developments in the UK, with the proposed Universal Credit, suggest some scaling back of in-work benefits.
What of the options available to Irish policymakers? We examined a number of potential reforms. We suggest that the most fruitful direction for policy at present is to focus on the implementation of real-time reporting of payroll information. This will be of value both in diagnosing potential take-up problems related to the Family Income Supplement scheme, and in creating the infrastructure to support new and more efficient forms of in-work benefit. Experience elsewhere suggests that having the new infrastructure in place ahead of major policy reforms will work better than attempting to implement complex reforms while putting together such infrastructure.
27
BIBLIOGRAPHY Blundell, R. (2001). ‘Welfare Reform for Low Income Workers’, Oxford Economic Papers
53, 189-284.
Blundell, R. and H. Hoynes (2003). ‘Has ‘In-Work’ Benefit Reform Helped the Labor Market?’ in David Card, Richard Blundell and Richard B. Freeman (eds) Seeking a Premier Economy: The Economic Effects of British Economic Reforms, 1980-2000. NBER Book Series Comparative Labor Markets: University of Chicago Press.
Browne, J., A. Hood and R. Joyce (2016). ‘The (changing) effects of universal credit’, in Carl Emmerson, Paul Johnson and Robert Joyce (eds.) IFS Green Budget 2016 London: Institute for Fiscal Studies.
Callan, T., C. O’Dea, B. Roantree and M. Savage (2016). ‘Financial Incentives to Work: Comparing Ireland and the UK’, ESRI Budget Perspectives Series Paper 2, Dublin: The Economic and Social Research Institute.
Callan, T., C.J. O’Neill and C. O’Donoghue (1995). ‘Supporting Family Income’, ESRI Policy Research Series Dublin: Economic and Social Research Institute.
Collado, D., B. Cantillon, K. Van den Bosch, T. Goedemé and D. Vandelannoote (2017). ‘The end of cheap talk about poverty reduction: the cost of closing the poverty gap while maintaining work incentives’, Euromod Working Paper Series EM5/17.
DSP (2015). ‘Statistical Information on Social Welfare Services 2015’, Department of Social Protection, Dublin.
Eissa, N. and J.B. Liebman (1996). ‘Labor supply response to the Earned Income Tax Credit’, Quarterly Journal of Economics 111 (2): 605-37.
Eissa, N. and H. Hoynes (2004). ‘Taxes and the labor market participation of married couples: the earned income tax credit’, Journal of Public Economics 88 (2004) 1931- 1958.
Hood, A. and T. Waters (2017). ‘The impact of tax and benefit reforms on household incomes’, IFS Briefing Note BN196, https://www.ifs.org.uk/publications/9164.
Hotz, V. J, and J.K. Scholz (2003). ‘The Earned Income Tax Credit’, in Robert A. Moffit (ed) Means-Tested Transfer Programs in the United States National Bureau of Economic Research, London: University of Chicago Press.
Hotz, V.J., C.H. Mullin and J.K. Scholz (2002). ‘Welfare, employment, and income: Evidence on the effects of benefit reductions from California’, American Economic Review Papers and Proceedings (May): 380-84.
Keane, M. and R. Moffitt (1998). ‘A structural model of multiple welfare program participation and labor supply’, International Economic Review 39 (3): 553-89.
Meyer, B.D. and D.T. Rosenbaum (2000). ‘Making single mothers work: Recent tax and welfare policy and its effects’, National Tax Journal 53 (4, part 2): 1027-61.
28
Meyer, B.D. and D.T. Rosenbaum (2001). ‘Welfare, the Earned Income Tax Credit, and the labor supply of single mothers’, Quarterly Journal of Economics 116 (3): 1063-1114.
O’Dea, C. and I. Preston (2014). ‘Can We Measure Who Loses Most from Public Service Spending Cuts?’, ESRI Budget Perspectives Series Paper 2, Dublin: The Economic and Social Research Institute.
OECD (2011). Taxation and Employment, OECD Tax Policy Studies, No. 21, OECD Publishing. http://dx.doi.org/10.1787/9789264120808-en.
Savage, M., T. Callan and J.R. Walsh (2015a). ‘A Profile of Financial Incentives to Work in Ireland’, Journal of the Statistical and Social Inquiry Society of Ireland Vol.44, 2014-5, pp. 124-140.
Savage, M., T. Callan, B. Colgan and J.R. Walsh (2015b). ‘Making Work Pay More: Recent Initiatives’, ESRI Budget Perspectives 2016, Paper 2, Dublin: The Economic and Social Research Institute.
Watson, D. and B. Maître (2013). Social Transfers and Income poverty Alleviation in Ireland: An Analysis of the Survey on Income and Living Conditions 2004 -2011, Dublin: ESRI and Department of Social Protection.

Whitaker Square, Sir John Rogerson’s Quay, Dublin 2Telephone +353 1 863 2000Email [email protected] www.esri.ieTwitter @ESRIDublin