
SUPPORT DOCUMENTS FOR THE GRADE SOUTH CAROLINA ACADEMIC...
59
SUPPORT DOCUMENTS FOR THE GRADE 5 SOUTH CAROLINA ACADEMIC STANDARDS AND PERFORMANCE INDICATORS FOR SCIENCE Mick Zais, Ph.D. State Superintendent of Education South Carolina Department of Education Columbia, South Carolina 1
Transcript of SUPPORT DOCUMENTS FOR THE GRADE SOUTH CAROLINA ACADEMIC...

SUPPORT DOCUMENTS FOR THE GRADE 5
SOUTH CAROLINA ACADEMIC STANDARDS AND PERFORMANCE INDICATORS
FOR SCIENCE
Mick Zais, Ph.D. State Superintendent of Education
South Carolina Department of Education
Columbia, South Carolina
1

Contents
Acknowledgements ......................................................................................................................... 3 Introduction ..................................................................................................................................... 4
Grade 5 Academic Standards and Performance Indicators for Science
5.P.2 – Physical Science: Matter and Mixtures ............................................................................. 10 5.E.3 - Earth Science: Changes in Landforms and Oceans ........................................................... 24 5.P.4. – Life Science: Interdependent Relationships in Ecosystems ............................................. 37 5.P.5. – Physical Science: Forces and Motion .............................................................................. 50
2

ACKNOWLEDGEMENTS South Carolina owes a debt of gratitude to the following individuals for their assistance in the development of the Grade 5 Curriculum Support Guide for the South Carolina Academic Standards and Performance Indicators for Science. SOUTH CAROLINA DEPARTMENT OF EDUCATION The explication of the standards and performance indicators included in this document were developed under the direction of Dr. Cindy Van Buren, Deputy Superintendent, Division of School Effectiveness, Dr. Briana Timmerman, Director, Office of Instructional Practices and Evaluations, and Cathy Jones Stork, Team Leader, Office of Instructional Practices and Evaluations. The following South Carolina Department of Education (SCDE) staff members facilitated development and revision of this document:
Dr. Regina E. Wragg Education Associate Office of Instructional Practices and Evaluations Dr. Deanna Boyd Education Associate Office of Instructional Practices and Evaluations
GRADE 5 CURRICULUM DOCUMENT DEVELOPMENT TEAM The following SC Educators collaborated with the SCDE to develop and draft the Curriculum Support Guide for the South Carolina Academic Standards and Performance Indicators for Science, and their efforts and input are appreciated. Kelli Bellant, Coordinator (Clarendon 2) Bronwen Bethea (Charleston) Cleva Garner (Greenwood) Amanda Williamson (Clarendon 2) Debbie Bishop, Coordinator (Laurens 55) Jason Osborne, Template Keeper (Beaufort) Amy Elkins (Barnwell 45) Barbara Koch (Anderson 5)
Kelly Morse (Saluda) Mina Brooks, Coordinator (Newberry) Jami Cummings, Template Keeper (Spartanburg 7) Anna MacDermut (EdVenture) Tammy Martin (Horry) Mary Robinson (Orangeburg 5) Mirandi O. Squires (Florence 5)
CURRICULUM DOCUMENT REVISION TEAM The following SC Educators collaborated with the SCDE to review, revise and compile the Curriculum Support Guides for the South Carolina Academic Standards and Performance Indicators for Science, and their time, service and expertise are appreciated. Ed Emmer (Richland 2) Tonya Smith (Richland 1) Michelle Spigner (Richland 2) Michael Carothers (Lexington/Richland 5) Jennifer McLeod (Richland 2) Kelli Bellant (Clarendon 2) Chris White (Oconee)
Dana S. Hutto (Lexington 2) Susan Rhodes (Florence 1) Kourtney Shumate (Darlington) Debbie Bishop (Laurens 55) Dominique Ragland (Dorchester 2) Doreen Gallant Green (Williamsburg)
3

The SCDE would like to acknowledge the following members from the Office of Assessment at the South Carolina Department of Education (SCDE) for their expertise and assistance with the development of this document: Dr. Kirsten Hural, Education Associate Amelia Brailsford, Education Associate The SCDE also wishes to thank staff from the Southwest Education Development Laboratory (SEDL) for their assistance with the development of this document: Don Doggett, Program Associate Dr. Sandra Enger, Program Consultant
4

INTRODUCTION Local districts, schools and teachers may use this document to construct standards-based science curriculum, allowing them to add or expand topics they feel are important and to organize content to fit their students’ needs and match available instructional materials. The support document includes essential knowledge, extended knowledge, connections to previous and future knowledge, and assessment recommendations. Educators may use a feedback form until October 31, 2014 to constructively critique this document and suggest resources and instructional strategies for each performance indicator (see pg. 9). ACADEMIC STANDARDS In accordance with the South Carolina Education Accountability Act of 1998 (S.C. Code Ann. § 59-18-110), the purpose of academic standards is to provide the basis for the development of local curricula and statewide assessment. Consensually developed academic standards describe for each grade and high school core area the specific areas of student learning that are considered the most important for proficiency in the discipline at the particular level. Operating procedures for the review and revision of all South Carolina academic standards were jointly developed by staff at the State Department of Education (SCDE) and the Education Oversight Committee (EOC). According to these procedures, a field review of the first draft of the revised South Carolina science standards was conducted from March through May 2013. Feedback from that review and input from the SCDE and EOC review panels was considered and used to develop these standards. The academic standards in this document are not sequenced for instruction and do not prescribe classroom activities; materials; or instructional strategies, approaches, or practices. The South Carolina Academic Standards and Performance Indicators for Science is not a curriculum. STATEWIDE ASSESSMENT The science standards and performance indicators for grades four through eight will be used as the basis for the development and/or refinement of questions on the South Carolina Palmetto Assessment of State Standards (SC-PASS) in science. The SC-PASS is based on the broad standards that address the life, earth, and physical science core content at each grade level. Test questions will measure the practice and/or the core content of the performance indicator. In addition, most performance indicators may be assessed with items that utilize any of the science and engineering practices. For example, an assessment item for a performance indicator that requires students to construct explanations may also ask students to use other practices such as asking questions, using models, or analyzing data around the core content in the original indicator. Items may also assess students’ understanding of the core content without a science and engineering practice. The high school course standards and performance indicators for Biology 1 will be used as the basis for the state-required End-of-Course Examination Program (EOCEP) for Biology 1.
5

GRADE 5 OVERVIEW In grades three through five, the standards and performance indicators for the science and engineering practices and core science content emphasize students becoming more sophisticated in describing, representing or explaining concepts or ideas. Students use their experiences from structured investigations in kindergarten through grade two to begin planning their own investigations to answer scientific questions. The seven core concepts (patterns; cause and effect; scale, proportion, and quantity; systems and system models; energy and matter; structure and function; and stability and change) are reinforced in the appropriate context of the core science content through hands-on instruction in the classroom. These academic standards and performance indicators establish the practices and core content that South Carolina’s students should know and be able to do by the end of grade five. The four core areas of the grade five standards include:
• Matter and Mixtures • Changes in Landforms and Oceans • Forces and Motion • Interdependent Relationships in Ecosystems
The eight science and engineering practices describe how students should learn and demonstrate knowledge of the content outlined in the content standards. Engaging in these practices will help students become scientifically literate and astute consumers of scientific information. Students should engage in scientific and engineering practices as a means to learn about the specific topics identified for their grade level. It is critical that educators understand the Science and Engineering Practices are not to be taught in isolation. There should not be a distinct “Inquiry” unit at the beginning of each school year. Rather, the practices need to be employed within the content for each grade level.
6

DECIPHERING THE STANDARDS
Figure 1: Example from the Kindergarten Curriculum Standards The code assigned to each performance indicator within the standards is designed to provide information about the content of the indicator. For example, the K.L.2A.1 indicator decodes as the following--
• K: The first part of each indicator denotes the grade or subject. The example
indicator is from Kindergarten. The key for grade levels are as follows— K: Kindergarten 1: First Grade 2: Second Grade 3: Third Grade 4: Fourth Grade 5: Fifth Grade 6: Sixth Grade
7: Seventh Grade 8: Eighth Grade H.B: High School Biology 1 H.C: High School Chemistry 1 H.P: High School Physics 1 H.E: High School Earth Science
7

• L: After the grade or subject, the content area is denoted by an uppercase letter. The
L in the example indicator means that the content covers Life Science. The key for content areas are as follows— E: Earth Science EC: Ecology L: Life Science P: Physical Science S: Science and Engineering Practices
• 2: The number following the content area denotes the specific academic standard. In the example, the 2 in the indicator means that it is within the second academic standard with the Kindergarten science content.
• A: After the specific content standard, the conceptual understanding is denoted by an uppercase letter. The conceptual understanding is a statement of the core idea for which students should demonstrate understanding. There may be more than one conceptual understanding per academic standard. The A in the example means that this is the first conceptual understanding for the standard.
• 1: The last part of the code denotes the number of the specific performance indicator. Performance indicators are statements of what students can do to demonstrate knowledge of the conceptual understanding. The example discussed is the first performance indicator within the conceptual understanding.
FORMAT OF THE CURRICULUM SUPPORT DOCUMENT The format of this document is designed to be structurally uniformed for each of the academic standards and performance indicators. For each, you will find the following sections--
• Standard o This section provides the standard being explicated.
• Conceptual Understanding o This section provides the overall understanding that the student should possess as
related to the standard. • Performance Indicator
o This section provides a specific set of content with an associated science and engineering practice for which the student must demonstrate mastery.
• Assessment Guidance o This section provides guidelines for educators and assessors to check for student
mastery of content utilizing interrelated science and engineering practices. • Previous and Future Knowledge
o This section provides a list of academic content along with the associated academic standard that students will have received in prior or will experience in future grade levels. Please note that the kindergarten curriculum support document does not
8

contain previous knowledge. Additionally, although the high school support document may not contain future knowledge, this section may list overlapping concepts from other high school science content areas.
• Essential Knowledge o This section illustrates the knowledge of the content contained in the performance
indicator for which it is fundamental for students to demonstrate mastery. Mastery of the information in the Essential Knowledge section is measured by state-wide assessments in grades four-eight and high school biology 1.
• Extended Knowledge o This section provides educators with topics that will enrich students’ knowledge
related to topics learned with the explicated performance indicator. • Science and Engineering Practices
o This section lists the specific science and engineering practice that is paired with the content in the performance indicator. Educators should reference the chapter on this specific science and engineering practice in the Science and Engineering Practices Support Guide.
EVALUATING THE SUPPORT DOCUMENTS As part of the development process, the SCDE would like to give the education community an opportunity to provide constructive feedback on the support documents including the grade/subject curriculum guides, 2005 to 2014 indicator crosswalks, and Science and Engineering Practices Guide. You may provide your comments or suggest curriculum resources by accessing the Academic Standards and Performance Indicators for Science 2014 Support Document Feedback Form which is available online—
https://adobeformscentral.com/?f=-fVAZrJqa9jZezpijXmmRg You will be able to share only one comment per submission, but you may refresh the form to submit additional comments. The feedback form will close at noon on Oct. 31, 2014. If you have questions regarding this process, please contact Dr. Regina E. Wragg at 803-734-0564 or [email protected].
9

GRADE 5 SCIENCE SUPPORT DOCUMENT
Standard 5.P.2: The student will demonstrate an understanding of the physical properties of matter and mixtures. Conceptual Understanding 5.P.2A Matter is made up of particles that are too small to be seen. Even though the particles are very small, the movement and spacing of these particles determines the basic properties of matter. Performance Indicator 5.P.2A.1 Analyze and interpret data from observations and measurements of the physical properties of matter (including volume, shape, movement, and spacing of particles) to explain why matter can be classified as a solid, liquid or gas. Assessment Guidance The objective of this indicator is to analyze and interpret data from observations and measurements of the physical properties of matter (including volume, shape, movement, and spacing of particles) to explain why matter can be classified as a solid, liquid or gas. Therefore, the primary focus of assessment should be for students to analyze and interpret data from informational texts, observations, measurements, or investigations using a range of methods (such as tabulation or graphing) to reveal patterns and construct meaning, or support hypotheses, explanations, claims, or designs to explain why matter is classified as a solid, liquid or gas. This could include, but is not limited to students being challenged to observe and investigate the properties of solids, (volume, shape, movement, and spacing) of particles like cubes, blocks, balls, etc., then the students will use the data collected (evidence) to explain why a cube or block or ball is a solid. Students should continue by observing and investigating the properties of liquids, then gases. In addition to analyzing and interpreting data from observations and measurements, students should ask questions and plan and carry out investigations; use mathematics and computational thinking; engage in argument from evidence and construct explanations; develop and use models; construct devices or design solutions. Previous and Future Knowledge
• K.P.4 Properties of Matter • 3.P.2 Properties of Matter • 7.P.2 Properties of Matter • 2.P.3 Solids, Liquids, Gases
Essential Knowledge It is essential for students to analyze and interpret data demonstrating that matter is anything that has mass and volume. All matter is made up of very small particles too small to be seen. Even though these particles are very small, they give matter its basic properties. Solids, liquids, and gases can be compared based on their physical properties (including volume, shape, and the movement/spacing of particles): Solids
10
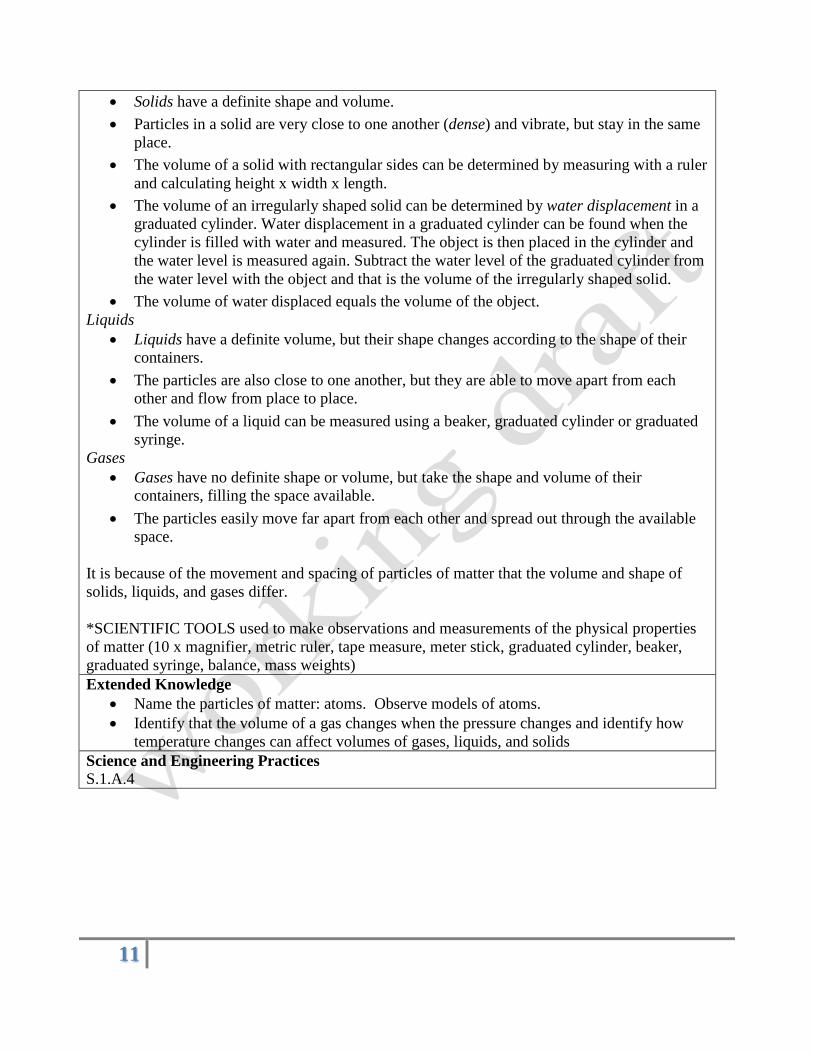
• Solids have a definite shape and volume. • Particles in a solid are very close to one another (dense) and vibrate, but stay in the same
place. • The volume of a solid with rectangular sides can be determined by measuring with a ruler
and calculating height x width x length. • The volume of an irregularly shaped solid can be determined by water displacement in a
graduated cylinder. Water displacement in a graduated cylinder can be found when the cylinder is filled with water and measured. The object is then placed in the cylinder and the water level is measured again. Subtract the water level of the graduated cylinder from the water level with the object and that is the volume of the irregularly shaped solid.
• The volume of water displaced equals the volume of the object. Liquids
• Liquids have a definite volume, but their shape changes according to the shape of their containers.
• The particles are also close to one another, but they are able to move apart from each other and flow from place to place.
• The volume of a liquid can be measured using a beaker, graduated cylinder or graduated syringe.
Gases • Gases have no definite shape or volume, but take the shape and volume of their
containers, filling the space available. • The particles easily move far apart from each other and spread out through the available
space. It is because of the movement and spacing of particles of matter that the volume and shape of solids, liquids, and gases differ. *SCIENTIFIC TOOLS used to make observations and measurements of the physical properties of matter (10 x magnifier, metric ruler, tape measure, meter stick, graduated cylinder, beaker, graduated syringe, balance, mass weights) Extended Knowledge
• Name the particles of matter: atoms. Observe models of atoms. • Identify that the volume of a gas changes when the pressure changes and identify how
temperature changes can affect volumes of gases, liquids, and solids Science and Engineering Practices S.1.A.4
11

Standard 5.P.2: The student will demonstrate an understanding of the physical properties of matter and mixtures. Conceptual Understanding 5.P.2B. A mixture is formed when two or more kinds of matter are put together. Sometimes when two or more different substances are mixed together, a new substance with different properties may be formed but the total amount (mass) of the substances is conserved. Solutions are a special type of mixture in which one substance is dissolved evenly into another substance. When the physical properties of the components in a mixture are not changed, they can be separated in different what happens to the properties of substances when two or more substances are mixed together physical ways. Performance Indicator 5.P.2B.1 Obtain and communicate information to describe what happens to the properties of substances when two or more substances are mixed together. Assessment Guidance The objective of this indicator is to obtain and communicate information to describe what happens to the properties of substances when two or more substances are mixed together. Therefore, the primary focus of assessment should be for students to obtain and evaluate informational texts, observations, data collected, or discussions to generate and answer questions, understand phenomena, develop models, or support hypotheses, explanations, claims, or designs. Students should communicate their observations and explanations using the conventions and expectations of oral and written language to describe the characteristics of mixtures. This could include, but is not limited to students being challenged to find evidence that explains what happens to the properties of a substance when two or more substances are mixed together. For example mix ingredients to create a mixture: trail mix. Students obtain information from both informational texts and investigations to what happens to the properties of the ingredients mixed together. In addition to obtaining and communicating information, students should be asked to ask questions and plan and carry out investigations; analyze and interpret data and use mathematics and computational thinking; engage in argument from evidence and construct explanations; develop and use models; construct devices or design solutions. Previous and Future Knowledge
• 2.P.3 Mixtures • 7.P.2 Mixtures
Essential Knowledge It is essential for students to obtain and communicate information stating the characteristics of solutions and mixtures. Mixtures
• Mixtures are composed of two or more substances that are mixed together, but can be separated from each other.
• Mixtures can be made from various combinations of solids, liquids, or gases. o Examples of mixtures of solids, could include: trail mix, chef salad, a bucket of
gravel and sand o Examples of mixtures of solids and liquids, could include: salt water solution, sun
12

tea, mud o Examples of mixtures of liquids, could include oil and vinegar salad dressing o Examples of mixtures of liquids and gases, could include carbonated soft drinks
• The substances in a mixture do not permanently change in the mixture, but they keep their separate properties.
Solutions • They are composed of substances that mix so completely that they cannot be
distinguished as separate substances, however, they can be separated back into separate substances
• Examples of easy to make solutions could include: sun tea, flavored drink mix, salt water, sugar water, indigestion medicine tablet added to water
Students will analyze and interpret data to support claims that when two substances are mixed, the total amount (mass) of the substances does not change. It may be useful to collaboratively teach 5.P.2B.2, and 5.P.2B.3 along with this standard. Students will develop models to describe mixtures, so you may find it useful to reuse mixtures created with this standard. Extended Knowledge
• Classify mixtures as heterogeneous or homogeneous • recall that they can be distinguished from elements and compounds
Science and Engineering Practices S.1.A.8
13

Standard 5.P.2: The student will demonstrate an understanding of the physical properties of matter and mixtures. Conceptual Understanding 5.P.2B A mixture is formed when two or more kinds of matter are put together. Sometimes when two or more different substances are mixed together, a new substance with different properties may be formed but the total amount (mass) of the substances is conserved. Solutions are a special type of mixture in which one substance is dissolved evenly into another substance. When the physical properties of the components in a mixture are not changed, they can be separated in different physical ways. Performance Indicator 5.P.2B.2 Analyze and interpret data to support claims that when two substances are mixed the total amount (mass) of the substances does not change. Assessment Guidance The objective of this indicator is to analyze and interpret data to support claims that when two substances are mixed, the total amount (mass) of the substances does not change. Therefore, the primary focus of assessment should be for students to analyze and interpret data from informational texts, observations, measurements, or investigations using a range of methods (such as tabulation or graphing) to reveal patterns and construct meaning, or support hypotheses, explanations, claims, or designs that support the claim that the amount (mass) of matter does not change when two substances are mixed together, only rearranged to form new substances. This could include but is not limited to students being challenged to create a mixture, for example, homemade trail mix. Initially, students should measure the mass of each ingredient, record the data, and then add those measurements together. Students will create the mixture, and then measure the mass of the mixture. The students will compare calculations from before, then after creating the mixture; the calculations should be the same mass. Students will analyze the data and to construct an explanation that supports their findings. In addition to analyzing and interpreting data from observations and measurements, students should ask questions and plan and carry out investigations; use mathematics and computational thinking; engage in argument from evidence and construct explanations; develop and use models; construct devices or design solutions. Previous and Future Knowledge
• 7.P.2 Law of Conservation of Matter Essential Understanding It is essential for students to analyze and interpret data that demonstrates the amount (mass) of matter does not change when two substances are mixed together, only rearranged to form new substances.
• Matter can neither be created nor destroyed, but can be changed in form. • Because matter is neither created nor destroyed, the total mass of the materials before
mixing materials together is the same as the total mass of materials after they are mixed together with some exceptions. (i.e. when an Alka-Seltzer® tablet is mixed with water the total mass will not equal the mass before mixing because some of the mass has been changed into a gas.)
• For example, when making pancakes, you combine ingredients (flour, baking soda, salt,
14

sugar, milk, eggs, and butter) to create pancakes, but you do not create more ingredients, you just mix them together to form a new substance, pancakes.
Students will obtain and communicate information to describe what happens to the properties of substances when two or more substances are mixed together with 5.P.2B.1, and will analyze and interpret data to support claims that when two substances are mixed the total amount (mass) of the substances does not change with 5.P.2B.3, so you may find it useful to teach these standards collaboratively in order to reuse mixtures. *SCIENTIFIC TOOLS used to show evidence that when two substances are mixed the total amount (mass) of the substances does not change (balance, mass weights) Extended Knowledge
• Identify simple chemical symbols (H2O---water, NaCl---salt) • Observe simple balanced chemical equations; recognize that an equation is balanced • Law of Conservation of Matter
Science and Engineering Practices S.1.A.4
15

Standard 5.P.2: The student will demonstrate an understanding of the physical properties of matter and mixtures. Conceptual Understanding 5.P.2B A mixture is formed when two or more kinds of matter are put together. Sometimes when two or more different substances are mixed together, a new substance with different properties may be formed but the total amount (mass) of the substances is conserved. Solutions are a special type of mixture in which one substance is dissolved evenly into another substance. When the physical properties of the components in a mixture are not changed, they can be separated in different physical ways. Performance Indicator 5.P.2.B.3 Develop models using observations to describe mixtures, including solutions, based on their characteristics. Assessment Guidance The objective of this indicator is to develop models using observations to describe mixtures, including solutions, based on their characteristics. Therefore, the primary focus of assessment should be for students to construct 2-D drawings/diagrams and 3-D models to represent and explain phenomena and use simulations to investigate the characteristics of mixtures and solutions. This could include but is not limited to students developing a model of mixtures, like trail mix and pancakes and solutions, like flavored drink mix, sun tea, and salt water. In addition to developing models, students should ask questions; plan and carry out investigations; analyze and interpret data; use mathematics and computational thinking; engage in argument from evidence; construct explanations; obtain, evaluate, and communicate information; construct devices or define solutions. Previous and Future Knowledge
• 2.P.3 Mixtures • 7.P.2 Mixtures
Essential Knowledge Mixtures created while obtaining information from 5.P.2.B.1 (trail mix, flavored drink mix, etc.) and analyzing mixtures from 5.P.2.B.2 (pancakes, etc.) could be duplicated. It is essential for students to develop models demonstrating the characteristics of mixtures and solutions.
• Mixtures are composed of two or more substances that are mixed together but can be separated from each other.
• Solutions are composed of substances that mix so completely that they cannot be distinguished as separate substances.
• Students should create functional models of mixtures and solutions • Functional models describe how something works and can include simple diagrams and
simulations o Examples of mixtures could include: Trail Mix, fruit salad, chef salad o Examples of solutions could include: flavored drink mixes, salt water, sugar
water, sun tea Extended Knowledge
16

• Identify that mixtures can be heterogeneous or homogeneous or that they can be distinguished from elements and compounds.
Science and Engineering Practices S.1.A.2
17

Standard 5.P.2: The student will demonstrate an understanding of the physical properties of matter and mixtures. Conceptual Understanding 5.P.2B A mixture is formed when two or more kinds of matter are put together. Sometimes when two or more different substances are mixed together, a new substance with different properties may be formed but the total amount (mass) of the substances is conserved. Solutions are a special type of mixture in which one substance is dissolved evenly into another substance. When the physical properties of the components in a mixture are not changed, they can be separated in different physical ways. Performance Indicator 5.P.2B.4 Construct explanations for how the amount of solute and the solvent determine the concentration of a solution. Assessment Guidance The objective of this indicator is to construct explanations for how the amount of solute and the solvent determine the concentration of a solution. Therefore, the primary focus of assessment should be for students to construct explanations of phenomena using scientific evidence and models, conclusions from scientific investigations, predictions based on observations and measurements, or data communicated in graphs, tables, or diagrams using oral and written language to explain that solutions are types of mixtures, and are defined by the particles in them. This could include, but is not limited to students being challenged to make and observe a variety of student-generated solutions flavored drink mixes at different concentrations of powder and water. Students will collect qualitative (color, taste, smell) and quantitative data (amount of powder, amount of water) on concentrations. Their data will be organized in a table and/or diagrams to depict the data they collected. Students will use the data to construct explanations for how the amount of solute and the solvent determine the concentration of a solution. In addition to constructing explanations, students should ask questions and plan and carry out investigations; analyze and interpret data; use mathematics and computational thinking; engage in argument from evidence; obtain and communicate information and develop and use models; construct devices or design solutions. Previous and Future Knowledge
• H.C.5 Solute, Solution, Concentrations Essential Knowledge It is essential for students to construct explanations stating that solutions are types of mixtures and that they are defined by the particles in them.
• The substance in a solution that has the greatest amount is the solvent. It is usually the liquid.
• The substance in a solution that has the least amount is the solute. It is usually the solid. The relationship of the amount of solute to solvent determines the concentration of a solution.
• The more solute a solution has compared to the amount of solvent, the more concentrated it is said to be.
• When two solutions contain the same amount of solvent, the one with the greater amount of solute is the more concentrated solution
• In order to make a solution more concentrated, more solute is added.
18

• To make a solution less concentrated, more solvent is added. *SCIENTIFIC TOOLS used to measurement solute and solvents (measuring cups/spoons, beaker, graduated cylinder, graduated syringe) Extended Knowledge
• Identify specific quantitative relationships (ratios) of solutes and solvents in specific percent concentrations for solutions.
Science and Engineering Practices S.1A.6
19

Standard 5.P.2: The student will demonstrate an understanding of the physical properties of matter and mixtures. Conceptual Understanding 5.P.2B A mixture is formed when two or more kinds of matter are put together. Sometimes when two or more different substances are mixed together, a new substance with different properties may be formed but the total amount (mass) of the substances is conserved. Solutions are a special type of mixture in which one substance is dissolved evenly into another substance. When the physical properties of the components in a mixture are not changed, they can be separated in different physical ways. Performance Indicator 5.P.2B.5 Conduct controlled scientific investigations to test how different variables (including temperature change, particle size, and stirring) affect the rate of dissolving. Assessment Guidance The objective of this indicator is to conduct investigations to test how different variables (including temperature change, particle size, and stirring) affect the rate of dissolving. Therefore, the primary focus of assessment should be for students to conduct controlled scientific investigations to answer questions, test hypotheses and predictions, and develop explanations. Students should formulate scientific questions and testable hypotheses; identify materials, procedures, and variables; select and use appropriate tools or instruments to collect qualitative and quantitative data, and record and represent data in an appropriate form. Use appropriate safety procedures. Students should investigate how solutes dissolve in solvents in different amounts in given times. This could include, but is not limited to challenging students to use bouillon cubes, water, hot plate, microwave or other heat source, and a spoon to develop questions and test hypothesis to conduct a controlled scientific investigation to test the effects of temperature change on dissolving rates. Students identify independent, dependent and control variables and record and organize quantitative data. In addition to conducting investigations, students should ask questions and plan investigations; analyze and interpret data and use mathematics and computational thinking; engage in argument from evidence and construct explanations; develop and use models; obtain and communicate information construct devices or design solutions. Previous and Future Knowledge
• H.C.5 Solutions Essential Understanding It is essential for students to conduct investigations testing how different amounts of solutes dissolve in solvents in solutions in given times, which is called the rate of dissolving. Factors which affect the rate of dissolving: Temperature change
• Usually, if the temperature increases, more of the solute will dissolve faster. Particle size
• Usually, if the particle sizes are smaller, more of the solute will dissolve faster. Stirring
• Usually, if the solution is stirred, more of the solute will dissolve faster.
20

*SCIENTIFIC TOOLS used to test the rate of dissolving (beaker, graduated cylinder, stopwatch, hot plate, coffee maker) Extended Knowledge
• Investigate solubility of solutes • Investigate and/or identify whether a solution is saturated or unsaturated
Science and Engineering Practices S.1A.3
21

Standard 5.P.2: The student will demonstrate an understanding of the physical properties of matter and mixtures. Conceptual Understanding 5.P.2B A mixture is formed when two or more kinds of matter are put together. Sometimes when two or more different substances are mixed together, a new substance with different properties may be formed but the total amount (mass) of the substances is conserved. Solutions are a special type of mixture in which one substance is dissolved evenly into another substance. When the physical properties of the components in a mixture are not changed, they can be separated in different physical ways. Performance Indicator 5.P.2B.6 Design and test the appropriate method(s) (such as filtration, sifting, attraction to magnets, evaporation, chromatography, or floatation) for separating various mixtures. Assessment Guidance The objective of this indicator is to design a solution to test the appropriate methods (such as filtration, sifting, magnetic attraction, evaporation, chromatography, or floatation) for separating various mixtures. Therefore, the primary focus of assessment should be for students to construct devices or design solutions to test appropriate methods to separate mixtures. This could include, but is not limited to students being challenged to separate a variety of mixtures (i.e. mixture of Epsom salt, diatomaceous earth, aquarium gravel; mixture of Epsom salt, diatomaceous earth, aquarium gravel, paper clips, plastic beads; ink blot) using the processes of filtration, sifting, magnetic attraction, evaporation, chromatography, or floatation to separate mixtures. Students will identify materials and procedures used for separating each mixture and record their results. In addition to designing solutions, students should be asked to ask questions and plan and conduct investigations; analyze and interpret data and use mathematics and computational thinking; engage in argument from evidence and construct explanations; develop and use models; obtain and communicate information; construct devices. Previous and Future Knowledge
• H.C.5 Solutions Essential Understanding It is essential for students to design solutions using the processes of filtration, sifting, magnetic attraction, evaporation, chromatography, or floatation to separate mixtures. Filtration
• Filtration is used to separate solid particles from a liquid. • For example, pouring the mixture through a filter paper in a funnel will trap the solid
particles and only allow the particles of the liquid to pass through. • This method is used in water treatment plants as part of the process for separating dirt and
other solid particles from water to produce clean drinking water. Sifting
• Sifting is used to separate smaller solid particles from larger solid particles. • For example, the mixture of different sized solid particles can be put into a container that
has a screen material at the bottom with holes of a certain size. • When the mixture is shaken, the smaller particles go through the screen leaving the larger
22

particles in the container. • Cooks, for example, sift flour to get a small particle size for baking leaving larger
particles of flour in the sifter above the screen. • Sand and gravel companies, for example, separate rocks into different sized particles for
road building and other construction projects using this method. Magnetic attraction
• Magnetic attraction is used to separating magnetic material from a mixture of other substances.
• When a magnet is stirred through the mixture, it pulls out the magnetic material from the mixture.
• A cow magnet, for example, is given to a cow to swallow. It stays in the first stomach of the cow, keeping magnetic materials like wire and other harmful materials that cows swallow from going into the rest of their digestive system.
Evaporation • Evaporation is used to separate a solid that has dissolved in a liquid solution. • The solution is heated or left uncovered until all the liquid turns to a gas (evaporates)
leaving the solid behind. • Salt in salt water or ocean water, for example, is separated by heating the solution until
all the water evaporates leaving the solid salt in the container. Chromatography
• Chromatography is used to separate and analyze the solutes in a solution. • For example, a small amount (2-3 drops) of the solution is put on a piece of filter paper,
which is put in a solvent. • The substances in the solution that dissolve most easily travel the furthest; and substances
that do not dissolve easily do not travel very far. • The bands of color that are formed allow scientists to identify the substances in the
solution by comparing them to the location of known substances forming bands of color on different filter papers.
Floatation • Floatation is used to separate solids that float from the remaining liquid in a mixture. • The solids are stirred and when they float to the top, they are skimmed off the surface of
the liquid and put into a different container. • This method is used, for example, in some water purification plants.
*SCIENTIFIC TOOLS used to test appropriate methods for separating various mixtures (beaker, graduated cylinder, magnets, filter paper or coffee filters, funnel stand, funnels, screens, strainers, sifters, evaporation trays) Extended Knowledge
• Research mixtures that can be separated, by not by the more simplistic methods we tested.
Science and Engineering Practices S.1.B.1
23

Standard 5.E.3: The student will demonstrate an understanding of how natural processes and human activities affect the features of Earth’s landforms and oceans. Conceptual Understanding 5.E.3A. Some of the land on Earth is located above water and some is located below the oceans. The downhill movement of water as it flows to the ocean shapes the appearance of the land. There are patterns in the location and structure of landforms found on the continents and those found on the ocean floor. Performance Indicator 5.E.3A.1 Construct explanations of how different landforms and surface features result from the location and movement of water on Earth’s surface through watersheds (drainage basins) and rivers. Assessment Guidance The objective of this indicator is to construct explanations and design solutions to describe how different landforms and surface features result from the location and movement of water on Earth’s surface through watersheds and rivers. Therefore, the primary focus of assessment should be for students to construct explanations from the conclusions of scientific investigations and use predictions based on observation to explain how water moves through Earth’s surface through watersheds and rivers. This could include, but is not limited to posing questions and ideas, testing ideas experimentally, evaluating evidence from experiments to support ideas, and forming a theory (constructed explanation supported by evidence) to explain where watersheds are located on Earth, and use this information to understand the water flow pattern of watersheds. Furthermore, students could create a map of the area in which they live to show location of watersheds and rivers and then construct explanations to explain a number of landforms and surface features in the area. In addition to constructing explanations and designing solutions, students should ask questions; develop and use models; plan and carryout investigations; analyze and interpret data; use mathematical and computational thinking; engage in scientific argument from evidence; construct explanations; obtain, evaluate, and communicate information; construct devices or design solutions. Previous and future Knowledge
• 1.E.4 land and water features • 3.E.4 natural processes which help to shape the Earth’s surface, physical features of Earth • 8.E.5 weathering, erosion and deposition • H.E. 6 water availability on Earth and ground water processes
Essential Knowledge The terms water shed and drainage basin are interchangeable. It can be described as all of the land that water flows over or through before reaching a lake or river. The water is received through precipitation such as rain, snow, sleet, or hail. Little water from precipitation evaporates and moves back into the atmosphere immediately, and some water enters the ground. The watershed acts as a “funnel” that collects and distributes water from the ground, and it is then channeled into a waterway. Each basin is sectioned by what is called a water divide such as a ridge, hill, or mountain. Each landform affects the path of the watershed. Watersheds are large,
24

or small. Large basins are made up of many smaller basins. Water from streams flows downward and meets with other water flows, gaining enough volume to become creeks and rivers. These moving bodies of water eventually flow to ponds, lakes, or the ocean. Extended Knowledge
• The different watershed paths have boundaries and specific names. • Create a topographical map showing this information. • There are also natural and human made pollutants that may contaminate watersheds.
Pesticides, chemicals, sediments and organic matter may be examples of pollutants affecting basins.
Science and Engineering Practices S.1.A.6
25

Standard 5.E.3: The student will demonstrate an understanding of how natural processes and human activities affect the features of Earth’s landforms and oceans. Conceptual Understanding 5.E.3A. Some of the land on Earth is located above water and some is located below the oceans. The downhill movement of water as it flows to the ocean shapes the appearance of the land. There are patterns in the location and structure of landforms found on the continents and those found on the ocean floor. Performance Indicator 5.E.3A.2 Develop and use models to describe and compare the characteristics and locations of the landforms on continents with those on the ocean floor (including the continental shelf and slope, the mid ocean ridge, the rift zone, the trench, and the abyssal plain.) Assessment Guidance The objective of this indicator is to develop and use models to describe and compare the characteristics and locations of the landforms on continents with those on the ocean floor (including the continental shelf and slope, the mid ocean ridge, the rift zone, the trench, and the abyssal plain.) Therefore, the primary focus of assessment should be for students to use models to understand and explain the similarities and differences between the landforms found on the continents and those found on the ocean floor. This could include but, is not limited to students developing a 2-D or 3-D model, using sources of evidence and scientific information, to construct a descriptive model that represents the detailed characteristics of the landforms of the ocean that are similar to the landforms found on continents. In addition to developing and using models, students should ask questions; develop and use models; plan and carryout investigations; analyze and interpret data; use mathematical and computational thinking; engage in scientific argument from evidence; construct explanations; obtain, evaluate, and communicate information; construct devices or design solutions. Previous and Future Knowledge:
• Oceanic landforms are a new concept • 3.E.4 Earth’s landforms
Essential Knowledge Earth is made of solid land. Some of the land is located above Earth’s water and some is located under water in the oceans. Meaning the ocean floor contains geologic structures, or landforms. However, there are similarities and differences between the landforms found on the continents and those found on the ocean floor. These features can be illustrated using detailed descriptions, pictures, or diagrams. These landforms include: Continental shelf
• The edges of the continents slope down from the shore into the ocean. • The part of the continent located under the water is known as the continental shelf. • The width of the continental shelf varies around the edges of the continents. • In some places the continental shelf is fairly shallow and in other place it becomes very
deep, but it is not the deepest part of the ocean. Continental slope
• The steep slope where the continental shelf drops to the bottom of the ocean floor is called the continental slope.
26

• The depth of the ocean water increases greatly here. Mid-ocean ridge
• On the bottom of the ocean, there is a central ridge, or mountain range, that divides the ocean floor into two parts.
• These underwater volcanic mountains are known as the mid-ocean ridge. • Volcanic mountains not formed on the mid-ocean ridge are called seamounts. (See
Essential Knowledge section for 5.E.3B.1) Rift zone
• In the center of the highest part of the mid-ocean ridge is a narrow trench called a rift. • Underwater volcanic activity that adds mountains to either side of the mid-ocean ridge
occurs at the rift zone. Trenches
• There are many steep-sided canyons and deep, narrow valleys in the bottom of the ocean. • Ocean trenches are the deepest part of the ocean basin and are deeper than any valley
found on land. Abyssal plain
• Begins where the continental margins end • Flat or gently sloping, smooth area of the ocean floor • Cover about 54% of the surface of the Earth • Shrimp and fish live in abyssal plains.
Continental and Oceanic Landforms Description Continental Oceanic Low land between hills or mountains
Valley Rift
Deep valley with high, steep sides
Canyon Trench
An opening in the surface from which lava flows
Volcano Seamount and volcanic islands
Land which rises high above the ground
Mountain range Mid ocean ridge
Wide, flat areas of land Plains Abyssal plains
Extended Knowledge • Know about ocean floor spreading, continental plates and boundaries. • Deep-ocean exploration efforts. • Deep ocean-mapping methods may give the students a better idea of how scientists learn
about the features of the ocean floor. • Know a comparison of other continental and oceanic features, or how they are made.
Science and Engineering Practices S.1.A.2
27

Standard 5.E.3: The student will demonstrate an understanding of how natural processes and human activities affect the features of Earth’s landforms and oceans. Conceptual Understanding 5.E.3B. Earth’s oceans and landforms can be affected by natural processes in various ways. Humans cannot eliminate natural hazards caused by these processes but can take steps to reduce their impacts. Human activities can affect the land and oceans in positive and negative ways. . Performance Indicator 5.E.3B.1 Analyze and interpret data to describe and predict how natural processes (such as weathering, erosion, deposition, earthquakes, tsunamis, hurricanes, or storms) affect Earth’s surface. Assessment Guidance The objective of this indicator is to analyze and interpret data to describe and predict how natural processes affect Earth’s surface. Therefore, the primary focus of assessment should be for students to analyze and interpret data from informational text, or observations to compare and contrast how natural processes affect the Earth’s surface. This could include, but is not limited to students analyzing photographs, or primary source documents to predict and determine what natural process occurred to cause the depicted damage. In addition to analyzing and interpreting data, students should ask questions; develop and use models; plan and carryout investigations; analyze and interpret data; use mathematical and computational thinking; engage in scientific argument from evidence; construct explanations; obtain, evaluate, and communicate information; construct devices or design solutions. Previous and Future Knowledge:
• 3.E.4 weathering, erosion, deposition, volcanoes, floods or earthquake • 4.E.2 thunderstorm, hurricane, tornado • 8.E.5 plate tectonics and its relationship to earthquakes and volcanoes • 8.E.6 catastrophic events on the conditions of Earth • H.E. 3 Theory of plate tectonics, seismic graphs, human activity vs. natural disasters
28

Erosion • Erosion is the movement of sediments and soil by wind, water, ice, and gravity. Deposition • Deposition is the dropping, or depositing, of sediments by water, wind, or ice. • Deposition builds up new land on Earth’s surface, like a delta at the end of a river or the pile up
of a sand dune in the desert. • Shells on the beach are deposition by ocean waves. Landslides • Landslides are mass movements of land due to gravity. • Landslides can cause buildings to fall, or power and gas lines to break. • Landslides even occur on the continental slope in the ocean. Volcanic eruptions • Volcanoes are mountains with openings in Earth’s crust through which magma, gases, and ash
reach Earth’s surface. • Volcanoes can change Earth’s surface. • When the magma erupts from the volcano the top of the mountain can be changed, either built
up or exploded off. • The lava and ash can destroy forests and bury fields. • Volcanic eruptions can even change Earth’s weather patterns. • Volcanic eruptions also occur under the oceans; these volcanoes that are built up are called
seamounts. • If the seamount rises above the ocean surface it is called a volcanic island (for example Hawaii
Essential Knowledge Know Earth’s oceans and land can be affected in constructive ways and destructive ways by natural processes. Constructive • Processes that create landforms (deposition, landslides, volcanic eruptions, floods) Destructive • Processes that destroy landforms (weathering, erosion, landslides, volcanic eruptions,
earthquakes, floods) Natural processes that can affect Earth’s oceans and land include: Weathering • Weathering is a general term used to describe processes that break down rocks at or near
the surface of the earth. • Anything that causes rocks to wear down or break apart is a cause of weathering. • Weathering can be either physical (mechanical breakdown of the rock) or chemical (a
change in the chemical composition of the rock). • These processes cause the surface of the earth to dissolve, decompose, and break into
smaller pieces. (physical & chemical) • Water is an important cause of weathering. (physical & chemical) • Plants cause weathering when roots break apart rock. (physical) • Changes in temperature can break rock, as well as ice forming inside cracks in the rock
causing it to break even more. (physical) • Acid rain and defecation from organisms cause weathering. (chemical)
29

or Japan). Earthquakes • Earthquakes are vibrations on Earth’s surface caused by sudden movement in Earth, often
along a fault, a break in Earth’s surface. • Some earthquakes cause little damage and some cause a lot of damage. • Large earthquakes can cause landslides. • Earthquakes under the ocean can cause huge waves, called tsunamis that destroy land and cause
great damage if they come ashore. Floods • Floods occur when a large amount of water covers land that is usually dry. • When the flood occurs, rapid erosion can take place and move soil and sediments away. • When the flood recedes, new sediment is left behind and can build up rich soil deposits Extended Knowledge
• Know about ocean floor spreading, continental plates and boundaries. • Deep-ocean exploration efforts • Deep ocean-mapping methods may give the students a better idea of how scientists learn
about the features of the ocean floor. • Know a comparison of other continental and oceanic features, or how they are made.
Science and Engineering Practices S.1.A.4
30
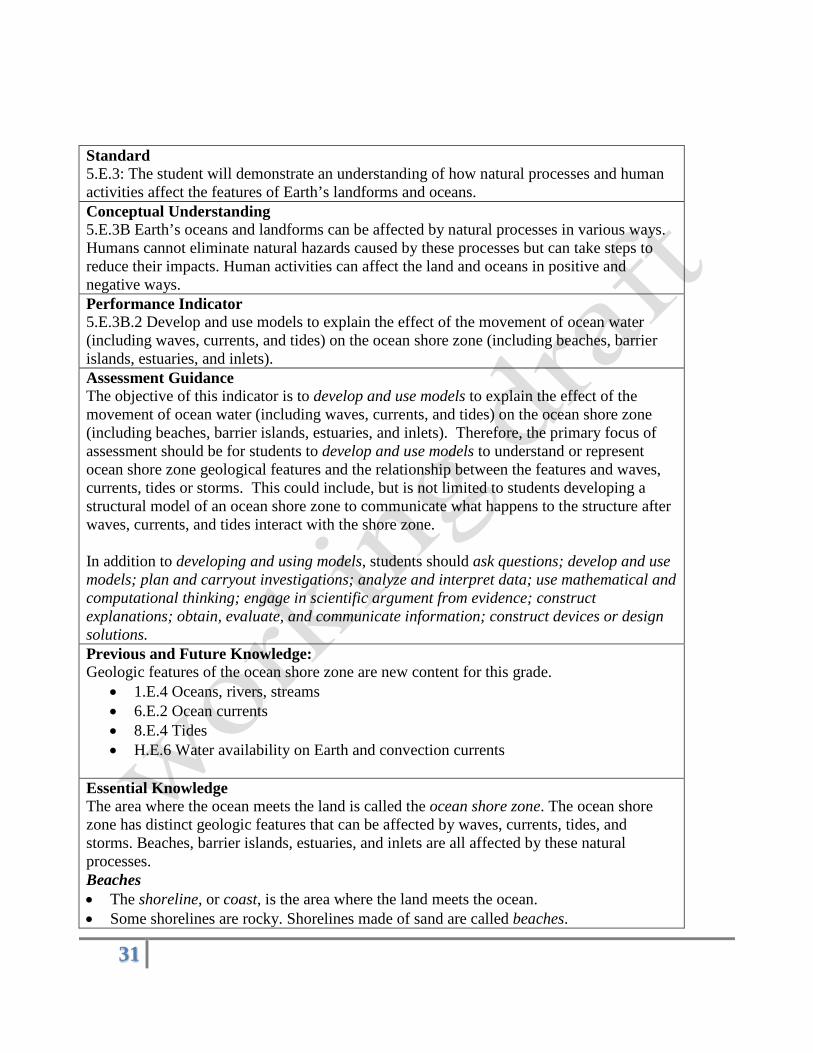
Standard 5.E.3: The student will demonstrate an understanding of how natural processes and human activities affect the features of Earth’s landforms and oceans. Conceptual Understanding 5.E.3B Earth’s oceans and landforms can be affected by natural processes in various ways. Humans cannot eliminate natural hazards caused by these processes but can take steps to reduce their impacts. Human activities can affect the land and oceans in positive and negative ways. Performance Indicator 5.E.3B.2 Develop and use models to explain the effect of the movement of ocean water (including waves, currents, and tides) on the ocean shore zone (including beaches, barrier islands, estuaries, and inlets). Assessment Guidance The objective of this indicator is to develop and use models to explain the effect of the movement of ocean water (including waves, currents, and tides) on the ocean shore zone (including beaches, barrier islands, estuaries, and inlets). Therefore, the primary focus of assessment should be for students to develop and use models to understand or represent ocean shore zone geological features and the relationship between the features and waves, currents, tides or storms. This could include, but is not limited to students developing a structural model of an ocean shore zone to communicate what happens to the structure after waves, currents, and tides interact with the shore zone. In addition to developing and using models, students should ask questions; develop and use models; plan and carryout investigations; analyze and interpret data; use mathematical and computational thinking; engage in scientific argument from evidence; construct explanations; obtain, evaluate, and communicate information; construct devices or design solutions. Previous and Future Knowledge: Geologic features of the ocean shore zone are new content for this grade.
• 1.E.4 Oceans, rivers, streams • 6.E.2 Ocean currents • 8.E.4 Tides • H.E.6 Water availability on Earth and convection currents
Essential Knowledge The area where the ocean meets the land is called the ocean shore zone. The ocean shore zone has distinct geologic features that can be affected by waves, currents, tides, and storms. Beaches, barrier islands, estuaries, and inlets are all affected by these natural processes. Beaches • The shoreline, or coast, is the area where the land meets the ocean. • Some shorelines are rocky. Shorelines made of sand are called beaches.
31
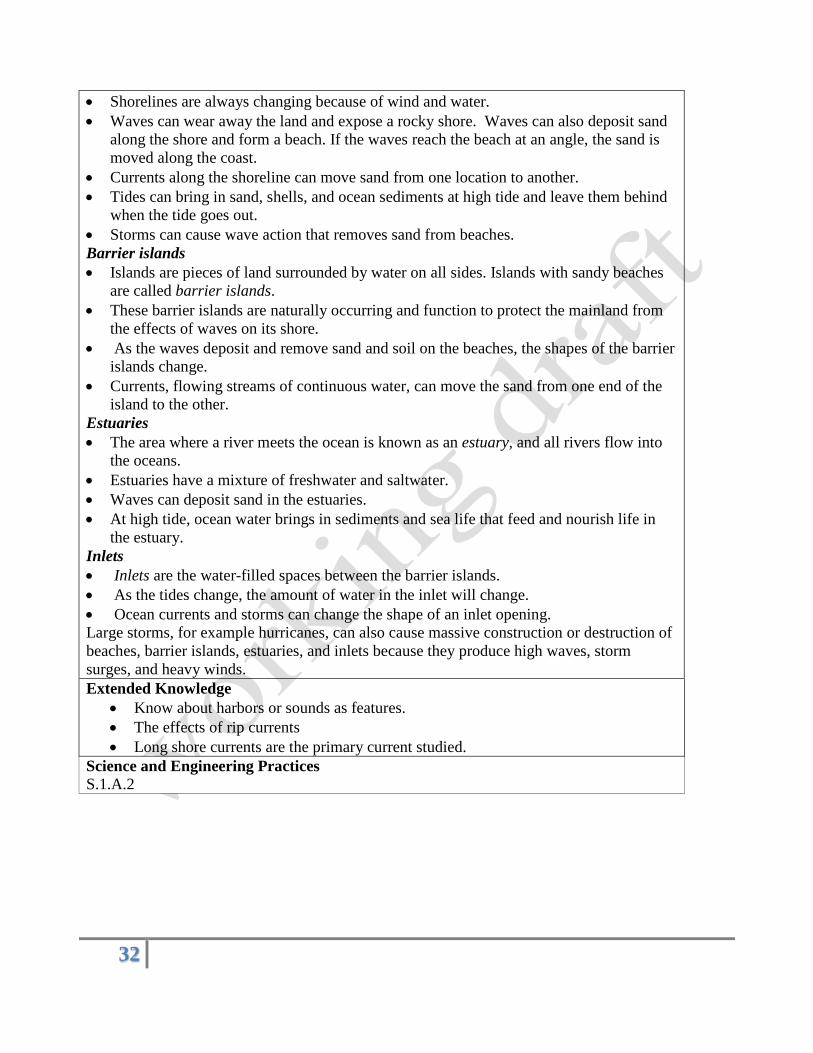
• Shorelines are always changing because of wind and water. • Waves can wear away the land and expose a rocky shore. Waves can also deposit sand
along the shore and form a beach. If the waves reach the beach at an angle, the sand is moved along the coast.
• Currents along the shoreline can move sand from one location to another. • Tides can bring in sand, shells, and ocean sediments at high tide and leave them behind
when the tide goes out. • Storms can cause wave action that removes sand from beaches. Barrier islands • Islands are pieces of land surrounded by water on all sides. Islands with sandy beaches
are called barrier islands. • These barrier islands are naturally occurring and function to protect the mainland from
the effects of waves on its shore. • As the waves deposit and remove sand and soil on the beaches, the shapes of the barrier
islands change. • Currents, flowing streams of continuous water, can move the sand from one end of the
island to the other. Estuaries • The area where a river meets the ocean is known as an estuary, and all rivers flow into
the oceans. • Estuaries have a mixture of freshwater and saltwater. • Waves can deposit sand in the estuaries. • At high tide, ocean water brings in sediments and sea life that feed and nourish life in
the estuary. Inlets • Inlets are the water-filled spaces between the barrier islands. • As the tides change, the amount of water in the inlet will change. • Ocean currents and storms can change the shape of an inlet opening. Large storms, for example hurricanes, can also cause massive construction or destruction of beaches, barrier islands, estuaries, and inlets because they produce high waves, storm surges, and heavy winds. Extended Knowledge
• Know about harbors or sounds as features. • The effects of rip currents • Long shore currents are the primary current studied.
Science and Engineering Practices S.1.A.2
32

Standard 5.E.3: The student will demonstrate an understanding of how natural processes and human activities affect the features of Earth’s landforms and oceans. Conceptual Understanding 5.E.3B. Earth’s oceans and landforms can be affected by natural processes in various ways. Humans cannot eliminate natural hazards caused by these processes but can take steps to reduce their impacts. Human activities can affect the land and oceans in positive and negative ways. Performance Indicator 5.E.3B.3 Construct scientific arguments to support claims that human activities (such as conservation efforts or pollution) affect the land and oceans of Earth. Assessment Guidance The objective of this indicator is to engage in scientific argument from evidence to support claims that back up their argument that human activities affect both land and ocean. Therefore, the primary focus of assessment should be for students to construct scientific arguments to support claims, explanations, or designs using evidence from observations, data, or informational texts from the idea that human activities either conserve or pollute natural resources. This could include, but is not limited to students developing their own arguments related to how human activities (such as conservation efforts or pollution) affect the land and oceans of Earth, and using evidence to back it up. Furthermore, students may revise their arguments based on scientific knowledge and debate their claims based on scientific knowledge. In addition to engaging in scientific argument from evidence, students should ask questions and define problems, develop and use models; plan and carryout investigations analyze and interpret data; use mathematical and computational thinking; obtain, evaluate, and communicate information; construct devices or design solutions. Previous and Future Knowledge Conservation and pollution are a new concept
• 8.E.6 Impact of events on the conditions of Earth • H.E.3 Management of natural resources and human activity vs. natural disasters • H.E.4 Changes in Earth’s environmental conditions • H.E.6 Effects of human activity on the hydrology of an ecosystem
Essential Knowledge Human activities can benefit the land and oceans by preserving the resources that these areas provide. Natural resources are the materials that people can take or use from Earth. Natural resources include air, water, trees, rocks and minerals, soil, coal and oil. Conservation Efforts
• The wise use of natural resources is called conservation. • Human activities that help to keep the natural resources of Earth available and clear of
pollution are conservation efforts. • Some efforts involve everyone trying to reduce (use less of something), reuse (use
33

something over again), and recycle (make something new from an old product). • Other efforts involve trying to save the land and oceans through clean-up projects,
installing fence lines to prevent dune erosion, jetties along the entrance to harbors or groins along beaches in an effort to keep sand from washing away.
• Beach restoration projects help to restore sand on beaches. • Planting trees, bushes, or grass is a way to improve air quality as well as keep erosion
from carrying away soil. • To conserve fossil fuels humans may use cars that run on electricity, car pool, use
public transportation, walk, ride a bike, etc. Pollution
• Pollution is anything that harms the natural environment. • When the taking or using of natural resources causes harm to Earth’s air, water including
oceans, or land, then the human activity has caused pollution. • Oceans are rich in food, minerals, and other resources and can be easily polluted. • Human activities can also harm the land and oceans causing resources to be polluted or
destroyed. • Sometimes people may allow materials to be dumped into rivers not thinking that rivers
flow into the estuaries and ocean where they are harmful to life there. • Careless dumping of trash on land or in oceans pollutes those areas; smoke and fumes
from burning fuels pollutes the air; oil spills harm the ocean and can cause life there to be killed.
• Careless human activities in agriculture, industry, construction, or mining can cause pollution on the land, in the water, and in the air.
Extended Knowledge • Identify areas of the land or ocean where resources are being conserved.
Science and Engineering Practices S.1.A.7
34
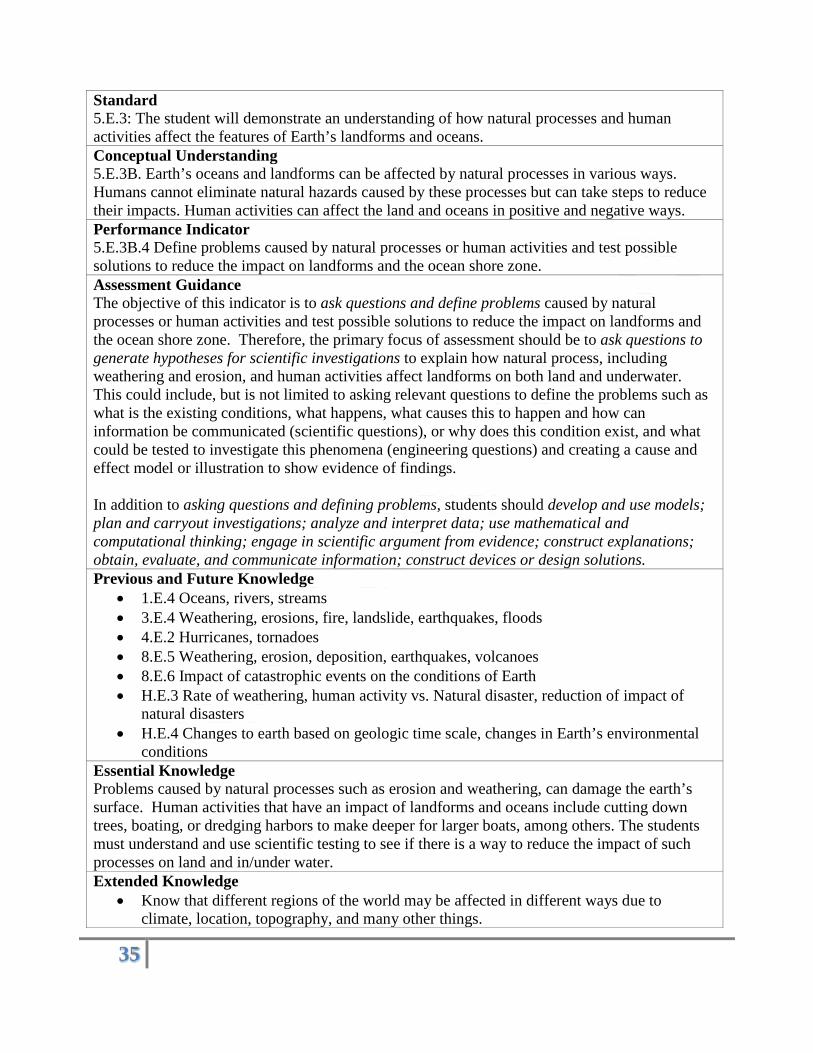
Standard 5.E.3: The student will demonstrate an understanding of how natural processes and human activities affect the features of Earth’s landforms and oceans. Conceptual Understanding 5.E.3B. Earth’s oceans and landforms can be affected by natural processes in various ways. Humans cannot eliminate natural hazards caused by these processes but can take steps to reduce their impacts. Human activities can affect the land and oceans in positive and negative ways. Performance Indicator 5.E.3B.4 Define problems caused by natural processes or human activities and test possible solutions to reduce the impact on landforms and the ocean shore zone. Assessment Guidance The objective of this indicator is to ask questions and define problems caused by natural processes or human activities and test possible solutions to reduce the impact on landforms and the ocean shore zone. Therefore, the primary focus of assessment should be to ask questions to generate hypotheses for scientific investigations to explain how natural process, including weathering and erosion, and human activities affect landforms on both land and underwater. This could include, but is not limited to asking relevant questions to define the problems such as what is the existing conditions, what happens, what causes this to happen and how can information be communicated (scientific questions), or why does this condition exist, and what could be tested to investigate this phenomena (engineering questions) and creating a cause and effect model or illustration to show evidence of findings. In addition to asking questions and defining problems, students should develop and use models; plan and carryout investigations; analyze and interpret data; use mathematical and computational thinking; engage in scientific argument from evidence; construct explanations; obtain, evaluate, and communicate information; construct devices or design solutions. Previous and Future Knowledge
• 1.E.4 Oceans, rivers, streams • 3.E.4 Weathering, erosions, fire, landslide, earthquakes, floods • 4.E.2 Hurricanes, tornadoes • 8.E.5 Weathering, erosion, deposition, earthquakes, volcanoes • 8.E.6 Impact of catastrophic events on the conditions of Earth • H.E.3 Rate of weathering, human activity vs. Natural disaster, reduction of impact of
natural disasters • H.E.4 Changes to earth based on geologic time scale, changes in Earth’s environmental
conditions Essential Knowledge Problems caused by natural processes such as erosion and weathering, can damage the earth’s surface. Human activities that have an impact of landforms and oceans include cutting down trees, boating, or dredging harbors to make deeper for larger boats, among others. The students must understand and use scientific testing to see if there is a way to reduce the impact of such processes on land and in/under water. Extended Knowledge
• Know that different regions of the world may be affected in different ways due to climate, location, topography, and many other things.
35

• Compare and contrast the differences of processes between the different regions. Science and Engineering Practices S.1.A.1
36

Standard 5.L.4 The student will demonstrate an understanding of relationships among biotic and abiotic factors within terrestrial and aquatic ecosystems. Conceptual Understanding 5.L.4A Ecosystems are complex, interactive systems that include both the living components (biotic factors) and physical components (abiotic factors) of the environment. Ecosystems can be classified as either terrestrial (such as forests, wetlands, and grasslands) or aquatic (such as oceans, estuaries, lakes, and ponds). Performance Indicator 5.L.4A.1 Analyze and interpret data to summarize the abiotic factors (including quantity of light and water, range of temperature, salinity, and soil composition) of different terrestrial ecosystems and aquatic ecosystems. Assessment Guidance The objective of this indicator is to analyze and interpret data to summarize the abiotic factors of different terrestrial ecosystems and aquatic ecosystems. Therefore, the primary focus of assessment should be for students to analyze and interpret data from informational texts, observations, measurements, or investigations using a range of methods (such as tabulation or graphing) to (1)reveal patterns and construct meaning or (2)support hypotheses, explanations, claims, or designs regarding abiotic factors of different terrestrial and aquatic ecosystems. This could include but is not limited to students measuring the salinity of both ocean water and brackish water. Students will then compare the salinity to summarize how this factor distinguishes one ecosystem from another ecosystem. In addition to analyzing and interpreting data, students should be asked to ask questions; plan and carry out investigations; use mathematics and computational thinking; engage in argument from evidence; construct explanations; develop and use models; obtain, evaluate, and communicate information; and construct devices or design solutions. Previous and Future Knowledge 1.L.5B.1 Basic needs of plants (air, water, sunlight, minerals, space) 2.L.5B.3 Animal responses to environment (eating behaviors, hibernation, migration) 6.L.5B.4 Environmental factors (such as air, water, light, minerals, or space) affect the growth and development of a flowering plant 6.L.5B.5 Plants respond to external stimuli (including temperature, light, touch, water, and gravity) Essential Knowledge Ecosystems are made of both biotic and abiotic factors.
● The living parts of the ecosystem are called biotic factors and include populations and communities of organisms.
● The nonliving parts of the ecosystem are called abiotic factors and include temperature, water, soil, air, and sunlight.
There are different types of ecosystems (terrestrial and aquatic). These ecosystems can be divided into two types according to their characteristics:
● Terrestrial ecosystems are land-based ecosystems (including forests, wetlands, and grasslands).
● Aquatic ecosystems are water-based ecosystems and may be fresh water (lakes and
37

ponds) or saltwater (oceans, estuaries and saltwater marshes). Summary of Characteristics of Distinct Environments Range of
Temperature Quantity of Water
Quantity of Light
Salinity Soil Composition
Forests - have many trees (with needles or with leaves),shrub, grasses, and ferns, and a variety of animals
Temperature in a forest may vary depending on where the forest is located. For example, temperature in a temperate forest ranges from about -30 degrees C to 30 degrees C.
The amount of rainfall a forest receives varies depending on location. Forests receive more rainfall than grasslands.
The forest canopy (top layer of the forest) receives many hours of sunlight. Therefore, the trees’ leaves grow thickest near the top of the tree. The understory of the forest receives filtered sunlight; therefore, smaller shrubs and trees that require less sunlight to grow live in this layer.
Depends on type of forest. Example: In a temperate forest, decaying leaf matter contributes to fertile soil
Wetlands: A wetland is an area of land that, at least part of the year, is under water. There are both freshwater and saltwater wetland ecosystems including
Temperature in a wetland may vary depending on where the wetland is located.
The amount of water in this ecosystem depends on the amount of rainfall and depends on location.
Marshes contain few trees and receives a full day of sunlight. Swamps contain trees, allowing for filtered sunlight.
The salinity of a wetland ecosystem depends on location. For example, the level of salinity in a salt marsh is affected by the tides and amount of rain the ecosystem receives.
Wetlands help prevent flooding and erosion of the soil.
38
marshes and swamps.
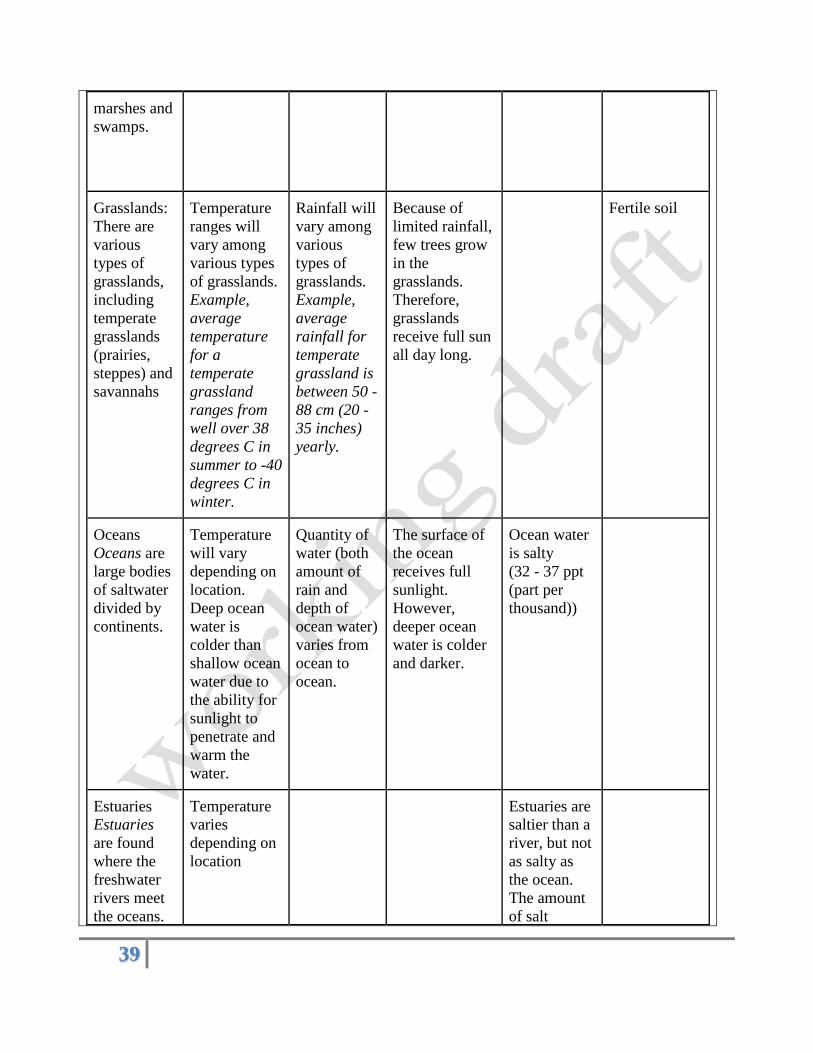
Grasslands: There are various types of grasslands, including temperate grasslands (prairies, steppes) and savannahs
Temperature ranges will vary among various types of grasslands. Example, average temperature for a temperate grassland ranges from well over 38 degrees C in summer to -40 degrees C in winter.
Rainfall will vary among various types of grasslands. Example, average rainfall for temperate grassland is between 50 - 88 cm (20 - 35 inches) yearly.
Because of limited rainfall, few trees grow in the grasslands. Therefore, grasslands receive full sun all day long.
Fertile soil
Oceans Oceans are large bodies of saltwater divided by continents.
Temperature will vary depending on location. Deep ocean water is colder than shallow ocean water due to the ability for sunlight to penetrate and warm the water.
Quantity of water (both amount of rain and depth of ocean water) varies from ocean to ocean.
The surface of the ocean receives full sunlight. However, deeper ocean water is colder and darker.
Ocean water is salty (32 - 37 ppt (part per thousand))
Estuaries Estuaries are found where the freshwater rivers meet the oceans.
Temperature varies depending on location
Estuaries are saltier than a river, but not as salty as the ocean. The amount of salt
39

(salinity) changes as the tides come in and out.
Lakes and ponds Lakes and ponds are bodies of freshwater that are surrounded by land.
Unlike lakes, temperature of the water in ponds usually stays the same from top to bottom.
Ponds are usually shallower than lakes.
*The information listed in the chart above is general. A teacher and/or students can find more specific information by researching an ecosystem in a particular location. Extended Knowledge To further students’ knowledge of ecosystems throughout our world, students might research ecosystems not listed in this indicator and identify specific examples of the abiotic factors in these ecosystems. Science and Engineering Practices S.1A.4
40

Standard 5.L.4 The student will demonstrate an understanding of relationships among biotic and abiotic factors within terrestrial and aquatic ecosystems. Conceptual Understanding 5.L.4A Ecosystems are complex, interactive systems that include both the living components (biotic factors) and physical components (abiotic factors) of the environment. Ecosystems can be classified as either terrestrial (such as forests, wetlands, and grasslands) or aquatic (such as oceans, estuaries, lakes, and ponds). Performance Indicator 5.L.4A.2 Obtain and communicate information to describe and compare the biotic factors (including individual organisms, populations, and communities) of different terrestrial and aquatic ecosystems. Assessment Guidance The objective of this indicator is to obtain and communicate information to describe and compare the biotic factors of different terrestrial and aquatic ecosystems. Therefore, the primary focus of assessment should be for students to obtain and evaluate informational texts, observations, data collected, or discussions to (1) generate and answer questions, (2) understand phenomena regarding biotic factors of different terrestrial and aquatic ecosystems. This could include but is not limited to students reading several pieces of informational text about a forest and a wetland. Using information from the text, students would engage in a written or oral discussion comparing and contrasting the biotic factors of these two terrestrial ecosystems. In addition to obtaining and communicating information, students should ask questions; plan and carry out investigations; analyze and interpret data; use mathematics and computational thinking; engage in argument from evidence; construct explanations; develop and use models; and construct devices or design solutions. Previous and Future Knowledge
• K.L.2A.1 Organisms - plants, animals, fungi - food, water, air, shelter, space Essential Knowledge An ecosystem contains all of the organisms and their nonliving surrounding environment that contribute to the functioning of the ecosystem.
● The living parts of the ecosystem are called the biotic factors and include populations and communities of organisms.
● The nonliving parts of the ecosystem are called the abiotic factors and include the temperature, water, soil, air, and sunlight.
The biotic organisms in an environment can be grouped in two ways: Population ● All members of one kind of organism that live in a particular area ● Some examples of a population may be all of the white-tailed deer in a forest, all rainbow
trout in a stream, or all of the bald cypress trees in the swamp. Communities ● All of the different populations of organisms in an area that are coexisting at the same
time ● Some examples of communities are all of the squirrels, acorn trees, and grass in a park;
all of the microorganisms in a pond; or all of the cacti, rattlesnakes, and scorpions in the
41

desert. Extended Knowledge
• Microorganisms are living things that are too small to be seen without magnification. Microorganisms can be a single-celled or multi-celled.
• A study of the types of microorganisms (paramecium, euglena, and amoeba) in an ecosystem would provide opportunity to extend students’ knowledge of biotic factors in an ecosystem.
Science and Engineering Practices S.1A.8
42

Standard 5.L.4 The student will demonstrate an understanding of relationships among biotic and abiotic factors within terrestrial and aquatic ecosystems. Conceptual Understanding 5.L.4B All organisms need energy to live and grow. Energy is obtained from food. The role an organism serves in an ecosystem can be described by the way in which it gets its energy. Energy is transferred within an ecosystem as organisms produce, consume, or decompose food. A healthy ecosystem is one in which a diversity of life forms are able to meet their needs in a relatively stable web of life. Performance Indicator 5.L.4B.1 Analyze and interpret data to explain how organisms obtain their energy and classify organisms as producers, consumers (including herbivore, carnivore, and omnivore), or decomposers (such as fungi and bacteria). Assessment Guidance The objective of this indicator is to analyze and interpret data to explain how organisms obtain their energy and classify organisms as producers, consumers, or decomposers. Therefore, the primary focus of assessment should be for students to analyze and interpret data from informational texts, observations, measurements, or investigations using a range of methods (such as tabulation or graphing) to (1) reveal patterns and construct meaning or (2) support hypotheses, explanations, claims, or designs regarding the classification of organisms (producers, consumers and decomposers) and the means of obtaining energy. This could include but is not limited to students observing interactions among producers, consumers, and decomposers in a student built aquarium or terrarium to explain how each organism obtains energy. In addition to analyzing and interpreting data, students should be asked to ask questions; plan and carry out investigations; use mathematics and computational thinking; engage in argument from evidence; construct explanations; develop and use models; obtain, evaluate, and communicate information; and construct devices or design solutions. Previous and Future Knowledge
• K.L.2A.1 Organisms - plants, animals, fungi - food, water, air, shelter, space • 3.L.5A.2 Food chain, consumer (herbivores, carnivores, omnivores) • 6.L.4A.2 Organisms, hierarchical taxonomic structure • 6.L.5A.1 Protists and fungi obtain energy and explore the environment • 6.L.5B.2 Plants participate in photosynthesis, transpiration, and respiration
Essential Knowledge All organisms need energy to live, grow, and reproduce. This energy is obtained from food. The role an organism serves in an ecosystem can be described by the way in which it gets its energy. Producers
● Plants are called producers because they are able to use light energy from the Sun to produce food (sugar) from carbon dioxide in the air and water.
Consumers ● Animals cannot make their own food so they must eat plants and/or other animals. ● They are called consumers.
43
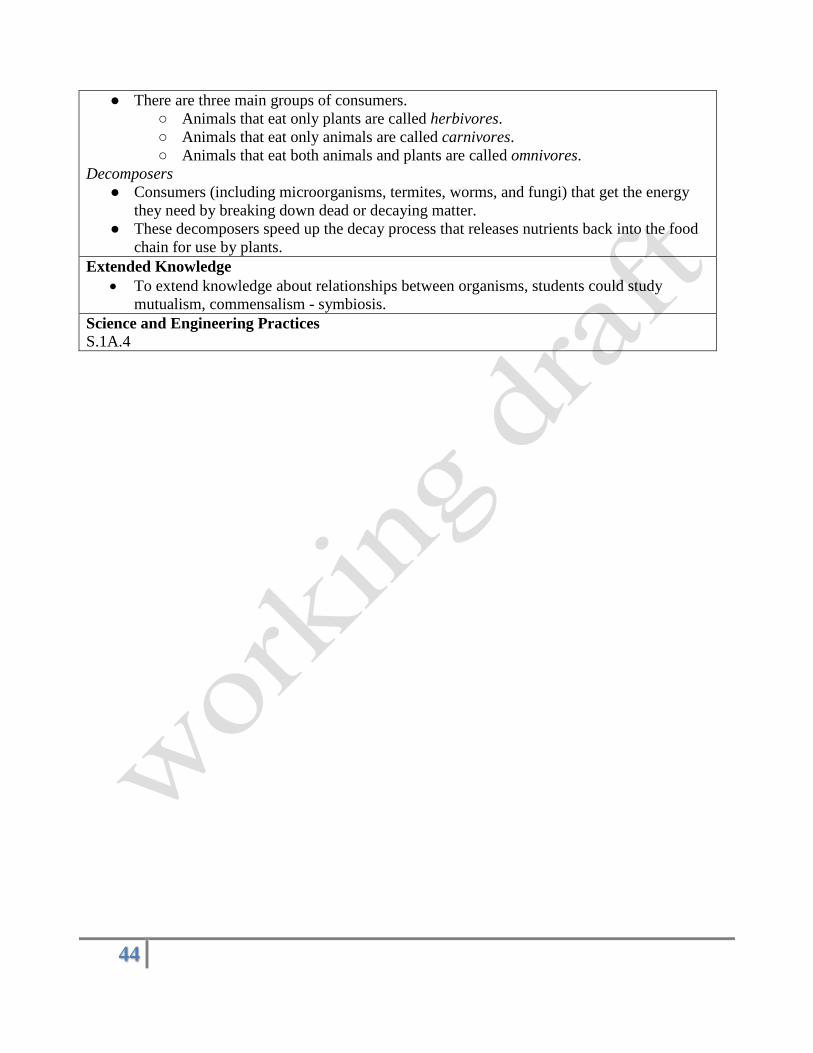
● There are three main groups of consumers. ○ Animals that eat only plants are called herbivores. ○ Animals that eat only animals are called carnivores. ○ Animals that eat both animals and plants are called omnivores.
Decomposers ● Consumers (including microorganisms, termites, worms, and fungi) that get the energy
they need by breaking down dead or decaying matter. ● These decomposers speed up the decay process that releases nutrients back into the food
chain for use by plants. Extended Knowledge
• To extend knowledge about relationships between organisms, students could study mutualism, commensalism - symbiosis.
Science and Engineering Practices S.1A.4
44

Standard 5.L.4 The student will demonstrate an understanding of relationships among biotic and abiotic factors within terrestrial and aquatic ecosystems. Conceptual Understanding 5.L.4B All organisms need energy to live and grow. Energy is obtained from food. The role an organism serves in an ecosystem can be described by the way in which it gets its energy. Energy is transferred within an ecosystem as organisms produce, consume, or decompose food. A healthy ecosystem is one in which a diversity of life forms are able to meet their needs in a relatively stable web of life. Performance Indicator 5.L.4B.2 Develop and use models of food chains and food webs to describe the flow of energy in an ecosystem. Assessment Guidance The objective of this indicator is to develop and use models of food chains and food webs to describe the flow of energy in an ecosystem. Therefore, the primary focus of assessment should be for students to develop and use models to (1) understand or represent phenomena, processes, and relationships, (2) communicate ideas to others regarding the flow of energy in an ecosystem. This could include but is not limited to students developing a model of a food web to describe the flow of energy in an ecosystem. In addition to developing and using models, students should be asked to ask questions; plan and carry out investigations; analyze and interpret data; use mathematics and computational thinking; engage in argument from evidence; construct explanations; obtain, evaluate, and communicate information; and construct devices or design solutions. Previous and Future Knowledge 3.L.5A.2 Food chain, consumers (herbivores, carnivores, omnivores) Essential Knowledge Food chains and food webs can be used to show how energy is passed through an ecosystem.
● A food chain is a series of plants and animals in which each organism is a source of food (energy) for the next in the series.
● In a typical food chain, plants use the Sun’s energy to make their own food and then are eaten by one kind of animal which in turn is eaten by another kind of animal.
● Most organisms are part of more than one food chain and eat more than one kind of food in order to meet their energy requirements.
● Interconnected food chains form a food web. ● Most food chains have no more than six organisms. ● There cannot be too many links in a single food chain because the animals at the end of
the chain would not get enough food (energy) to stay alive. ● The role of an organism can be identified by its placement on the food chain. ● Decomposers are not typically noted on a food chain; they will break down any organism
on the food chain when it dies. An example of a grassland food chain:
Sun Grass Grasshopper Toad Snake Hawk
45

→ → → → → →
Producer Consumer Consumers
Note that the arrows are drawn from food source → to food consumer Extended Knowledge To further students’ knowledge of energy flow, students might identify trophic levels found in a food chain or web, or identify energy pyramids. Science and Engineering Practices S.1A.2
46

Standard 5.L.4 The student will demonstrate an understanding of relationships among biotic and abiotic factors within terrestrial and aquatic ecosystems. Conceptual Understanding 5.L.4B All organisms need energy to live and grow. Energy is obtained from food. The role an organism serves in an ecosystem can be described by the way in which it gets its energy. Energy is transferred within an ecosystem as organisms produce, consume, or decompose food. A healthy ecosystem is one in which a diversity of life forms are able to meet their needs in a relatively stable web of life. Performance Indicator 5.L.4B.3 Construct explanations for how organisms interact with each other in an ecosystem (including predators and prey, and parasites and hosts). Assessment Guidance The objective of this indicator is to construct explanations for how organisms interact with each other in an ecosystem. Therefore, the primary focus of assessment should be for students to construct explanations of phenomena using (1) scientific evidence and models, (2) conclusions from scientific investigations, (3) predictions based on observations and measurements, or (4)data communicated in graphs, tables, or diagrams regarding the interactions of organisms in an ecosystem. This could include but is not limited to students using a diagram of a food web to construct an explanation for how organisms interact with each other in an ecosystem. In addition to constructing explanations, students should ask questions; plan and carry out investigations; analyze and interpret data; use mathematics and computational thinking; engage in argument from evidence; obtain, evaluate, and communicate information; develop and use models; and construct devices or design solutions. Previous and Future Knowledge
• 2.L.5B.1 Coexistence of plants and animals • 6.L.4B.3 Carnivore, omnivore, and herbivore
Essential Knowledge Organisms can be identified based on how they interact with other organisms.
● Predators are animals that hunt and kill other animals for food. ● Prey is animals that are hunted and killed as food for other animals. ● A parasite is an organism that spends a significant portion of its life in or on a living host
organism usually causing harm to the host without immediately killing it. ● Hosts are organisms or cells that serve as a home or a source of food for a parasite (e.g.
Spanish moss is a parasitic plant that clings to its host, the live oak tree) Extended Knowledge
• To extend student knowledge, students could study other relationships between organisms (mutualism, commensalism, or symbiosis).
Science and Engineering Practices S.1A.6
47

Standard 5.L.4 The student will demonstrate an understanding of relationships among biotic and abiotic factors within terrestrial and aquatic ecosystems. Conceptual Understanding 5.L.4B All organisms need energy to live and grow. Energy is obtained from food. The role an organism serves in an ecosystem can be described by the way in which it gets its energy. Energy is transferred within an ecosystem as organisms produce, consume, or decompose food. A healthy ecosystem is one in which a diversity of life forms are able to meet their needs in a relatively stable web of life. Performance Indicator 5.L.4B.4 Construct scientific arguments to explain how limiting factors (including food, water, space, and shelter) or a newly introduced organism can affect an ecosystem. Assessment Guidance The objective of this indicator is to construct scientific arguments to explain how limiting factors (including food, water, space, and shelter) or a newly introduced organism can affect an ecosystem. Therefore, the primary focus of assessment should be for students to construct scientific arguments to support claims, explanations, or designs using evidence from observations, data, or informational texts regarding the effects of limiting factors on an ecosystem. This could include but is not limited to students reading a piece of text and/or watching digital media on limiting factors. Students will then communicate their argument to support how food, water, space, and shelter affect an ecosystem, citing textual evidence. In addition to constructing scientific arguments from evidence, students should be asked to ask questions; plan and carry out investigations; analyze and interpret data; use mathematics and computational thinking; construct explanations; obtain, evaluate, and communicate information; develop and use models; and construct devices or design solutions. Previous and Future Knowledge
• K.L.2A.2 Nutrients • K.L.2A.5 Basic needs of organisms (air, water, food, shelter) • 1.L.5B.1 Basic needs of plants (air, water, sunlight, minerals, space) • 2.L.5B.2 Characteristics of animals for distinct environments (salt and freshwater,
deserts, forests, wetlands, or polar lands) • 3.L.5B.2 Food chain, consumers (herbivores, carnivores, omnivores) • 6.L.5A.2 Fungi respond to external stimuli • 6.L.5B.4 Change in environments affects plant growth and development • 6.L.5B.5 Plants respond to external stimuli
Essential Knowledge An ecosystem only has a certain amount of food, water, space, and shelter to support a certain number of organisms.
● The relationship between numbers of organisms and the resources available in an ecosystem is often described as the balance of nature.
● A condition or resource that keeps a population at a certain size is known as a limiting factor.
● If any of the limiting factors change, animal and plant populations may also change. Some changes may cause a population to increase; others may cause a population to decrease.
48

● Increases in population may result in overcrowding. Sometimes a population will grow too large for the environment to support. If resources, such as water and food, are insufficient for the size of the population. Some events that may cause a population to increase are:
● If there are more plants than usual in an area, populations of animals that eat that plants may increase.
● If the population of predators increases, the population of prey will decrease. ● If the population of prey increases, the population of predators will also increase because
of the availability of food. Other changes in limiting factors may cause a population to decrease. Some examples may be:
● If the water supply in an area decreases, the population that needs that water may decrease. Then the population of animals that eat that animal could decrease, too.
● If trees are cut down, die because of disease or parasites, the population of the animals that use the trees for food or shelter will decrease.
● If organisms no longer have enough space to survive, they will either have to move or will die. This change in space may be due to human influence or natural hazards.
Extended Knowledge • Study carrying capacity or how a change in climate affects population sizes. • Conduct investigations to determine how changes in environmental factors affect the
growth and development plants. Science and Engineering Practices S.1A.7 Standard 5.P.5 The student will demonstrate an understanding of the factors that affect the motion of an object. Conceptual Understanding 5.P.5A The motion of an object can be described in terms of its position, direction, and speed.
49

The rate and motion of an object is determined by multiple factors. Performance Indicator 5.P.5A.1 Use mathematical and computational thinking to describe and predict the motion of an object (including position, direction, and speed). Assessment Guidance The objective of this indicator is to use mathematical and computational thinking to describe and predict the motion of an object (including position, direction, and speed). Therefore, the primary focus of assessment should be for students to use mathematical and computational thinking to express quantitative observations using appropriate metric units; collect and analyze data, or understand patterns, trends and relationships between variables to describe motion in terms of position, direction, and speed. This could include, but is not limited to students being challenged to collect data on distance and time as cars move down ramps. Students calculate velocities and enter data on spreadsheets to create graphs then predict how changes in variables will affect motion. In addition to using mathematical and computational thinking, students should ask questions and plan and carry out investigations; analyze and interpret data and use mathematics and computational thinking; engage in argument from evidence and construct explanations; develop and use models and obtain, evaluate, and communicate information; construct devices or design solutions. Previous and Future Knowledge
• 2.P.4 Motion • 8.P.2 Motion
Essential Knowledge It is essential for students to use mathematics to describe motion in terms of position, direction, and speed as follows: Position
• The position of an object is its location relative to another object (the reference point) for example “above”, “below”, “beside”, “behind”, “ahead of” plus the distance from the other object.
• The distance (length) from the reference point changes when the object moves. Direction
• Direction of motion is the course or path that an object is moving and can be determined by reading a compass using the terms “north”, “south”, “east”, or “west.”
• Direction can also be described using the terms “right”, or “left,” “forward,” or “toward” relative to another object, or “up”, or “down” relative to Earth.
Speed
• A measure of how fast an object is moving. NOTE: Students should be able to measure the distance specific objects move in a given time. They can compare the relative speeds of different moving objects determining which is moving faster or slower. Extended Knowledge
50

• Research velocity (both speed and direction), or the concept of acceleration (changing speed)
• Calculate speed • Research tools used to measure speed
Science and Engineering Practices S.1.A.5
51

Standard 5.P.5 The student will demonstrate an understanding of the factors that affect the motion of an object. Conceptual Understanding 5.P.5A The motion of an object can be described in terms of its position, direction, and speed. The rate and motion of an object is determined by multiple factors. Performance Indicator 5.P.5A.2 Develop and use models to explain how the amount or type of force (contact and non-contact) affects the motion of an object. Assessment Guidance The objective of this indicator is to develop and use models to explain how the amount or type of force (contact and non-contact) affects the motion of an object. Therefore, the primary focus of assessment should be for students to develop and use models to understand or represent phenomena, processes, and relationships; test devices or solutions, or communicate ideas to others that show force is a push or pull that can make things move faster, slower, stop, or change direction. This could include, but is not limited to students being challenged to build a car or use miniature racecar to apply forces that make the cars move faster, slower, stop, and change direction. Students should test a variety of methods to achieve different motions. The students should then draw diagrams of their results then share their conclusions with their classmates. In addition to develop and use models, students should ask questions; plan and carry out investigations; analyze and interpret data and use mathematics and computational thinking; engage in argument from evidence and construct explanations and obtain, evaluate, and communicate information; construct devices or design solutions. Previous and Future Knowledge
• 2.P.4 Motion • 8.P.2 Motion
Essential Knowledge It is essential for students to develop and use models showing that a force is a push or pull. Forces can make things move faster, slower, stop, or change direction. Different forces (including magnetism, gravity, and friction) can affect motion. Magnetism
• A force that acts at a distance and cannot be seen. • Materials that create this force are said to be magnetic and are called magnets. • The needle of a compass moves because of Earth’s magnetism. • When like poles (S-S or N-N) of magnets are near each other, the magnetic force causes
the poles to repel, and the magnets push away from each other. • When opposite poles (N-S or S-N) of magnets are near each other, the magnetic force
causes the poles to attract, and the magnets pull toward each other. • The closer the objects, the greater the magnetic force. • The magnetic force is greatest at the poles of magnets.
Gravity • A pull that attracts objects to each other.
52

• This attraction is not noticeable unless one of the objects is very large, for example a planet, a moon, or the Sun.
• The force of gravity between Earth and anything on it is extremely noticeable because the mass of Earth is so large. The pull of Earth’s gravity makes any object fall to the ground.
• As the Moon goes around Earth, its gravity pulls on Earth causing water in the oceans to move toward the Moon.
• Earth’s gravity also pulls on the Moon. This force of gravity keeps the Moon moving around Earth.
• Similarly, the pull of the Sun’s gravity keeps Earth moving around the Sun. Friction
• The force that opposes motion between two surfaces that are touching. • The effect of friction can be observed as an object slides across a surface and slows
down. • The rougher the surfaces are, and the harder the surfaces press together, the more friction
there will be. • Friction can be reduced by using lubricants, for example motor oil, wax, or grease, by
making surfaces smoother. • Friction occurs in liquids and gases, as well as between solids. • Without friction, it would be very hard to slow or stop the motion of objects.
Extended Knowledge • Identify the quantitative relationships involved in forces affecting the motion of objects.
Science and Engineering Practices S.1.A.2
53

Standard 5.P.5: The student will demonstrate an understanding of the factors that affect the motion of an object. Conceptual Understanding 5.P.5A The motion of an object can be described in terms of its position, direction, and speed. The rate and motion of an object is determined by multiple factors. Performance Indicator 5.P.5A.3 Plan and conduct controlled scientific investigations to test the effects of balanced and unbalanced forces on the rate and direction of motion of objects. Assessment Guidance The objective of this indicator is to plan and conduct controlled scientific investigations to test the effects of balanced and unbalanced forces on the rate and direction of motion of objects. Therefore, the primary focus of assessment should be for students to plan and conduct controlled scientific investigations to answer questions, test hypotheses and predictions, and develop explanations. Students should formulate scientific questions and testable hypotheses; identify materials, procedures, and variables; select and use appropriate tools or instruments to collect qualitative and quantitative data, and record and represent data in an appropriate form. Use appropriate safety procedures. This could include but is not limited to students being challenged to investigate the effect of not wearing seatbelts in a car. Students will likely test motion using toy cars traveling down ramps. During initial investigations of motion, attach toy animals to the toy cars with clear tape (seatbelt) and allow the cars to travel down a ramp with a book or dictionary in its path on the floor at the end of the ramp. Students will record their results and draw diagrams. Next, have the students remove the tape (seatbelt), again allow the cars to travel down a ramp with a book or dictionary in its path on the floor at the end of the ramp. Students will record their results and draw diagrams. Students should then record and communicate their conclusions about the effects of balanced and unbalanced forces on the rate and direction of motion on objects. In addition to planning and conducting investigations, students should to ask questions; plan and carry out investigations; analyze and interpret data and use mathematics and computational thinking; engage in argument from evidence and construct explanations and obtain, evaluate, and communicate information; develop and use models; construct devices or design solutions. Previous and Future Knowledge
• 8.P.2 Force and Motion Essential Knowledge It is essential for students to plan and conduct controlled scientific investigations testing the effects of balanced and unbalanced forces on the rate and direction of motion of objects. Balanced forces produce no change in the motion of an object. Therefore, if an object is not moving, it will stay motionless. However, if an object is moving, it will maintain its rate of motion (speed) and direction. Unbalanced forces produce a change in the motion of an object. Therefore, a motionless object will begin to move, while an object that is already moving will change its speed and/or direction.
54

• Several forces can act on an object at the same time. • Sometimes forces are balanced which means that they are equal in strength but opposite
in direction. • Balanced forces do not change the motion of objects only unbalanced forces cause
changes in motion. • An unbalanced force is one that does not have another force of equal magnitude and
opposite direction off-setting it. • Rate of motion is the speed of the object or how fast or slow the object is moving. • Unbalanced forces can change the rate or direction of motion of an object in different
ways: Object at rest
• If an unbalanced force acts on an object at rest, the object will move in the direction of the force.
• A stronger force (push or pull) will make it move faster. Object in motion
• If an object is moving, an unbalanced force will change the motion of the object in different ways depending on how the force is applied. The unbalanced force may speed the object up, slow it down, or make it change directions.
• If the force is applied in the same direction as the object is moving, the object will speed it up.
• If the force is applied in the opposite direction as the object is moving, the object will slow it down or stop it.
• If the force is applied to the side of the moving object, the object will turn. Extended Knowledge
• Research the difference between speed and velocity • Research the concept of acceleration
Science and Engineering Practices S.1.A.3
55

Standard 5.P.5: The student will demonstrate an understanding of the factors that affect the motion of an object. Conceptual Understanding 5.P.5A The motion of an object can be described in terms of its position, direction, and speed. The rate and motion of an object is determined by multiple factors. Performance Indicator 5.P.5A.4 Analyze and interpret data to describe how a change of force, a change in mass, or friction affects the motion of an object. Assessment Guidance The objective of this indicator is to analyze and interpret data to describe how a change of force, a change in mass, or friction affects the motion of an object. Therefore, the primary focus of assessment should be for students to analyze and interpret data from informational texts, observations, measurements, or investigations using a range of methods (such as tabulation or graphing) to reveal patterns and construct meaning, or support hypotheses, explanations, claims, or designs. This could include, but is not limited to students analyzing and interpreting data from investigations that show that the motion of an object can be affected by a change in force, a change in mass, or friction. For example, students could be challenged to investigate friction using models, using connective block structures, or small racecars. Race the cars down a ramp with three different surfaces (cardboard, smooth fabric, thick beach towel, etc.). Analyze the data collected after the investigation to explain how friction affects the motion of an object. Conduct repeated trials and create an appropriate graph, then use the graph to interpret a larger set of data. In addition to analyzing and interpreting data, students should be asked to ask questions and plan and carry out investigations; use mathematics and computational thinking; engage in argument from evidence and construct explanations; develop and use models and obtain, evaluate, and communicate information; construct devices or design solutions. Previous and Future Knowledge
• 2.P.4 Motion • 8.P.2 Motion
Essential Knowledge It is essential for students to analyze and interpret data representing that the motion of an object can be affected by a change in force, a change in mass, or friction Force
• If there are two objects with the same mass, and one is acted on by a greater force than the other, the one acted on by the greater force will have the greatest change in speed.
• It will speed up the most or slow down the most in a given amount of time. Mass
• If there are two objects, one with a greater mass than the other, and the same amount of force is applied to each object, the object with the lesser mass will have the greater change in speed.
• It will speed up or slow down more in a given amount of time. • It is harder to change the speed of the object with the greater mass than the object with
56

the lesser mass. Friction
• The force that opposes motion between two surfaces that are touching. • The effect of friction can be observed as an object slides across a surface and slows
down. • The rougher the surfaces are, and the harder the surfaces press together, the more friction
there will be. • Friction can be reduced by using lubricants, for example motor oil, wax, or grease, by
making surfaces smoother. • Friction occurs in liquids and gases as well as between solids. • Without friction, it would be very hard to slow or stop the motion of objects.
Extended Knowledge • Identify that the change of speed of an object is called acceleration • Describe the quantitative relationships among mass, acceleration, and force • Illustrate the relationship between mass and inertia
Science and Engineering Practices S.1.A.4
57

Standard 5.P.5 The student will demonstrate an understanding of the factors that affect the motion of an object. Conceptual Understanding The motion of an object can be described in terms of its position, direction, and speed. The rate and motion of an object is determined by multiple factors. Performance Indicator 5.P.5A.5 Design and test possible devices or solutions that reduce the effects of friction on the motion of an object. Assessment Guidance The objective of this indicator is to design and test possible devices or solutions that reduce the effects of friction on the motion of an object. Therefore, the primary focus of the assessment should be for students to design and test possible devices or solutions: ask questions to identify problems; ask questions about the criteria and constraints of the device or solution; generate and communicate ideas for possible devices or solutions; build and test devices or solutions; determine if the devices or solutions solved the problem and refine the design if needed; and communicate the results of devices or solutions that reduce the effects of friction on the motion of an object. This could include but is not limited to students designing surfaces that would reduce the effect of friction. Students could have an assortment of resources available to test and determine which were most successful in reducing friction and its effect on the car’s motion. In addition to designing and testing possible devices or solutions, students should ask questions; plan and carry out investigations; analyze and interpret data; use mathematics and computational thinking; engage in argument from evidence and construct explanations; develop and use models. Previous and Future Knowledge
• 2.P.4 Motion • 8.P.2 Motion
Essential Knowledge It is essential for students to obtain and communicate information about friction as a force produced when objects are in contact with each other. Friction is a force that acts against motion. The following variables influence the effect of friction: Texture of the surface
• Rough surfaces tend to create more friction. • Smooth surfaces tend to create less friction.
Amount of surface area • The amount of surface area affects the friction between objects in liquids and gases. • The amount of surface area affects the friction on a moving object under the following
circumstances: air resistance (such as the size of a parachute) or the resistance of an object as it glides through water (such as a boat).
• The amount of surface area in contact usually does not affect friction between two solids. Lubrication
• Lubrication, for example oil or grease, reduces the effects of friction.
58

• Without lubrication, moving parts of machines would slow down or stop very quickly. Extended Knowledge
• Identify why these factors affect friction Science and Engineering Practices S.1B.1
59