
Supply to the Tropical North East Atlantic Minimum...
53
Oxygen Supply to the Tropical North East Atlantic Oxygen Minimum Zone Tim Fischer, Johannes Hahn Peter Brandt, Richard Greatbatch, Arne Körtzinger, Toste Tanhua, Martin Visbeck Donata Banyte, Marcus Dengler, Gerd Krahmann 18.11.2013
Transcript of Supply to the Tropical North East Atlantic Minimum...

Oxygen Supply to the Tropical North East AtlanticOxygen Minimum Zone
Tim Fischer, Johannes HahnPeter Brandt, Richard Greatbatch, Arne Körtzinger, Toste Tanhua, Martin Visbeck
Donata Banyte, Marcus Dengler, Gerd Krahmann
18.11.2013

1. Motivation
2
1. The Oxygen Minimum Zone of the Tropical North East Atlantic (TNEA OMZ)
2. Diapycnal Oxygen Supply
3. Eddy‐Driven Meridional Oxygen Supply3.1 Flux Gradient Parameterization3.2 Time Series Correlation3.3 Oxygen Flux Divergence
4. Summary and Outlook

1. Motivation
O2 distribution at 600m obtained from the Meteorexpedition 1925 – 1927 (Wattenberg, 1939)
3
Hier Wyrtki bzw. wie werdenOMZ gebildet, Rieselgraphik
Consumption/Supply einführen.
Low oxygen in the open ocean
Pocesses influencing the oxygenconcentration in the open ocean
Karstensen et al. 2008
270
µmol/kg
22518013590

1. Motivation
4
O2 distributionat 400m,in µmol/kg
(Karstensen etal. 2008)
Low oxygen in the open ocean

1. Motivation
5
O2 distributionat 400m,in µmol/kg
(Karstensen etal. 2008)
Sensitivity ofmarine organisms tolow oxygen
(Keeling et al. 2010, After Vaquer‐Sunyerand Duarte 2008)
Low oxygen in the open ocean

1. Motivation
6
O2 distributionat 400m,in µmol/kg
(Karstensen etal. 2008)
Low oxygen in the open ocean
Outgassing ofsupersaturated N2O
(Suntharalingam2000)

1. Motivation
7
O2 distributionat 400m,in µmol/kg
(Karstensen etal. 2008)
Low oxygen in the open ocean
TNEA OMZExpanding andintensifying
(Stramma et al. 2008)

1. Motivation
8Oschlies pers. comm. 2013
State‐of‐the‐art global models not capturing distribution nor levels (300m concentrations, µmol/kg)
OMZs in model simulations
WOA
Observations
(Max‐Planck‐Inst. HH) (NCAR)

1. Motivation
9
State‐of‐the‐art global models not capturing distribution nor levels (300m concentrations, µmol/kg)
OMZs in model simulations
WOA
Observations
In order to be able to better prognose future oceanic oxygen developments,It is necessary to understand involved physics and biology,
in particular the OMZ response to circulation and ventilation.
(One major scientific question of SFB 754: ‚Climate‐Biogeochemistry Interactions in
the Tropical Ocean‘)

1. Motivation
O2 distribution andequatorial current system(300m ‐ 500m depth)
Mean O2 along 23W
23°W section Brandt et al. (2010)
Brandt et al. (2010)
Oxygen Minimum Zone (OMZ) in the Tropical North East Atlantic (TNEA)
Mean zonal currents
10
1. Motivation
11
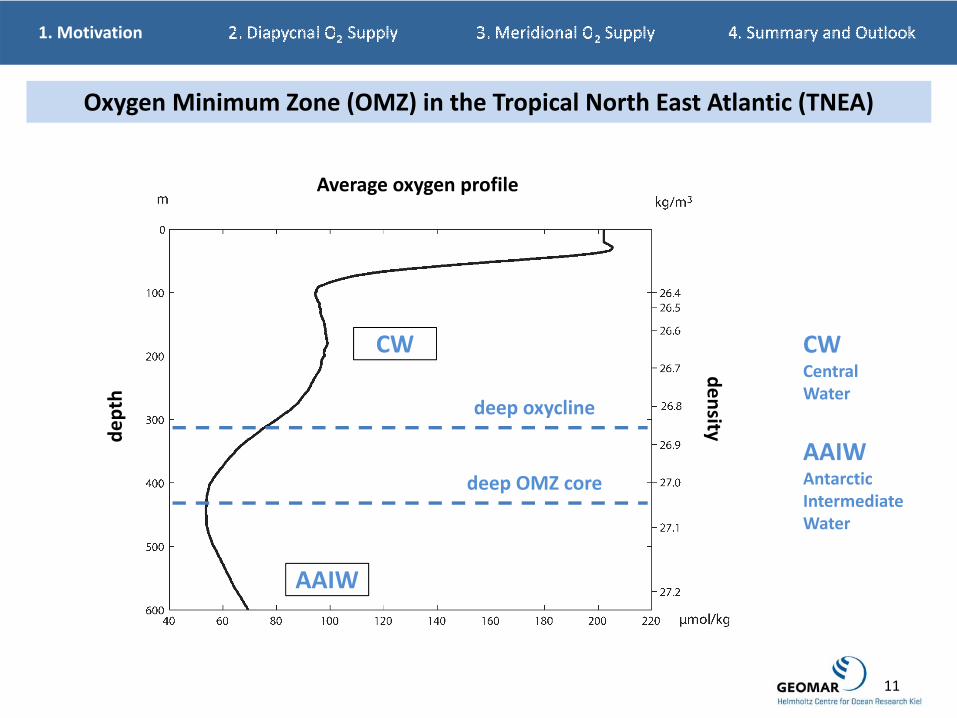
Oxygen Minimum Zone (OMZ) in the Tropical North East Atlantic (TNEA)
Average oxygen profile
deep oxycline
deep OMZ core
AAIW
CW CWCentral Water
AAIWAntarcticIntermediate Water
depth
density

1. Motivation
12
O2 budget: Processes in density coordinates
Diapycnaladvection
Diapycnaldiffusion
Source/Sink
Source/sink + isopycnal supply + diapycnal supply = tendency/storage
The supply is the difference of fluxes into and out of the volume, i.e. flux divergence

1. Motivation
‚Upwelling‘ Double diffusionand turbulence
Consump‐tion
13
Source/sink + isopycnal supply + diapycnal supply = tendency/storage
The only important source/sink term in the deep ocean is consumption.
O2 budget: Processes in density coordinates

1. Motivation
14
aOUR + R = 0consumption(Karstensen et al., 2008)
residual (total supply)
O2 budget for the TNEA OMZ region (mean profiles of budget terms)
Quantify some of themissing supply terms
Stationarityassumed

2. Diapycnal O2 Supply
15
1. The Oxygen Minimum Zone of the Tropical North East Atlantic (TNEA OMZ)
2. Diapycnal Oxygen Supply
3. Eddy‐Driven Meridional Oxygen Supply3.1 Flux Gradient Parameterization3.2 Time Series Correlation3.3 Oxygen Flux Divergence
4. Summary and Outlook

2. Diapycnal O2 Supply
16
Diapycnal processes
Consumption + isopycnal supply + diapycnal supply = tendency/storage
Diapycnal advection + double diffusion + turbulent diapycnal diffusion
cKF ∇⋅−= F∇−
Estimating diapycnal supply requires simultaneous data for K and c
Estimation methodMcDougall 1991
Estimation methodSt.Laurent and Schmitt 1999
Diapycnal flux Diapycnal supply to a volume(flux convergence)
c oxygen concentrationK diapycnal diffusivityF diapycnal flux∇ diapycnal gradient
( )

2. Diapycnal O2 Supply
17SF5CF3
2008‐2010
TRE MSS ADCP CTD‐O2
Measurement programme (2008‐2010)
cK ∇⋅
Analysis boxfor this study:
6 to 15 N, 30 to 15 W.
Tracer Release Experiment (TRE)Microstructure Profiles (MSS)
Acoustic Current Profiles (ADCP)
Oxygen Profiles (CTD‐O2)

2. Diapycnal O2 Supply
18
Integrative in space and time. Only 1 K value. ‚Groundtruthing‘.
Points in region and time.Vertical structures.
The 3 methods to estimate diapycnal diffusivity K
TRE MSS ADCPLines in region and time.Horizontal structures.
time
depth
K

2. Diapycnal O2 Supply
19
The 3 methods to estimate diapycnal diffusivity K
TRE MSS ADCP
All 3 methodswork in an overlappingdepth range.
Double diffusionis negligible here.
Integrative in space and time. Only 1 K value. ‚Groundtruthing‘.
Points in region and time.Vertical structures.
Lines in region and time.Horizontal structures.

2. Diapycnal O2 Supply
20
Diapycnal diffusivity K: intermediate results
sm
ADCPMSSK
25,
10)2.00.1( −⋅±=
sm
TREK
2510)2.02.1( −⋅±=
cKcKF ∇⋅−=∇⋅−=
Focus depthrange MSS: K is approximately constant with depth
in the focus depth range 150 – 500m
K from TRE and from MSS/ADCPagree in uncertainty limits
K is substantially strongerthan the expected background value
K and gradient c are independent in each depth layer.The two properties simplify the merging of the 3 methods.
‐5‐6 ‐4 ‐3lg ε
depth
500
400
300
200
100
Average dissipation profile

2. Diapycnal O2 Supply
21
Concentration : flux : supply
0 m
100 m
200 m
300 m
400 m
Oxygenconcentration
Diapycnalflux
Diapycnal flux in ‐Diapycnal flux out
Shallow Ox Min.
Zonal currents
Oxycline
OMZ core
cKF ∇⋅−= F∇c

2. Diapycnal O2 Supply
0 m
100 m
200 m
300 m
400 m
Oxygenconcentration
Diapycnalflux
Diapycnal flux in ‐Diapycnal flux out
Shallow Ox Min.
Zonal currents
Oxycline
OMZ core
22
cKF ∇⋅−= F∇c
Concentration : flux : supply

2. Diapycnal O2 Supply
0 m
100 m
200 m
300 m
400 m
Oxygenconcentration
Diapycnalflux
Diapycnal flux in ‐Diapycnal flux out
Shallow Ox Min.
Zonal currents
Oxycline
OMZ core
23
cKF ∇⋅−= F∇c
Concentration : flux : supply

2. Diapycnal O2 Supply
0 m
100 m
200 m
300 m
400 m
Oxygenconcentration
Diapycnalflux
Diapycnal flux in ‐Diapycnal flux out
Shallow Ox Min.
Zonal currents
Oxycline
OMZ core
24
cKF ∇⋅−= F∇c
Concentration : flux : supply

2. Diapycnal O2 Supply
0 m
100 m
200 m
300 m
400 m
Oxygenconcentration
Diapycnalflux
Diapycnal flux in ‐Diapycnal flux out
Shallow Ox Min.
Zonal currents
Oxycline
OMZ core
25
cKF ∇⋅−= F∇c
Concentration : flux : supply

2. Diapycnal O2 Supply
26
aOUR + O2,dia + R(1) = 0consumption(Karstensen et al., 2008)
diapycnal supply Isopycnal residual(advective + eddy supply)
Stationarityassumed
O2 budget
Fischer et al. 2013

3. Meridional O2 Supply
27
1. The Oxygen Minimum Zone of the Tropical North East Atlantic (TNEA OMZ)
2. Diapycnal Oxygen Supply
3. Eddy‐Driven Meridional Oxygen Supply3.1 Flux Gradient Parameterization3.2 Time Series Correlation3.3 Oxygen Flux Divergence
4. Summary and Outlook

3. Meridional O2 Supply
28
23°W section
Brandt et al. (2010)
Characteristic section cutting through the OMZ of the TNEA

3. Meridional O2 Supply
29
mean, |<u>|
mesoscale,
Zonal mean and mesoscale velocity along 23°W
2/)''( 22 vu
EKEUe
+=
=

3. Meridional O2 Supply
30
mean / mesoscale
mean > mesoscale
mean < mesoscale
Zonal mean and mesoscale velocity along 23°W

3. Meridional O2 Supply
31SFB 754, proposal 2nd phase, 2011
Eddy‐driven meridional O2 Flux
Two methods
(I) Flux gradient parameterizationanalysis based on repeated ship sections
(II) Correlation methodanalysis based on mooring time series
dydOKF e
2−=
'' 2OvF =

3. Meridional O2 Supply
(II) Velocity (ADCP)(I) Hydrography (CTD/O2)
32photo: A. Krupke Copyright GEOMAR
1.Repeated ship sections along 23°W (1999 ‐ 2011)
average # cruises = 8(> 500 profiles in upper 1000m)
background: O2 distribution at 400m depth fromWorld Ocean Atlas 2009
23°W section
average # cruises = 10(for depth range > 700m)

3. Meridional O2 Supply
33
O2 distribution at 400m depth fromWorld Ocean Atlas 2009
2. Climatological data – World Ocean Atlas 2009
annual mean hydrography of the Tropical Atlantic

3. Meridional O2 Supply
34
Goal: estimate a mean Ke profile
dydOKF e
2−=… to estimate eddy‐driven meridional O2 flux

3. Meridional O2 Supply
35
Goal: estimate a mean Ke profile
LUK ee~∝
eU … characteristic eddy velocity
L~ … characteristic eddy length scale
Basic approach:
L~
mean state mesoscale
2/)''( 22 vuEKEUe +==
A
B
A
B

3. Meridional O2 Supply
36
Ree LUK ∝
eeee LUcK =
β2e
RUL =
2/)''( 22 vuEKEUe +==
2. Rhines scale (Eden, 2007)
2
2 'O
OLeσ∇
=
16.0=ec
1. Mixing length theory (Armi and Stommel (1983),Ferrari and Polzin (2005))
2/)''( 22 vuEKEUe +==
Goal: estimate a mean Ke profile

3. Meridional O2 Supply
37
Brandt et al. (2010)
NATRE: Ferrari and Polzin (2005)
GUTRE: Banyte et al. (2013)
TNEA: Hahn et al. (subm.)
mean Ke profile

3. Meridional O2 Supply
38
dydOKF e
2−=
northward O2 flux
southward O2 flux
(I)
Brandt et al. (2010)
northward O2 flux at 400m‐600m
Eddy‐Driven Meridional O2 flux along 23°W

3. Meridional O2 Supply
39
1. The Oxygen Minimum Zone of the Tropical North East Atlantic (TNEA OMZ)
2. Diapycnal Oxygen Supply
3. Eddy‐Driven Meridional Oxygen Supply3.1 Flux Gradient Parameterization3.2 Time Series Correlation3.3 Oxygen Flux Divergence
4. Summary and Outlook

3. Meridional O2 Supply
40SFB 754, proposal 2nd phase, 2011
Eddy‐driven meridional O2 Flux
Two methods
(I) Flux gradient parameterizationanalysis based on repeated ship sections
(II) Correlation methodanalysis based on mooring time series
dydOKF e
2−=
'' 2OvF =

3. Meridional O2 Supply
41
hydrography (CTD/O2)
photo: B. Vogel
Moored observations along 23°W(O2 distribution: update from Brandt et al. (2010))
Copyright Teledyne RD Instruments
horizontal velocity (ADCP)
Moored observations along 23°W
background: O2 distribution at 400m depth fromWorld Ocean Atlas 2009

3. Meridional O2 Supply
42
Oxygen time series along 23°W300 m 500 m

3. Meridional O2 Supply
Oxygen and velocity time series at 5°N, 23°W
43
'' 2OvF =time series correlation:
'vvv += '222 OOO +=
(Reynolds decomposition)
where

3. Meridional O2 Supply
Brandt et al. (2010)northward O2 flux
southward O2 flux
44
dydOKF e
2−=
mooring data, 5°N
'' 2OvF =
(I)
(II)
8°N, 23°W
5°N, 23°W
mooring data, 5°N and 8°N
northward O2 flux at 400m‐600m
Eddy‐Driven Meridional O2 flux along 23°W

3. Meridional O2 Supply
45
1. The Oxygen Minimum Zone of the Tropical North East Atlantic (TNEA OMZ)
2. Diapycnal Oxygen Supply
3. Eddy‐Driven Meridional Oxygen Supply3.1 Flux Gradient Parameterization3.2 Time Series Correlation3.3 Oxygen Flux Divergence
4. Summary and Outlook

3. Meridional O2 Supply
above 400m: bands with strong O2 flux divergence/convergenceassociated with mean zonal currents
46
Meridional O2 flux divergence
⎟⎟⎠
⎞⎜⎜⎝
⎛=−
dydOK
dyd
dydF
e2
convergence of O2 flux
divergence of O2 flux
450m‐600m: O2 supply due to mesoscale (2.1 μmol kg‐1 yr‐1)
Eddy‐driven meridional O2 supply along 23°W

3. Meridional O2 Supply
consumption (Karstensen et al., 2008)
diapycnal supply residual (advective + zonal eddy supply)
meridionaleddy supply
aOUR + O2,dia + R(1) = 0
consumption(Karstensen et al., 2008)
diapycnal supply residual (advective + eddy supply)
47
average between350m ‐ 570m
Fischer et al. (2013)
aOUR + O2,dia + O2,y,eddy + R(2) = 0O2 budget
Term µmol kg‐1 yr‐1 % aOUR
aOUR ‐4.1 ‐‐‐
O2,dia 0.9 ∼20 %
O2,y,eddy 2.4 ∼60 %
R(2) 0.8 ∼20 %

3. Meridional O2 Supply
48
average between350m ‐ 570m
Term µmol kg‐1 yr‐1 % aOUR
aOUR ‐4.1 ‐‐‐
O2,dia 0.9 ∼20 %
O2,y,eddy 2.4 ∼60 %
R(3) 0.4 ∼10 %
∂tO2 ‐0.4 ∼10 %
aOUR + O2,dia + O2,y,eddy + R(3) = ∂tO2
consumption (Karstensen et al., 2008)
diapycnal supply residual (advective + zonal eddy supply)
meridionaleddy supply
O2 tendency (Brandt et al., 2010)
O2 budget

4. Summary and Outlook
49
1. The Oxygen Minimum Zone of the Tropical North East Atlantic (TNEA OMZ)
2. Diapycnal Oxygen Supply
3. Eddy‐Driven Meridional Oxygen Supply3.1 Flux Gradient Parameterization3.2 Time Series Correlation3.3 Oxygen Flux Divergence
4. Summary and Outlook

4. Summary and Outlook
50
OMZ core depth: mainly diapycnal (up to 30%) and meridionaleddy supply (>50%)
Summary
Diapycnal diffusivity K larger than expected,constant in 150 – 500m depth
Maximum diapycnal supply near OMZ core
450m – 600m: homogeneous eddy‐driven meridional O2 supply
Above 400m: bands with O2 flux divergence/convergenceassociated with mean zonal currents
Above OMZ core depth: strong residual supply (associated withmean zonal currents)

4. Summary and Outlook
51
Summary
Sketch of main ventilation processes.
AAIW
CWAdvection
Meridional Eddy Diffusion
DiapycnalDiffusion
Main oxygen supply processes in the TNEA OMZ(recent interpretation)

4. Summary and Outlook
52
Outlook
Tracer Release Experiment (OSTRE) in SFB phase II (2012 – 2015):Measure integrative lateral diffusivity Ke in OMZ core
Why is there that jump at 300m?
Expand the analyses to 800m depth (AAIW)
Main missing term: mean zonal advection

Thank you for your attention
BMBF SOPRAN BMBF NORDATLANTIK