Supply Chain Resilience Elements The Case of the Dairy Sector
403
Supply Chain Resilience Elements – The Case of the Dairy Sector ___________________________________________ A thesis submitted in fulfilment of the requirements for the Degree of Doctor of Philosophy in Management in the University of Canterbury By Rizwan Ahmad University of Canterbury 2018 __________________________________
Transcript of Supply Chain Resilience Elements The Case of the Dairy Sector
Supply Chain Resilience Elements – The Case
of the Dairy Sector
___________________________________________
A thesis submitted in fulfilment of
the requirements for the Degree of
Doctor of Philosophy in Management
in the University of Canterbury
By Rizwan Ahmad
University of Canterbury
2018
__________________________________

i
Dedicated to my mom ( جان امی ) and dad ( جان ابو ) for their love, prayers and support. I love you.

ii
Acknowledgements
I would like to extend my sincere thanks to all of those who made this journey possible for
me. First, I would like to express my gratitude to my supervisory team Dr Venkat Pulakanam,
Dr John Vargo and Dr Mesbahuddin Chowdhury. Their knowledge, professional guidance
and moral support have made this journey an amazing experience. A special thanks to my
senior supervisor, Dr Venkat, for all the critical comments and discussions that have helped
me improve as a researcher and, most importantly, as a person.
Thanks to Resilient Organisations for providing me with an opportunity to interact with a
team of energetic, diverse researchers that helped me socially and academically. Special
thanks to Dr John Vargo and Dr Erica Seville for encouraging me to apply for UC Doctoral
and QuakeCore extension scholarships. I am really grateful to University of Canterbury and
QuakeCore for providing me with the funds that made my study possible.
I would like to thank my family and friends for their support, patience, laughter and advice
during my PhD and beyond. Especially, to my lovely wife, Rabia; it was your unconditional
love and encouragement that kept me going through the challenging parts of this journey.

iii
Abstract
Supply chain resilience refers to the ability of a supply chain to prepare, respond, recover
and grow in the face of a disruption. This study aims to identify the elements that build a
resilient supply chain in the context of dairy sector; little research attention has been given
to that industry. The study also aims to understand the influence of the supply chain
resilience elements in relation to the various phases of a disruption – readiness, response,
recovery and learning & growth.
This study is primarily based on an inductive approach; case study methodology was
adopted to explore the phenomenon grounded in rich contextual data. Six supply chain
disruptions linked to two dairy supply chains, one in New Zealand and one in Pakistan, were
selected. Within the two supply chains, 42 relevant managers/owners across 23 different
supply chain partners participated in the study.
The findings of the study include the identification of various supply chain resilience
elements that enable organisations in a supply chain to better prepare, respond, recover
and learn from a disruption. Primarily, a prepared supply chain is the one that effectively
responds and quickly recovers from a disruption. The application of the disaster
management cycle reveals that supply chain resilience is a cyclic process in which
organisations in a supply chain develop resilience over-time through learning and
experience. In the dairy supply chain context, this study found that good quality
management practices play a critical role in avoiding or managing a food-safety disruption.
Theoretically, this study extends the resilience concept by adapting the disaster
management framework. Secondly, the application of the concept to the dairy sector is a
key contribution to knowledge since prior literature is mainly concerned with
manufacturing. The dairy sector of each country, New Zealand and Pakistan, plays a pivotal
role in the respective economies. Therefore, this study is useful to various stakeholders such
as government, dairy regulators and policymakers.

iv
Table of Contents
Acknowledgements ........................................................................................................................... ii
Abstract……………. ............................................................................................................................. iii
Table of Contents ............................................................................................................................. iv
List of Tables……. ...............................................................................................................................ix
List of Figures…… ...............................................................................................................................xi
Chapter 1. Introduction ............................................................................................................... 1
Overview and Research Motivation .................................................................................... 1
1.1.1. Research Aims and Objectives .................................................................................... 6
The Study Context – Dairy Sector ....................................................................................... 7
1.2.1. Global Dairy Outlook .................................................................................................. 7
Overview of New Zealand ................................................................................................ 10
1.3.1. New Zealand’s Business Environment ....................................................................... 11
1.3.2. New Zealand’s Dairy Sector ...................................................................................... 14
Overview of Pakistan ........................................................................................................ 18
1.4.1. Pakistan’s Business Environment .............................................................................. 18
1.4.2. Pakistan’s Dairy Sector ............................................................................................. 19
Thesis Structure ............................................................................................................... 23
Chapter 2. Literature Review .................................................................................................... 27
Introduction ..................................................................................................................... 27
SC Management ............................................................................................................... 27
SC Disruptions .................................................................................................................. 29
SC Risk Management ........................................................................................................ 31
Resilience ......................................................................................................................... 33
SC Resilience .................................................................................................................... 35
2.6.1. Why was the resilience concept adopted in the SC domain? ..................................... 37
2.6.2. What do SC resilience definitions talk about? ........................................................... 39
2.6.3. What are the key attributes of SC resilience? ............................................................ 47
2.6.4. What are the key research gaps in the field? ............................................................ 52
The Disaster Management Cycle ...................................................................................... 55
Understanding SC Networks ............................................................................................. 58
Theoretical Approaches and Application of other Discipline in SC Resilience Literature .... 63
Research Questions .......................................................................................................... 65
Chapter Summary ............................................................................................................ 67
Chapter 3. Research Design and Methodology .......................................................................... 68
Introduction ..................................................................................................................... 68
The Research Process – An Overview ............................................................................... 68
Research Philosophy ........................................................................................................ 70
3.3.1. Ontology .................................................................................................................. 71
v
3.3.2. Epistemology ............................................................................................................ 72
3.3.3. Naïve Realism (Positivism) ........................................................................................ 73
3.3.4. Naïve Relativism ....................................................................................................... 73
3.3.5. Critical Realism (Post-Positivism) .............................................................................. 74
3.3.6. Moderate Constructionism ....................................................................................... 75
3.3.7. Philosophical Positioning – Rationale ........................................................................ 76
Form of Inquiry – Qualitative Versus Quantitative Method ............................................... 77
3.4.1. Qualitative Research – Rationale .............................................................................. 78
Approach to Theory Development – The Abductive Approach .......................................... 79
Research Design ............................................................................................................... 81
3.6.1. Research Strategy ..................................................................................................... 82
3.6.2. Case Study Method – Rationale ................................................................................ 82
3.6.3. Multiple Case Study – Rationale ............................................................................... 84
3.6.4. Summary of Methodological Considerations............................................................. 86
Research Techniques and Procedures .............................................................................. 87
3.7.1. Selection of Case Supply Chains ................................................................................ 87
3.7.2. Unit of Analysis ......................................................................................................... 92
3.7.3. Research Protocol .................................................................................................... 93
3.7.4. Pilot Testing.............................................................................................................. 94
3.7.5. Ethical Approval ....................................................................................................... 94
3.7.6. Data Collection – Interview Process .......................................................................... 94
3.7.7. Data Collection – Secondary Sources ........................................................................ 99
3.7.8. Transcription ............................................................................................................ 99
3.7.9. Data Security .......................................................................................................... 100
Data Analysis .................................................................................................................. 100
3.8.1. Coding .................................................................................................................... 101
3.8.2. Cross-case Comparison ........................................................................................... 104
Research Quality – Evaluation ........................................................................................ 104
3.9.1. Dependability ......................................................................................................... 105
3.9.2. Credibility ............................................................................................................... 105
3.9.3. Transferability ........................................................................................................ 105
3.9.4. Conformability........................................................................................................ 106
Chapter Summary .......................................................................................................... 106
Chapter 4. Description of the Case Companies and their SCs .................................................. 108
Introduction ................................................................................................................... 108
Focal Organisation 1 (FO1) ............................................................................................. 108

vi
4.2.1. Products ................................................................................................................. 108
4.2.2. People and Culture ................................................................................................. 109
4.2.3. SC Structure ........................................................................................................... 109
4.2.4. Risk Management Plans .......................................................................................... 111
4.2.5. Generic SC Strategies – SCOR Model ....................................................................... 112
4.2.6. Summary – FO1’s SC ............................................................................................... 120
Focal Organisation 2 (FO2) ............................................................................................. 121
4.3.1. Products ................................................................................................................. 121
4.3.2. People and Culture ................................................................................................. 121
4.3.3. SC Structure ........................................................................................................... 122
4.3.4. Generic SC strategies – SCOR Model ....................................................................... 125
4.3.5. Summary – FO2’s SC ............................................................................................... 132
Chapter Summary .......................................................................................................... 132
Chapter 5. First Level Analysis: Identifying SC Resilience Elements ......................................... 134
Introduction ................................................................................................................... 134
Section A – Contextual Information on Selected SC Disruptions ...................................... 134
5.2.1. Disruption 1 – The Dicyandiamide (DCD) Issue ........................................................ 135
5.2.2. Disruption 2 – Botulism Scare ................................................................................. 138
5.2.3. Disruption 3 – Critical Raw Material (Lactose) Shortage .......................................... 142
5.2.4. Disruption 4 – Operational Issue (Product Hold) ..................................................... 144
5.2.5. Disruption 5 – Flood 2010 ....................................................................................... 146
5.2.6. Disruption 6 – Foot and Mouth Disease (FMD)........................................................ 150
Section B – Identifying SC Resilience Elements ............................................................... 152
5.3.1. Crisis Management Team ....................................................................................... 153
5.3.2. Risk Management ................................................................................................... 158
5.3.3. Situational Awareness and Quick Decision Making.................................................. 161
5.3.4. Collaboration .......................................................................................................... 167
5.3.5. Crisis Communication ............................................................................................. 172
5.3.6. Operational/SC Re-engineering .............................................................................. 177
5.3.7. Quality Management .............................................................................................. 180
5.3.8. Product Traceability and SC Visibility ...................................................................... 181
5.3.9. Supportive Organisational Culture and Learning Attitude ....................................... 184
SC Resilience Elements ................................................................................................... 189
5.4.1. Pre-disruption – Proactive Elements ....................................................................... 191
5.4.2. Post-disruption – Reactive Elements ....................................................................... 191
Chapter Summary .......................................................................................................... 192

vii
Chapter 6. Second Level Analysis: Comparative Analysis ........................................................ 193
Introduction ................................................................................................................... 193
Resilience Rating ............................................................................................................ 193
6.2.1. Resilience Performance Rating ............................................................................... 194
6.2.2. Criticality of Individual SC Resilience Elements to a Disruption ................................ 195
6.2.3. D1 – The DCD Issue ................................................................................................. 197
6.2.4. D2 – The Botulism Scare ......................................................................................... 198
6.2.5. D3 – Lactose Supply Issue ....................................................................................... 199
6.2.6. D4 – Operational Issue............................................................................................ 200
6.2.7. D5 – Flood 2010 ..................................................................................................... 201
6.2.8. D6 – Foot and Mouth Disease (FMD) ...................................................................... 202
6.2.9. Resilience Rating – Summary .................................................................................. 203
SC Resilience Elements: A Comparison of Major SC Disruptions (D1, D2 & D5) and
Operational Disruptions (D3, D4 & D6) ...................................................................................... 204
SC Resilience Elements: A Comparison of FO1’s SC in a Developed Country and FO2’s SC in
a Developing Country ................................................................................................................ 205
6.4.1. Distinct Vulnerabilities ............................................................................................ 206
6.4.2. SC Resilience Elements – Similarities and Differences ............................................. 207
Synthesis and Research Propositions .............................................................................. 209
Chapter Summary .......................................................................................................... 211
Chapter 7. Second Level Analysis: SC Resilience Elements and the Disaster Management Cycle 213
Introduction ................................................................................................................... 213
Disaster Management Framework ................................................................................. 213
The Disaster Management Framework Revisited ............................................................ 214
SC Resilience Elements – The Disaster Management Perspective ................................... 217
7.4.1. Readiness Phase ..................................................................................................... 218
7.4.2. Prelude-to-disruption Phase ................................................................................... 227
7.4.3. Response Phase ...................................................................................................... 228
7.4.4. Recovery Phase ...................................................................................................... 232
7.4.5. Learning and Growth Phase .................................................................................... 234
7.4.6. SC Resilience Core Elements ................................................................................... 237
SC Resilience Cycle ......................................................................................................... 241
Chapter Summary .......................................................................................................... 242
Chapter 8. Discussion and Conclusions.................................................................................... 243
Introduction ................................................................................................................... 243
Summary and Discussion of Findings .............................................................................. 243
8.2.1. SC Resilience Elements ........................................................................................... 245
8.2.2. SC Resilience – The Disaster Management Framework ........................................... 248
viii
8.2.3. SC Resilience of a Dairy SC ...................................................................................... 252
8.2.4. Understanding SC Resilience from a sub-network Perspective ................................ 253
8.2.5. Achieving Resilience in a Developing Country ......................................................... 254
8.2.6. SC Resilience in context of other SC Concepts ......................................................... 255
The Contributions of this Study ...................................................................................... 257
8.3.1. Theoretical Implications ......................................................................................... 258
8.3.2. Practical Implications .............................................................................................. 260
Research Limitations ...................................................................................................... 262
Future Research Directions ............................................................................................ 265
8.5.1. SC Resilience Elements – Situational Awareness and Quick Decision Making .......... 265
8.5.2. Application of the Disaster Management Framework ............................................. 265
8.5.3. Longitudinal Study .................................................................................................. 265
8.5.4. Extended SC Network Approach ............................................................................. 265
8.5.5. Empirical Testing .................................................................................................... 266
Concluding Remarks ....................................................................................................... 266
References………….. ....................................................................................................................... 268
Appendix A. Research Protocol (English & Urdu Versions) ......................................................... 285
Appendix B. Ethics Approval Letter, Information Sheet, Participant Consent Form (English & Urdu Versions)……………. ........................................................................................................................ 293
Appendix C. Detailed Case Description - DCD Issue (D1) ............................................................ 302
Appendix D. Detailed Case Description - Botulism Scare (D2) .................................................... 323
Appendix E. Detailed Case Description - Lactose Supply Issue (D3) ........................................... 344
Appendix F. Detailed Case Description - Operational Issue: Product hold (D4) ......................... 355
Appendix G. Detailed Case Description - Flood 2010 (D5) .......................................................... 364
Appendix H. Detailed Case Description - FMD (D6) .................................................................... 382
ix
List of Tables
Table 1.1 - Top 10 dairy companies in New Zealand by annual turnover (values in NZ$ million) ....... 17
Table 1.2 – Pakistan’s dairy output and consumption (figures in '000' tonnes), Source: (MOF, 2016) 20
Table 1.3 – Milk producer in Pakistan (based on herd size) .............................................................. 20
Table 2.1 – Classification of SC risk .................................................................................................. 32
Table 2.2 – Definitions of resilience ................................................................................................. 34
Table 2.3 – Key features of systematic literature review articles ...................................................... 37
Table 2.4 – SC resilience definitions ................................................................................................. 41
Table 2.5 – SC resilience elements from the literature ..................................................................... 49
Table 3.1 – An overview of methodology for the study .................................................................... 86
Table 3.2 – Selected SC disruptions (FO1’s SC) ................................................................................. 90
Table 3.3 – Selected SC disruptions for the FO2 SC .......................................................................... 92
Table 3.4 – FO1’s SC and the key informants (New Zealand) ............................................................ 96
Table 3.5 – FO2’s SC and key informants (Pakistan) ......................................................................... 98
Table 3.6 – Secondary data sources ................................................................................................. 99
Table 3.7 – Examples of Descriptive and Attribute coding .............................................................. 101
Table 3.8 – Examples of Process and In Vivo Coding....................................................................... 102
Table 4.1 – Key SC/operational strategies (FO1) ............................................................................. 120
Table 4.2 – A comparison of pasteurised and UHT milk .................................................................. 129
Table 4.3 – Key operational/SC strategies (FO2) ............................................................................. 132
Table 5.1 – Summary of the DCD disruption................................................................................... 137
Table 5.2 – Summary of the botulism scare ................................................................................... 141
Table 5.3 – Summary of the D3 (lactose shortage) ......................................................................... 143
Table 5.4 – Summary of D4 (operational issue: product hold) ........................................................ 146
Table 5.5 – Summary of D5 (flood-2010) ........................................................................................ 149
Table 5.6 – Summary of D6 (foot and mouth disease) .................................................................... 152
Table 5.7 – A Summary of the SC disruptions ................................................................................. 153
Table 5.8 – Crisis management team’s role and key activities ........................................................ 157
Table 5.9 – Key activities after understanding the post-disruption situation .................................. 163
Table 5.10 – Analysis of crisis communication for D1 and D2 ......................................................... 174
Table 5.11 – Operational/SC re-engineering activities learnt from each disruption ........................ 177
Table 5.12 – SC resilience elements, definitions and sub-elements ................................................ 189
Table 5.13 - Proactive and reactive sc resilience elements ............................................................. 192
Table 6.1 – Guidelines for rating criteria – resilience performance ................................................. 194
Table 6.2 – Rating of FO1's & FO2's SC - resilience performance .................................................... 195
Table 6.3 – Guidelines for rating criteria – criticality ...................................................................... 196
Table 6.4 – Rating of FO1's & FO2's SC – the criticality of individual sc resilience elements ............ 196
Table 6.5 - Distinct vulnerabilities and environmental challenges .................................................. 207
Table 7.1 – Quotations from the data - mitigation phase ............................................................... 224
Table 7.2 – Quotations from the data – the preparedness phase ................................................... 226
Table 7.3 – Quotations from the data – prelude-to-disruption ....................................................... 228
Table 7.4 – Quotations from the data - response phase ................................................................. 232
Table 7.5 – Quotations from the data – the recovery phase .......................................................... 234
Table 7.6 – Quotations from the data – on the learning & growth phase ....................................... 237

x
Table 7.7 – Quotations from the data - essential for all phases ...................................................... 240
Table C.1 – The media headlines regarding DCD contamination ..................................................... 304
Table C.2 – A summary of the follow-up press releases concerning DCD contamination ................ 310
Table C.3 – Effective communication versus the first press release by MPI .................................... 316
Table D.1 – Press releases regarding the botulism scare ................................................................ 325
Table D.2 – News headlines regarding the botulism scare .............................................................. 326
Table D.3 – Follow-up press releases by MPI.................................................................................. 332
Table D.4 – Effective communication versus the first press release by MPI .................................... 336
Table G.1 – Flood 2010 – the impact on the country’s economy (figures adopted from NDMA (2010b)
...................................................................................................................................................... 364
Table G.2 – Major floods in Pakistan 1950 - 2010 ........................................................................... 366
Table H.1 – The number of FMD cases recorded in Pakistan between 2013 and 2015 .................... 383

xi
List of Figures
Figure 1.1 – Global dairy production (comparison 2014-2024), Source: OECD-FAO (2015) ................. 8
Figure 1.2 – Top dairy exporting countries (2012-14), Source: OECD-FAO (2015) ............................... 9
Figure 1.3 – Top dairy importing countries (2012-14), Source: OECD-FAO (2015) ............................... 9
Figure 1.4 - New Zealand on a world map ........................................................................................ 11
Figure 1.5 – New Zealand exports (goods and services), Source: Statistics-NZ (2015b) ..................... 12
Figure 1.6 – New Zealand dairy exports, Source: FAOSTAT (2017) .................................................... 13
Figure 1.7 – New Zealand’s milk production (1981-2016), Source: DairyNZ (2016c) ......................... 15
Figure 1.8 - New Zealand’s milk production (per month) in 2016, Source: DairyNZ (2016a) .............. 16
Figure 1.9 - Generic value chain of the New Zealand dairy sector, Adapted from Commerce
Commission New Zealand (CCNZ, 2012)........................................................................................... 17
Figure 1.10 - Pakistan on the world map .......................................................................................... 18
Figure 1.11 - Pakistan's dairy imports - historical data (1981-2013), Source: FAOSTAT (2017) .......... 21
Figure 1.12 – Informal dairy value chain in Pakistan ......................................................................... 22
Figure 1.13 – The formal dairy value chain in Pakistan ..................................................................... 23
Figure 2.1 – Literature review process ............................................................................................. 36
Figure 2.2 – The organisational resilience framework, Source: ResOrgs (2018) ................................ 51
Figure 2.3 – Disaster management cycle .......................................................................................... 57
Figure 2.4 – Dyads and network structure (Ritter et al., 2004) ......................................................... 59
Figure 3.1 – Research process adopted in this research (modified from Yin (2014), Figure 2.5) ........ 70
Figure 3.2 – The philosophical approach chosen for this research (shaded-area) - Adopted from
Järvensivu and Törnroos (2010) ....................................................................................................... 76
Figure 3.3 –Abductive approach (Adopted from Järvensivu and Törnroos (2010) ............................. 81
Figure 3.4 – Multiple case study approach used in this research (Adopted from Yin (2014) .............. 86
Figure 3.5 – An overview of coding ................................................................................................ 104
Figure 4.1 – SC structure of the FO1 supply chain .......................................................................... 111
Figure 4.2 – The SCOR model - Adapted from Stewart (1997); SCC (2012); and Huang et al. (2005)114
Figure 4.3 - SC structure of FO2 ..................................................................................................... 125
Figure 5.1 – Role of crisis management team ................................................................................. 158
Figure 5.2 - Key features and sub-elements of risk management and a crisis management team ... 161
Figure 5.3 – Key enablers and processes of situational awareness and quick decision making ........ 166
Figure 5.4 – Various levels and owners of situational awareness.................................................... 167
Figure 5.5 - Key enablers and features of collaboration.................................................................. 172
Figure 5.6 - Key enablers and features of effective crisis communication ....................................... 176
Figure 5.7 – Key enablers and activities of operational/SC re-engineering ...................................... 180
Figure 5.8 – The key elements of quality management .................................................................. 181
Figure 5.9 – The key enablers of product traceability (post-disruption) .......................................... 184
Figure 5.10 – Key features of a supportive organisational culture and learning attitude ................. 189
Figure 6.1 – A SC resilience model ................................................................................................. 211
Figure 7.1 – The disaster management cycle .................................................................................. 214
Figure 7.2 – D1 timeline ................................................................................................................. 215
Figure 7.3 – D2 timeline ................................................................................................................. 215
Figure 7.4 – A revised disaster management cycle ......................................................................... 217
Figure 7.5 – SC resilience cycle....................................................................................................... 242
xii
Figure 8.1 – The SC resilience cycle ................................................................................................ 251
Figure C.1 – Impact of DCD disruption ........................................................................................... 306
Figure D.1 – Impact of the botulism disruption .............................................................................. 327
Figure G.1 – Flood affected regions ............................................................................................... 366
Figure H.1 – Reported FMD outbreaks in Pakistan January-March 2014, Source FAO (2014b) ........ 383

1
Chapter 1. Introduction
Overview and Research Motivation
Our world has become more connected than ever; with the latest technological
advancements and globalisation, we are now living in an era of linked economies. As a
profoundly intertwined world, a catastrophic disruption in one part of the world can
significantly cripple all of its linked economies and industries. Although globalisation has
brought many benefits for businesses, high interconnectedness has also amplified the
vulnerabilities for businesses during adverse events. We have seen many examples of such
disruptions and the trend has increased in the last decade. For example, in 2000, a fire at
the Phillips plant resulted in huge production disruption for Ericson and led to a sales loss of
$400 million (Chopra & Sodhi, 2004). Similarly, the 2011 earthquake and tsunami in Japan
significantly affected Toyota’s supply chain (SC) with a huge production drop resulting in a
loss of $72 million per day (Pettit, Croxton, & Fiksel, 2013). This disruption not only affected
the Japanese automotive industry, it adversely impacted the SCs of many automakers
worldwide, such as GM, BMW, Volkswagen, Ford and Chrysler (Canis, 2011).
The consequences of these SC disruptions, especially natural disruptions, cross
organisational boundaries with a ripple effect to multiple layers of SCs and, subsequently,
other related actors such as governments, consumers and financial institutes (Abe & Ye,
2013). With the increased complexity of today’s SCs and a recent growth in catastrophic
events, companies are more than ever vulnerable to these SC disruptions (Jüttner, Peck, &
Christopher, 2003; Pettit et al., 2013), with the threat of disruptions at any point of their SCs
(Kim, Chen, & Linderman, 2015). According to the Business Continuity Institute report (BCI,
2016), 66 percent of participating organisations lacked full visibility of their SC and 40
percent of organisations reported an inability to understand the sources of a disruption to
their SC. Coupled with these statistics, a World Economic Forum (WEF) report highlighted
that over 80 percent of organisations worry about their SC resilience (WEF, 2013).
The concept of SC management is relatively new and evolving (Alfalla-Luque & Medina-
Lopez, 2009; Gibson, Mentzer, & Cook, 2005) compared with other disciplines in business
and management. SC Management entails the effective management of a network of
relationships within an organisation and with its interconnected business partners such as

2
suppliers, manufacturing facilities, logistics providers and other related business functions.
The relationships among these business units facilitate the flow of material, information,
services and monetary flow with the aim of maximising profit and added value by
maintaining efficiencies and achieving customer satisfaction (Stock & Boyer, 2009).
Achieving these efficiencies requires a more holistic view that departs from the boundaries
of a single organisation (Ponomarov, 2012). Overall, the literature on SC management
highlights a number of concepts and strategies to gain efficiencies and sustainable
competitive advantage. For example, strategies such as agility, adaptability and alignment
(Lee, 2004), a responsive SC (Fisher, 1997), visibility and information across the SC (Liker &
Choi, 2004; Uta & Stan, 2011), postponement (Christopher & Holweg, 2011) and flexibility
(Uta & Stan, 2011), are required to better manage SC operations. One primary principle
behind these strategies is to control operations, build efficiencies and manage unexpected
situations effectively.
Over the years, the complexity and length of SCs have increased significantly (Blackhurst,
Craighead, Elkins, & Handfield, 2005), which increases various potential risks that jeopardize
SC activities. SC disruptions, such as immediate loss of a supplier or breakout of a disease in
agricultural land, can affect not only one organisation, but all of its linked business units and
stakeholders spread across the world. From the business perspective, disruptions can lead
to a loss of sales, profitability and market share (Ponomarov & Holcomb, 2009), and erodes
customer satisfaction. Though the probability of a disruptive event at one geographic
location at a given time might be low, the chances of a disruption happening somewhere in
the world are relatively high, which threatens today’s globally connected SCs. For global
companies, disruptive events offer significant operational challenges and, consequently,
result in significant financial repercussions (BCI, 2014, 2015). Because of this, interest in
exploring strategies to deal with SC disruptions effectively has recently increased
significantly (Blackhurst, Dunn, & Craighead, 2011).
The concept of SC resilience has become a buzzword in the business world, especially in the
last 15 years. It has gained increased importance from scholars in SC management
(Hohenstein, Feisel, Hartmann, & Giunipero, 2015; Ponomarov & Holcomb, 2009; Scholten
& Schilder, 2015; Sheffi, 2015). SC resilience entails identifying and proactively building
strategies to reduce the impact of an adverse event and it allows SCs to respond and
3
recover to their original state, or a new state, after a disruption (Jüttner & Maklan, 2011).
Most importantly, doing this enables organisations and SCs to achieve the fundamental aims
of SC management, i.e., to continue flow of material, information, services and monetary
flow, and achieve competitive advantage (Hamel & Välikangas, 2003; Ponomarov &
Holcomb, 2009), customer service and financial performance (Hohenstein et al., 2015). In
addition to satisfying the basic assumption of SC management, SC resilience integrates
various concepts discussed in the broader literature of SC management, such as SC
collaboration, agility, flexibility, redundancy and SC visibility (Hohenstein et al., 2015;
Kamalahmadi & Parast, 2016; Pettit et al., 2013), with the aim of highlighting a
comprehensive approach to plan, respond and recover effectively from adversity. SC
resilience departs from the traditional risk management approach of risk identification and
treatment, and takes a more proactive and holistic approach to build resilience in an
organisation and SC (Pettit, Fiksel, & Croxton, 2010), with the assumption that not all risks
can be identified and prevented (Jüttner & Maklan, 2011).
Fundamentally, the concept of resilience is multidimensional and multidisciplinary
(Ponomarov & Holcomb, 2009) and has been adopted in various disciplines, such as ecology
(Gunderson, 2000; Pickett, McGrath, Cadenasso, & Felson, 2014), psychology (Fletcher &
Sarkar, 2013), social systems (Folke, 2006), emergency management (Lindell, Prater, &
Perry, 2006), economics and business management (Hamel & Välikangas, 2003; Martin &
Sunley, 2015; Seville et al., 2008; Sheffi & Rice, 2005). For instance, in the context of
emergency management, a disaster resilient community learns from its experiences,
develops regulations and, accordingly, mobilises resources to either mitigate or effectively
respond to and recover from a disruption (Lindell et al., 2006). Scholars in the disaster
management literature (Altay & Green, 2006; Cozzolino, 2012; Kovács & Spens, 2007)
identify four stages of a disaster: Mitigation, Preparation, Response, and
Reconstruction/Recovery. In the context of SC management, Helferich and Cook (2002)
classify disaster management processes into proactive and reactive, where proactive
processes deal with the mitigation and preparedness stages and reactive processes deal
with the response and recovery stages of a disruption (Kovács & Spens, 2007; Pettit &
Beresford, 2005).

4
In the SC resilience literature, Hohenstein et al. (2015) identify four phases associated with
SC resilience: readiness, response, recovery and growth, which fundamentally correspond to
different phases of a disaster. Further, the literature talks about different strategies to build
a resilient SC that can be classified into two categories, proactive and reactive elements
(Benjamin, Mark, & Jerry, 2017; Hohenstein et al., 2015). Overall, disaster management
captures a holistic perspective to engage in various proactive decisions to mitigate or reduce
the impact of adversity in combination with various reactive decisions to effectively manage
a disruption, which corresponds to the definition of SC resilience (Scholten, Sharkey Scott, &
Fynes, 2014). Though theoretical similarities exist between these two disciplines, very little
is known about how the two concepts are related. Ponomarov and Holcomb (2009) suggest
that the disaster management phases directly relate to the SC resilience concept and
propose a theoretical framework incorporating readiness, response and recovery phases. A
similar concept was used by Scholten et al. (2014) and Chowdhury and Quaddus (2016) to
explore the concept of SC resilience. However, both of these studies ignored an essential
element of SC resilience, i.e., the growth phase. An empirical investigation is necessary to
establish how the various SC resilience concepts and elements relate to the different phases
of a disruption (Hohenstein et al., 2015). Therefore, the primary purpose of this study is to
address this gap.
To explore the gap, this study focusses on an empirical approach exploring the concept in an
agricultural context, specifically a dairy SC. The impact of a disruption to SCs operating in the
agricultural sector can be more severe than for other sectors. For example, floods directly
impact agriculture with a loss in production, damage to agricultural land, a shortage of raw
material, an increase in food prices and so can also present food security concerns (Edwards
et al., 2011). This happened in 2010, when severe flooding in Pakistan cost over US$10
billion, almost 50 percent (US$5.1 billion) was associated with the agricultural sector
(NDMA, 2011). This reflects the damage to 2.1 million hectares of agricultural land and
directly affected 1.5 million animals. Such disruptions not only affect organisations and SCs
within the agricultural sector; the food products become essential raw materials for other
stakeholders such as relief providing agencies and SCs. Coupled with this, the perishable
nature of the products, food safety concerns and high fluctuations in demand and supply
(Green, 2010; Salin, 1998; Shukla & Jharkharia, 2013; Van der Vorst & Beulens, 2002) create

5
more challenges for organisations operating in such an industry. These distinct
characteristics and numerous vulnerabilities during a disruption provide an opportunity to
explore the SC resilience concept in the agricultural context.
Mainly, the conceptual or theoretical approach has been the dominant research approach.
Whereas, relatively few scholars have explored the concept with an empirical lens
(Hohenstein et al., 2015; Kim et al., 2015; Tukamuhabwa, Stevenson, Busby, & Zorzini,
2015). Consequently, numerous authors stress reservations and limitations about existing
definitions, theoretical approaches and conceptual models in the field (Hohenstein et al.,
2015; Kamalahmadi & Parast, 2016; Kim et al., 2015; Mandal, 2014). Most importantly,
current understanding of the SC resilience concept is driven by the manufacturing sector; a
limited number of studies explore the concept in the agricultural sector (e.g., Leat and
Revoredo-Giha (2013)). This study empirically explores the concept of SC resilience in the
dairy sector context. Specifically, for various reasons, this study focuses on dairy SCs from
New Zealand and Pakistan. The uniqueness of Pakistan’s dairy sector as the fourth largest
dairy producer in the world (OECD-FAO, 2015), and New Zealand’s dairy sector as the top
dairy exporter deliver a distinct edge to this research. The importance of dairy sector SCs is
further discussed later (Section 1.2).
Furthermore, the available literature on SC resilience primarily focuses on developed
countries such as North America and Europe (Jüttner & Maklan, 2011; Pettit et al., 2013;
Scholten & Schilder, 2015; Sheffi, 2015), where most of the empirical investigation has been
undertaken around disruptions and companies operating in developed countries. In
contrast, developing and under-developed economies present a distinct business
environment compared with developed countries. This situation offers different challenges
and vulnerabilities to businesses operating in such countries (Rwakira, 2015). Various
developing countries, e.g. Pakistan, are home to numerous uncertainties such as natural
disruptions, political upheaval, economic problems, an underdeveloped primary sector, lack
of primary utilities and security threats. One can assume that a natural disruption (e.g., an
earthquake or flood) or a man-made disruption (e.g., a food security issue) could present
distinct challenges for businesses operating in developing countries. Benjamin et al. (2017)
explore the concept of SC resilience in a developing country context and report distinct SC
vulnerabilities for organisations/SCs operating in such countries. Similarly, inferences can be

6
drawn from the study by Kumar, Liu, and Scutella (2015), who study the stock market
impact of SC disruptions in developing versus developed countries and report a significant
financial impact on organisations operating in a developing country (India) compared with a
developed country (USA). It can be argued that the contextual differences and
vulnerabilities may require organisations/SCs to exercise distinct SC resilience strategies.
Therefore, we should appreciate the importance of SC disruptions and resilience from the
perspective of developing economies. The intertwined nature of businesses and global
interdependence make these economies more critical, since developed economies usually
depend on developing economies, for example, by sourcing various raw materials and,
predominantly, by selling various finished products. In line with these arguments, this study
features a case study comparison between New Zealand (a developed country) and Pakistan
(a developing economy) (WEF, 2018).
This study strongly appreciates the previous progress in the field since it provides a solid
foundation of understanding and comprehension of the concept. Based on the various gaps
in the literature, this study focuses on an empirical approach to develop and enhance
current understanding of SC resilience. The broad aim of this study is to investigate how
various SC resilience elements relate to the different phases of a disruption. To achieve this,
first, this study aims to explore SC resilience in the dairy SCs context.
1.1.1. Research Aims and Objectives
This study intends to explore the following research questions (RQs):
RQ1: What are the elements that help build a resilient supply chain in the context of a
dairy supply chain?
RQ1.1: How do the supply chain resilience elements differ for dairy
organisations operating in a developed country (New Zealand) compared with
organisations operating in a developing country (Pakistan)?
RQ1.2: How do the supply chain resilience elements differ for an operational
disruption compared with a major supply chain disruption?
RQ2: How do the various elements of supply chain resilience relate to the Disaster
Management Framework – Readiness, Response, Recovery and Learning & Growth?
7
The Study Context – Dairy Sector
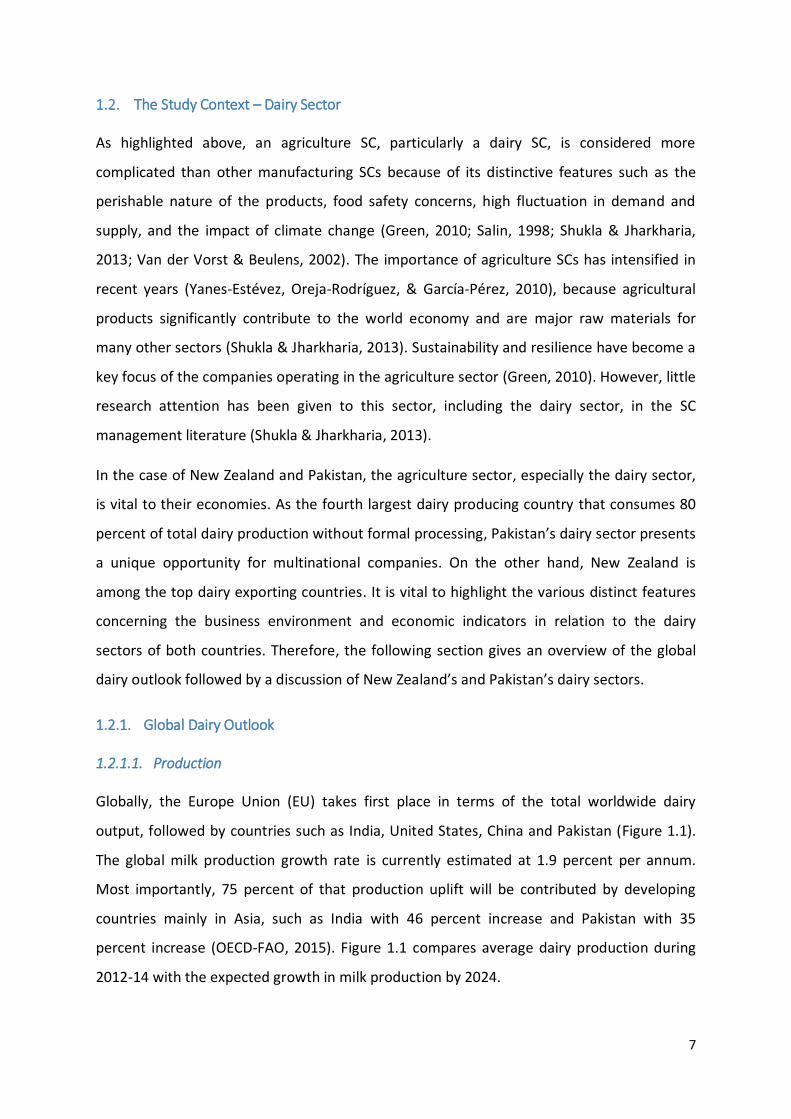
As highlighted above, an agriculture SC, particularly a dairy SC, is considered more
complicated than other manufacturing SCs because of its distinctive features such as the
perishable nature of the products, food safety concerns, high fluctuation in demand and
supply, and the impact of climate change (Green, 2010; Salin, 1998; Shukla & Jharkharia,
2013; Van der Vorst & Beulens, 2002). The importance of agriculture SCs has intensified in
recent years (Yanes-Estévez, Oreja-Rodríguez, & García-Pérez, 2010), because agricultural
products significantly contribute to the world economy and are major raw materials for
many other sectors (Shukla & Jharkharia, 2013). Sustainability and resilience have become a
key focus of the companies operating in the agriculture sector (Green, 2010). However, little
research attention has been given to this sector, including the dairy sector, in the SC
management literature (Shukla & Jharkharia, 2013).
In the case of New Zealand and Pakistan, the agriculture sector, especially the dairy sector,
is vital to their economies. As the fourth largest dairy producing country that consumes 80
percent of total dairy production without formal processing, Pakistan’s dairy sector presents
a unique opportunity for multinational companies. On the other hand, New Zealand is
among the top dairy exporting countries. It is vital to highlight the various distinct features
concerning the business environment and economic indicators in relation to the dairy
sectors of both countries. Therefore, the following section gives an overview of the global
dairy outlook followed by a discussion of New Zealand’s and Pakistan’s dairy sectors.
1.2.1. Global Dairy Outlook
1.2.1.1. Production
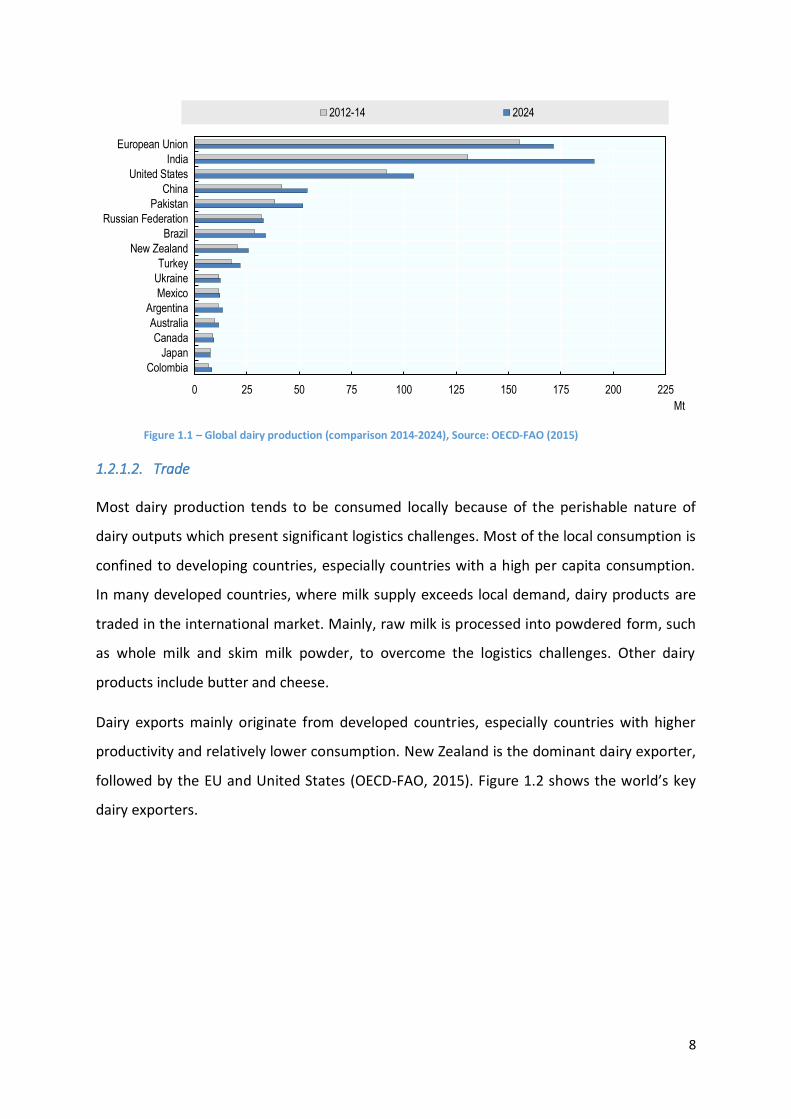
Globally, the Europe Union (EU) takes first place in terms of the total worldwide dairy
output, followed by countries such as India, United States, China and Pakistan (Figure 1.1).
The global milk production growth rate is currently estimated at 1.9 percent per annum.
Most importantly, 75 percent of that production uplift will be contributed by developing
countries mainly in Asia, such as India with 46 percent increase and Pakistan with 35
percent increase (OECD-FAO, 2015). Figure 1.1 compares average dairy production during
2012-14 with the expected growth in milk production by 2024.
8
Figure 1.1 – Global dairy production (comparison 2014-2024), Source: OECD-FAO (2015)
1.2.1.2. Trade
Most dairy production tends to be consumed locally because of the perishable nature of
dairy outputs which present significant logistics challenges. Most of the local consumption is
confined to developing countries, especially countries with a high per capita consumption.
In many developed countries, where milk supply exceeds local demand, dairy products are
traded in the international market. Mainly, raw milk is processed into powdered form, such
as whole milk and skim milk powder, to overcome the logistics challenges. Other dairy
products include butter and cheese.
Dairy exports mainly originate from developed countries, especially countries with higher
productivity and relatively lower consumption. New Zealand is the dominant dairy exporter,
followed by the EU and United States (OECD-FAO, 2015). Figure 1.2 shows the world’s key
dairy exporters.
0 25 50 75 100 125 150 175 200 225
Colombia
Japan
Canada
Australia
Argentina
Mexico
Ukraine
Turkey
New Zealand
Brazil
Russian Federation
Pakistan
China
United States
India
European Union
Mt
2012-14 2024

9
Figure 1.2 – Top dairy exporting countries (2012-14), Source: OECD-FAO (2015)
Regarding dairy imports, China is the major importing country for dairy products because of
its high per capita consumption, followed by North Africa, the Russia Federation, Mexico
and Saudi Arabia. Regarding dairy products, cheese is the primary exported commodity
followed by generic milk powder. Figure 1.3 shows the major dairy importing countries.
Figure 1.3 – Top dairy importing countries (2012-14), Source: OECD-FAO (2015)
Most importantly, global dairy trade is a highly uncertain activity because of various external
factors such as trade restrictions, the threat of disease breakouts, regulation changes and
environmental constraints. According to OECD-FAO (2015), New Zealand, a major exporter
of the dairy products, features highly favourable weather conditions. However, recently, the
0 0.5 1 1.5 2 2.5
Rest of the World
Argentina
Australia
United States
European Union
New Zealand
Mt
Butter Cheese Skim milk powder Whole milk powder
0 0.2 0.4 0.6 0.8 1
Indonesia
Japan
Saudi Arabia
Mexico
Russian Federation
North Africa
China
Mt
Butter Cheese Skim milk powder Whole milk powder
10
country has seen multiple crises in its dairy sector that affected the country’s dairy exports.
These crises have initiated changes in the regulatory requirements of various importing
countries, such as China and Sri Lanka (as highlighted by various informants in this study).
1.2.1.3. Dairy Prices
One of the significant vulnerabilities in the international dairy trade is a recent decline in
international trading prices, which, in 2015, reached their lowest level since 2009. This
significantly impacted the New Zealand dairy industry, where most of the dairy production is
subject to international trading. However, the recent uplift in the dairy prices depicts a
positive outcome for the country’s dairy industry.
Overview of New Zealand
New Zealand is home to 4.78 million people with a population growth rate of 0.8 percent1
(Statistics-NZ, 2015b). Geographically, New Zealand is located in the far southwest of the
Pacific Ocean. It consists of three Islands: North, South and Stewart Islands. The country is
separated by approximately 1500 kilometres of the Tasman Sea from Australia on the west.
Because of New Zealand’s very remote location, it is among the last Islands inhabited by
people. Figure 1.4 shows the location of New Zealand (Red Circle) on a world map.
1 Figure taken from World Bank http://www.worldbank.org/ (Retrieved on 11-04-17)

11
Figure 1.4 - New Zealand on a world map2
Initially inhabited by Maori in the 13th Century, British settlers signed the Treaty of Waitangi
in 1840, after which it became an official British colony. With a history of various conflicts
between the government and Maori tribes, the country eventually negotiated various
settlements, and over the years, has become a highly multicultural, independent state
(Statistics-NZ, 2015b).
1.3.1. New Zealand’s Business Environment
1.3.1.1. Economy
New Zealand’s economy comprises sizeable primary, services, and manufacturing sectors
with a GDP of $260 (NZD) billion. The GDP has increased steadily in the last decade with a
16.7 percent increase since 2007. A significant portion of GDP is driven by the service sector,
which contributes almost 64 percent of the country’s economy; the primary industries
(including the dairy sector) contribute only 8.6 percent (Statistics-NZ, 2015a).
2 Figure taken from Google Maps https://www.google.com/maps (Retrieved on 11-04-17)
12
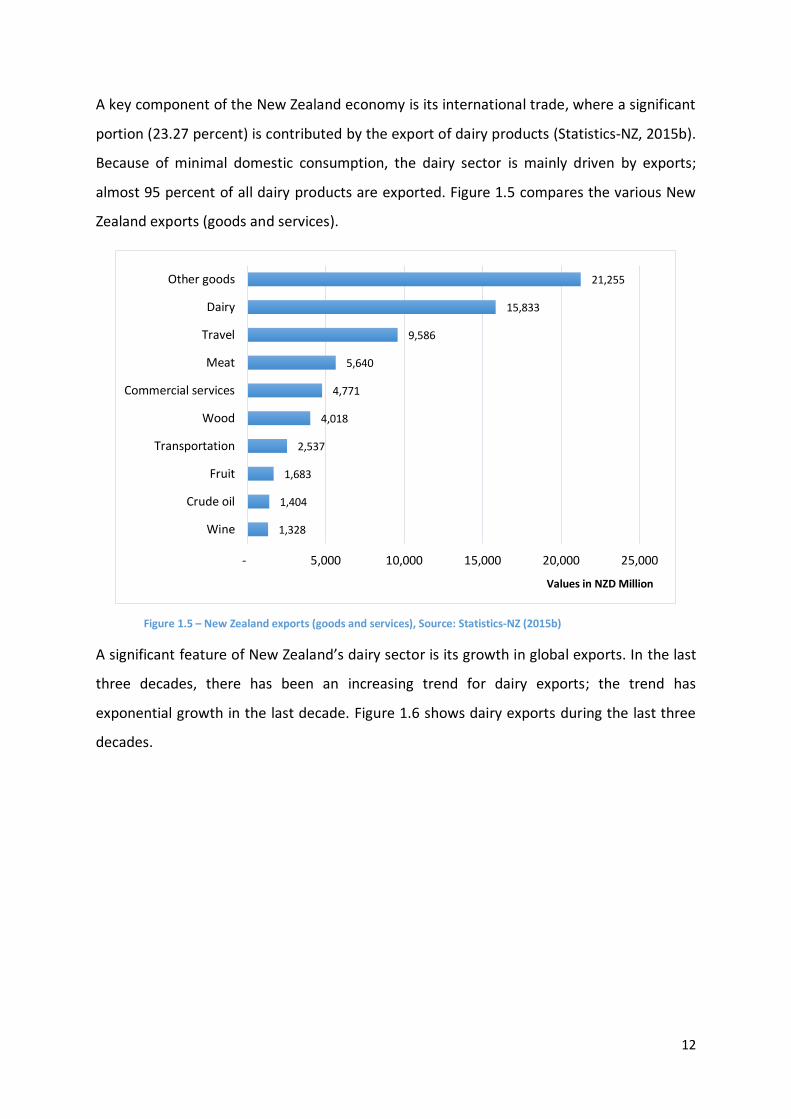
A key component of the New Zealand economy is its international trade, where a significant
portion (23.27 percent) is contributed by the export of dairy products (Statistics-NZ, 2015b).
Because of minimal domestic consumption, the dairy sector is mainly driven by exports;
almost 95 percent of all dairy products are exported. Figure 1.5 compares the various New
Zealand exports (goods and services).
Figure 1.5 – New Zealand exports (goods and services), Source: Statistics-NZ (2015b)
A significant feature of New Zealand’s dairy sector is its growth in global exports. In the last
three decades, there has been an increasing trend for dairy exports; the trend has
exponential growth in the last decade. Figure 1.6 shows dairy exports during the last three
decades.
1,328
1,404
1,683
2,537
4,018
4,771
5,640
9,586
15,833
21,255
- 5,000 10,000 15,000 20,000 25,000
Wine
Crude oil
Fruit
Transportation
Wood
Commercial services
Meat
Travel
Dairy
Other goods
Values in NZD Million

13
Figure 1.6 – New Zealand dairy exports, Source: FAOSTAT (2017)
1.3.1.2. Politics
The political structure of New Zealand is a parliamentary democracy as of a developed
country; the political structure is highly stable compared with any under-developed or
developing country (such as Pakistan). The government has made a significant contribution
to the regularisation of the business environment in the country. One political matter that
could affect the export-oriented dairy sector is the country’s foreign relations with its
trading partners. Over the years, the country has invested significantly in its political
linkages with its trading partners.
Various examples of dairy-related disruptions and the role of government are discussed
later in this thesis.
1.3.1.3. Technology
One critical determinant of growth in any sector revolves around the use of technology.
New Zealand is the home of large, commercial dairy farms, with an average herd size of 419
cows (DairyNZ, 2016c). With the large herd size, over the years, dairy farmers have adopted
various technological advances to improve farm operations and best practice. Sophisticated
equipment has been developed for numerous farm operations; with the Pakistan dairy
0
2
4
6
8
10
12
19
82
19
83
19
84
1985
1986
19
87
19
88
19
89
19
90
19
91
19
92
19
93
19
94
19
95
19
96
19
97
19
98
19
99
20
00
2001
2002
20
03
20
04
20
05
20
06
20
07
20
08
20
09
20
10
20
11
20
12
20
13
Values in USD Billion

14
sector this is almost non-existent. The following are a few of the highlights of these
advances in dairy farm operations (DairyNZ, 2016b);
Automatic feeding systems
Electronic ID (EID) systems
Robotic milking systems
Automated drafting systems
1.3.1.4. Environment
A country’s environment is a crucial factor driving primary industries, most importantly, the
dairy industry. One critical attribute of New Zealand is its supportive climate that has
enabled the dairy industry to hold a competitive edge over other countries. The moderate
temperature, sufficient water and adequate soil contribute to an efficient pasture-based
system that positively relates to optimal milk production (DairyNZ, 2016a). Furthermore, the
dairy industry has developed various practices to ensure long-term sustainability of the
environment, which has become a critical driver in competing with its competitors (DairyNZ,
2016d).
1.3.2. New Zealand’s Dairy Sector
As highlighted above, New Zealand’s environment provides essential support to its dairy
sector so farmers provide grass-feed throughout the year. This is reflected in cost-efficient
milk production that allows farmers to invest in other resources on their farm. Through the
combination of technological advances, increased herd size and research and development,
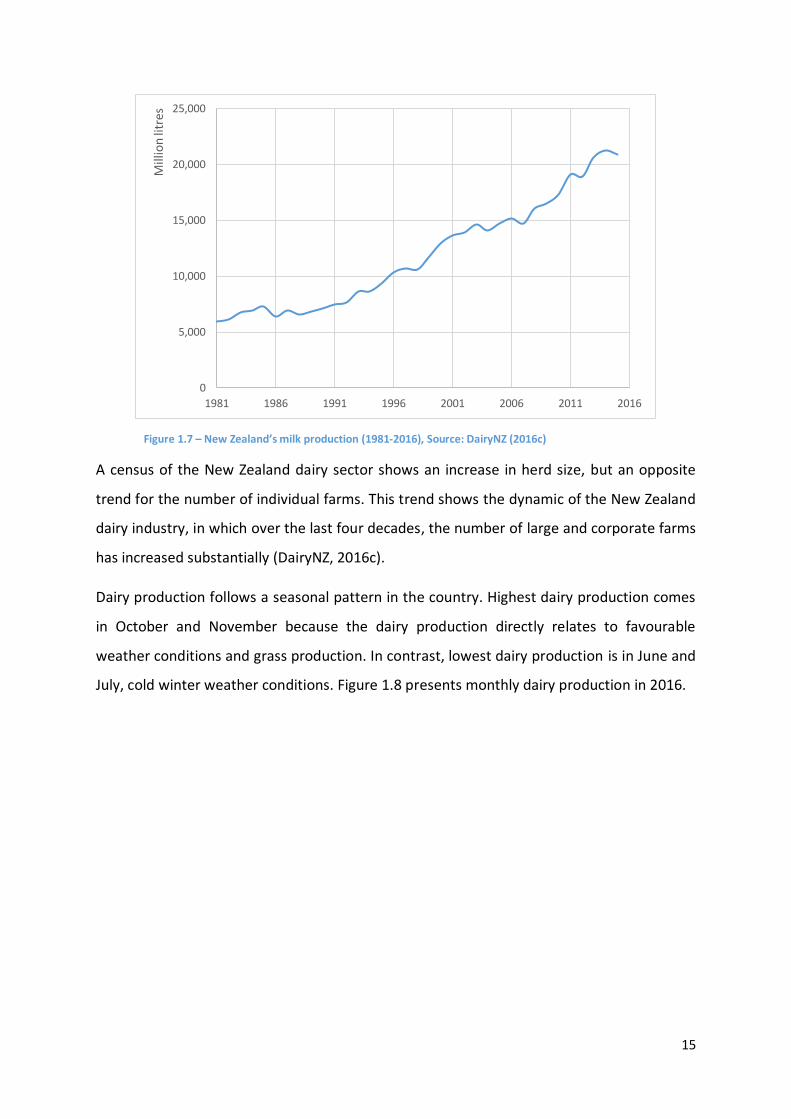
milk production has significantly grown in the last four decades. Figure 1.7 shows historical
dairy production data for New Zealand.
15
Figure 1.7 – New Zealand’s milk production (1981-2016), Source: DairyNZ (2016c)
A census of the New Zealand dairy sector shows an increase in herd size, but an opposite
trend for the number of individual farms. This trend shows the dynamic of the New Zealand
dairy industry, in which over the last four decades, the number of large and corporate farms
has increased substantially (DairyNZ, 2016c).
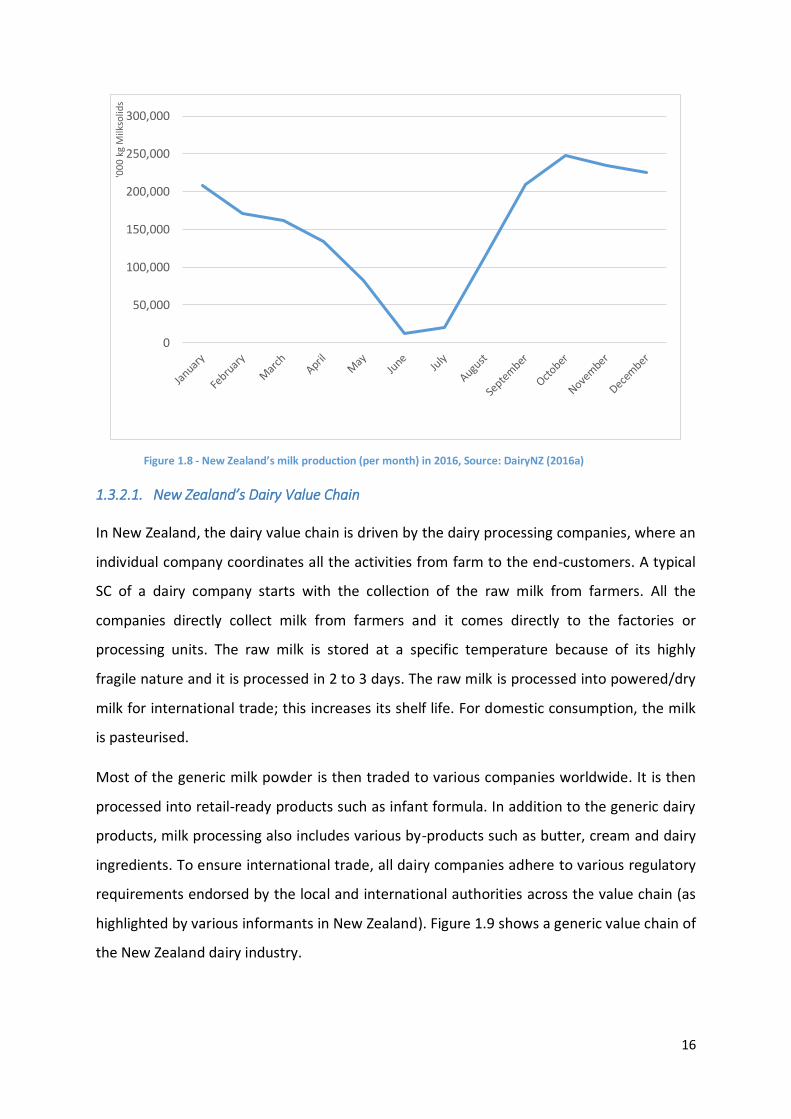
Dairy production follows a seasonal pattern in the country. Highest dairy production comes
in October and November because the dairy production directly relates to favourable
weather conditions and grass production. In contrast, lowest dairy production is in June and
July, cold winter weather conditions. Figure 1.8 presents monthly dairy production in 2016.
0
5,000
10,000
15,000
20,000
25,000
1981 1986 1991 1996 2001 2006 2011 2016
Mill
ion
litr
es
16
Figure 1.8 - New Zealand’s milk production (per month) in 2016, Source: DairyNZ (2016a)
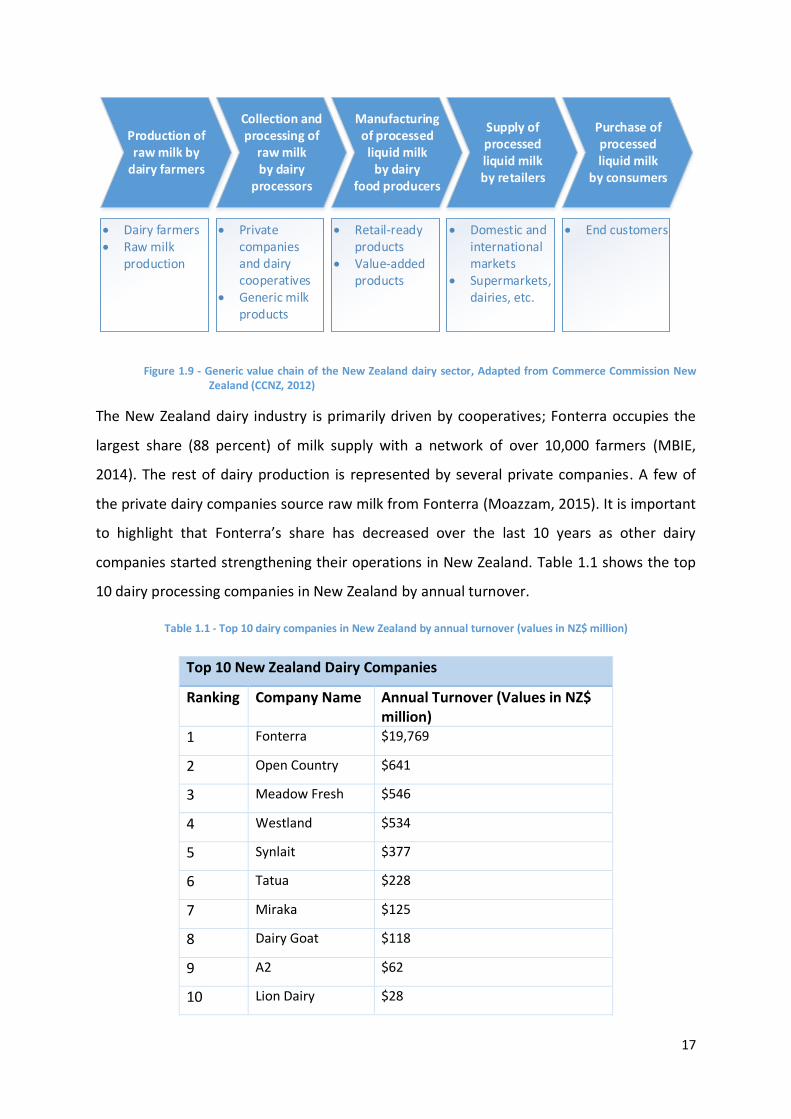
1.3.2.1. New Zealand’s Dairy Value Chain
In New Zealand, the dairy value chain is driven by the dairy processing companies, where an
individual company coordinates all the activities from farm to the end-customers. A typical
SC of a dairy company starts with the collection of the raw milk from farmers. All the
companies directly collect milk from farmers and it comes directly to the factories or
processing units. The raw milk is stored at a specific temperature because of its highly
fragile nature and it is processed in 2 to 3 days. The raw milk is processed into powered/dry
milk for international trade; this increases its shelf life. For domestic consumption, the milk
is pasteurised.
Most of the generic milk powder is then traded to various companies worldwide. It is then
processed into retail-ready products such as infant formula. In addition to the generic dairy
products, milk processing also includes various by-products such as butter, cream and dairy
ingredients. To ensure international trade, all dairy companies adhere to various regulatory
requirements endorsed by the local and international authorities across the value chain (as
highlighted by various informants in New Zealand). Figure 1.9 shows a generic value chain of
the New Zealand dairy industry.
0
50,000
100,000
150,000
200,000
250,000
300,000'0
00
kg
Milk
solid
s
17
Production of raw milk by
dairy farmers
Collection and processing of
raw milk by dairy
processors
Dairy farmers Raw milk
production
Private companies and dairy cooperatives
Generic milk products
Retail-ready products
Value-added products
Domestic and international markets
Supermarkets, dairies, etc.
End customers
Manufacturing of processed
liquid milk by dairy
food producers
Supply of processed liquid milk by retailers
Purchase of processed liquid milk
by consumers
Figure 1.9 - Generic value chain of the New Zealand dairy sector, Adapted from Commerce Commission New Zealand (CCNZ, 2012)
The New Zealand dairy industry is primarily driven by cooperatives; Fonterra occupies the
largest share (88 percent) of milk supply with a network of over 10,000 farmers (MBIE,
2014). The rest of dairy production is represented by several private companies. A few of
the private dairy companies source raw milk from Fonterra (Moazzam, 2015). It is important
to highlight that Fonterra’s share has decreased over the last 10 years as other dairy
companies started strengthening their operations in New Zealand. Table 1.1 shows the top
10 dairy processing companies in New Zealand by annual turnover.
Table 1.1 - Top 10 dairy companies in New Zealand by annual turnover (values in NZ$ million)
Top 10 New Zealand Dairy Companies
Ranking Company Name Annual Turnover (Values in NZ$ million)
1 Fonterra $19,769
2 Open Country $641
3 Meadow Fresh $546
4 Westland $534
5 Synlait $377
6 Tatua $228
7 Miraka $125
8 Dairy Goat $118
9 A2 $62
10 Lion Dairy $28
18
Adapted from: MBIE (2014)
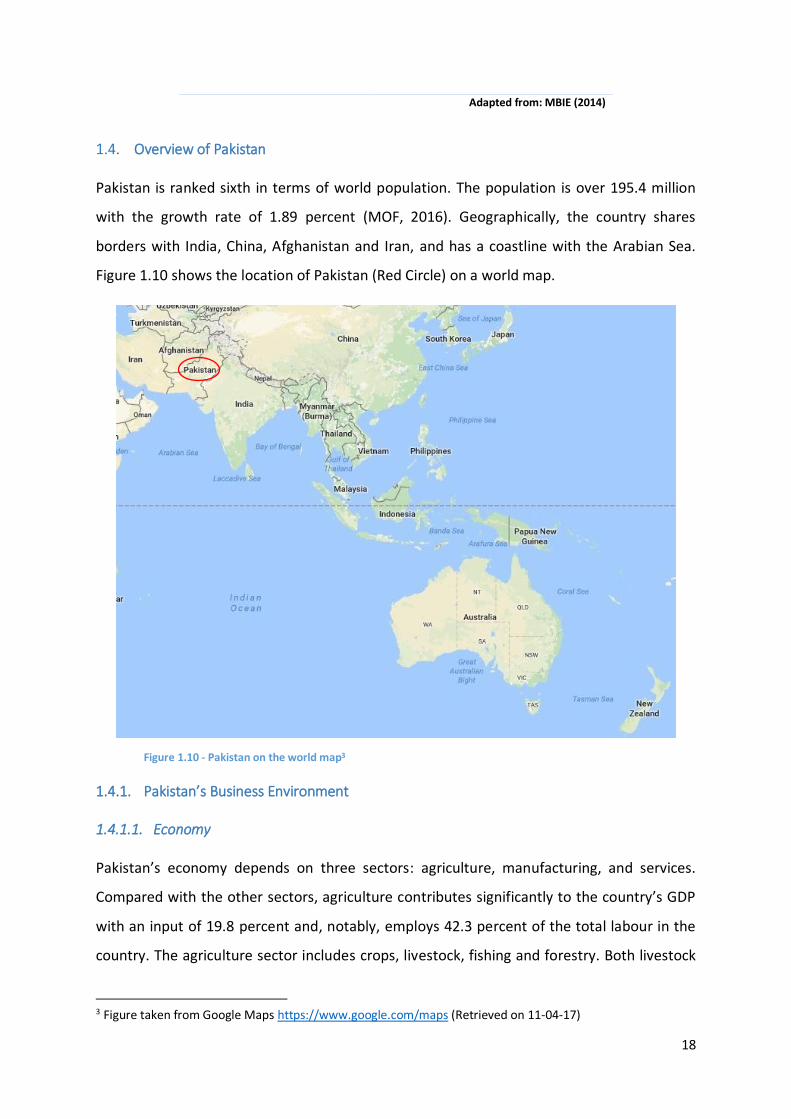
Overview of Pakistan
Pakistan is ranked sixth in terms of world population. The population is over 195.4 million
with the growth rate of 1.89 percent (MOF, 2016). Geographically, the country shares
borders with India, China, Afghanistan and Iran, and has a coastline with the Arabian Sea.
Figure 1.10 shows the location of Pakistan (Red Circle) on a world map.
Figure 1.10 - Pakistan on the world map3
1.4.1. Pakistan’s Business Environment
1.4.1.1. Economy
Pakistan’s economy depends on three sectors: agriculture, manufacturing, and services.
Compared with the other sectors, agriculture contributes significantly to the country’s GDP
with an input of 19.8 percent and, notably, employs 42.3 percent of the total labour in the
country. The agriculture sector includes crops, livestock, fishing and forestry. Both livestock
3 Figure taken from Google Maps https://www.google.com/maps (Retrieved on 11-04-17)
19
and crops contribute a significant share to the dairy sector; livestock alone contributes a
significant portion (58.6 percent) of the agriculture sector, and 11.6 percent of the country’s
GDP (MOF, 2016).
1.4.1.2. Politics
Since its inception, Pakistan has encountered much political instability with almost 30 years
of martial law. This uncertain political scenario has been a significant pressure for business
activities, both positively and negatively. Notably, every government and military
dictatorship brought its own laws with significant implications on commerce activities.
However, the political situation has become more stable in the last 15 years, with three
consecutive democratic governments.
1.4.1.3. Technology
With marginalised dairy practices and a high concentration of small farmers, the Pakistan
dairy sector is mainly characterised as informal and outdated in terms of the latest
technology. Most of the best practices and latest technology are with farmers linked to
private dairy companies. They represent only 15 percent of the country’s total dairy output.
In terms of the herd size, 85 percent of dairy farmers own only 1-4 animals (Zia, Mahmood,
& Ali, 2011), which shows the small scale of their operations and highly marginalised
practices. The significant obstacles to the adoption of the latest dairy practices and
technology include lack of government involvement, low literacy, widespread poverty and
lack of dairy infrastructure.
1.4.2. Pakistan’s Dairy Sector
As highlighted above, Pakistan’s livestock sector contributes significantly to the country’s
economy, e.g., almost 8 million households in the country’s rural areas are directly or
indirectly connected with the livestock sector. This makes Pakistan the fourth largest
country in terms of the global dairy production. Table 1.2 shows the country’s dairy output
and consumption. Recently, dairy production has increased steadily resulting mainly from
growth in herd size (MOF, 2016). This increase cannot be linked with an uplift in animal
productivity because of the country’s marginalised dairy practices (Zia et al., 2011).

20
Table 1.2 – Pakistan’s dairy output and consumption (figures in '000' tonnes), Source: (MOF, 2016)
Pakistan’s dairy sector can be characterised as an informal sector, with most dairy farmers
owning 1-4 animals. The trend in most of developed countries such as Europe, US, and
Australia, is opposite; mostly corporate or commercial farms dominate the dairy sector.
Table 1.3 shows the distribution of milk producers related to herd size.
Table 1.3 – Milk producer in Pakistan (based on herd size)
Milk Producer by Herd Size
Herd Size Milk Producers (Percentage)
1-4 84
5-10 14
>10 2
Adapted from: Zia et al. (2011)
One of the distinguishing features of Pakistan’s dairy industry is its reliance on buffalo milk
rather than cow milk (see Table 1.2); in developed countries it is the opposite. This results in
significant challenges for farmers to achieve optimal dairy production, because operating
costs remain high for milk production from buffalo with a significantly lower output
compared with cows. The prime reason for the high concentration of buffalo relates to
consumer preferences; the fat content, colour and milk density are high in buffalo milk (Zia
Species 2013-14 2014-15 2015-16
Cow 18,027 18,706 19,412
Buffalo 31,252 32,180 33,137
Sheep 38 38 39
Goat 822 845 867
Camel 851 862 873
Total 50,990 52,632 54,328
Cow 14,421 14,965 15,529
Buffalo 25,001 25,744 26,510
Sheep 38 38 39
Goat 822 845 867
Camel 851 862 873
Total 41,133 42,454 43,818
Milk
(Gro
ss P
rod
uct
ion
)
Milk
(Hu
man
Co
nsu
mp
tio
n)
21
et al., 2011). However, recently, this trend has shifted because private dairy companies have
started encouraging their connected dairy farmers to increase milk production from cows
because of the high output and significantly lower production costs.
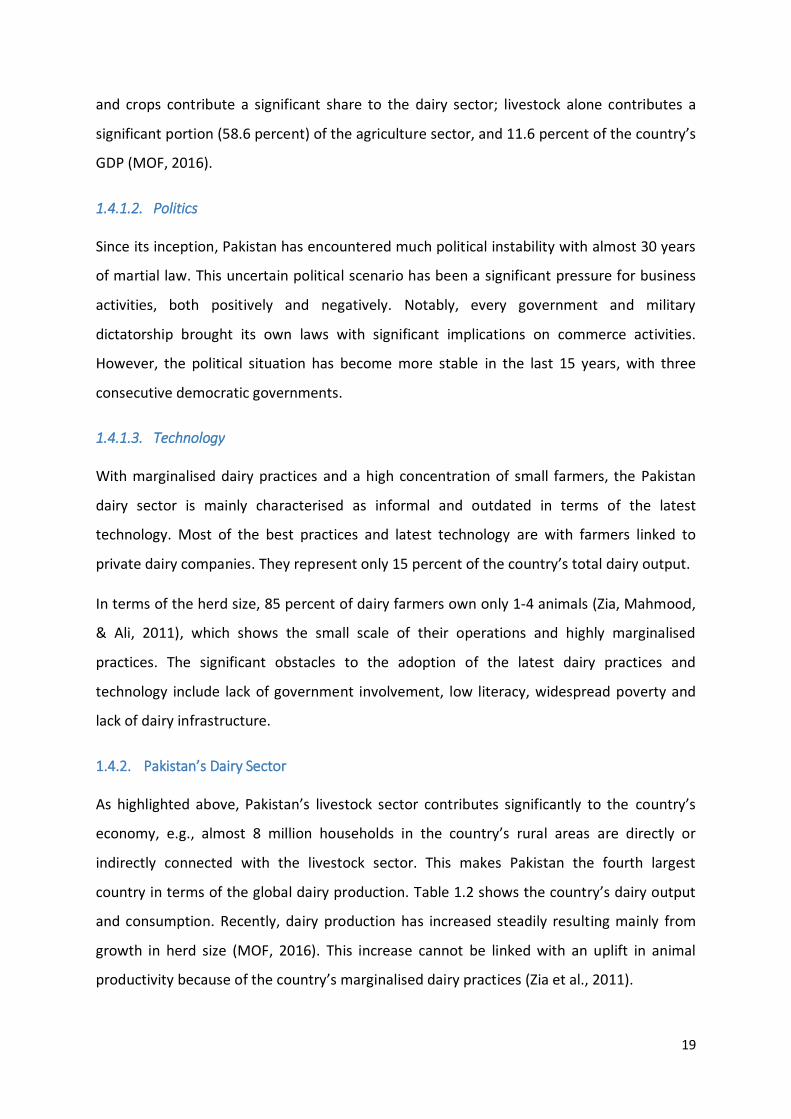
1.4.2.1. Dairy Supply and Demand
Pakistan faces a deficit in satisfying local dairy demand. As reported by Zia et al. (2011), the
demand and supply deficit will likely reach up to 55 million tonnes per annum by 2020. To
fill this deficit, the dairy sector imports milk from foreign countries in the form of milk
powder. In the last 10 years, the import of dairy powder has increased substantially (USDA-
FAS, 2016), mainly by the corporate sector (Zia et al., 2011). Total dairy imports reached PKR
21.14 million (USD 204,367) in 2015, double 2014 imports. Dairy companies import mainly
from the EU, US, Australia and New Zealand (USDA-FAS, 2016) (see Figure 1.11).
Figure 1.11 - Pakistan's dairy imports - historical data (1981-2013), Source: FAOSTAT (2017)
1.4.2.2. Pakistan’s Dairy SC
As a developing country, Pakistan’s dairy sector features various distinct attributes
compared with the dairy sector of a developed country such as New Zealand. A few of these
characteristics are essential in the context of this thesis.
The dairy value chain in Pakistan consists of two different channels: formal and informal.
Dairy processing companies represent the formal channel, which includes collection,

22
processing and marketing of the dairy products. With the informal channel milk flows
through various actors without any processing; it is referred to as “fresh milk”. As
highlighted by Zia (2007), the formal sector represents only 3-5 percent of the country’s
total dairy production; the rest of the dairy produce (95-97 percent) comes from informal
(traditional) channels. As highlighted by various informants in Pakistan, the informal and
formal channels are described below (refer to Zia (2006) for detailed description):
Informal Channel – The end-consumers largely rely on this channel as the primary
source of their daily milk consumption. Many people consider this channel as a most
reliable source from which to buy fresh milk. This channel starts at dairy farmers,
mainly with small scale dairy operations (1-4 herd size). Raw milk is collected by a
milkman (“Dhoodi” in Urdu) or milk contractor. A milkman or contractor usually
collects milk from various small farmers and applies basic techniques to keep the raw
milk at a low temperature. The milkmen or contractors either directly deliver to
consumers or to milk shops. In some cases, milk contractors also deliver raw milk to
local bakeries for use in various other products. Figure 1.12 shows a generic value
chain for the informal channel.
Dairy Farmer
Milkman (Dhoodi)
De-Creamer/Baker
Contractor
Retailer (Milk Shop)
Consumer
Flow of dairy products (except milk)
Flow of fresh milk
Figure 1.12 – Informal dairy value chain in Pakistan
Formal Channel – The dairy companies operate as the key driving entity in the value
chain. Like the informal channel, the dairy operations start with the collection of raw
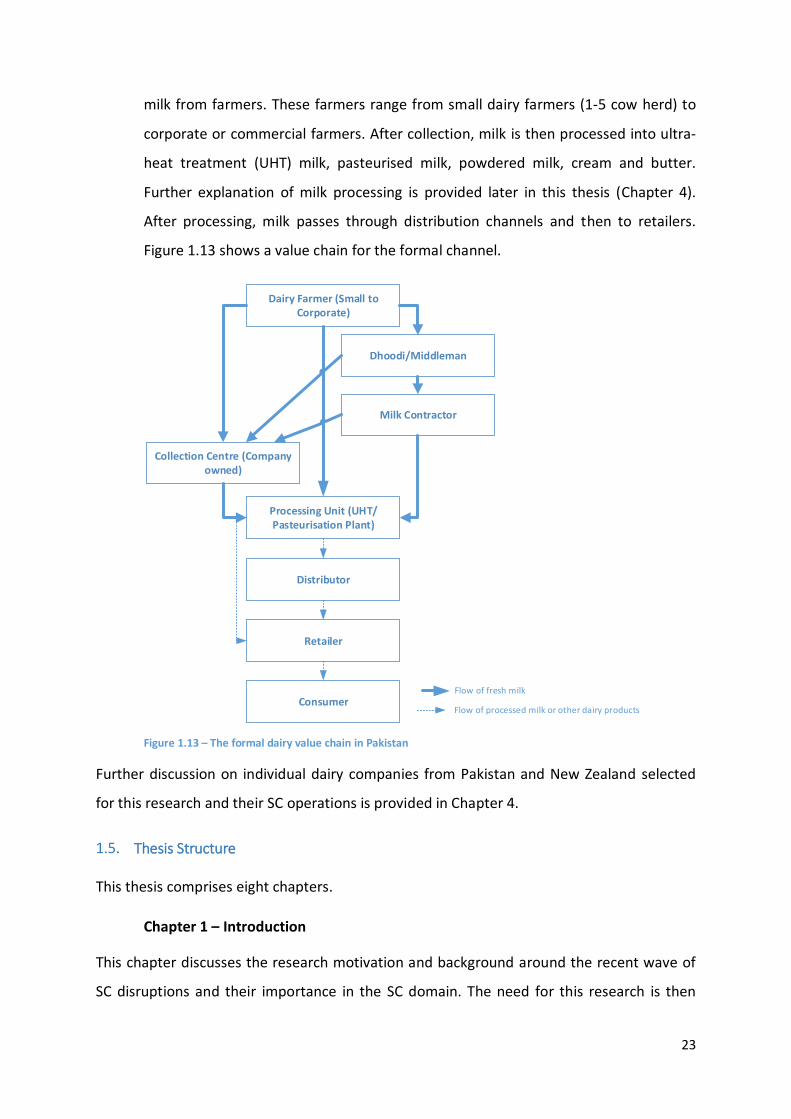
23
milk from farmers. These farmers range from small dairy farmers (1-5 cow herd) to
corporate or commercial farmers. After collection, milk is then processed into ultra-
heat treatment (UHT) milk, pasteurised milk, powdered milk, cream and butter.
Further explanation of milk processing is provided later in this thesis (Chapter 4).
After processing, milk passes through distribution channels and then to retailers.
Figure 1.13 shows a value chain for the formal channel.
Dairy Farmer (Small to Corporate)
Collection Centre (Company owned)
Dhoodi/Middleman
Processing Unit (UHT/Pasteurisation Plant)
Flow of processed milk or other dairy products
Flow of fresh milk
Milk Contractor
Distributor
Retailer
Consumer
Figure 1.13 – The formal dairy value chain in Pakistan
Further discussion on individual dairy companies from Pakistan and New Zealand selected
for this research and their SC operations is provided in Chapter 4.
Thesis Structure
This thesis comprises eight chapters.
Chapter 1 – Introduction
This chapter discusses the research motivation and background around the recent wave of
SC disruptions and their importance in the SC domain. The need for this research is then
24
outlined and the study’s focus on the agricultural sector is rationalised. Then the research
questions of this study are defined, followed by a brief description highlighting the context
of the two countries, New Zealand and Pakistan.
Chapter 2 – Literature Review
This chapter examines what has already been explored about SC resilience. The chapter
begins by defining the core concepts of SC, SC management, risk management and
resilience. Existing studies of SC resilience are then examined to highlight the definitions and
key constructs of the concept. The discrepancies and research gaps are outlined. Exploring
the literature on SC resilience and SC risk management produces a strong foundation about
what is known about the concept and the need for conducting this research.
Chapter 3 – Research Design and Methodology
The research methodology considerations and process are outlined in this chapter. Initially,
this chapter outlines the overall research process adopted. The discussion then moves to
the philosophical approach adopted in this study to justify the selected research
methodology. As this research is framed around a moderate constructionism paradigm, a
case study approach then profiles the data selection and capture. This is followed by a
discussion of data collection from both New Zealand’s and Pakistan’s dairy SCs. At the
conclusion of this chapter, a detailed process is outlined to guide data analysis.
Chapter 4 – Description of the Case Companies and their SCs
This chapter begins with a brief description of both focal organisations (FO1 from New
Zealand and FO2 from Pakistan) and their SC/network partners. This follows a detailed
description regarding generic SC strategies, which is considered essential in the context of
this study. To follow a structural approach, Supply Chain Operations Reference (SCOR)
model is incorporated that provides a similar basis to compare SC operations for both focal
organisations. It is believed that the discussion in this chapter would be helpful to
understand various SC strategies adopted by FO1’s and FO2 to prepare and mitigate a
potential SC disruption.
25
Chapter 5 – First Level Analysis: Identifying SC Resilience Elements
This chapter includes the data analysis of both SCs; four SC disruptions from Focal
Organisation 1 (FO1) in New Zealand, and two SC disruptions from the Focal Organisation 2
(FO2) in Pakistan. This chapter contains two sections. The first section includes a discussion
of all the six SC disruptions, including brief descriptive and contextual information. The
second section includes a discussion on the key elements of SC resilience as analysed from
all six disruptions. This section includes an analysis of each element included with discussion
from all six SC disruptions to avoid repetition. The chapter aims to provide learning from
each SC disruption, which can then be used in Chapters 6 and 7 for further analysis.
Chapter 6 – Second Level Analysis: Comparative Analysis
This chapter compares the findings, the SC resilience elements identified in the previous
chapter across the selected SC disruptions for both focal organisations. First, a rating profile
is introduced, in which the performance of each focal organisation is rated for individual
resilience elements against each SC disruption. This chapter then explores multiple level
comparisons among the selected SC disruptions. At the conclusion of this chapter, various
research propositions (RPs) and a higher-level model called the “SC resilience model” are
proposed.
Chapter 7 – Second Level Analysis: SC Resilience Elements and the Disaster
Management Cycle
This chapter outlines the SC resilience elements in the context of the disaster management
framework. The framework is used as a theoretical underpinning to explain the distinct
phases of SC resilience: readiness, response, recovery and learning & growth. This chapter
includes a discussion of how various SC resilience elements, identified in Chapter 5, interact
with the disaster management framework. Finally, this chapter concludes by aggregating
the SC resilience elements and develops a new model called the “SC resilience cycle”.
Chapter 8 – Discussion and Conclusions
This chapter briefly reviews the major outcomes of this study that constitute proposing a
framework called the “SC resilience cycle”. This chapter also highlights emerging themes
and new insights in the context of dairy sector SCs, and compares the findings with

26
literature. Lastly, this chapter highlights the research contributions, limitations and
implications for both practice and theory.
27
Chapter 2. Literature Review
Introduction
This chapter reviews what is known about Supply Chain (SC) resilience and explores
research gaps, which lead to the research questions. Holistically, SC resilience incorporates a
wide body of disciplines and, therefore, is multidisciplinary (Ponis & Koronis, 2012;
Ponomarov & Holcomb, 2009). For example, the concept of resilience, itself, is
multidisciplinary and involves various perspectives such as ecology, sociology, psychology,
economic and organisational (Burnard & Bhamra, 2011; Ponomarov & Holcomb, 2009).
Therefore, this chapter first presents the vital concepts related to SC resilience, such as SC
management, SC disasters, SC risk management and resilience. These concepts build a
foundation for a discussion of the SC resilience concept, which includes an analysis of the SC
resilience definition and the key developments recorded in the literature. Finally, the
chapter discusses the disaster management framework and elaborates SC networks.
SC Management
The concept of SC management is relatively new and evolving (Alfalla-Luque & Medina-
Lopez, 2009; Gibson et al., 2005) compared with other disciplines in business and
management. It is generally understood (Alfalla-Luque & Medina-Lopez, 2009; Christopher
& Ryals, 2014; Giannakis & Croom, 2004; Svensson, 2002) that this concept was originally
presented to academia in the early 1980s by Oliver and Webber (1982). The initial
discussion around SC management explained several advantages of taking an end-to-end
value creation process (Christopher & Ryals, 2014), which involves the integration of various
business operations such as sourcing, manufacturing, sales and distribution (Alfalla-Luque &
Medina-Lopez, 2009). SC management, at that time, brought a collaborative approach to
doing business with a network of buyers and suppliers. This collaborative approach, in
exchange, required the self-serving objectives of an organisation to be disregarded to attain
higher collective goals. This allowed organisations in a SC to become more collaborative to
achieve operational efficiencies and mutual benefits (Houlihan, 1988), therefore providing
desired value to customers as well as to other stakeholders. This discipline enumerated and
blended two existing business terms: logistics and operations management. Logistics
involves functions such as transport, warehousing, and distribution; whereas operations
28
management incorporates concepts of inventory management, production scheduling,
ordering and customer service (Christopher & Peck, 2004).
During the early stages of its evaluation, the SC management concept built its foundation
and gained attention as many scholars started measuring operational performance beyond
a firm’s internal operations (Giannakis & Croom, 2004). This era was also considered an
efficiency-driven era. The role of SC management was to revamp the whole product flow to
increase the efficiency. It became possible because of the proliferation of and advances in
information technology and, with a new era of globalisation, to achieve efficiencies
(Christopher & Peck, 2004; Giannakis & Croom, 2004).
The concept of SC is referred to a complex network of companies connected to provide
products from the initial point of ordering raw materials all the way to ultimate users; the
companies usually link through information and monetary exchange (Bozarth & Handfield,
2006; Carter, Rogers, & Choi, 2015; Pettit et al., 2010). Consequently, SC management deals
with the effective and efficient management of collaborative practices and operations for a
network of companies in a SC (Bozarth & Handfield, 2006). Here, the underlying
phenomenon of a “network” is a prime focus in the SC literature, especially recently. It
shows that a SC is not an isolated group of companies; instead, it is a complex network of
organisations, industries and economies involved in the flow of information and products
(Christopher & Peck, 2004). According to Carter et al. (2015), a SC consists of:
The physical SC – involves core agents (SC partners) and activities such as physical
movement of materials, information and money between the nodes (SC partners).
A support SC – involves agents and activities to support the physical SC, but does not
involve the physical movement of products, e.g., brokers, banks, regulatory
authorities and other financial institutions.
To deal with this complex supply network, the literature on SC management highlights a
number of strategies to gain efficiencies and sustainable competitive advantage. In the
1980s and 1990s, practices such as Vendor Managed Inventory, Lean Manufacturing,
Continuous Replenishment and Six Sigma became increasingly prevalent in business
management. At the end of the 20th century, various new SC strategies were developed,
such as agility, adaptability and alignment (Lee, 2004), responsive SC (Fisher, 1997), visibility
29
and information across SC (Liker & Choi, 2004; Uta & Stan, 2011), postponement
(Christopher & Holweg, 2011) and flexibility (Uta & Stan, 2011), to better manage SC
operations. One primary principle behind these strategies was to gain control over
operations, build efficiencies and manage unexpected situations effectively.
In the last two decades, the world has experienced a number disasters (Tang & Sodhi, 2012),
that have resulted in severe consequences for communities (Hernantes, Labaka, Turoff,
Hiltz, & Bañuls, 2017). Furthermore, it is predicted that climate change and an increased
population in disaster prone and coastal areas will lead to more disruptions for communities
in the coming decade (Haigh & Amaratunga, 2010; Malalgoda, Amaratunga, & Haigh, 2014).
Though the probability of a disruptive event at one geographic location at a given time
might be low, the chance of a disruption happening somewhere in the world are relatively
high; this threatens today’s globally connected SCs. For global companies, these disasters
offer significant operational challenges and, consequently, result in significant financial
repercussions (BCI, 2014, 2015). It is an intriguing question that despite implementing
modern SC practices and strategies, firms are still facing greater challenges in sustaining
their business operations during these disasters. The increased vulnerabilities and
implications of these SC disruptions to the globally connected SCs has triggered practitioners
and researchers to focus on various risk management principles, a new sub-field under the
discipline of SC risk management (Ho, Zheng, Yildiz, & Talluri, 2015; Talluri, Kull, Yildiz, &
Yoon, 2013).
To understand SC risk management, it is essential first to understand several types of
vulnerabilities or disruptions that could adversely affect a company and its SC operations,
then follows a discussion of SC risk management.
SC Disruptions
SC risk management or the SC resilience concept is predominantly based on the fact that a
company or SC can encounter various disruptions that undermine its ability to perform
various business activities and operations. Therefore, it is fundamentally important to
understand what constitutes a SC disruption. In the context of SC management, terms such
as disaster, crisis, or incident, are commonly used to describe disruptions to a company’s SC.

30
The following discussion distinguishes between these terms and provides guidelines for
selecting SC disruptions for this study.
The concept of disaster is defined differently in each discipline and is entirely based on the
context (Ibrahim, Fakharu’l-razi, & Aini Mat, 2003). Many authors use disaster and crisis
interchangeably. However, the study by Ibrahim et al. (2003) distinguishes between the two
terms. A crisis could lead to a disaster if not dealt with in a timely and adequate manner.
Parker (1992) studied the concept of disaster from various disciplines and defined it as: “an
unusual natural or man-made event, including an event caused by failure of technological
systems, which temporarily overwhelms the response capacity of human communities,
groups of individuals or natural environments, and which causes massive damage, economic
loss, disruption, injury and/or loss of life” (Parker, 1992, p. 6). Ibrahim et al. (2003) describe
three types of disasters:
Natural disasters: they are triggered by the rapid or slow onset of events that can be
biological, climatological, hydrological or geophysical4.
Man-made and technological disasters: they are caused by specific human activities,
either intentional or unintentional.
Hybrid disasters: these can be caused by events, natural and man-made disasters.
Similarly, a crisis is considered an unusual situation or event presenting immense risks and
challenges to an organisation. These challenges intensify if the situation is not managed
correctly. A crisis demands quick decisions in a short period, whereas a disaster or
disruption requires formal management procedures and processes (Ibrahim et al., 2003). A
disaster can include events such as earthquakes, floods or industry related disasters, which
could result in considerable damage to an organisation’s operations or possibly result in loss
of life. A crisis to an organisation might be financial or non-financial (UK’s foot and mouth
crisis), community or non-community or corporate. From a business perspective, all crises, if
not handled properly, may lead to a SC disaster or disruption (Davies & Walters, 1998;
Ibrahim et al., 2003). Crises and disasters are considered similar with regard to their
different phases or stages; such as pre-disruption, post-disruption and recovery (Ibrahim et
al., 2003).
4 https://www.ifrc.org/en/what-we-do/disaster-management/about-disasters/definition-of-hazard/
31
For this study, both terms, disaster and crisis, are considered sources of SC disruptions as
long as the events present significant challenges, both short- and long-term, and adversely
affect a SC’s ability to maintain its usual operational performance. The similar nature of
crisis and disaster with regard to different phases justifies exploring a SC disruption in the
context of disaster management cycle (see later in this chapter).
SC Risk Management
Like the SC management concept, SC risk management is a relatively new concept
(Shashank & Thomas, 2009). A SC risk can be defined as an unexpected event, based on its
likelihood and impact, that has the potential to adversely affect a company and its SC
operations (Ho et al., 2015). A SC risk refers to an array of potential disasters or company
related crises that may affect a company’s operations adversely. According to the SC risk
management literature, these potential events from a company perspective are identified
by risk analysis; which involves understanding the likelihood and potential impact of a risk.
SC risk management involves identification of a potential risk and provides appropriate
strategies to avoid or reduce vulnerabilities across SC members (Ho et al., 2015; Jüttner,
2005; Jüttner et al., 2003). Tang (2006a) describes SC risk management as a process of
managing the uncertainties and risks that results in sustainable operations and profitability
for SC members. The first step of SC risk management involves risk assessment, which, along
with risk mitigation, is identified as a critical aspect of SC risk management (Howard, 2006;
Jüttner et al., 2003; Manuj & Mentzer, 2008; Pettit et al., 2010; Tang, 2006a). Risk
assessment involves a two-dimensional matrix that categorises the SC risks in terms of
probability and impact. It is an event-based approach to identify each risk and then
proposes measures to reduce and mitigate that risk.
Based on risk identification, the SC risk management literature highlights various
classifications of the common SC risks. For instance, Christopher and Peck (2004) categorise
risks to SC based on its sources that are supply, process, demand, control and
environmental risks. Jüttner et al. (2003) classify SC risks into organisational, network and
environmental risk sources. Other authors have classified SC risks into various categories.
Table 2.1 summarises the SC risk classification of various authors.
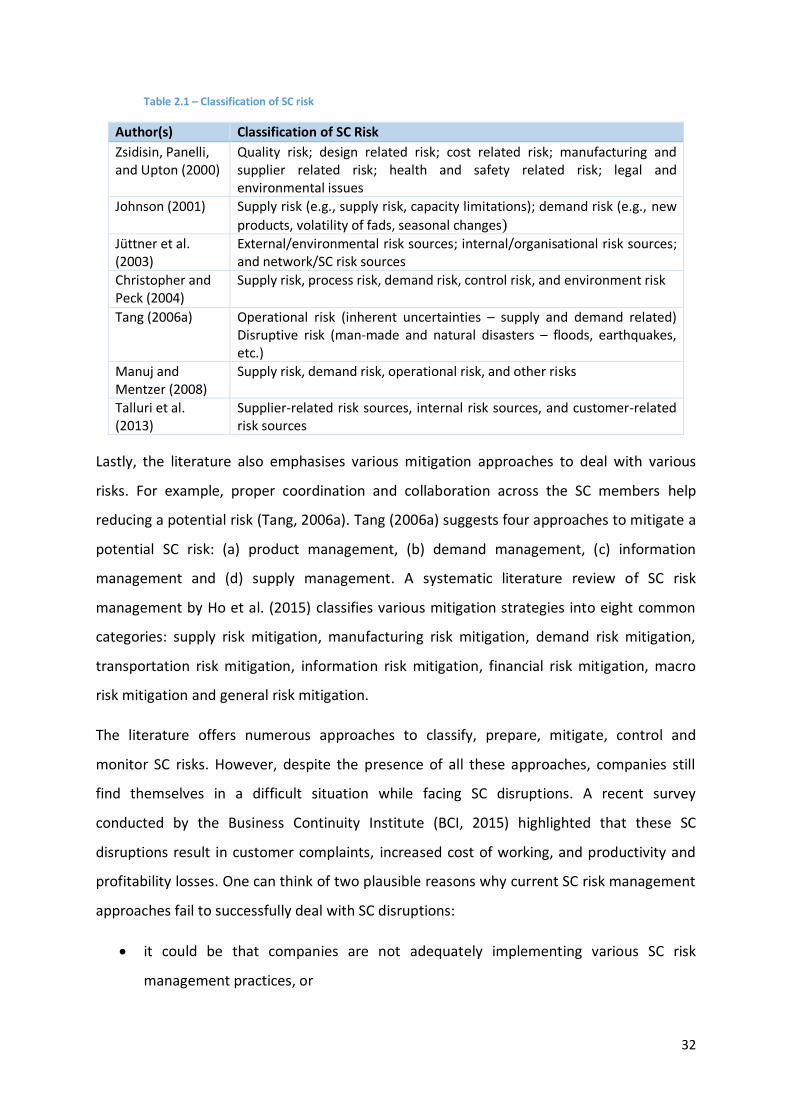
32
Table 2.1 – Classification of SC risk
Author(s) Classification of SC Risk
Zsidisin, Panelli, and Upton (2000)
Quality risk; design related risk; cost related risk; manufacturing and supplier related risk; health and safety related risk; legal and environmental issues
Johnson (2001) Supply risk (e.g., supply risk, capacity limitations); demand risk (e.g., new
products, volatility of fads, seasonal changes)
Jüttner et al. (2003)
External/environmental risk sources; internal/organisational risk sources; and network/SC risk sources
Christopher and Peck (2004)
Supply risk, process risk, demand risk, control risk, and environment risk
Tang (2006a) Operational risk (inherent uncertainties – supply and demand related) Disruptive risk (man-made and natural disasters – floods, earthquakes, etc.)
Manuj and Mentzer (2008)
Supply risk, demand risk, operational risk, and other risks
Talluri et al. (2013)
Supplier-related risk sources, internal risk sources, and customer-related risk sources
Lastly, the literature also emphasises various mitigation approaches to deal with various
risks. For example, proper coordination and collaboration across the SC members help
reducing a potential risk (Tang, 2006a). Tang (2006a) suggests four approaches to mitigate a
potential SC risk: (a) product management, (b) demand management, (c) information
management and (d) supply management. A systematic literature review of SC risk
management by Ho et al. (2015) classifies various mitigation strategies into eight common
categories: supply risk mitigation, manufacturing risk mitigation, demand risk mitigation,
transportation risk mitigation, information risk mitigation, financial risk mitigation, macro
risk mitigation and general risk mitigation.
The literature offers numerous approaches to classify, prepare, mitigate, control and
monitor SC risks. However, despite the presence of all these approaches, companies still
find themselves in a difficult situation while facing SC disruptions. A recent survey
conducted by the Business Continuity Institute (BCI, 2015) highlighted that these SC
disruptions result in customer complaints, increased cost of working, and productivity and
profitability losses. One can think of two plausible reasons why current SC risk management
approaches fail to successfully deal with SC disruptions:
it could be that companies are not adequately implementing various SC risk
management practices, or

33
it could be that SC risk management does not offer a comprehensive solution to deal
with these disruptions.
Though it is hard to answer the first reason, the literature offers some support to the
second reason. For example, the risk assessment model is often unable to effectively
characterise low probability and high consequence (LP/HC) occurrences (Howard, 2006).
This traditional risk assessment approach presents a distorted view of unforeseen events
because it assesses only the probability and consequences of known risks. Furthermore,
traditional risk management strategies are unable to foresee or plan for threats that are
highly unexpected or unpredictable and are unable to understand connectedness among
various threats (Pettit, 2008; Starr, Newfrock, & Delurey, 2003). Most importantly, these
traditional SC risk models were designed in times of a relatively stable business
environment. However, as the complexity of SCs has increased, this stability is no longer a
part of today’s business environment (Christopher & Holweg, 2011).
Most of the SC risk management literature incorporates only operational aspects of dealing
with a disruption. These studies ignore the importance of behavioural aspects such as trust,
mutual understanding, cultural compatibility, shared values and norms (Johnson, Elliott, &
Drake, 2013). Therefore, there is a need to thoroughly reassess the traditional
understanding of SC risk management. By understanding these limitations of the SC risk
management literature, various researchers started a new concept called “SC resilience”
(Pettit, 2008; Pettit et al., 2010; Ponomarov & Holcomb, 2009; Sheffi, 2005a, 2005c; Sheffi &
Rice, 2005).
Resilience
Many authors (Bhamra, Dani, & Burnard, 2011; Burnard & Bhamra, 2011; Carpenter,
Walker, Anderies, & Abel, 2001) believe that the concept of resilience was first introduced
by Holling (1973) while describing the dynamics of ecological systems. According to Holling
(1973), resilience is a system’s capability to persist and absorb changes, and therefore
maintain a stable state in relation to its various associated variables. Since its first mention,
the concept has been discussed in various disciplines (Carpenter et al., 2001), such as:
Ecology (Gunderson, 2000; Pickett et al., 2014),
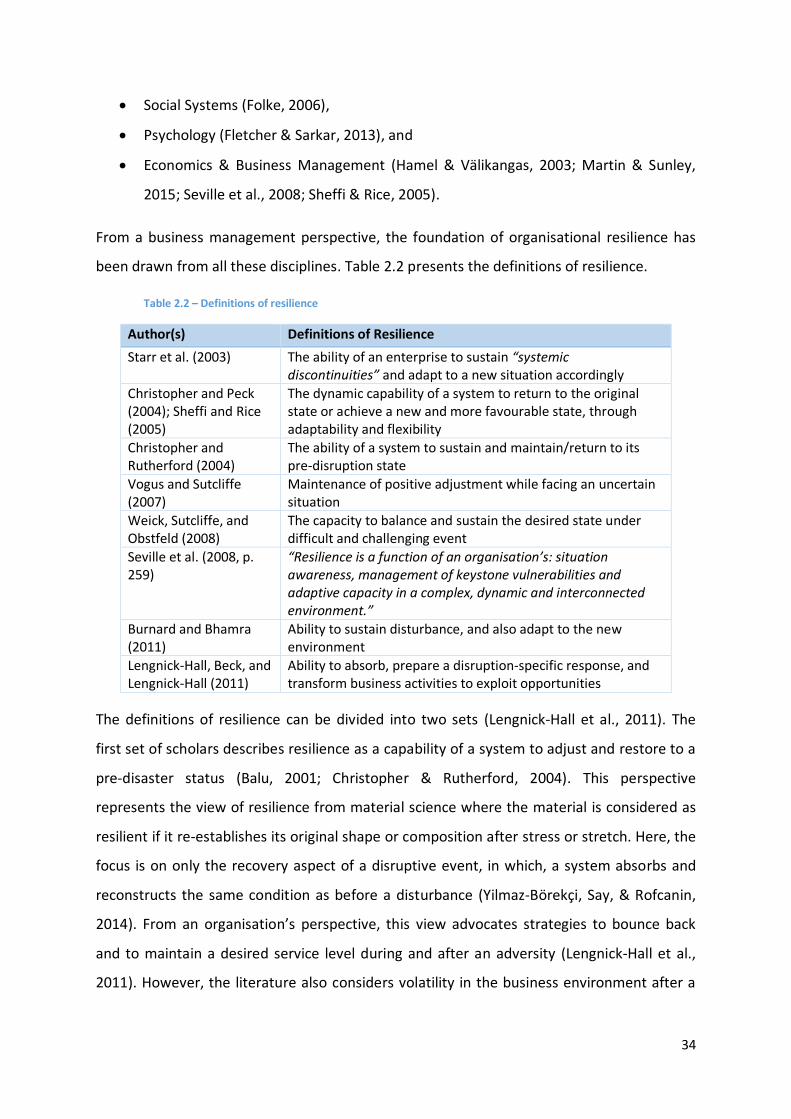
34
Social Systems (Folke, 2006),
Psychology (Fletcher & Sarkar, 2013), and
Economics & Business Management (Hamel & Välikangas, 2003; Martin & Sunley,
2015; Seville et al., 2008; Sheffi & Rice, 2005).
From a business management perspective, the foundation of organisational resilience has
been drawn from all these disciplines. Table 2.2 presents the definitions of resilience.
Table 2.2 – Definitions of resilience
Author(s) Definitions of Resilience
Starr et al. (2003) The ability of an enterprise to sustain “systemic discontinuities” and adapt to a new situation accordingly
Christopher and Peck (2004); Sheffi and Rice (2005)
The dynamic capability of a system to return to the original state or achieve a new and more favourable state, through adaptability and flexibility
Christopher and Rutherford (2004)
The ability of a system to sustain and maintain/return to its pre-disruption state
Vogus and Sutcliffe (2007)
Maintenance of positive adjustment while facing an uncertain situation
Weick, Sutcliffe, and Obstfeld (2008)
The capacity to balance and sustain the desired state under difficult and challenging event
Seville et al. (2008, p. 259)
“Resilience is a function of an organisation’s: situation awareness, management of keystone vulnerabilities and adaptive capacity in a complex, dynamic and interconnected environment.”
Burnard and Bhamra (2011)
Ability to sustain disturbance, and also adapt to the new environment
Lengnick-Hall, Beck, and Lengnick-Hall (2011)
Ability to absorb, prepare a disruption-specific response, and transform business activities to exploit opportunities
The definitions of resilience can be divided into two sets (Lengnick-Hall et al., 2011). The
first set of scholars describes resilience as a capability of a system to adjust and restore to a
pre-disaster status (Balu, 2001; Christopher & Rutherford, 2004). This perspective
represents the view of resilience from material science where the material is considered as
resilient if it re-establishes its original shape or composition after stress or stretch. Here, the
focus is on only the recovery aspect of a disruptive event, in which, a system absorbs and
reconstructs the same condition as before a disturbance (Yilmaz-Börekçi, Say, & Rofcanin,
2014). From an organisation’s perspective, this view advocates strategies to bounce back
and to maintain a desired service level during and after an adversity (Lengnick-Hall et al.,
2011). However, the literature also considers volatility in the business environment after a

35
disruption. Therefore, from an organisation’s perspective, it is hard to attain or bounce back
to the original state because the environment changes rapidly especially during a disruption.
Other scholars believe that resilience is more than just recovering and bouncing back to the
original state, highlighting a richer view of resilience. This perspective associates resilience
with adaptive capacity, which enables an organisation to introduce new abilities to thrive
and exploit new opportunities during an uncertainty (Burnard & Bhamra, 2011; Christopher
& Peck, 2004; Hamel & Välikangas, 2003; Norris, Stevens, Pfefferbaum, Wyche, &
Pfefferbaum, 2008; Seville et al., 2008; Sheffi & Rice, 2005). This adaptive capacity allows
continuous learning from the positive and negative influences of a disruption (Christopher &
Peck, 2004; Ponomarov & Holcomb, 2009; Yilmaz-Börekçi et al., 2014). This perspective of
resilience enables an organisation to be adaptive, flexible, agile and proactive to survive in
an uncertain event (Ponomarov & Holcomb, 2009). Additionally, the concept of resilience is
much more than merely being flexible and adaptive; it also provides the basis for a
sustainable competitive edge (Hamel & Välikangas, 2003). Seville and Vargo (2011) suggest
that crisis management coupled with strategic planning provides a “silver lining” that
enables a firm to foresee distinct opportunities for its sustainable future.
This study adopts the second view of resilience for several reasons. Fundamentally, this view
distinguishes resilience from traditional risk management. The traditional approach is an
event-based approach that deals with identifying potential risks and preparing response
measures for each of them. Resilience incorporates a process-based approach to building a
sustainable business model (Melnyk, Closs, Griffis, Zobel, & Macdonald, 2014). This process-
based approach embeds resilience thinking in the culture of an organisation. This
distinguishes it from merely suggesting corrective measures for a particular disruption.
Consequently, resilience can be viewed as an organisation’s, or system’s, ability to prepare,
absorb challenges and emerge stronger after a disruption by developing various new
strategies to exploit the new environment dynamics.
SC Resilience
A literature review reveals that the concept of resilience was adopted in SC domain in early
2000 when Rice and Caniato (2003) along with other scholars (Christopher & Rutherford,
2004; Pickett, 2003; Sheffi & Rice, 2005) discussed the term resilience in the SC context.

36
Early adopters of the concept brought a basic understanding of resilience from
organisations, enterprises or systems perspective (Fiksel, 2003; Hamel & Välikangas, 2003;
Horne III, 1997; Horne & Orr, 1998; Starr et al., 2003). The number of research articles grew
substantially from 2000-2016 (Kamalahmadi & Parast, 2016).
To get a full view of the concept, a systematic literature review was conducted with the aim
of understanding following aspects:
Why was the resilience concept adopted in the SC domain?
What do the SC resilience definitions talk about?
What are the key attributes of SC resilience?
What are the key research gaps in the field?
To accomplish this, the following literature review approach was adopted;
Research articles published in the SC resilience domain in recognised international
journals from 2000 to 2015 were selected. The systematic process defined by Denyer
and Tranfield (2009) was adopted to increase validity and reduce bias in the
selection process. Figure 2.1 summarises the process.
Search in Databases(2000-2015)
Selection Based on:Tittle
Abstract
Final Selection;Full Text Analysis
Cross-Checking;Cited Articles
Analysis and Coding of
Definitions(60 Articles)
Searching Selection Process Analysis
Figure 2.1 – Literature review process
The initial search on University of Canterbury Multiple Search tool5 (which includes
various databases; such as Science Direct, EBSCO, Emerald and ISI Web of
Knowledge) resulted in 109 articles. The selection criteria were limited to the
articles’ title and abstract.
In the second stage, a full-text examination was done to confirm the relevance of the
article to the SC resilience concept. In the process, four articles (Hohenstein et al.,
2015; Kamalahmadi & Parast, 2016; Mandal, 2014; Tukamuhabwa et al., 2015) were
identified as fundamental because these articles also examined a similar systematic
literature review of the SC resilience concept. Table 2.3 presents the key features of
5 http://www.canterbury.ac.nz/library/

37
these four articles. Cross-referencing with these four articles and full-text
examination resulted in the final selection of 60 highly relevant articles.
Finally, analysis and coding were carried-out following the four key questions listed
above.
Table 2.3 – Key features of systematic literature review articles
Author(s) Number of Articles Reviewed
Period (Reviewed Articles)
Mandal (2014) 45 1980-2012
Tukamuhabwa et al. (2015)
91 -
Hohenstein et al. (2015)
67 2003-2013
Kamalahmadi and Parast (2016)
100 2001-2015
2.6.1. Why was the resilience concept adopted in the SC domain?
In the context of SC management, resilience is a combination of organisational resilience
and the network or system’s perspective. To best of this researcher’s knowledge, the term
“SC resilience” was first used by Rice and Caniato (2003) in their article “Building a Secure
and Resilient Supply Network”. The authors presented a brief commentary on developing
security processes coupled with resilience principles in a SC. According to the study, a
resilient SC entails promoting flexible and redundant processes in a SC (Rice & Caniato,
2003). The second mention of the concept was Christopher and Peck (2004). These two
articles are fundamental to the SC resilience concept, because the two purposefully aimed
at exploring key strategies or principles to help companies manage SC disruptions
successfully. Interestingly, both studies were part of wider research projects.
The first study Rice and Caniato (2003) was part of a larger research project conducted at
Massachusetts Institute of Technology (MIT) to explore global firms dealing with the
challenging environment, especially the fragile environment created after 9/11 terrorist
attack in the US. The larger project and the authors’ affiliations were reflected in a number
of articles in the following years (Sheffi, 2001, 2005a, 2005b, 2005c; Sheffi & Rice, 2005).
The study by Christopher and Peck (2004) was part of a larger project at Cranfield School of
Management to study recent disruptions in the UK, such as the UK fuel protest in
September 2000 and foot & mouth disease in February 2001. This project and the authors’
38
affiliations were indicated in other research outputs (Christopher & Rutherford, 2004; Peck,
2005). These two projects and related research outputs became pivotal for later
researchers.
In addition to these early studies, Starr et al. (2003) discussed enterprise resilience by
arguing that global companies need to understand interconnectedness in their upstream
and downstream network, which then leads to the development of a resilient enterprise.
Secondly, Fiksel (2003) introduced systems thinking to design a resilient system, where the
author considered SC as a sub-system of a larger system. Nine studies dominated the SC
resilience literature in the early years from 2000 to 2005. A review of these articles provides
key insights into how the concept of resilience was coined in the SC domain.
Conventional approaches to deal with the organisational or SC risks targeted only
key vulnerabilities and often ignored unforeseen factors or risks (Fiksel, 2003; Starr
et al., 2003). For example, Starr et al. (2003) argue that the conventional risk
management practices were traditionally developed for centralised organisations
and failed to incorporate the new dynamics of networked enterprises. The pursuit of
operational efficiencies and globalisation have led organisations to a new set of
vulnerabilities (Christopher & Peck, 2004), which often contradict traditional risk
management approaches (Starr et al., 2003). These traditional practices tend to
focus on a “one point solution", which limits an organisation to focus on a few
potential vulnerabilities, a detrimental approach to a networked organisation. Starr
et al. (2003) argue that the traditional risk management strategies fail to recognise
the linkages and interdependences upstream and downstream of an organisation. In
contrast, the authors claimed that a resilient enterprise focuses on understanding
these linkages and interdependences, and therefore integrates risk management
into the core elements of corporate strategy. Other authors also highlighted similar
limitations associated with conventional risk management (Howard, 2006; Pettit,
2008).
These studies highlighted a recent shift in the business environment. For example,
the complexity of global companies has shifted vastly from an integrated firm to a
vast network of connected companies to create and deliver goods and services
(Fiksel, 2003). Though, this approach entails numerous benefits, it has also increased
39
the failure points for an organisation. For example, disruption at one node of a SC
could reflect disruption throughout the chain. In parallel to these shifts, the trend in
disruptions has also increased (Christopher & Peck, 2004), creating significant
pressure for global companies to operate under these disruptions. Based on these
assumptions, SC resilience promotes a capability to plan, respond and recover from a
highly unexpected disruption (Christopher & Peck, 2004; Rice & Caniato, 2003).
Additionally, for practitioners and managers, the importance of SC resilience has
become essential since such tragic events as the September 2001 terrorist attacks in
the US, February 2001 foot and mouth disease in the UK and the September 2000
fuel protest in the UK (Christopher & Peck, 2004). As a result, practitioners and
researchers recognised the need to develop strategies and practices to prevent or
effectively cope in the face of these unlikely events. These major SC disruptions,
especially the September 2001 attacks, created a significant push for researchers.
The following years saw increased research on the SC resilience concept
(Kamalahmadi & Parast, 2016; Tang & Sodhi, 2012).
Lastly, it is important to highlight that the early advocates of the concept talked
about SC resilience in the context of highly unforeseeable events, such as low
probability and high impact disruptions.
Authors who later studied the concept highlighted similar justifications of the evolution of
SC resilience (Blackhurst et al., 2005; Christopher & Holweg, 2011; Kamalahmadi & Parast,
2016; Ponomarov & Holcomb, 2009; Priya Datta, Christopher, & Allen, 2007; Sheffi, 2015;
Tang, 2006b). In addition to understanding the fundamental reasons for coining a new
concept, it is essential to explore how the researchers have defined it.
2.6.2. What do SC resilience definitions talk about?
As highlighted above, the concept of resilience encompasses a vast body of disciplines. Like
organisational resilience, scholars in this field have explained the concept of resilience from
various disciplines before contextualising the concept in the SC domain (Pettit, 2008; Ponis
& Koronis, 2012; Sheffi, 2005c). Ponomarov and Holcomb (2009) comprehensively discuss
the progression of the concept from other disciplines before describing it in the SC context.
To understand how this concept is defined, all definitions from the selected research articles
40
were analysed. Though the definitions of SC resilience evolved from other disciplines and
various authors have defined it in different ways (Spiegler, Naim, & Wikner, 2012), analysis
of the definitions highlighted more similarities rather than differences. Table 2.4 compares
the key themes and focus from these definitions.

41
Table 2.4 – SC resilience definitions
Focus of the Definitions
Themes
Author(s)
Org
anis
atio
n/E
nte
rpri
se
Sup
ply
Ch
ain
Syst
em
Pre
par
e
Res
po
nd
Rec
ove
r
Ad
apt/
Gro
w
Ret
urn
to
O
rigi
nal
/No
rmal
Sta
te
Ach
ieve
New
Sta
te/M
ore
D
esir
able
Sta
te
Co
st E
ffec
tive
Spee
d/T
ime
Co
nn
ecte
dne
ss a
nd
Co
ntr
ol
Op
erat
ion
al P
erfo
rman
ce
Co
mp
etit
ive
Ad
van
tage
Me
et C
ust
om
er D
eman
d
Fiksel (2003) √ √ √
Starr et al. (2003) √ √ √
Rice and Caniato (2003) √ √ √
Christopher and Peck (2004) √ √ √ √ √
Christopher and Rutherford (2004) √ √ √ √ √
Peck (2005) √ √ √ √
Sheffi (2005b) √ √ √ √ √
Sheffi and Rice (2005) √ √
Sheffi (2005a) √ √ √ √ √
Fiksel (2006) √ √ √
Peck (2006) √ √ √ √ √ √
Tang (2006b) √ √
Sarathy (2006) √ √ √ √
Priya Datta et al. (2007) √ √ √ √ √

42
Focus of the Definitions
Themes
Author(s)
Org
anis
atio
n/E
nte
rpri
se
Sup
ply
Ch
ain
Syst
em
Pre
par
e
Res
po
nd
Rec
ove
r
Ad
apt/
Gro
w
Ret
urn
to
O
rigi
nal
/No
rmal
Sta
te
Ach
ieve
New
Sta
te/M
ore
D
esir
able
Sta
te
Co
st E
ffec
tive
Spee
d/T
ime
Co
nn
ecte
dne
ss a
nd
Co
ntr
ol
Op
erat
ion
al P
erfo
rman
ce
Co
mp
etit
ive
Ad
van
tage
Me
et C
ust
om
er D
eman
d
Falasca, Zobel, and Cook (2008) √ √ √ √ √ √
Ponomarov and Holcomb (2009) √ √ √ √ √ √
Stewart, Kolluru, and Smith (2009) √ √ √
Voss, Whipple, and Closs (2009) √ √ √ √
Williams, Ponder, and Autry (2009) √ √ √ √
Colicchia, Dallari, and Melacini (2010) √ √ √ √
Klibi, Martel, and Guitouni (2010) √ √ √ √
Pettit et al. (2010) √ √ √
Zsidisin and Wagner (2010) √ √ √
Blackhurst et al. (2011) √ √ √ √ √ √ √
Jüttner and Maklan (2011) √ √ √ √
Kumar and Sosnoski (2011) √ √
Cabral and Grilo (2012) √ √ √ √
Carvalho, Barroso, Machado, Azevedo, and Cruz-Machado (2012)
√ √ √ √
Ishfaq (2012) √ √

43
Focus of the Definitions
Themes
Author(s)
Org
anis
atio
n/E
nte
rpri
se
Sup
ply
Ch
ain
Syst
em
Pre
par
e
Res
po
nd
Rec
ove
r
Ad
apt/
Gro
w
Ret
urn
to
O
rigi
nal
/No
rmal
Sta
te
Ach
ieve
New
Sta
te/M
ore
D
esir
able
Sta
te
Co
st E
ffec
tive
Spee
d/T
ime
Co
nn
ecte
dne
ss a
nd
Co
ntr
ol
Op
erat
ion
al P
erfo
rman
ce
Co
mp
etit
ive
Ad
van
tage
Me
et C
ust
om
er D
eman
d
Melnyk, Davis, Spekman, and Sandor (2012)
√ √ √ √
Schmitt and Singh (2012) √ √ √ √
Spiegler et al. (2012) √ √ √ √
Xiao, Yu, and Gong (2012) √ √ √ √ √
Golgeci and Ponomarov (2013) √ √ √ √ √
Hearnshaw and Wilson (2013) √ √
Johnson et al. (2013) √ √ √ √ √
Pettit et al. (2013) √ √
Sawik (2013) √ √ √
Wieland (2013) √ √ √ √
Wu, Huang, Blackhurst, Zhang, and Wang (2013)
√ √
Leat and Revoredo-Giha (2013) √ √ √ √ √
Wieland and Wallenburg (2013) √ √ √ √
Dmitry, Boris, and Alexandre (2014) √ √ √ √ √
Carla, Martin, and Andrea (2014) √ √ √ √ √ √ √
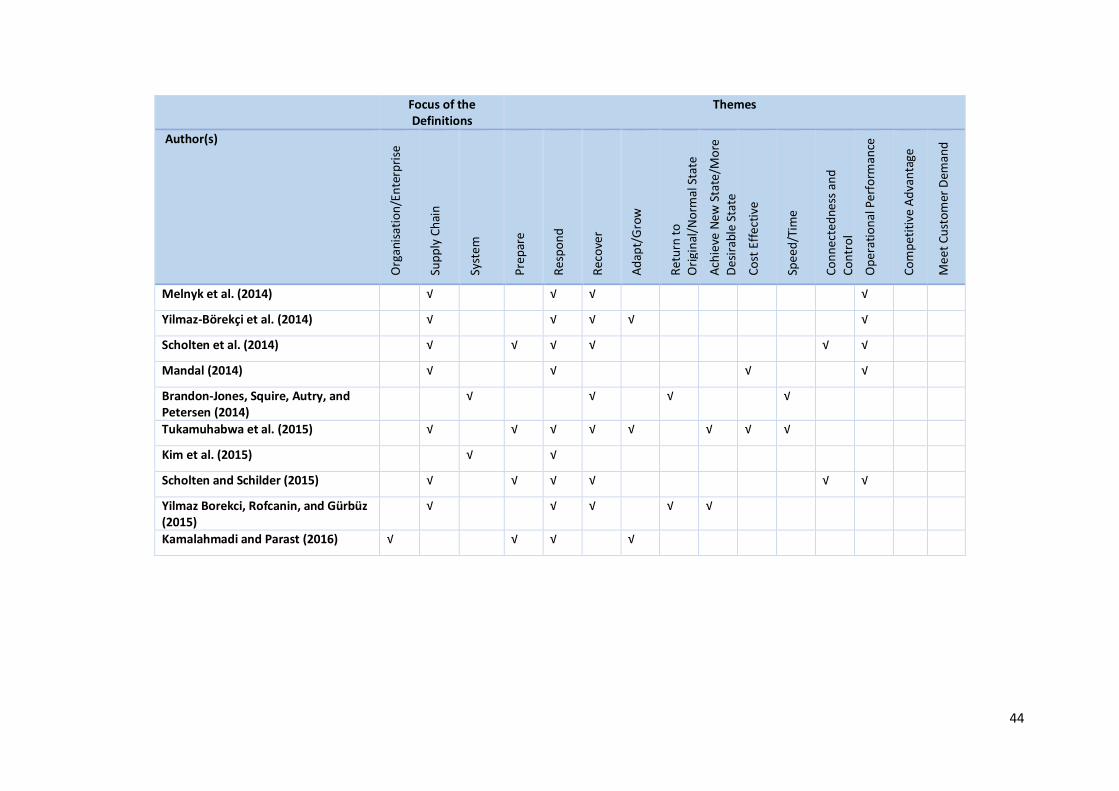
44
Focus of the Definitions
Themes
Author(s)
Org
anis
atio
n/E
nte
rpri
se
Sup
ply
Ch
ain
Syst
em
Pre
par
e
Res
po
nd
Rec
ove
r
Ad
apt/
Gro
w
Ret
urn
to
O
rigi
nal
/No
rmal
Sta
te
Ach
ieve
New
Sta
te/M
ore
D
esir
able
Sta
te
Co
st E
ffec
tive
Spee
d/T
ime
Co
nn
ecte
dne
ss a
nd
Co
ntr
ol
Op
erat
ion
al P
erfo
rman
ce
Co
mp
etit
ive
Ad
van
tage
Me
et C
ust
om
er D
eman
d
Melnyk et al. (2014) √ √ √ √
Yilmaz-Börekçi et al. (2014) √ √ √ √ √
Scholten et al. (2014) √ √ √ √ √ √
Mandal (2014) √ √ √ √
Brandon‐Jones, Squire, Autry, and Petersen (2014)
√ √ √ √
Tukamuhabwa et al. (2015) √ √ √ √ √ √ √ √
Kim et al. (2015) √ √
Scholten and Schilder (2015) √ √ √ √ √ √
Yilmaz Borekci, Rofcanin, and Gürbüz (2015)
√ √ √ √ √
Kamalahmadi and Parast (2016) √ √ √ √

45
Arguably, the definition by Ponomarov and Holcomb (2009) has been widely cited and
conceptualised by other authors (Leat & Revoredo-Giha, 2013; Ponomarov, 2012; Scholten
& Schilder, 2015; Scholten et al., 2014), and can be considered as a theoretically grounded
definition (Hohenstein et al., 2015; Tukamuhabwa et al., 2015). Ponomarov and Holcomb
(2009, p. 131) define the concept as “the adaptive capability of the supply chain to prepare
for unexpected events, respond to disruptions, and recover from them by maintaining
continuity of operations at the desired level of connectedness and control over structure and
function.”
Almost all definitions conceptualise resilience as an ability or capability, but provide
differing views of its applicability. For example, some authors attribute it as an
organisation’s or enterprise’s ability (Blackhurst et al., 2011; Sheffi, 2005b; Starr et al., 2003;
Tang, 2006b), which presents an inside-out view of an organisation that builds resilience in
terms of its SC operations. For others, resilience is an attribute of a whole SC (Ishfaq, 2012;
Melnyk et al., 2012; Ponomarov & Holcomb, 2009; Rice & Caniato, 2003; Scholten et al.,
2014; Yilmaz-Börekçi et al., 2014), where the SC partners collectively prepare and build
resilience against disruptions. A small number of researchers attribute SC resilience to a
network or larger system level (Brandon‐Jones et al., 2014; Hearnshaw & Wilson, 2013;
Johnson et al., 2013; Kim et al., 2015), where the broader network partners, beyond a usual
SC, collectively build resilience into the whole system.
In the context of this study, it is considered that the increased complexities of a SC network
coupled with the amplified impact of the turbulent environment demand a birds-eye view of
all organisations in the broader network to consider all interconnected vulnerabilities and
corresponding abilities to deal with a disruption. Additionally, it needs inter-organisational
synergies and alignment among all actors in a SC (Slone, Mentzer, & Dittmann, 2007). For
example, a resilient supplier builds capabilities to deal with uncertain interruptions and
disturbances. This, in turn, increases a buyer’s response and the whole SC network prospers
(Tang, 2006a). Therefore, it is essential to choose a resilient SC network.
Additionally, the SC resilience concept has been divided into two schools of thought. Some
authors define it as a SC capability to resist and achieve the pre-disaster status (Blackhurst
et al., 2011; Falasca et al., 2008; Sarathy, 2006; Sheffi, 2005b; Sheffi & Rice, 2005; Williams
et al., 2009). This approach offers only a reactive posture of a system and talks about
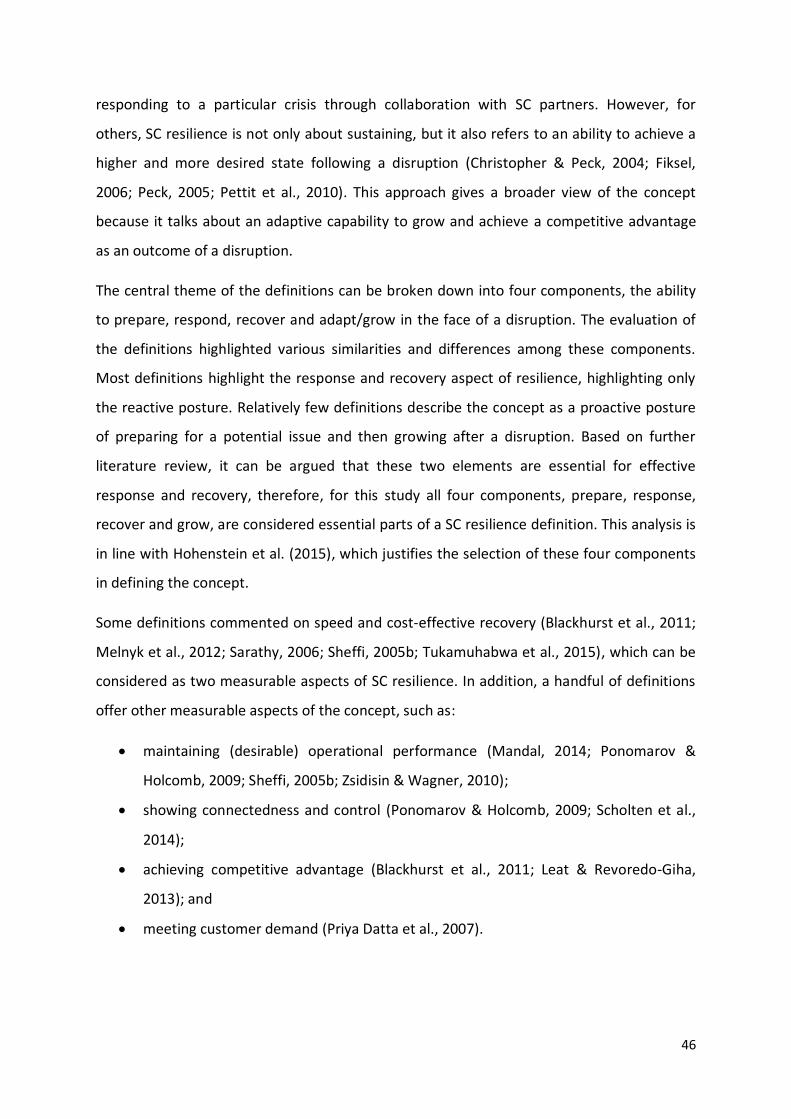
46
responding to a particular crisis through collaboration with SC partners. However, for
others, SC resilience is not only about sustaining, but it also refers to an ability to achieve a
higher and more desired state following a disruption (Christopher & Peck, 2004; Fiksel,
2006; Peck, 2005; Pettit et al., 2010). This approach gives a broader view of the concept
because it talks about an adaptive capability to grow and achieve a competitive advantage
as an outcome of a disruption.
The central theme of the definitions can be broken down into four components, the ability
to prepare, respond, recover and adapt/grow in the face of a disruption. The evaluation of
the definitions highlighted various similarities and differences among these components.
Most definitions highlight the response and recovery aspect of resilience, highlighting only
the reactive posture. Relatively few definitions describe the concept as a proactive posture
of preparing for a potential issue and then growing after a disruption. Based on further
literature review, it can be argued that these two elements are essential for effective
response and recovery, therefore, for this study all four components, prepare, response,
recover and grow, are considered essential parts of a SC resilience definition. This analysis is
in line with Hohenstein et al. (2015), which justifies the selection of these four components
in defining the concept.
Some definitions commented on speed and cost-effective recovery (Blackhurst et al., 2011;
Melnyk et al., 2012; Sarathy, 2006; Sheffi, 2005b; Tukamuhabwa et al., 2015), which can be
considered as two measurable aspects of SC resilience. In addition, a handful of definitions
offer other measurable aspects of the concept, such as:
maintaining (desirable) operational performance (Mandal, 2014; Ponomarov &
Holcomb, 2009; Sheffi, 2005b; Zsidisin & Wagner, 2010);
showing connectedness and control (Ponomarov & Holcomb, 2009; Scholten et al.,
2014);
achieving competitive advantage (Blackhurst et al., 2011; Leat & Revoredo-Giha,
2013); and
meeting customer demand (Priya Datta et al., 2007).

47
For this study, Tukamuhabwa et al. (2015)’s definition is adopted, because it provides a
holistic approach concisely including all the key elements from the previous definitions.
Therefore, SC resilience entails:
“The adaptive capability of a supply chain to prepare for and/or respond to
disruptions, to make a timely and cost effective recovery, and therefore progress to a
post-disruption state of operations – ideally, a better state than prior to the
disruption.” (Tukamuhabwa et al., 2015, p. 5599)
2.6.3. What are the key attributes of SC resilience?
The literature review highlighted variation in the terminology used to identify the
fundamental components of SC resilience, for example:
Capabilities (Birkie, Trucco, & Fernandez Campos, 2017; Dabhilkar, Birkie, & Kaulio,
2016; Johnson et al., 2013; Pettit et al., 2013)
Antecedents (Chowdhury & Quaddus, 2016; Ponomarov & Holcomb, 2009; Scholten
& Schilder, 2015; Scholten et al., 2014)
Elements (Hohenstein et al., 2015; Ponis & Koronis, 2012)
Principles (Christopher & Peck, 2004; Kamalahmadi & Parast, 2016)
Strategies (Benjamin et al., 2017; Tukamuhabwa et al., 2015)
Resilience enhancers (Blackhurst et al., 2011)
Factors (Ribeiro & Barbosa-Povoa, 2018)
Though there are different terms used in the literature, these studies fundamentally
focused on highlighting the various elements that build a resilient SC. As highlighted by
Hohenstein et al. (2015), terms such as capability have varying meanings in the literature,
therefore, in line with those authors, this study also uses the term “elements”. The choice of
the term “elements” is because it is a relatively neutral term (Hohenstein et al., 2015)
compared with other terms such as capabilities or strategies.
The majority of the literature talks about various defining elements that build a resilient SC
to deal with a disruption. For example, according to Fiksel (2003), a resilient system has four
attributes: (a) diversity, (b) efficiency, (c) adaptability and (d) cohesion. Similarly, Sheffi and
Rice (2005) suggest two aspects of a resilient SC; redundancy and flexibility, which enable a
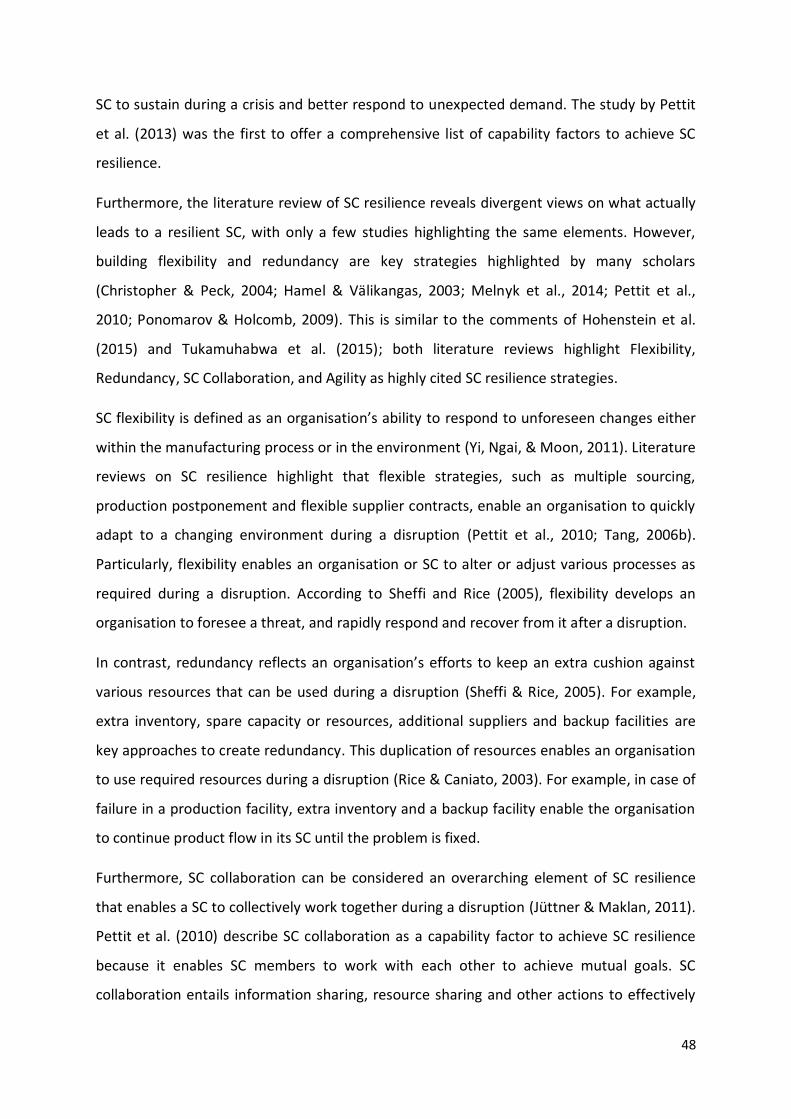
48
SC to sustain during a crisis and better respond to unexpected demand. The study by Pettit
et al. (2013) was the first to offer a comprehensive list of capability factors to achieve SC
resilience.
Furthermore, the literature review of SC resilience reveals divergent views on what actually
leads to a resilient SC, with only a few studies highlighting the same elements. However,
building flexibility and redundancy are key strategies highlighted by many scholars
(Christopher & Peck, 2004; Hamel & Välikangas, 2003; Melnyk et al., 2014; Pettit et al.,
2010; Ponomarov & Holcomb, 2009). This is similar to the comments of Hohenstein et al.
(2015) and Tukamuhabwa et al. (2015); both literature reviews highlight Flexibility,
Redundancy, SC Collaboration, and Agility as highly cited SC resilience strategies.
SC flexibility is defined as an organisation’s ability to respond to unforeseen changes either
within the manufacturing process or in the environment (Yi, Ngai, & Moon, 2011). Literature
reviews on SC resilience highlight that flexible strategies, such as multiple sourcing,
production postponement and flexible supplier contracts, enable an organisation to quickly
adapt to a changing environment during a disruption (Pettit et al., 2010; Tang, 2006b).
Particularly, flexibility enables an organisation or SC to alter or adjust various processes as
required during a disruption. According to Sheffi and Rice (2005), flexibility develops an
organisation to foresee a threat, and rapidly respond and recover from it after a disruption.
In contrast, redundancy reflects an organisation’s efforts to keep an extra cushion against
various resources that can be used during a disruption (Sheffi & Rice, 2005). For example,
extra inventory, spare capacity or resources, additional suppliers and backup facilities are
key approaches to create redundancy. This duplication of resources enables an organisation
to use required resources during a disruption (Rice & Caniato, 2003). For example, in case of
failure in a production facility, extra inventory and a backup facility enable the organisation
to continue product flow in its SC until the problem is fixed.
Furthermore, SC collaboration can be considered an overarching element of SC resilience
that enables a SC to collectively work together during a disruption (Jüttner & Maklan, 2011).
Pettit et al. (2010) describe SC collaboration as a capability factor to achieve SC resilience
because it enables SC members to work with each other to achieve mutual goals. SC
collaboration entails information sharing, resource sharing and other actions to effectively

49
respond and recover from a disruption (Scholten & Schilder, 2015). Likewise, Christopher
and Peck (2004) highlight collaborative planning and SC intelligence as components of SC
collaboration that enable SC partners to mitigate a potential risk.
The elements discussed in the literature can be divided into two groups: pre- and post-
disruption strategies. For example, an organisation builds flexibility and redundancy into its
SC operations before a disruption (Christopher & Peck, 2004), which enables it to quickly
respond and recover in the face of a disaster. A similar classification highlighted by
Tukamuhabwa et al. (2015) and Hohenstein et al. (2015) is proactive and reactive strategies.
In addition to the three elements (flexibility, redundancy and SC collaboration) discussed
above, the literature revealed many other ways to achieve resilience. Table 2.5 summarises
the various elements to achieve SC resilience as highlighted by the studies reviewed during
the literature review. The table also highlights the authors of these separate studies.
Table 2.5 – SC resilience elements from the literature
Author(s) Key Elements to Achieve SC Resilience
Fiksel (2003) Diversity, efficiency, adaptability and cohesion
Rice and Caniato (2003)
Flexibility, redundancy
Christopher and Peck (2004)
SC (re-)engineering – supply base strategy, SC understanding, SC design principle; SC collaboration – collaborative planning, SC intelligence; Agility – visibility, velocity; SC risk management culture – continuity team, leadership, risk consideration in decision making
Sheffi and Rice (2005)
Redundancy – reserve resources; Flexibility – supply & demand, conversion, distribution and customer-facing activities, control system, right culture
Sheffi (2005a) Redundancy; Flexibility – adopt standardised process, sequential processing, postponement, aligning procurement strategy; Cultural change – continuous communication, distributed power, passion, conditioning for disruption
Ponomarov and Holcomb (2009)
Resilience/capabilities matrix: SC resilience – readiness, response and recovery; Psychological principle of resilience – control, coherence, and connectedness
Pettit et al. (2010)
Flexibility in sourcing, flexibility in order fulfilment, capacity, efficiency, visibility, adaptability, anticipation, recovery, dispersion, collaboration, organization, market position, security, financial strength
Zsidisin and Wagner (2010)
Redundancy and flexibility
Blackhurst et al. (2011)
SC resilience enhancers – human capital resources (SC education & training, post-disruption feedback); Organisational and inter-organisational capital resources (communication,
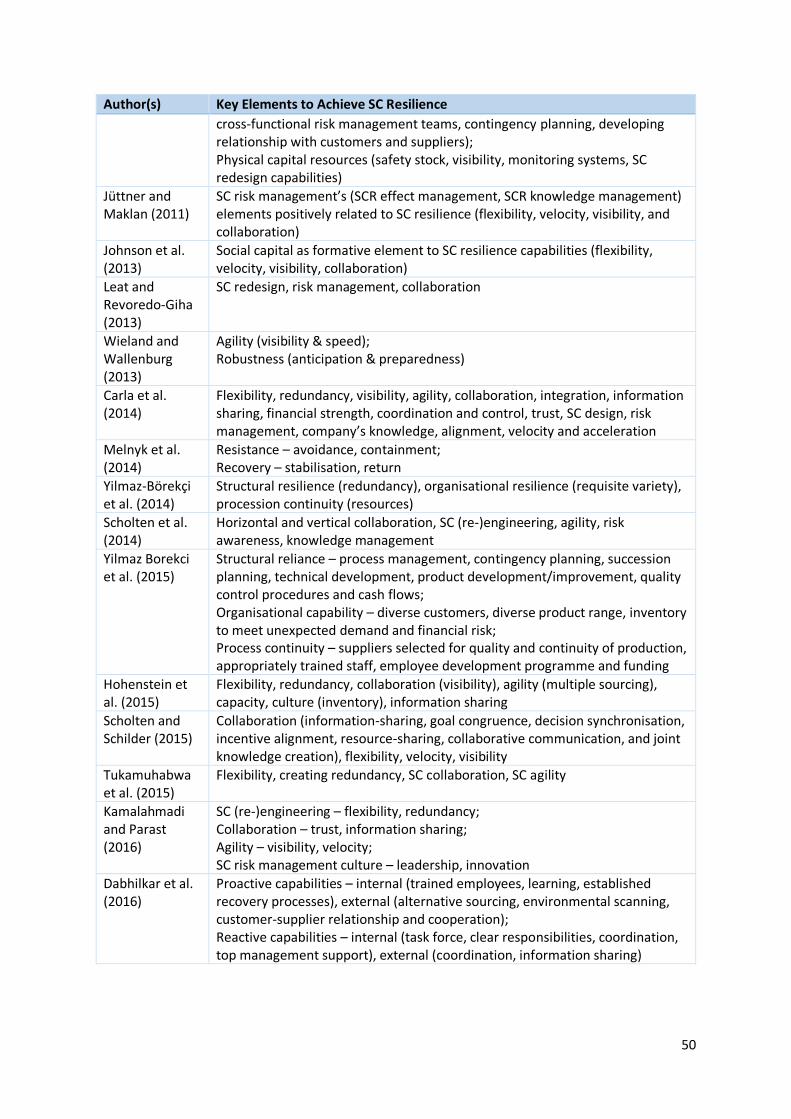
50
Author(s) Key Elements to Achieve SC Resilience
cross-functional risk management teams, contingency planning, developing relationship with customers and suppliers); Physical capital resources (safety stock, visibility, monitoring systems, SC redesign capabilities)
Jüttner and Maklan (2011)
SC risk management’s (SCR effect management, SCR knowledge management) elements positively related to SC resilience (flexibility, velocity, visibility, and collaboration)
Johnson et al. (2013)
Social capital as formative element to SC resilience capabilities (flexibility, velocity, visibility, collaboration)
Leat and Revoredo-Giha (2013)
SC redesign, risk management, collaboration
Wieland and Wallenburg (2013)
Agility (visibility & speed); Robustness (anticipation & preparedness)
Carla et al. (2014)
Flexibility, redundancy, visibility, agility, collaboration, integration, information sharing, financial strength, coordination and control, trust, SC design, risk management, company’s knowledge, alignment, velocity and acceleration
Melnyk et al. (2014)
Resistance – avoidance, containment; Recovery – stabilisation, return
Yilmaz-Börekçi et al. (2014)
Structural resilience (redundancy), organisational resilience (requisite variety), procession continuity (resources)
Scholten et al. (2014)
Horizontal and vertical collaboration, SC (re-)engineering, agility, risk awareness, knowledge management
Yilmaz Borekci et al. (2015)
Structural reliance – process management, contingency planning, succession planning, technical development, product development/improvement, quality control procedures and cash flows; Organisational capability – diverse customers, diverse product range, inventory to meet unexpected demand and financial risk; Process continuity – suppliers selected for quality and continuity of production, appropriately trained staff, employee development programme and funding
Hohenstein et al. (2015)
Flexibility, redundancy, collaboration (visibility), agility (multiple sourcing), capacity, culture (inventory), information sharing
Scholten and Schilder (2015)
Collaboration (information-sharing, goal congruence, decision synchronisation, incentive alignment, resource-sharing, collaborative communication, and joint knowledge creation), flexibility, velocity, visibility
Tukamuhabwa et al. (2015)
Flexibility, creating redundancy, SC collaboration, SC agility
Kamalahmadi and Parast (2016)
SC (re-)engineering – flexibility, redundancy; Collaboration – trust, information sharing; Agility – visibility, velocity; SC risk management culture – leadership, innovation
Dabhilkar et al. (2016)
Proactive capabilities – internal (trained employees, learning, established recovery processes), external (alternative sourcing, environmental scanning, customer-supplier relationship and cooperation); Reactive capabilities – internal (task force, clear responsibilities, coordination, top management support), external (coordination, information sharing)

51
It is interesting to view references from the organisational resilience literature because an
organisation is a citizen of its SC. Therefore, it is interesting to consider what makes an
individual organisation resilient. For example, Witmer and Mellinger (2016) consider
resilient organisation qualities as strong commitment to mission, improvisation, community
reciprocity, transformational leadership, fiscal transparency, and hope and optimism.
Similarly, Stephenson (2010) and Whitman, Kachali, Roger, Vargo, and Seville (2013) offer a
13 indicator model of organisational resilience (see Figure 2.2) that are grouped into three
broad categories:
Leadership & Culture: refers to the “adaptive capacity” that is institutionalised in an
organisation.
Change Ready: refers to the “planning” aspect that helps an organisation to become
change ready.
Network: refers to the “internal and external relationships” that are developed for
leverage in tough conditions.
Figure 2.2 – The organisational resilience framework, Source: ResOrgs (2018)
In contrast to the SC resilience literature, the organisational resilience literature (Nilakant,
Walker, Van Heugten, Baird, & De Vries, 2014; Orchiston, Prayag, & Brown, 2016; Stewart &
O'Donnell, 2007; Whitman et al., 2013; Witmer & Mellinger, 2016) presents the following
distinctive characteristics regarding the concept:
52
It focuses on softer aspects of resilience such as leadership, culture, unity of purpose
and staff engagement, whereas SC resilience primarily focuses on operational
aspects such as building flexibility and redundancy.
The organisational resilience framework focusses more on a proactive posture by
embedding resilience in the culture of an organisation. In contrast, most researchers
in the SC resilience domain give more weight to the response and recovery phase,
which is the reactive posture.
In other words, it can be argued that the organisational resilience literature talks
about “finding the silver lining” (Seville & Vargo, 2011), whereas SC resilience is more
about surviving and responding to a potential crisis.
On the similar grounds, Mandal (2014) suggests exploring SC resilience from a behavioural
perspective, since most research talks about the operational aspect of resilience. This leads
to a key question about contemporary research gaps in the field, which builds up the
research aims for this study.
2.6.4. What are the key research gaps in the field?
As highlighted above, the definition of SC resilience talks about preparation, response,
recovery and growth of a SC in face adversity. Hohenstein et al. (2015) conceptualise SC
resilience into difference phases: readiness, response, recovery and growth. To cope with
internal or external adversity, organisations in a SC have to scan and build upfront
capabilities, which are attributed to SC readiness or preparation to either avoid or reduce
the impact of a disruption (Chowdhury & Quaddus, 2016). For example, the SC resilience
literature (Rice & Caniato, 2003; Sheffi & Rice, 2005) highlights building flexibility and
redundancy to enhance SC’s ability to better manage disruptions. Once organisations
experience an unexpected disruption, they need to engage in response effects quickly.
Sometimes it means reconfiguration of resources that help to quickly recover from the
disruption (Chowdhury & Quaddus, 2016). Though SC resilience is conceptualised into
different phases, the relevance of specific elements to these phases is still limited in the
literature (Hohenstein et al., 2015). Scholten et al. (2014) and Chowdhury and Quaddus
(2016) explore SC resilience in the context of different phases, but both studies explore only
the readiness, response and recovery phases. SC resilience is fundamentally related to the
53
different phases of a disruption (Ponomarov & Holcomb, 2009), which provides an
opportunity to empirically explore the concept of SC resilience in the context of the
different phases. Further justification for the disaster management framework and its
applicability to the SC resilience concept is mentioned later in this chapter.
To explore the SC resilience elements in the context of the different phases of a disruption,
first, this study empirically explores elements that help build a resilient SC. Though, the SC
resilience literature talks about SC vulnerabilities/risks (e.g., (Christopher & Peck, 2004;
Peck, 2005; Pettit et al., 2010), and presents various capabilities and strategies to deal with
those vulnerabilities (e.g., (Christopher & Peck, 2004; Colicchia et al., 2010; Pettit et al.,
2010; Priya Datta et al., 2007; Sheffi, 2005a; Sheffi & Rice, 2005). Interestingly, the literature
review uncovered different terminology to express similar approaches to achieve resilience.
For example, Pettit et al. (2010) highlight these as formative capabilities, whereas,
Ponomarov and Holcomb (2009) attribute these as antecedents of SC resilience. Though
differences exist on how researchers attribute various concepts around resilience, most
elements remain similar, e.g., Hohenstein et al. (2015) and Tukamuhabwa et al. (2015)
combine all of the terminologies from the literature and highlight that flexibility and
redundancy are the top two elements that build a resilient SC. Tukamuhabwa et al. (2015)
argue that most SC resilience frameworks, describing different elements, are based on
theoretical/conceptual understanding and modelling studies. An empirical approach, such
as a case study or survey, is lacking in the literature. Therefore, empirical research is
strongly demanded by the literature (Hohenstein et al., 2015; Mandal, 2014). In addition,
the following research gaps strengthen the choice of and rationale for conducting an
empirical study.
Most empirical research, both case studies and surveys, in the literature focus on
exploring the manufacturing sector. For example, Yilmaz Borekci et al. (2015) focus
their case study on the textile sector and Zsidisin and Wagner (2010) conduct their
survey-based study on manufacturing related industries, such as the aircraft and
material equipment industries. There is a limited focus on the empirical investigation
of other sectors, such as the service or primary sectors. The literature review
revealed only one article that truly focused on an agri-food SC (Leat & Revoredo-
Giha, 2013), in studying SC resilience. As highlighted in Section 1.1, the impact of a

54
disruption to SCs operating in the agricultural sector can be more severe compared
with other sectors. For example, floods directly impact the agricultural sector with a
loss in production, damage to agriculture land, a shortage of raw material, increased
food prices and can also present food security concerns (Edwards et al., 2011).
Furthermore, the agriculture sector involves perishable products, which further
increases the complexity of managing SC operations, especially during a disruption.
These distinct product characteristics and the numerous vulnerabilities during a
disruption provide an opportunity to explore SC resilience in the agricultural context.
In addition, the literature on SC resilience focuses mainly on developed countries
such as in North America and Europe (Jüttner & Maklan, 2011; Pettit et al., 2013;
Scholten & Schilder, 2015; Sheffi, 2015), and most empirical investigations are on
disruptions and companies operating in developed countries. Tukamuhabwa et al.
(2015) stress exploring the concept in developing countries. Developing and under-
developed economies present a distinct business environment and, consequently,
different challenges and vulnerabilities (Rwakira, 2015; Tukamuhabwa et al., 2015).
In developing countries, such as Pakistan, the agricultural sector, especially the dairy
sector, faces numerous challenges such as a lack of infrastructure, frequent power
outages, political instability, a high threat of terrorism and an underdeveloped
primary sector. Consequently, organisations operating in such countries may need to
develop distinct capabilities to deal with the challenges. This provides an opportunity
to explore SC resilience in the context of both a developed (New Zealand) and
developing (Pakistan) country to propose a comprehensive framework highlighting
the SC resilience elements.
The risk to SCs can be divided into two categories, operational and disruptive (Tang,
2006a). Operational risk can be defined as inherent challenges to SCs, such as supply
uncertainties due to power outages and equipment failure. Whereas, disruptive risks
refer to major disruptions resulting from man-made or natural causes such as floods,
earthquakes and terrorist attacks (Torabi, Baghersad, & Mansouri, 2015). A relatively
minor crisis, such as an operational disruption, if not dealt with effectively can lead
to a major disruption for organisations (Davies & Walters, 1998; Ibrahim et al.,
2003). A resilient SC enables organisations to prepare and manage disruptions
effectively. Opposed to the risk management approach, where each risk and

55
disruption is measured against its likelihood and impact enables organisations to
develop mitigation strategies, SC resilience is a comprehensive approach that builds
capabilities to deal with disruptions regardless of their impact or probability of
occurrence. The study by Torabi et al. (2015) proposes a two-stage programming
model for supplier selection and order allocation that enables organisations to build
a resilient supplier base in the context of operational and disruptive risks. Similarly,
the study by Munoz and Dunbar (2015) proposes performance measurement to
evaluate the operational resilience of SCs, where a disruption is characterised in
various risk dimensions of frequency and magnitude (high or low). Apart from these
studies, most SC resilience literature considers major SC disruptions and ignores the
fact that a relatively small operational risk can lead to a major disruption, if not dealt
effectively. Therefore, there is a need to understand the fundamental elements to
achieve resilience in the context of an operational disruption and how these relate to
elements in a major SC disruption.
The literature discussion above highlights various research gaps still present. These agree
with suggestions from other authors who stress exploring the concept through an empirical
lens. As highlighted above, the literature review also highlights the relevance of SC resilience
to the disaster management cycle that is explored in the next section.
The Disaster Management Cycle
Disaster management is often referred to as a multiple stage process called the “disaster
management cycle” (Cozzolino, 2012) or “the disruption profile” (Sheffi & Rice, 2005).
According to the disaster management literature (Altay & Green, 2006; Cozzolino, 2012;
Kovács & Spens, 2007), this process comprises four stages: Mitigation, Preparation,
Response, and Reconstruction/Recovery.
The mitigation phase involves anticipatory measures to protect against any stress. It entails
tools such as risk assessment and risk reduction (Dmitry et al., 2014). The aim of this phase
is to reduce the chances of a potential vulnerability (Cozzolino, 2012). Many organisations
formulate a wide range of strategies and tactics, before a crisis, to execute during the
response stage (Van Wassenhove, 2006). The preparedness phase involves allocation of
resources and contingency planning for successful implementation of the response

56
(Cozzolino, 2012). Proper identification of all actors in the preparation stage enables
successful implementation of the response plan (Van Wassenhove, 2006). It is important to
note that both of these phases correspond to the pre-disruption phase of a disruption and,
in context of the SC resilience definition, both of these phases develop a SC’s ability to
prepare for a disruption. As these phases represent pre-disruption activities, for this study
they are grouped into one category called the “Readiness Phase”.
Once a disruption happens, immediately an organisation or SC moves into the response
mode. The response phase aims at resource deployment to control the situation. This phase
is often divided into two sub-phases (Cozzolino, Rossi, & Conforti, 2012; Sheffi & Rice, 2005):
First/initial response: the focus of the first sub-phase is to protect/save lives, control
the situation, restore temporary communication and prevent potential damage.
Second/full response: the aim of this sub-phase is to restore operations. This
requires a high level of coordination of resources within an organisation and with
other actors. It also involves temporary activities, such as operating in higher than
the usual capacity and time, to restore the operations.
In the context of the SC resilience definition, the second phase corresponds to an
organisation/SC’s ability to respond quickly to a disruption. Secondly, in case of a SC
disruption, this phase is attributed as an immediate disruption in the flow of
products/services across a SC and presents the highest level of uncertainty.
The recovery or reconstruction phase builds on the response phase and involves building
new facilities or restructuring the operations to restore the performance level to the pre-
disaster stage (Sheffi, 2005a). This phase also brings opportunities to develop and invest in
sustainable operations and processes (Cozzolino, 2012; Dmitry et al., 2014). In terms of
product/service flow, in this phase an organisation/SC restores its flow of products and
information and achieves desirable operational performance. In the context of the SC
resilience definition, this phase reflects an organisation/SC’s ability to quickly and cost-
effectively restore/recover to the pre-disaster, or a new, state.
The majority of the disaster management literature attributes growth and learning aspects
to the recovery phase. However, Clarinval and Ahmad (2015) suggest development or
growth as a separate process to the recovery phase. In terms of the SC resilience literature,

57
Hohenstein et al. (2015) attribute growth to a separate phase. This phase can be
characterised as taking advantage from a disruption to develop specific elements to boost
performance and learning by reflecting on the event. Firms that capitalise on this
opportunity create a sustainable competitive advantage (Sheffi, 2005c). In contrast, firms
that merely consider this stage as restoring the business operations may face recovery
difficulties in long-run and may suffer from a bad reputation among customers (Sheffi &
Rice, 2005). Therefore, the growth and learning phase is an integral part of achieving SC
resilience.
Figure 2.3 presents the disaster management cycle as learnt from the literature.
Disaster Management
Cycle
(Mit
iga
tio
n &
Pre
par
ed
ne
ss)
DisasterOccurence
Response Phase
Re
cov
ery
Ph
ase
Learning & Growth Phase
Re
ad
ine
ss P
ha
se
Figure 2.3 – Disaster management cycle
The SC resilience definition reflects four main characteristics – ability to prepare, respond,
recover and grow in the face of a disruption (Golgeci & Ponomarov, 2013; Peck, 2005; Pettit
et al., 2013; Ponis & Koronis, 2012; Ponomarov & Holcomb, 2009), which correspond to the
various stages of a disruption. On similar grounds, Ponomarov and Holcomb (2009) suggest
that disaster management phases directly relate to the concept of SC resilience and propose
a theoretical framework incorporating readiness, response and recovery phases. The similar
concept was used by Scholten et al. (2014) and Chowdhury and Quaddus (2016) to explore

58
the concept of SC resilience. However, both of these studies ignored an essential element of
resilience and disaster management framework, i.e., the growth phase. Secondly, the
understanding of how the various SC resilience elements interact with each phase of a
disruption is limited in the literature. Only the systematic literature review by Hohenstein et
al. (2015) explores the different elements with each phase of the disaster management
framework. However, that study lacks an empirical foundation.
In addition to the disaster management framework, exploring SC resilience requires basic
understanding and characteristics of SC networks that is explored in the next section.
Understanding SC Networks
As highlighted earlier (2.2), a SC consists of a complex network of companies involved in
product flow from initial raw material suppliers to the end-consumers linked by information
and monetary flow. Hearnshaw and Wilson (2013, p. 444) suggest that “a supply chain can
be modelled as a network”, where firms are considered as nodes and each firm exercises
autonomous power. These firms link with each other through a set “connections” that
enable the flow of information, goods and services. To study a SC disruption, it is essential
to understand the key characteristics of SC networks and how these networks form and
function. In the context of network research, it is important to consider various challenges
associated with conducting such studies and the theoretical reasoning for selecting
appropriate organisations in a SC.
According to Achrol and Kotler (1999, p. 148), “A network organization is an interdependent
coalition of task- or skill-specialized economic entities (independent firms or autonomous
organizational units) that operates without hierarchical control but is embedded, by dense
lateral connections, mutuality, and reciprocity, in a shared value system that defines
"membership" roles and responsibilities”. Though a SC is considered as an array of firms
involved from raw material providers to end-retailers, many contemporary studies suggest
that a SC concept is more than just a linear system (Choi, Dooley, & Rungtusanatham, 2001;
Hearnshaw & Wilson, 2013; Pathak, Day, Nair, Sawaya, & Kristal, 2007).
Choi et al. (2001) attribute a supply network to a complex adaptive system that includes a
network of firms collectively providing goods and services, in addition to other entities in
environments such as economic systems, large institutional and cultural systems that all
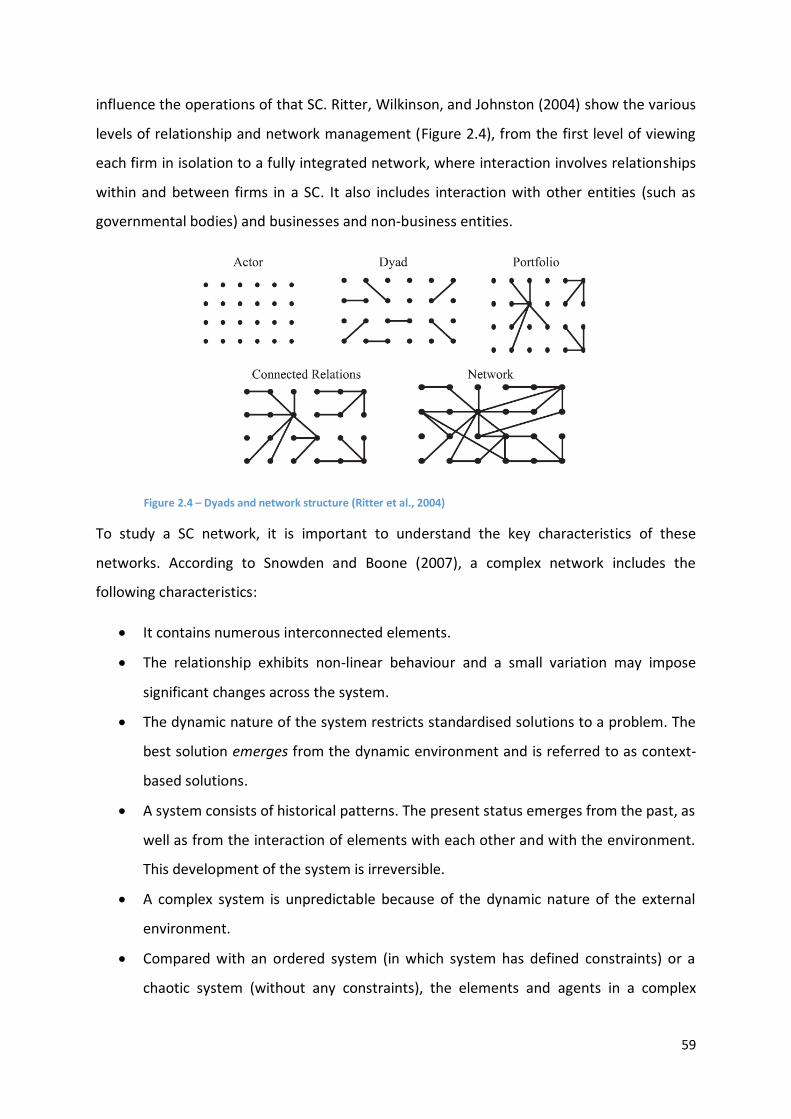
59
influence the operations of that SC. Ritter, Wilkinson, and Johnston (2004) show the various
levels of relationship and network management (Figure 2.4), from the first level of viewing
each firm in isolation to a fully integrated network, where interaction involves relationships
within and between firms in a SC. It also includes interaction with other entities (such as
governmental bodies) and businesses and non-business entities.
Figure 2.4 – Dyads and network structure (Ritter et al., 2004)
To study a SC network, it is important to understand the key characteristics of these
networks. According to Snowden and Boone (2007), a complex network includes the
following characteristics:
It contains numerous interconnected elements.
The relationship exhibits non-linear behaviour and a small variation may impose
significant changes across the system.
The dynamic nature of the system restricts standardised solutions to a problem. The
best solution emerges from the dynamic environment and is referred to as context-
based solutions.
A system consists of historical patterns. The present status emerges from the past, as
well as from the interaction of elements with each other and with the environment.
This development of the system is irreversible.
A complex system is unpredictable because of the dynamic nature of the external
environment.
Compared with an ordered system (in which system has defined constraints) or a
chaotic system (without any constraints), the elements and agents in a complex

60
system constrain each other. This leads to uncertainty of that future that makes
forecasting difficult.
The Barabasi and Albert (BA) model (Barabasi & Albert, 1999) explains the key
characteristics of a network and is considered more relevant to a SC network (Hearnshaw &
Wilson, 2013). The BA model, also known as a scale-free network, demonstrates the various
assumptions of a network (Barabasi, 2002):
A network has a small-world characteristics with low average connectivity between
any nodes.
A typical network consists of hubs and connectors, where fewer nodes in a network
categorised as a hub with a higher level of connectivity with other nodes.
A network displays a Power Law Distribution, where a large number of nodes hold
fewer connections, whereas a few nodes, called the hubs, hold a high density of
connections.
Furthermore, the growth of a network follows “preferential growth”, where a new
node tries to get connected with a node with a higher number of existing
connections compared with other nodes, which demonstrates the “rich-get-richer”
phenomenon.
Hearnshaw and Wilson (2013) suggest that the BA Model better depicts a SC network. For
example, the existence of hub nodes in a network can be applied to a hub firm in a SC
network. This argument is more consistent with the general understanding of SC
researchers that system-wide communication and coordination generates from the hub
firm(s), such as a car manufacturing firm (e.g., Honda or Toyota) that mostly control and
coordinate network-wide decisions and strategies. Secondly, the “rich-gets-richer” concept
implies that firms with first mover advantage get more influence over new entrants to form
relationships with other firms. However, this property is based on the assumption that all
organisations are homogenous. Lastly, this model implies that hub firms have more chances
to build relationships with other major hubs and firms.
Although the BA model effectively describes a SC system, there are limitations with the
concept of the “preferential growth” of nodes. To deal with this problem, the concept of
“fitness” suggests that growth depends on the fitness or differentiation of firms compared

61
with others. Therefore, the heterogeneity principle can be included in modelling a SC
network (Hearnshaw & Wilson, 2013).
In the real world, SC networks have recently evolved rapidly in terms of number of nodes,
form and overall complexity. In the context of business research, it is fundamental to
understand the complexities associated with these networks and theoretical justification for
selecting appropriate organisations in a broader network (Halinen & Törnroos, 2005).
Halinen and Törnroos (2005) highlight four major challenges associated with network-
related research:
1. The first challenge is associated with determining the appropriate boundary of a
network. A typical SC network involves a number of nodes and complex relationships
within the nodes. Over time, these network boundaries extend and evolve without
limit (Choi et al., 2001), making it difficult to conduct a full network-based study
(Halinen & Törnroos, 2005). Therefore, a major concern is defining and delimiting
the network, particularly the theoretical rationale to delimit the network for study.
2. Secondly, a SC network can be regarded as a complex pattern of relationships among
nodes (Choi & Hong, 2002), where it becomes difficult for a single firm in the
network to maintain full visibility of and control over the network (Choi & Krause,
2006). Such network complexity limits a researcher to consider all the network
nodes and characteristics of relationships between them. Therefore, “in choosing an
appropriate theoretical perspective for the study, the researcher always loses
something of a network as real-life system” (Halinen & Törnroos, 2005).
3. The third consideration is the “issue of time”. The key characteristic of a resilient SC
is flexibility (Park, 2011; Sheffi & Rice, 2005; Yi et al., 2011), which implies that, as
the situation changes, for example, during a SC disruption, firms must reconfigure
their resources (Chowdhury & Quaddus, 2016), which results in acquiring or
eliminating network nodes. This dynamic nature of an SC network results in the
challenge to define and delimit network boundaries for a study (Halinen & Törnroos,
2005).
4. Lastly, in the context of a case study, which is the prominent empirical approach for
studying SC resilience, compared with survey-based research (Tukamuhabwa et al.,
2015), a cross-case comparison presents another problem in studying SC networks. A
62
multiple case study design is considered more appropriate resulting in more
generalizable and robust findings (Eisenhardt, 1989; Yin, 2014). Despite its benefits,
a multiple-case design presents challenges for network researchers, because each
case presents distinct dynamics making it hard to conduct a cross-case comparison
(Halinen & Törnroos, 2005).
The major consideration for a study based on SC networks relates to dealing with the issues
of complexity and providing a theoretical justification of delimiting the network. Instead of
providing a generic instruction, the study by Halinen and Törnroos (2005) offers a set of
approaches to deal with these issues that can be adopted based on the need and context of
the study. Particularly, “network horizon” and “network context” can be used to delimit the
network. Network horizon entails an organisation’s view of its SC network, where the
boundary of the network can be defined by an organisation’s experience and exposure to its
connected businesses. The network context entails a sub-set of the network horizon that an
organisation considers relevant. In the SC resilience context, the network horizon provides
an opportunity to select a focal organisation, which, according to the BA Model, is described
as the hub firm that provides network-wide communication and coordination (Hearnshaw &
Wilson, 2013). According to the network horizon, the network boundary can be defined
based on how extended a focal organisation’s view is of its SC network. For example, in an
automotive SC, boundaries can be defined based on the experience, control and visibility of
the car manufacturing firm (e.g., Honda or Toyota) of its broader SC network where the
individual firms can be considered as nodes connected to the hub firm. Though it is possible
to study an entire network horizon of a focal organisation, the context of the study problem
defines the network boundaries. The major consideration in a study investigating SC
resilience revolves around studying a particular SC disruption. The network context limits
the network horizon based on the relevance of the actors or nodes to the hub firm. In SC
resilience, the relevance of a node can be represented by its relative importance and
participation with the hub firm during a SC disruption.
In summary, understanding the key assumptions of a typical SC network would likely
facilitate defining the appropriate unit of analysis and the selection of a SC network during
data collection. Particularly, this study considers a hub or focal firm as a central organisation
that controls and facilitates its broader SC network (Barabasi, 2002; Hearnshaw & Wilson,

63
2013), and a SC disruption as the “network context” to define and delimit the network
boundary (Halinen & Törnroos, 2005). This study incorporates the approaches highlighted
by Halinen and Törnroos (2005) to deal with challenges to time and case comparisons in
conducting a SC network based study that are discussed in Chapter 3.
Theoretical Approaches and Application of other Discipline in SC Resilience Literature
It is important to consider the theoretical frame used in SC resilience research. One
common theory applied in the SC resilience context is the Resource-Based Theory, also
called Resource Based View (RBV) (Tukamuhabwa et al., 2015). RBV explains a firm’s
rationale for attaining a sustainable competitive advantage through the acquisition and
control of resources, capabilities and strategic assets (Knudsen, 2003). These resources and
capabilities, both tangible (e.g., assets) and intangible (e.g., knowledge) (Grant, 1991),
enable organisations to earn abnormal profits (Barney, 1991). According to Barney (1991),
these resources must be rare, valuable, non-substitutable and difficult to imitate. In the SC
network context, the application of these resources and capabilities relate to the inter-
organisation network rather than being limited to a single manufacturing firm (i.e., a single
firm in a SC network) (Gulati, 1999). Therefore, it can be argued that SC resources include
the SC network configuration, relational and intangible resources (Smart, Bessant, & Gupta,
2007). In terms of RBV, organisations in a SC network can build these resources through
integration and investment in the relationships that enable them to achieve sustainable
advantage over competing SCs.
In the context of SC resilience, various authors (Blackhurst et al., 2011; Brandon‐Jones et al.,
2014; Ponomarov, 2012; Ponomarov & Holcomb, 2009) have applied RBV theory to highlight
various capabilities and resources to achieve SC resilience. For example, the study by
Ponomarov and Holcomb (2009) explains that various logistics capabilities lead firms in a SC
to achieve SC resilience. Blackhurst et al. (2011) consider various human, physical, and firm
and inter-firm capital resources as sources of SC resilience enhancers.
In addition to RBV, the SC resilience concept can also be explained through the “dynamic
capabilities approach”. Teece, Pisano, and Shuen (1997) explain the term ‘dynamics’ as an
ability to renew competencies and resources to continuously adjust and maintain relevance
in a volatile business environment. The term ‘capabilities’ refers to strategic management’s
64
role to adapt, integrate and reconfigure resources and skills, both internal and external, to
meet the requirements of a changing environment. This applies to SC resilience since a
disruption brings various distinct, dynamic features to a business environment, therefore, it
requires distinct organisational and SC capabilities to respond to these challenges. In
addition to RBV, various authors (Golgeci & Ponomarov, 2013; Ponomarov & Holcomb,
2009; Yao & Meurier, 2012) have suggested that a SC needs to build these dynamic
capabilities to enhance resilience in face of an uncertain business environment.
In addition to the RBV and dynamic capabilities model, SC resilience can also be explained
through systems theory (Tukamuhabwa et al., 2015). According to Blackhurst et al. (2011),
an SC can be characterised as an open system influenced by the external environment
making it vulnerable to external threats (such as labour strikes, extreme weather and
transport issues). Therefore, as a system, SCs need to be resilient, which defines the impact
of a disruption on a SC. Fiksel (2003) explains the various inherent characteristics of a
resilient system as diversity, efficiency, adaptability and cohesion.
Various authors explain SC resilience concepts in the context of other disciplines in the
broader SC management field. For example, the study by Ponomarov and Holcomb (2009)
develops a SC resilience framework that integrates various logistics capabilities with three
phases of SC resilience: readiness, response and recovery. Similarly, Chowdhury and
Quaddus (2016) and Scholten and Schilder (2015) apply crisis or disaster management
processes to understand SC resilience. Scholten and Schilder (2015) adopt the SC
collaboration model proposed by Cao, Vonderembse, Zhang, and Ragu-Nathan (2010), to
explain the role of collaboration in achieving SC resilience. As the concept of SC resilience is
multidisciplinary (Ponis & Koronis, 2012; Ponomarov & Holcomb, 2009), these studies
explore broader concepts of the SC management discipline to explore SC resilience.
This study reviewed the definition of SC resilience and identified that the definition of SC
resilience theoretically applies to the concepts of disaster management framework (see
Section 2.7). Therefore, a major aim of this study is to identify the various SC resilience
elements and then understand how these elements relate to the disaster management
framework.

65
Research Questions
The literature review of SC resilience reveals information gaps. Theoretically, the concept of
SC resilience is explained in the context of the different phases of a disruption (Hohenstein
et al., 2015; Ponomarov & Holcomb, 2009), and the distinct characteristics and dynamics of
each phase of a disruption demand distinct capabilities. The review of the SC resilience
literature highlights the need to investigate the SC resilience elements in the context of the
disaster management framework. Therefore, to achieve this, the first aim of this study is to
explore “elements that help build a resilient SC in the context of a dairy SC” The following
section describes the various research questions to achieve the broad aim of this study.
The major reasons to empirically explore the SC resilience elements are as follows:
This study aims to explore the dairy SC, which is an underexplored sector in the SC
resilience literature. An agricultural SC, particularly a dairy SC, can be considered
more challenging than other manufacturing SCs because of its distinctive features
such as the highly perishable nature of the products, food safety concerns, high
fluctuation in demand and supply, and the impact of climate changes (Green, 2010;
Salin, 1998; Shukla & Jharkharia, 2013; Van der Vorst & Beulens, 2002). The
importance of agricultural SCs has intensified in the recent years (Yanes-Estévez et
al., 2010), because agricultural products significantly contribute to the world
economy and offer a primary raw material to many other sectors (Shukla &
Jharkharia, 2013). Sustainability and resilience have become the primary focus of
companies in the agricultural sector (Green, 2010), however, little attention is given
to the agricultural sector, including the dairy sector, in the SC management domain
(Shukla & Jharkharia, 2013) and particularly the SC resilience concept. The distinct
product characteristics and numerous vulnerabilities associated with the dairy sector
provides an opportunity to empirically explore SC resilience concept. Therefore,
exploring SC resilience in the dairy industry is a vital feature of this study.
Tukamuhabwa et al. (2015) stress exploring the resilience concept in the context of
developing countries. Various developing countries, e.g. Pakistan, are home to
numerous uncertainties, such as natural disruptions, political upheaval, economic
problems, an underdeveloped primary sector, lack of primary utilities and security

66
threats. One can assume that a natural disruption, such as an earthquake or flood, or
man-made disruption, such as a food security issue, could present distinct challenges
in developing countries and, therefore, require different business practices to deal
with such situations. Therefore, this is a significant research gap in understanding SC
resilience in the developing countries. This study aims to compare SCs from both a
developed and developing country’s context, which will be an important
contribution to the literature.
Disruption to a SC can raise from both operational and disruption risks. Most of the
empirical research on SC resilience considers major disruption risks, and ignore the
fact that a relatively small operational risk can lead to a major disruption, if not deal
effectively (Davies & Walters, 1998; Ibrahim et al., 2003). Therefore, there is a need
to understand the fundamental elements to achieve resilience in the context of an
operational disruption and how these relate with elements in the context of a major
SC disruption.
Based on these research gaps, this research proposes the first research question (RQ1) and
two sub-questions under RQ1:
RQ1: What are the elements that help build a resilient supply chain in the context of a dairy
supply chain?
RQ1.1: How do the supply chain resilience elements differ for dairy organisations
operating in a developed country (New Zealand) compared with organisations
operating in a developing country (Pakistan)?
RQ1.2: How do the supply chain resilience elements differ for an operational
disruption compared with a major supply chain disruption?
As mentioned above, the literature review on SC resilience revealed various elements of the
definition such as an ability to prepare, respond, recover and grow, which correspond to the
different phases of a disruption. Though the relevance of disaster management framework
is well recognised in the literature, not many authors or studies explore their relationship.
Notably, an empirical investigation of SC resilience in the context of the different phases of a
disruption is almost non-existent. Therefore, based on this research gap, this study proposes
the following research question:

67
RQ2: How do the various elements of supply chain resilience relate to the Disaster
Management Framework – Readiness, Response, Recovery and Learning & Growth?
Chapter Summary
This chapter presented an overview of the various concepts linked to SC resilience, such as
SC management, SC disruption, SC risk management, resilience and the disaster
management framework. Based on this review, several research gaps were identified; this
helped in proposing various research questions for this study. Overall, this study aims to
explore “elements that help build a resilient SC in the context of a dairy SC and how these
elements relate with different phases of a disruption”. This chapter presents various
research questions that are briefly summarised here:
RQ1: What are the elements that help build a resilient supply chain in the context of a
dairy supply chain?
RQ1.1: How do the supply chain resilience elements differ for dairy organisations
operating in a developed country (New Zealand) compared with organisations
operating in a developing country (Pakistan)?
RQ1.2: How do the supply chain resilience elements differ for an operational
disruption compared with a major supply chain disruption?
RQ2: How do the various elements of supply chain resilience relate to the Disaster
Management Framework – Readiness, Response, Recovery and Learning & Growth?
The next chapter (Chapter 3) will describe the research methodology adopted to fill these
research gaps and answer the stated research questions.

68
Chapter 3. Research Design and Methodology
Introduction
This chapter highlights the methodological choices espoused in this study. First, an overview
of the research process adopted in this study is provided. The discussion then moves to the
philosophical approach adopted in this thesis to rationalise the selected research method,
i.e., case studies. It is followed by a discussion of the case study approach, the data selection
and capturing. Finally, the detailed process to guide the data analysis and coding is given.
The research questions presented in the previous chapter, are briefly recapped in the
following points;
RQ1: What are the elements that help build a resilient supply chain in the context of a
dairy supply chain?
RQ1.1: How do the supply chain resilience elements differ for dairy organisations
operating in a developed country (New Zealand) compared with organisations
operating in a developing country (Pakistan)?
RQ1.2: How do the supply chain resilience elements differ for an operational
disruption compared with a major supply chain disruption?
RQ2: How do the various elements of supply chain resilience relate to the Disaster
Management Framework – Readiness, Response, Recovery and Learning & Growth?
The Research Process – An Overview
A suitable research method is based on the research aims and questions under investigation
(Saunders, Lewis, & Thornhill, 2015). This discussion consolidates the overview of the
research gaps described in Chapter 2 and highlights the overall research process adopted in
this study.
As described in Chapter 2, the concept of SC resilience is still in its infancy. Recent studies
have brought an emerging theoretical perspective to the field. However, the theoretical
perspective, with varied viewpoints, requires further empirical investigation (Hohenstein et
al., 2015; Mandal, 2014; Tukamuhabwa et al., 2015).
69
After an extensive literature review of SC resilience and related concepts, this study aims to
explore:
“elements that help build a resilient supply chain in the context of a dairy Supply
Chain and how these elements relate with different phases of a disruption”
To fill the research gaps highlighted in the previous chapter, the selection of appropriate
research methods followed a thorough, rigorous process. Based on the exploratory nature
of this study, a case study approach was considered the appropriate research inquiry
approach (see Section 3.6.2 for further details). The data were gathered from multiple
sources with a major focus on semi-structured interviews. Additionally, companies’
websites, annual reports, industry reports and news archives were used to cover the
context and to fill in gaps. Data collection and analysis were carried out simultaneously;
NVivo 11 was used for coding purposes.
Finally, the analysis proceeded through an in-depth case analysis (i.e., for each SC
disruption) and cross-case analysis (i.e., a comparison between the comparative settings,
New Zealand and Pakistan). This study concludes by proposing a framework that explains
the various elements essential in building a resilient SC and their relationship with the
disaster management framework. Figure 3.1 presents the research process adopted in this
study.
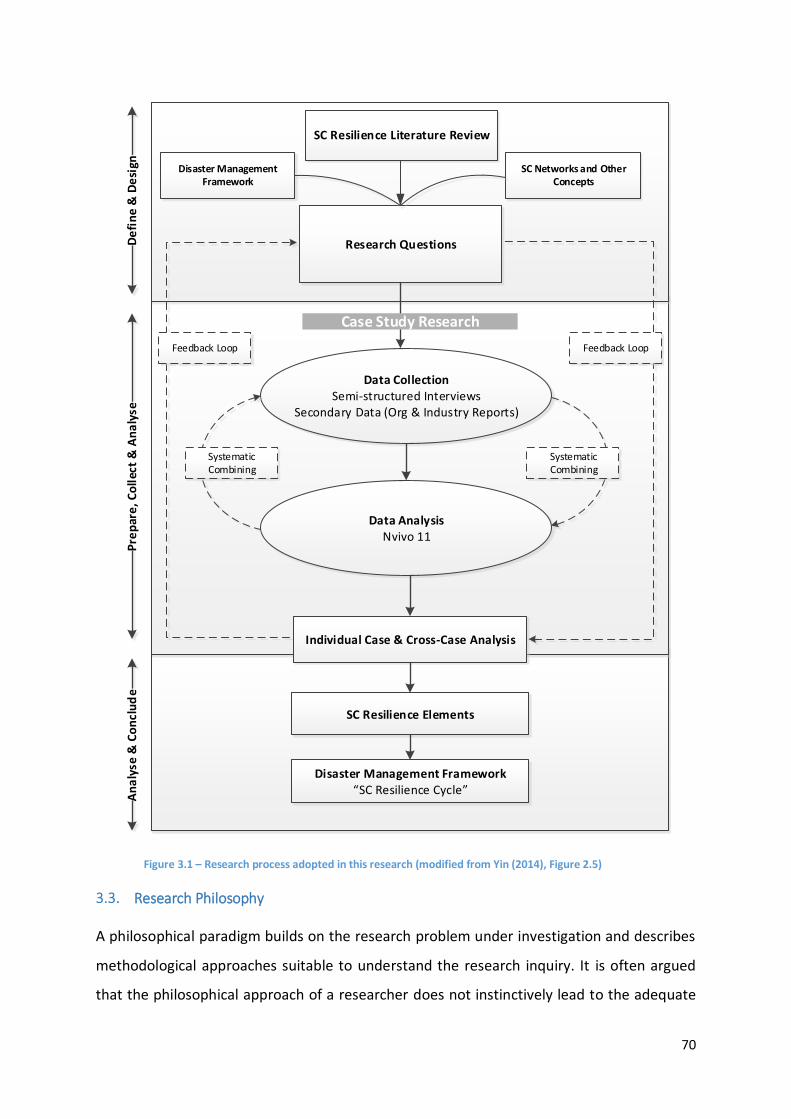
70
Data CollectionSemi-structured Interviews
Secondary Data (Org & Industry Reports)
Data AnalysisNvivo 11
Individual Case & Cross-Case Analysis
SC Resilience Elements
SC Resilience Literature Review
Research Questions
SC Networks and Other Concepts
Disaster Management Framework
Disaster Management Framework“SC Resilience Cycle”
Case Study Research
Systematic Combining
Systematic Combining
Feedback LoopFeedback Loop
De
fin
e &
De
sign
Pre
par
e, C
oll
ect
& A
na
lyse
An
aly
se &
Co
ncl
ud
e
Figure 3.1 – Research process adopted in this research (modified from Yin (2014), Figure 2.5)
Research Philosophy
A philosophical paradigm builds on the research problem under investigation and describes
methodological approaches suitable to understand the research inquiry. It is often argued
that the philosophical approach of a researcher does not instinctively lead to the adequate
71
execution of a research process. Instead, it enhances the researcher’s ability to understand
the underlining issues in a complex social setting (Patton, 2002). A researcher’s
philosophical understanding shapes the selection of a robust methodological approach.
Therefore, the first step in designing an appropriate research process is adopting a suitable
philosophical paradigm (Wainwright, 1997).
Several classifications exist in philosophy that can lead to the selection of an appropriate
philosophical approach. This research adheres to the three fundamental philosophical
principles suggested by Guba (1990): ontology, epistemology and methodology. The
following discussion briefly discusses these principles and outlines the philosophical choice
adopted for this study.
3.3.1. Ontology
Ontology deals with the fundamental characteristics of existence and addresses key
questions regarding the nature of reality such as “what is or what exists?” and “what kind of
thing exists primarily?” (Maykut & Morehouse, 1994). It deals with the structure and order
of reality (Angeles, 1981). Ontology is further classified in two schools of thought, realist and
relativist. The realist standpoint indicates the existence of a particular reality and believes
that the methods for understanding a phenomenon remain independent of a researcher’s
perception. The relativists believe that reality is based on context and its comprehension
depends on a researcher’s pre-existing understanding of knowledge (Guba & Lincoln, 1994).
This study is more influenced by the latter standpoint, the relativist approach, which rejects
the possibility of ‘one’ or ‘a true’ reality. Relativists believe there is no objective explanation
of the world or truth, and that the reality relates to the context in which it exists. The only
way one can understand a phenomenon solely depends on the way a researcher
investigates.
In this study, the researcher firmly believes that the research phenomenon under
investigation is highly contextualised. The researcher also believes that the phenomenon, SC
resilience, is shaped by its context such as organisational culture and social setting.

72
3.3.2. Epistemology
Epistemology, in contrast, represents assumptions regarding the possible ways in which
knowledge is acquired and comprehended (Maykut & Morehouse, 1994). Like the
ontological approach, epistemology consists of a quantum of objectivity and subjectivity,
which directly influence the research methods for investigation. The objective approach
refers to a defined set of laws that guide a researcher to seek and understand a
phenomenon, whereas, the subjective approach is grounded in a researcher’s views and
entails that people interpret knowledge based on their own comprehension. The principle
of the subjective approach dictates that a researcher and a subject engage in the process of
interaction and understanding and that the knowledge is shaped through that interaction
(Lincoln, Lynham, & Guba, 2011).
In consideration of the research questions under study, this study followed the subjective
approach, also called the hermeneutics stance (Wainwright, 1997). The researcher engaged
in an on-going debate with the informants within the context to understand the
phenomenon. The inquiry was investigated by pure subjective responses from the
informants and from the secondary data.
However, this research also integrates existing knowledge (such as the disaster
management framework) during data analysis, which provides some degree of objectivity.
This means that the researcher used some objectivity in understanding a subjective
phenomenon. Therefore, this study purely incorporates the subjective approach of inquiry
during data collection with a slight variation of objectivity during data comprehension.
In addition to understanding of ontological and epistemological perspectives, it is essential
to hold a particular philosophical paradigm. A paradigm reflects a basic set of beliefs that
guide actions (Guba & Lincoln, 1994). This study adopted the framework suggested by
Järvensivu and Törnroos (2010), which ranges on a continuum from naïve realism to naïve
relativism. The following discussion highlights the understanding of each paradigm and then
explains the rationale for selecting “Moderate Constructionism” as the most suitable
paradigm for the study.

73
3.3.3. Naïve Realism (Positivism)
Naïve realism is an extreme form of positivism explaining a position that, for any particular
phenomenon, a true reality exists. Reality can be comprehended through empirical and/or
objective observations. Positivism aims to achieve knowledge that enables generalisations
and can be used in various contexts (Wahyuni, 2012). It is also referred to law-like
generalisations (Saunders et al., 2015). This indicates that an investigation carried out by
different researchers in different research settings regarding a similar phenomenon should
arrive at similar findings, which is usually achieved through the statistical tests and
application of the same research tools (Creswell, 2013). Therefore, positivists aim to explore
phenomena through the scientific methods and explains it in more objective terms (Crotty,
1998).
Most studies that follow naïve realism use existing constructs or frameworks with well-
defined relations between the concepts and then carry out the research using pre-existing
instruments. The most suited application of this kind of investigation is one testing previous
theories by using variables that are quantifiable, and for which statistical tests can be
applied.
3.3.4. Naïve Relativism
Naïve relativism, also referred as constructivism (Lincoln et al., 2011), advocates that a
phenomenon consists of multiple realities depending on the context. The realities are
subjective matters that exist only in scripts and interpretations (Easton, 2002; Järvensivu &
Törnroos, 2010). This is also referred as a postmodern approach. Relativists advocate the
opposite extreme of naïve realism. A relativist researcher doubts the existence of one
theory or reality as a generalisable truth or prevalence of oneness of knowledge
(Richardson, 2008). Relativists consider the objective inquiry of a socially constructed
phenomenon as a baseless approach (Lincoln et al., 2011).
The underlying assumption of naïve relativism is best suited to research inquiries that
contain little or no prior theoretical foundation. The relativist approach aims to empirically
investigate a phenomenon and develop a theory based on the subjective understanding.

74
Often, it is difficult to categorise research based on these two extreme philosophical views.
Therefore, moderate versions of both paradigm exist in-between the two extremes: critical
realism and moderate constructionism (Järvensivu & Törnroos, 2010).
3.3.5. Critical Realism (Post-Positivism)
Critical realism (also referred to as post-positivism) reflects a middle ground between naïve
realism and naïve relativism. From an ontological viewpoint, critical realists regard reality as
independent and external. However, critical realists consider that reality can only be
imperfectly and probabilistically apprehendable (Järvensivu & Törnroos, 2010). The
fundamental difference between critical realism and naïve realism lies in investigating a
truth. The scholars endorsing naïve realism believe that truth can be comprehended
through objective inquiry. This is possible only in a natural science inquiry, where a concept
can be assessed through accurate measuring systems in a highly controlled environment.
However, in a social system, this level of controlled environment and accuracy is hard to
achieve.
Therefore, scholars endorsing critical realism believe that truth can be understood only by
moving closer to a phenomenon and, therefore, a possible reality can be untangled (Lincoln
et al., 2011; Saunders et al., 2015). This approach allows a researcher to understand a social
phenomenon or system by breaking down the system into subsystems to understand the
complex realities. Bhaskar (1989) advocates that a phenomenon can be understood only by
understanding the social structure around it that influences the phenomenon.
From an epistemological perspective, critical realists tend to focus more on a subjective
approach (milder version) to understand a phenomenon. Critical realists believe in the
embeddedness of a phenomenon in its social environment. Therefore, critical realists often
use a modified experimental design (Lincoln et al., 2011) or may not entirely focus on a
statistical or quantitative approach, but prefer a range of research methods (Saunders et al.,
2015).
The theme of this study is closely related to the critical realism paradigm of various research
dynamics. For example, social setting, SC structure, and the different nodes inside and
outside of a SC network influence the phenomenon under study, i.e., SC resilience.
However, various principles of critical realism contradict the researcher’s approach towards
75
understanding the phenomenon. For example, critical realism tends to focus on the
objectivity of a probable reality (Lincoln et al., 2011). However, this study focusses more on
a subjective perspective to understand the reality, which is endorsed by the moderate
constructionist view (discussed below).
3.3.6. Moderate Constructionism
Moderate constructionists consider truth as locally grounded at the community level, which
can be realised only through empirical investigation (Schwandt, 2000). Järvensivu and
Törnroos (2010) believe that moderate constructionism and critical realism endorse the
same point of view. Both paradigms advocate that realities can be comprehended only
through interactions and considers that the best way to create and validate the truth is to
engage in dialogue with different communities. Here, the community is referred to both a
researcher and a research subject. However, critical realism focuses more on the objectivity
of truth, whereas moderate constructionism considers multiple realities grounded in
community-based knowledge. Moderate constructionism advocates an active interview
process, specifying that a researcher and an informant engage in an interactive discussion to
jointly create knowledge (Holstein & Gubrium, 1995).
It is important to highlight here that the focus of this philosophical debate was not to offer a
generalisable right philosophical approach to conduct a research inquiry. The aim is to
discuss and defend a philosophical paradigm aligned to the current study and the
researcher’s philosophical stance. The researcher firmly believes that other philosophical
paradigms are preferable to investigate other research problems where both the
philosophical paradigm and research aims are aligned. Figure 3.2 highlights this study’s
chosen philosophical approach, which is further rationalised in the next section.
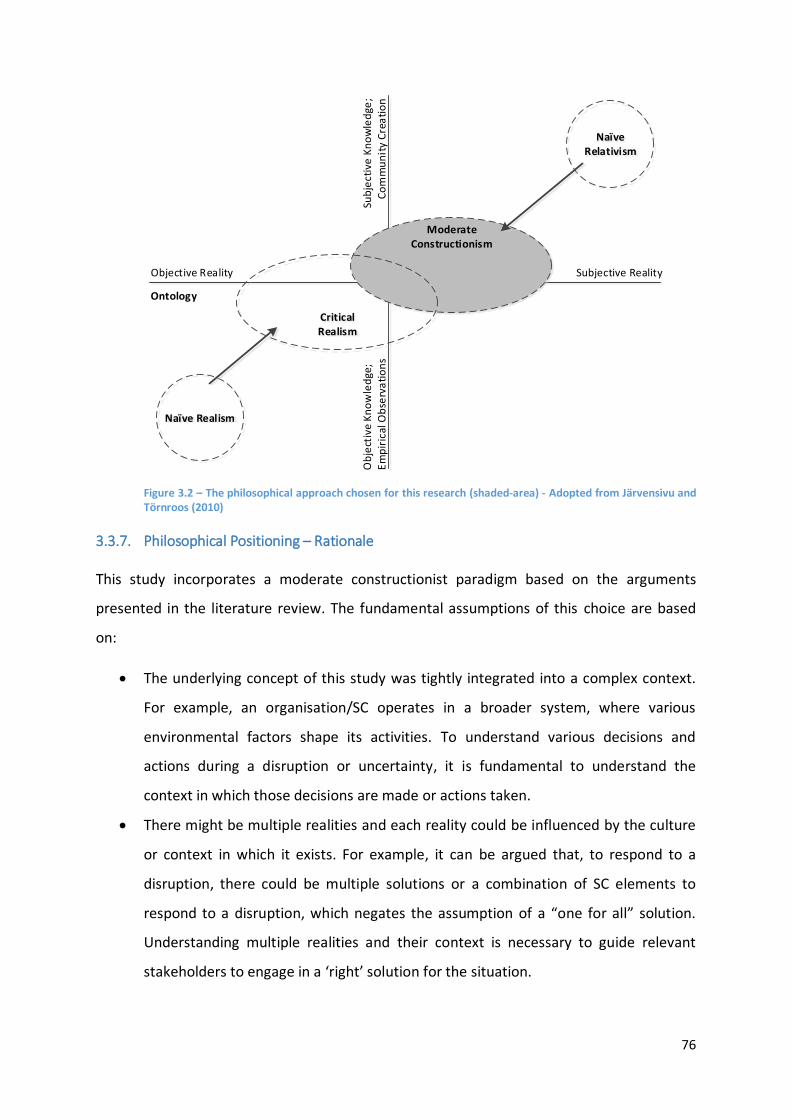
76
Objective Reality
Ontology
Subjective Reality
Sub
ject
ive
Kn
ow
led
ge;
Co
mm
un
ity
Cre
ati
on
Ob
ject
ive
Kn
ow
led
ge;
Em
pir
ical
Ob
serv
ati
on
s
Naïve Realism
Naïve Relativism
Moderate Constructionism
Critical Realism
Figure 3.2 – The philosophical approach chosen for this research (shaded-area) - Adopted from Järvensivu and Törnroos (2010)
3.3.7. Philosophical Positioning – Rationale
This study incorporates a moderate constructionist paradigm based on the arguments
presented in the literature review. The fundamental assumptions of this choice are based
on:
The underlying concept of this study was tightly integrated into a complex context.
For example, an organisation/SC operates in a broader system, where various
environmental factors shape its activities. To understand various decisions and
actions during a disruption or uncertainty, it is fundamental to understand the
context in which those decisions are made or actions taken.
There might be multiple realities and each reality could be influenced by the culture
or context in which it exists. For example, it can be argued that, to respond to a
disruption, there could be multiple solutions or a combination of SC elements to
respond to a disruption, which negates the assumption of a “one for all” solution.
Understanding multiple realities and their context is necessary to guide relevant
stakeholders to engage in a ‘right’ solution for the situation.
77
Understanding the realities takes due consideration of key environmental factors
affecting the phenomenon.
The researcher could assess and understand the phenomena only by selecting a
subset of reality and then engaging in an interactive discussion with key informants.
Furthermore, the study considers that knowledge of SC resilience is context-based and it is
possible only by going deep into the relevant system, i.e., the dairy SC for this study. The
study also acknowledges that reality is subjective and it can be best understood only by
empirical observations. These assumptions suggest that the research aims and questions
favour more the moderate constructionism paradigm.
Moderate constructionism is also in line with the abductive approach, which is a major
feature of this thesis (highlighted later in this chapter). Therefore, most of the research
process explained in this chapter, is highly influenced by a moderate constructionism
paradigm.
In addition, it is important to highlight the researcher’s self-belief regarding the
philosophical approaches in conducting research in the social sciences. The social science
academic discipline includes the study of society and the complex relationships among the
members of that society. The author believes that the nature of the social sciences makes it
difficult to explore concepts through a realist perspective. Most concepts and research
problems studied in the social sciences are tightly bounded with their context and the
reality can be subject to the contextual framework in which a concept is studied. Therefore,
the researcher believes that, in conducting research in social sciences, the relativist
approach or moderate constructionism is the more suitable approach.
Form of Inquiry – Qualitative Versus Quantitative Method
An investigation can be quantitative, qualitative or a combination of these two research
methods. The determination of a suitable research approach is embedded in the
researcher’s philosophical stance. The nature of the research questions aids the final
Selected Philosophical Paradigm
Moderate Constructionism
78
decision. For example, positivists (realists) or post-positivists advocate the objectivity of a
phenomenon; a quantitative approach is best suited to this purpose. The quantitative
approach enables a researcher to test a theory or framework adopted from the literature. In
this scenario, a researcher uses an experimental design to study statistically established
relationships, influences, or impact of various concepts and variables. The data are collected
by a pre-defined instrument to measure the concepts and it is analysed by statistical tools
and, finally, a hypothesis is either supported or rejected (Creswell, 2013).
The quantitative research approach offers many advantages. One key strength of such
studies is the high-level of generalisation to a larger population, where an appropriate
sample size produces a highly generalisable finding. Similarly, the reliability and validity of
quantitative research can easily persuade through statistical analyses. A major limitation of
quantitative research is its lack of in-depth underpinning of a phenomenon.
In contrast, a qualitative research approach focuses on the constructivist view, where a
researcher observes a phenomenon in its natural setting, (is also referred as ethnography).
It also entails a transformative perspective where a researcher studies a phenomenon
through a narrative approach. In either form, a qualitative approach adheres more to the
relativist side of the philosophical view, i.e., moderate constructionism or naïve relativism.
A vital strength of qualitative research is its ability to investigate and develop new theories
or provide new insights into existing concepts. Qualitative research is best suited to explore
the meaning of a social construct (Creswell, 2013), which is embedded in a system and hard
to isolate. This study adopts the qualitative research approach; the rationale is discussed in
the following section.
3.4.1. Qualitative Research – Rationale
The selection of a qualitative approach in this study is based on many reasons. The most
important reason depends on the nature of the inquiry and the literature on SC resilience. It
was established in the literature review (Chapter 2) that the theoretical foundations and
theories in the field are still in their infancy. Many scholars have stressed the need for
further empirical research to uncover new insights (Hohenstein et al., 2015; Mandal, 2014;
Tukamuhabwa et al., 2015).
79
Secondly, most scholars incorporate either a conceptual lens or qualitative techniques,
mostly a case study approach, in exploring the concept of SC resilience. A minority of
researchers have used a quantitative approach, since a widely accepted theoretical model
and instrument is non-existent in the field. In addition, the researcher believes that the
research questions can be best explored through a qualitative technique because
exploration of SC resilience is based on the experiences of various SC partners during a
disruption. The best suitable way to underpin this phenomenon is through active
engagement between the informants and the researcher.
Furthermore, to understand the experiences, activities, relationships and learning among SC
partners in the midst of a SC disruption, the qualitative approach was considered most
appropriate. For this study, the objective approach would not generate new insights. The
qualitative approach would allow the informants to share their experiences, ideas, learning
and concepts in their own words (Creswell, 2013), which is essential to understand
underlying research questions. Lastly, the fundamental aim of this research was to discover
new concepts, which would lead to theory creation rather than testing or verification of an
existing theory.
Approach to Theory Development – The Abductive Approach
In the social sciences, a theory development process is either by an inductive or deductive
approach. The latter starts with a literature review, which leads to establishing research
hypotheses and, finally, data collection and analysis is conducted to test these hypotheses.
A pure inductive approach starts with data collection regarding a phenomenon and, then,
data analysis allows a researcher to develop or propose a new theory (Saunders et al.,
2015). In addition to these two approaches, a third approach, abduction, provides middle
ground between the two extremes.
The choice between these three approaches is closely knitted to a researcher’s philosophical
stance. The deductive approach is in line with a realist ontological standpoint (Järvensivu &
Törnroos, 2010). Realists believe in the law-like generalisation of a reality, which relates to
Chosen Form of Inquiry
Qualitative Research

80
theory testing and the use of the deductive approach. In contrast, relativists believe in a
subjective approach to explain a phenomenon, which indicates the use of the inductive
approach (Järvensivu & Törnroos, 2010; Saunders et al., 2015).
It is considered appropriate to engage in a purely inductive approach to investigate an
emerging phenomenon such as SC resilience. However, the researcher believes that a
theoretical foundation is essential to understand a concept; it is difficult to proceed with a
blank mind. In pursuit of theory development, it is essential to consider what already exists
about a concept and then engage in an empirical investigation. Järvensivu and Törnroos
(2010) affirm that, distinct from a pure inductive approach, research through an abductive
approach considers prior theoretical foundations. This leads to a better theoretical
foundation during data collection and analysis. Additionally, the abductive approach allows
empirical evidence to generate new theory, which is unlike pure deductive approach that is
concerned with theory validation and testing.
A fundamental feature of abduction is that it moves back and forth between induction and
deduction (Saunders et al., 2015) and allows better understanding of a phenomenon. Also
called analytic induction, it refers to a process of both induction and deduction in pursuit of
a comparative method (Suddaby, 2006). Järvensivu and Törnroos (2010) propose four
elements in the abductive approach: the empirical world where reality exists, theoretical
knowledge from historical literature, an empirical investigation, and, finally, the process
ends with a proposed framework. This proposed framework then becomes the future
research direction for other researchers.
Järvensivu and Törnroos (2010) explain that moderate constructionism is closely related to
the abductive approach in developing new theories. Therefore, in the consideration of the
literature on SC resilience and disaster management framework, this research followed the
abductive approach. Figure 3.3 presents the journey of this research using the abductive
approach.

81
Theory
ResearchQuestion
Theory
Empirical Observation
Theory
Empirical Observation
I A DI = InductionA = AbductionD = Deduction
Research Phase 1:Mostly Deductive Partly Inductive
Research Phase 2:Strongly Abductive
Research Phase 3:Strongly InductivePartly Abductive
Time
Whole Research Process Abductive
Figure 3.3 –Abductive approach (Adopted from Järvensivu and Törnroos (2010)
Research Design
The previous discussion explained the research philosophy and methodological choice
(qualitative research) adopted for this study. This section discusses the next component of
the research methodology, i.e., research design concerning the selection of an appropriate
approach for data collection and analysis. The design builds on the selected research
questions and philosophical approach. It outlines specific sources for data collection and
identifies the data collection and analysis (Saunders et al., 2015). Additionally, it also
highlights any ethical considerations and the timeline of the proposed data collection.
Saunders et al. (2015) describe the methodological choice as the first component of the
research design, which has been discussed in the previous section. The following discussion
outlines the other elements: research strategy, research protocol, data collection
techniques and procedures, ethical considerations and research evaluation.
Selected Approach for Theory
Development
Abductive Approach

82
3.6.1. Research Strategy
A research strategy is an action plan to answer the research questions (Saunders et al.,
2015). The appropriate selection of a research technique is fundamental in answering the
research questions. The rationale for selecting a particular research technique is grounded
in the research questions under investigation (Yin, 2014) and the philosophical approach
adopted (Denzin & Lincoln, 2011; Holbert & Speece, 1993). Drawing from the philosophical
assumptions of moderate constructionism and the exploratory nature of this study, the case
study research technique (Eisenhardt, 1989; Järvensivu & Törnroos, 2010; Yin, 2014) was
considered the most appropriate choice to understand SC resilience (Charmaz, 2008; Locke,
2001; Urquhart, 2012).
The next section provides the justifications for and execution of the case study approach in
this study.
3.6.2. Case Study Method – Rationale
This study explores the fundamental elements of a resilient SC; it is an exploratory study.
Therefore, a case study was selected as the appropriate research strategy; it provides
various advantages to facilitate this study grounded on the selected philosophical paradigm
and the form of inquiry.
The underlying assumption of the selection was that case study research encompasses an
empirical enquiry of a specific event within its natural environment (Robson, 1993) and
often these phenomena relate to contemporary issues. Yin (2014) provides four fundament
criteria for selecting case study research (also applicable for this study):
Exploring “how” or “why” research questions.
Studying a contemporary set of events and understanding contextual conditions
relevant to the events.
When a researcher has no or limited control over behaviour and environment.
When it is hard to draw boundaries between the phenomenon and context.
Case study research facilitates in-depth analysis of a dynamic, complex problem, provides
empirical depiction and facilities theory development (Dubois & Gadde, 2002; Eisenhardt &
Graebner, 2007; Lee, Saunders, & Gummesson, 2005). According to Berg (2007), case study
83
methodology requires a systematic gathering of enough information essential to analyse
how a particular subject functions in its natural setting. Notably, case study methodology
offers grounds to investigate natural or unusual behaviours, especially for a phenomenon
with immature or weak theoretical foundation (Cassell & Symon, 2004), such as an
emerging concept like SC resilience.
From a philosophical perspective, case study research offers a broad spectrum of
applications and can be used in diverse ways to achieve different purposes. Both positivists
(naïve realists) and interpretivists have used the case study, and it has been used both for
the deductive and inductive approach (Saunders et al., 2015). Additionally, the case study
approach facilitates all type of research – exploratory, explanatory and descriptive. (Yin,
2014).
This study adopted the case study guideline proposed by Eisenhardt (1989) highlighting that
prior knowledge helps to design an appropriate research protocol, data are then collected
and analysed inductively to generate themes and, finally, it leads to theory development or
extension. At a later stage, linkages with the literature are drawn to offer theoretical
generalisations (Ridder, Hoon, & McCandless Baluch, 2014). This method is closely linked to
the moderate constructivists’ viewpoint to develop or extend theory.
The case study is one of the most commonly used methodologies within the SC resilience
literature compared with survey-based research (Tukamuhabwa et al., 2015). This is
additional justification for adopting the case study to explore the research questions.
Although case study research presents many benefits, it also has some disadvantages. It is
essential for a researcher to understand the challenges associated with the selected
research approach; this helps to reduce or eliminate these challenges. One major concern
involves the researcher’s experience and pre-existing ideas that may influence the research
inquiry. Moreover, this research follows the abductive approach, which could lead to
predetermined theoretical understanding.
It is advisable that a researcher should not dwell on any pre-conceived understanding
concerning a phenomenon in order to produce unbiased findings (Eisenhardt, 1989; Voss,
Tsikriktsis, & Frohlich, 2002). This approach allows a better understanding of the events (i.e.,

84
SC disruptions) and facilitates the comprehension of critical factors that influence these
events (Kwan & Tsang, 2001).
For this study, the researcher has taken due consideration to avoid these challenges. One
major aim of reviewing the literature was to develop an understanding and to identify
research gaps in the field. The literature review also helped the researcher develop a
research protocol to facilitate data collection. During design of the interview protocol, due
consideration was given to understanding the whole narrative of a selected SC disruption,
which corresponds to inductive approach for data collection (see section 3.7.3 for more
details).
The case study approach is criticised because it takes more time than quantitative
techniques (Vissak, 2010). From a SC perspective, it could be challenging to study an entire
SC network. Another challenge is associated with studying previous SC disruptions that,
while reflecting on past events, informants may present these events in a very positive way
or may offer a distorted picture because of their diminishing memory (Halinen & Törnroos,
2005). Similarly, data collection during a case study could spread over several months, which
can increase the risk of structural changes in participating organisations (Leonard-Barton,
1990).
Because of these challenges, a case study research design sometimes is characterised as
soft, less concrete/rigorous, unsystematic or even a less reliable data collection technique
(Halinen & Törnroos, 2005). This research design also generates a significant amount of
data, which may become a hurdle by the researcher being overwhelmed and losing focus on
the central issues under investigation (Halinen & Törnroos, 2005). To respond to these
challenges, this study employed various guidelines (explained in following sections)
suggested by various scholars to strengthen the research design (Eisenhardt, 1989;
Eisenhardt & Graebner, 2007; Halinen & Törnroos, 2005; Lee, Collier, Cullen, & Gummesson,
2007; Yin, 2014). Most of these challenges were addressed during the research design phase
and are further explained in this chapter.
3.6.3. Multiple Case Study – Rationale
Based on the literature review, the research questions and philosophical stance of the
researcher, a multiple case study design was considered as a more suitable approach in
85
answering the research questions adequately. Following points reflect the rationale for this
choice;
The multiple case study approach selected for this study offered two features. First,
two cases were chosen featuring different contextual boundaries that offers
theoretical replication. The theoretical replication enables the researcher to select
multiple cases (i.e., two SCs, one from New Zealand and the other from Pakistan) to
cover different theoretical conditions (Yin, 2014) (see section 3.7.1).
According to Yin (2014), multiple cases strengthen research robustness and is more
compelling than single case analysis. Multiple cases provide stronger substantiation
of the research findings and theoretical propositions (Saunders et al., 2015), and it
makes research findings more persuasive.
Lastly, this approach offers substantial grounds for theoretical generalisation (Yin,
2014), because the findings provide empirical evidence through multiple cases.
Multiple cases and subcases provide rich analysis in finding patterns and themes and
further help to compare similarities and differences across cases (see section 3.7.1).
For this study, during data collection and analysis, each case and sub-cases were first
regarded as independent studies and then cross-case analysis was performed to understand
the similarities, differences and trends. This process is adopted from Yin (2014) and is
highlighted in Figure 3.4.
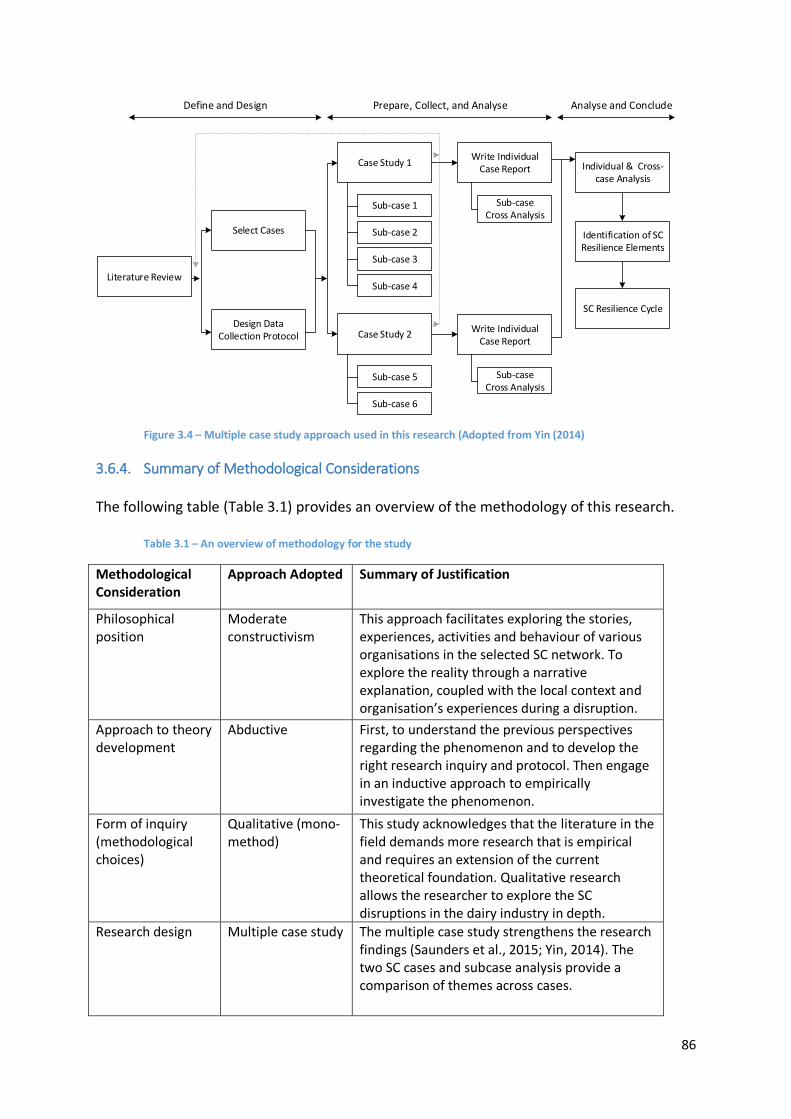
86
Literature Review
Select Cases
Design Data Collection Protocol
Case Study 1
Sub-case 1
Sub-case 2
Sub-case 3
Sub-case 4
Case Study 2
Sub-case 5
Sub-case 6
Write Individual Case Report
Sub-case Cross Analysis
Write Individual Case Report
Sub-case Cross Analysis
Individual & Cross-case Analysis
Identification of SC Resilience Elements
SC Resilience Cycle
Define and Design Prepare, Collect, and Analyse Analyse and Conclude
Figure 3.4 – Multiple case study approach used in this research (Adopted from Yin (2014)
3.6.4. Summary of Methodological Considerations
The following table (Table 3.1) provides an overview of the methodology of this research.
Table 3.1 – An overview of methodology for the study
Methodological Consideration
Approach Adopted Summary of Justification
Philosophical position
Moderate constructivism
This approach facilitates exploring the stories, experiences, activities and behaviour of various organisations in the selected SC network. To explore the reality through a narrative explanation, coupled with the local context and organisation’s experiences during a disruption.
Approach to theory development
Abductive First, to understand the previous perspectives regarding the phenomenon and to develop the right research inquiry and protocol. Then engage in an inductive approach to empirically investigate the phenomenon.
Form of inquiry (methodological choices)
Qualitative (mono-method)
This study acknowledges that the literature in the field demands more research that is empirical and requires an extension of the current theoretical foundation. Qualitative research allows the researcher to explore the SC disruptions in the dairy industry in depth.
Research design Multiple case study The multiple case study strengthens the research findings (Saunders et al., 2015; Yin, 2014). The two SC cases and subcase analysis provide a comparison of themes across cases.
87
Research Techniques and Procedures
This section highlights the basic principles in setting and delimiting the SC network, the
criteria for selecting the particular case organisations, the research protocol, the
transcription process and the ethical considerations.
3.7.1. Selection of Case Supply Chains
For this study, the agricultural sector, especially dairy SCs, was selected for two reasons.
First, an agricultural SC is more complicated than other manufacturing SCs because of the
distinguishing features: perishable nature of the products, food safety concerns, high
fluctuation in demand and supply, and the impact of climate change on agricultural land
(Salin, 1998; Shukla & Jharkharia, 2013; Van der Vorst & Beulens, 2002).
Secondly, the importance of agricultural SCs has intensified recently (Yanes-Estévez et al.,
2010) because agricultural products contribute significantly to the world’s economy and to
those of New Zealand and Pakistan (where the data were collected), and produce a major
raw material for many other sectors (Shukla & Jharkharia, 2013). A disruption such as a
natural catastrophe can negatively influence the agricultural sector. Therefore, by selecting
dairy SCs, this study could extend the overall understanding of SC resilience and would
address the research gap for the agricultural sector in the SC discipline (Shukla & Jharkharia,
2013).
The agricultural sector is a primary sector concerned with economic activities and natural
resources. It represents various activities such as animal farming, crop growing and forestry.
The case study approach poses a challenge from a network perspective because it is difficult
to define and limit the network boundaries (Halinen & Törnroos, 2005). Therefore, it was
considered essential to restrict the boundary of the selected case SCs because the
agricultural sector covers numerous sub-sectors or networks.
For this study, two dairy SCs from New Zealand and Pakistan were selected as an
appropriate sub-sector because of the following reasons:
First, this study was conducted in New Zealand, where dairying represents a
significant contribution to the economy. On a global scale, New Zealand represents
88
51 percent of the Whole Milk Powder (WMP) and almost 30 percent of the total
dairy business (OECD-FAO, 2015), which makes it the world’s largest exporter.
Recently, the New Zealand dairy sector has encountered many disruptions that
affected not only individual dairy companies but the whole dairy industry. For
example, the botulism scare in 2013, DCD (dicyandiamide) traces in milk products in
2013, and the 1080 threat in 2015 all dented the New Zealand economy and cost
millions of dollars. The 1080 threat in milk powder alone cost New Zealand’s
economy over $37 million (NZHerald, 2016). Similarly, in the botulism case, Fonterra
(the New Zealand dairy giant) had to pay a fine of $300,000 (Rutherford, 2014). This
excludes the direct loss to various dairy processing companies in New Zealand and
the overall reputational loss to the New Zealand dairy industry.
Secondly, Pakistan (the researcher’s home country) also has a significant presence in
the dairy sector. In terms of dairy production, the country is fourth in the world
(OECD-FAO, 2015) and is home to numerous international and local brands.
Like New Zealand, the Pakistan dairy industry is subject to diverse challenges.
However, unlike New Zealand, natural disruptions have affected the dairy industry
most recently, such as the 2006 earthquake and the 2010 floods. In addition, the
overall situation in the country in farming practices presents various day-to-day
operational challenges to the dairy processing companies.
Based on these compelling reasons, the dairy sector was selected as the primary source of
inquiry. In both countries, the dairy industry significantly influences the overall economy,
which makes the cross-country comparison more interesting.
3.7.1.1. Case SC 1 – New Zealand
One essential part of any research project is to select the organisations or informants for
data collection. As the dairy sector was the primary boundary or network limit of this study,
the next step after defining the appropriate research method involved the selection of a
dairy processing company and its SC partners. The complexity of a dairy SC network made it
difficult to decide which SC partners to include for data collection. Therefore, the guidelines
and principles outlined by Halinen and Törnroos (2005) were adopted to delimit the
selected SC networks.
89
According to Halinen and Törnroos (2005), the premise of a network starts with the
selection of a focal organisation. As a starting point, a dairy processing company referred as
the focal organisation 1 (FO1) was selected. This selection followed a systematic approach,
in which industry reports were analysed to determine the major players in the New Zealand
dairy industry. The top five dairy processing companies were approached to participate in
the study. Emails containing the overall scope of the research, an information sheet, human
ethics approval letter and a consent letter were sent to the relevant personnel in the
organisations. The companies were approached between June and August 2015. Two of the
five companies showed positive intent to participate in the study. Introductory meetings
were conducted to discuss the research scope and researcher's expectations. Finally, one
dairy company opted to take part in the study; the other refused because of other
commitments.
Final selection of FO1 was based on its overall presence in the industry (annual turnover),
and its unique role in its SC. Although this company did not use the term resilience, it did
have business risk management strategies in place, which is a tightly in line concept with SC
resilience. For example, various scholars (Blackhurst et al., 2011; Hohenstein et al., 2015;
Pettit et al., 2010) have identified pre-defined contingency planning as an ability to deal
swiftly with a disruption.
The next step was the selection of the network or SC partners. As discussed in Chapter 2
(Section 2.8), the approach called “network context” (Anderson, Håkansson, & Johanson,
1994; Halinen & Törnroos, 2005) was adopted to delimit FO1’s network. It provided three
distinct features:
The context includes network or SC partners and the relationships between them,
where a focal organisation determines the partners and relationships between them.
It includes the various activities performed within the network.
Lastly, it includes shared resources within the network.
Within a network horizon, the network could be either vertical or horizontal (Halinen &
Törnroos, 2005). From a SC perspective, a vertical horizon means upstream suppliers and
downstream buyers of an organisation; a horizontal horizon means organisations operating
at the same level, e.g., the competitors of an organisation.

90
Based on these principles, the first determinant to delimit the network was the selected SC
disruptions. Data collection focused on studying several SC disruptions that FO1 experienced
during the last five years and, for each disruption, data were collected from as many
partners as possible. First, in consultation with FO1’s top management, four major SC
disruptions were selected; two were major SC disruptions and two were operational
disruptions (see Chapter 5 for further details). The selection of these disruptions was based
on the low probability and high impact criterion as suggested by many scholars in the SC
resilience discipline (Manuele, 2005; Pettit et al., 2010; Sheffi, 2005c). Mainly, two major SC
disruptions were selected because of their low probability and high impact nature.
It was noted that the selected SC disruptions presented significant interruption to FO1’s SC
operations and resulted in both financial (such as significant inventory, warehousing and
shipping costs) and non-financial impact (such as the negative impact on reputation). The
two major SC disruptions not only affected FO1’s SC but also affected the whole dairy
industry (see Table 3.2 for a summary of the selected SC disruptions linked to FO1’s SC).
Table 3.2 – Selected SC disruptions (FO1’s SC)
SC Scope (Major vs Operational Disruption)
SC Disruptions
FO1’s SC - New Zealand
Major SC disruption – D1 DCD contamination issue – 2013
Major SC disruption – D2 Botulism scare – 2013
Operational disruption – D3 Shortage of a critical raw material – 2015
Operational disruption – D4 Operational issue – 2015
The selection of SC disruptions provided the key criteria for determining the network
context and network horizon (Halinen & Törnroos, 2005). In consultation with key
informants from FO1, various network partners were selected on the following criteria:
Relevance to the network – Partners who were impacted most by the selected SC
disruptions and who were involved in dealing with a particular event were
approached for data collection. The selection included both vertical and horizontal
horizons of the SC.
Activities performed – Partners who were directly involved in decision-making during
the disruptions.

91
Resources shared – Partners who shared financial or non-financial resources to
resolve the situation.
The key network/SC partners consisted of first-tier suppliers such as farmers and a third-
party logistics provider (3PL); they also involved horizontal network partners such as
competitors and regulatory authorities. The selection of both vertical and horizontal SC
partners was deliberate, which led to relevant data collection and in-depth analysis (Voss et
al., 2002).
3.7.1.2. Case SC 2 – Pakistan
The two SCs (New Zealand and Pakistan) were selected at the start. However, the data
collection from Pakistan was done after the primary analysis of the New Zealand data. This
deliberate time gap between data collection in both countries allowed the researcher to
fine-tune the research questions based on the initial analysis, a recommended approach in
case study research (Charmaz, 2014; Eisenhardt, 1989). In addition to being the standard
research protocol, this time gap provided the opportunity to explore more about the
emerging themes resulting from the preliminary analysis of the New Zealand data. This
approach also helped to define the boundary of the second SC.
Like the case selection for New Zealand, the researcher contacted the top four dairy
companies in Pakistan. All the procedures to select the second focal organisation remained
similar except that the key informants were approached through phone calls rather than
emails to increase the chance of a positive response. The initial selection process spanned
January and February 2016. Finally, a dairy processing company (FO2) opted to participate
in this study.
A similar process as for FO1 was used to select the SC disruptions for FO2. Finally, two SC
disruptions were chosen: one major SC disruption and one operational disruption. It was
again considered essential to select low probability and high impact events for comparison
between the two case SCs, particularly for the major SC disruptions (see Chapter 5 for
further details and analysis of the selected SC disruptions). Table 3.3 summarises the
selected SC disruptions from Pakistan.

92
Table 3.3 – Selected SC disruptions for the FO2 SC
SC Scope (Major vs Operational Disruption)
SC Disruptions
FO2 SC - Pakistan
Major SC disruption – D5 Flood – 2010
Operational disruption – D6 Foot and mouth disease - FMD
This followed the selection of the network or SC partners for data collection. The process
followed the structure suggested by Halinen and Törnroos (2005) (explained above), with a
few exceptions learnt from preliminary analysis of the first case SC (FO1’s SC). In addition to
network partners suggested by FO2, a few other partners, such as competitors, were
selected to attain similarity between the two case studies. Again, this approach was
adopted to enrich the cross-case analysis and to ensure comparable data collection and in-
depth analysis (Voss et al., 2002).
This purposive sampling while selecting the SC partners was considered most appropriate
(Saunders et al., 2015). The technique allows the researcher to select the network partners
based on their relevance to the study and offered flexibility to change or modify those cases
as the research evolved during data collection (Charmaz, 2008; Eisenhardt, 1989; Stuart,
McCutcheon, Handfield, McLachlin, & Samson, 2002).
3.7.2. Unit of Analysis
This study selected dairy SCs to discover the elements linked to a resilient SC. Within the
wider SC, concerned SC partners were selected based on their importance and relevance to
the network. Therefore, a subset of a wider SC was the primary analysis unit with a focus on
studying the selected SC disruptions. The aim of data collection was to take views from
multiple players in the SC network; questions asked were not limited to firm level activities
but included activities, actions, relationships and responses at a sub-network level.
It is difficult to define the unit of analysis because various organisations perceive their
supply networks differently (Carter et al., 2015). In particular, for this study, the selection of
the supply network was rationalised based on parties’ involvement in the selected SC
disruptions; this is a sub-network within the broader SC network. As the unit of analysis was
the subset of the wider SC (FO1 & FO2 SCs) in the context of the selected SC disruption, the
93
interview protocol included questions regarding sub-network level involvement and
activities.
3.7.3. Research Protocol
The first step before engaging in interviews for data collection is to develop a list of
discussion points, the research or interview protocol. This guides the researcher in asking
the right questions and provides a basic structure for undertaking an interview (Yin, 2014).
The research protocol is based on the assumption that it offers the first step in generating
themes (Coffey & Atkinson, 1996). In accordance with the instructions of Stuart et al. (2002),
a research protocol was developed based on the literature review of SC resilience, which
produced an underlying structure to the interviews (Yin, 2014).
To develop a storyline around each disruption, the questions were designed to understand
the experiences and events regarding each disruption including pre-disruption activities,
contextual information, initial response, recovery and learning from a disruption. This
narrative approach led the researcher to understand how the participating organisations
handled the disruptions and engaged in various interactions, activities and strategies with its
network or SC partners. During the interviews, discussion revolved around response from
the individual organisations and response in collaboration with their SC partners, with a
major focus on the latter.
The interviews were semi-structured and the questions were open-ended, which allowed
the researcher to probe with further questions. To support the inductive approach, probing
questions were asked regarding the real-life/organisational experience during the selected
disruptions (Saunders et al., 2015).
Lastly, a major consideration during the interviews was the language barrier in Pakistan (the
researcher’s home country), where Urdu is widely spoken. Two main steps were taken to
deal with this challenge. First, a translation of the research protocol was made by two
individuals; the researcher and a fellow PhD colleague with a firm understanding of Urdu
and the SC domain. A translation was done by an independent consultant in Pakistan. All
these translations were merged and a pilot test was conducted on another fellow
researcher to check and accordingly improve the final version.
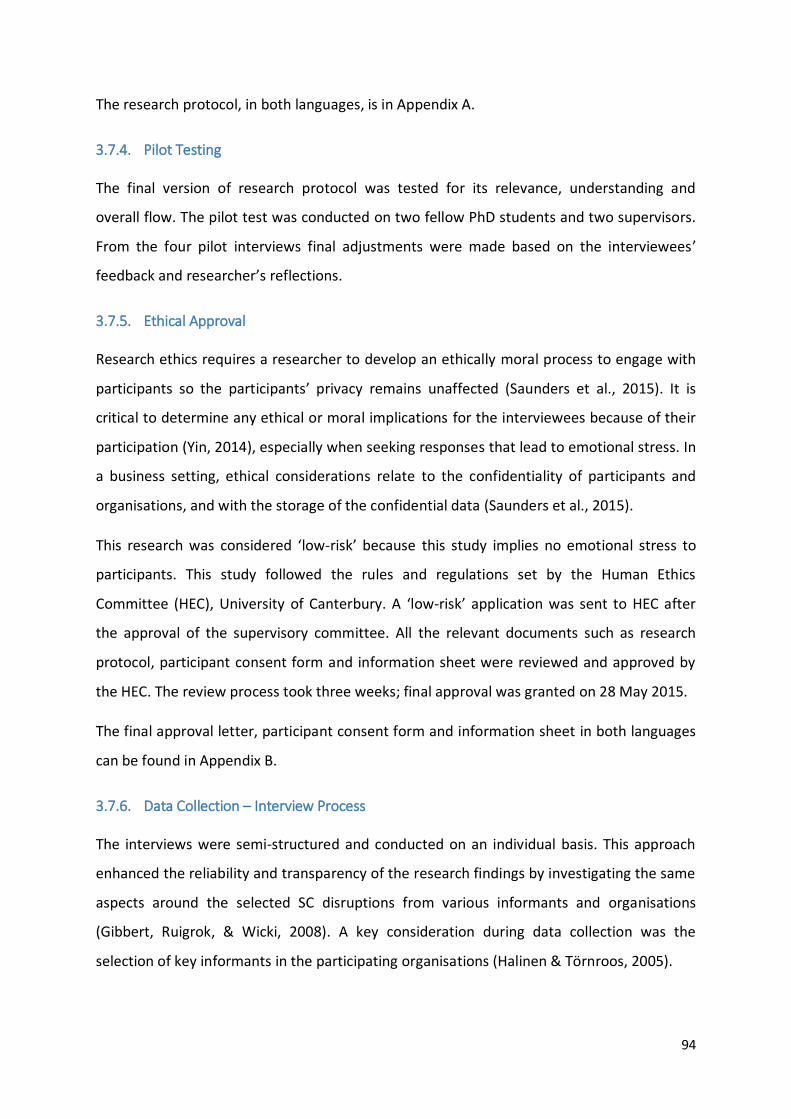
94
The research protocol, in both languages, is in Appendix A.
3.7.4. Pilot Testing
The final version of research protocol was tested for its relevance, understanding and
overall flow. The pilot test was conducted on two fellow PhD students and two supervisors.
From the four pilot interviews final adjustments were made based on the interviewees’
feedback and researcher’s reflections.
3.7.5. Ethical Approval
Research ethics requires a researcher to develop an ethically moral process to engage with
participants so the participants’ privacy remains unaffected (Saunders et al., 2015). It is
critical to determine any ethical or moral implications for the interviewees because of their
participation (Yin, 2014), especially when seeking responses that lead to emotional stress. In
a business setting, ethical considerations relate to the confidentiality of participants and
organisations, and with the storage of the confidential data (Saunders et al., 2015).
This research was considered ‘low-risk’ because this study implies no emotional stress to
participants. This study followed the rules and regulations set by the Human Ethics
Committee (HEC), University of Canterbury. A ‘low-risk’ application was sent to HEC after
the approval of the supervisory committee. All the relevant documents such as research
protocol, participant consent form and information sheet were reviewed and approved by
the HEC. The review process took three weeks; final approval was granted on 28 May 2015.
The final approval letter, participant consent form and information sheet in both languages
can be found in Appendix B.
3.7.6. Data Collection – Interview Process
The interviews were semi-structured and conducted on an individual basis. This approach
enhanced the reliability and transparency of the research findings by investigating the same
aspects around the selected SC disruptions from various informants and organisations
(Gibbert, Ruigrok, & Wicki, 2008). A key consideration during data collection was the
selection of key informants in the participating organisations (Halinen & Törnroos, 2005).

95
The informants from both focal organisations (FO1 & FO2) were carefully chosen based on
consultation with the top management of each organisation (Voss et al., 2002), and covered
various key positions and functions to achieve a comprehensive perspective. The informants
were selected from both top and middle management, which contributed to the data
richness and distinct viewpoints (see Table 3.4 and Table 3.5). Informants from the supply
network partners were chosen based on their pivotal role in the organisation and their
relationship to the respective focal organisation. In case of the SC or network partners, most
informants were either CEOs or senior managers. CEOs or key top managers were
considered the appropriate informants to reflect on critical information regarding both
levels, organisational and SC. This process follows the suggestion of Halinen and Törnroos
(2005) that key informants should be chosen based on their ability to reflect on the selected
events.
It is considered essential to develop a rapport with the informants because it facilitates data
collection (Guba & Lincoln, 1994). This was easy in case of Pakistan (the researcher’s home
country), where the researcher’s previous employment commitment ensured quick
confidence in the key informants. The researcher was also familiar with the overall business
environment and local culture. In the New Zealand case, the researcher conducted a couple
of initial meetings with the key informants from the top management, which allowed the
development of rapport and enabled the researcher to understand the business context in
New Zealand. This rapport building helped in engaging open communication with the
informants during data collection.
An interview requires high skills because the interviewer plays a leading role. As data
collection progressed, interviewing skills improved significantly, especially during the data
collection in Pakistan (FO2’s SC). The major improvements involved selecting relevant
probing or gap filler questions while maintaining minimal involvement of the researcher
who listened more actively.
Where possible, the interviews were face-to-face in official meeting rooms within the
participating organisations. However, a few interviews were conducted through a video call
(Skype) because of logistics issues. The first set of interviews were held from September to
mid-October 2015; various informants from FO1 were interviewed regarding the first two SC
disruptions (D1 and D2). A preliminary analysis was then conducted to facilitate the second

96
set of interviews. The second round of interviews started in mid-November 2015 and
concluded in mid-January 2016. During this stage, data collection involved the rest of the SC
disruptions (D3 & D4) with both the FO1 and its SC partners’ staff. Additional information
regarding the first two disruptions (D1 & D2) was also collected.
During data collection, FO1 was very cooperative in providing sufficient information and
linkages to its SC partners such as key suppliers and competitors. The project was supported
by FO1’s top management and, at the start of the interviews, an email was circulated to all
the organisation’s personnel concerned. This made the whole interview process smooth;
every informant was cooperative in sharing relevant information. Secondly, FO1 requested
its relevant SC partners to participate in the research; this made the response rate high (only
two organisations declined to participate in the study). It is important to highlight that the
only major difficulty was in conducting interviews with FO1’s buyers because most of them
were international buyers. For one disruption, a proxy interview was undertaken with the
sales manager of FO1.
Table 3.4 provides the informants’ details linked to the data collection from FO1’s SC. The
table also includes the NVivo codes attributed to each organisation and participant; they
were used to anonymise the participants’ and organisations’ identity. These NVivo codes are
used in the analysis chapters where quotes are provided to support the analysis. The table
also shows the focus of interviews in relation to the information from each participant
regarding each SC disruption.
Table 3.4 – FO1’s SC and the key informants (New Zealand)
Position in the SC
NVivo Codes
Key Informant Interview Focus DCD – D1 Botulism – D2 Supply Issue – D3 Operational Issue – D4
Experience - Current Org (Years)
Focal Organisation – 1
FO1-P11 GM SC D1, D2, D3, D4 5
FO1-P2 GM Manufacturing D1, D2, D3, D4 8
FO1-P3 GM Sales D1, D2, D3, D4 5
FO1-P4 GM Quality D2, D4 4
FO1-P5 GM Business Planning
D1, D2 9
FO1-P7 GM HR D1, D2 6
FO1-P6 Procurement Manager
D1, D2, D3 5
FO1-P8 Supply Manager D1 9

97
Position in the SC
NVivo Codes
Key Informant Interview Focus DCD – D1 Botulism – D2 Supply Issue – D3 Operational Issue – D4
Experience - Current Org (Years)
FO1-P9 Logistics Manager D1, D2, D3 5
FO1-P10 Manufacturing Manager
D1, D2 6
FO1-P12 Sales Manager D1, D2, D3, D4 9
FO1-P1 Quality Manager 1 D2, D4 9
FO1-P13 Quality Manager 2 D1
First-tier Suppliers - 1
FO1-Fr1 Farm Manager D1, D2 & other events 4
First-tier Suppliers - 2
FO1-Fr2 Farm Owner Other events 8
First-tier Suppliers - 3
FO1-Fr3 Farm Owner Other events 3
Third-Party Logistics
FO1-3PL CEO D1, D2 10
Packaging Supplier
FO1-PckS Sales Manager D1, D2 10
Competitor 1 FO1-C1 CFO D1, D2 7
Competitor 2 FO1-C2-P1
GM – Global SC Dept.
D1, D2 NA
FO1-C2-P1
Group Manager - Resilience and Risk
D1, D2 5
Regulatory Authority
FO1-RA Regional Manager Contextual interview NA
Independent Dairy Expert
FO1-DE Former Dairy Manager
Contextual interview NA
Total Interviews 23 interviews/informants & 10 organisations
After the conclusion of data collection from New Zealand, a preliminary analysis was
conducted to facilitate the data collection in Pakistan. FO2 in Pakistan was selected in
February 2016 and interviews were conducted in March and April 2016. FO2 in Pakistan was
approached through personal linkages. Mainly, the Human Resource (HR) department was
approached to provide a connection to the relevant departments. The network or SC
partners were then selected with the help of the FO2’s informants.
A major challenge during this data collection phase was in approaching FO2’s SC partners. In
the Pakistani business environment, it is very challenging to get agreement to participate in
a research project. Most of SC partners, such as farmers, distributors and retailers, were
uneducated and they had little understanding of a formal research project. This challenge
was dealt with by personally contacting the relevant SC partners. Two criteria were laid out
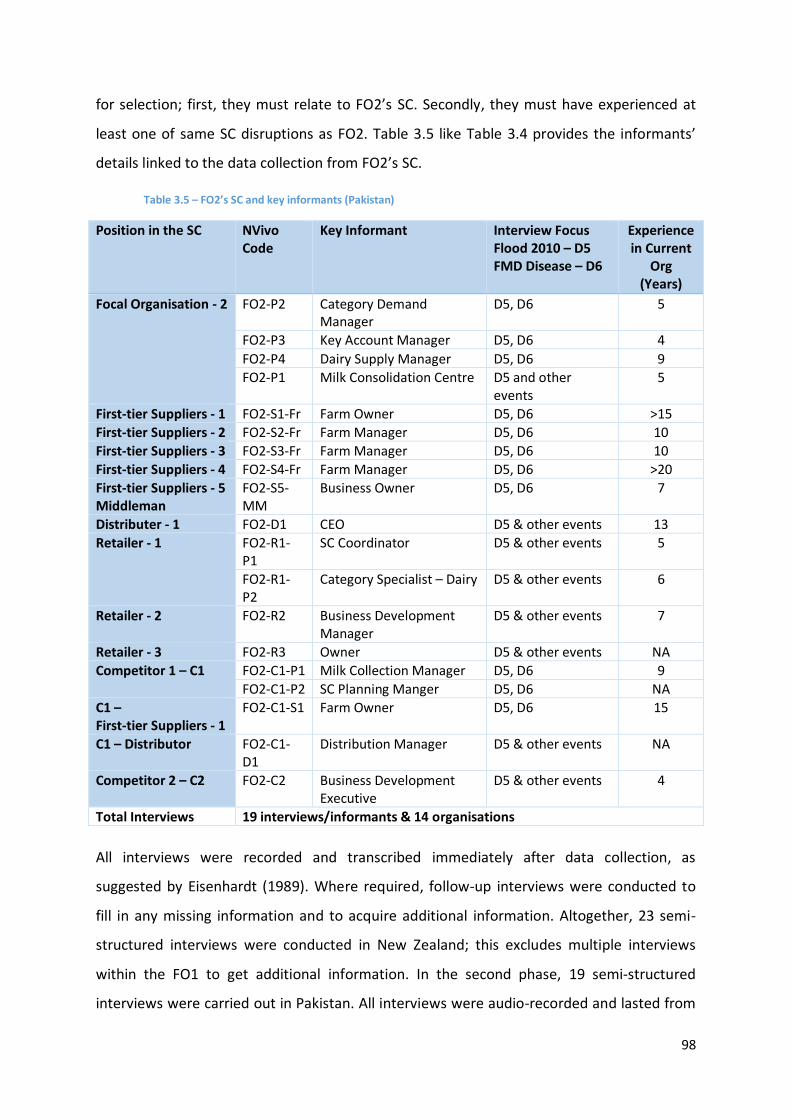
98
for selection; first, they must relate to FO2’s SC. Secondly, they must have experienced at
least one of same SC disruptions as FO2. Table 3.5 like Table 3.4 provides the informants’
details linked to the data collection from FO2’s SC.
Table 3.5 – FO2’s SC and key informants (Pakistan)
Position in the SC NVivo Code
Key Informant Interview Focus Flood 2010 – D5 FMD Disease – D6
Experience in Current
Org (Years)
Focal Organisation - 2 FO2-P2 Category Demand Manager
D5, D6 5
FO2-P3 Key Account Manager D5, D6 4
FO2-P4 Dairy Supply Manager D5, D6 9
FO2-P1 Milk Consolidation Centre D5 and other events
5
First-tier Suppliers - 1 FO2-S1-Fr Farm Owner D5, D6 >15
First-tier Suppliers - 2 FO2-S2-Fr Farm Manager D5, D6 10
First-tier Suppliers - 3 FO2-S3-Fr Farm Manager D5, D6 10
First-tier Suppliers - 4 FO2-S4-Fr Farm Manager D5, D6 >20
First-tier Suppliers - 5 Middleman
FO2-S5-MM
Business Owner D5, D6 7
Distributer - 1 FO2-D1 CEO D5 & other events 13
Retailer - 1 FO2-R1-P1
SC Coordinator D5 & other events 5
FO2-R1-P2
Category Specialist – Dairy D5 & other events 6
Retailer - 2 FO2-R2 Business Development Manager
D5 & other events 7
Retailer - 3 FO2-R3 Owner D5 & other events NA
Competitor 1 – C1 FO2-C1-P1 Milk Collection Manager D5, D6 9
FO2-C1-P2 SC Planning Manger D5, D6 NA
C1 – First-tier Suppliers - 1
FO2-C1-S1 Farm Owner D5, D6 15
C1 – Distributor FO2-C1-D1
Distribution Manager D5 & other events NA
Competitor 2 – C2 FO2-C2 Business Development Executive
D5 & other events 4
Total Interviews 19 interviews/informants & 14 organisations
All interviews were recorded and transcribed immediately after data collection, as
suggested by Eisenhardt (1989). Where required, follow-up interviews were conducted to
fill in any missing information and to acquire additional information. Altogether, 23 semi-
structured interviews were conducted in New Zealand; this excludes multiple interviews
within the FO1 to get additional information. In the second phase, 19 semi-structured
interviews were carried out in Pakistan. All interviews were audio-recorded and lasted from

99
50 to 80 minutes. During the interviews, additional notes were taken and some
observations were made that were integrated during transcription.
3.7.7. Data Collection – Secondary Sources
To supplement the primary sources, additional information was collected from various
avenues such as recorded media interviews, industry or news reports and company archives
such as annual reports and risk management documents (see Table 3.6). This approach
aligns with the suggestion from Voss et al. (2002) and Yin (2014) to ensure internal
triangulation. This technique enhances the research validity and strengthens the study’s
findings (Stuart et al., 2002).
These additional documents provided key insights and were very useful in outlining the
context of the selected cases and the SC disruptions. Data collection concluded once the
theoretical saturation was attained, after which additional data did not provide any
significant insights and new learning (Eisenhardt, 1989).
Table 3.6 – Secondary data sources
Document Source Document Type
Risk Management Policy Focal Organisation – FO1 Strategic Documents
Crisis Management Plan Focal Organisation – FO1 Strategic Documents
Incident Management Plan Focal Organisation – FO1 Strategic Documents
Risk Management Procedures & Guidelines
Focal Organisation – FO1 Strategic Documents
Annual Report Company Website Reports
News Archival News Websites (International & Domestic)
News Reports
Media Briefing Videos News Websites Videos
Industry Reports Websites – Government or International Bodies
Reports
3.7.8. Transcription
All recorded interviews were transcribed by the researcher; this provides several advantages
over transcription by an independent consultant. Ryan and Bernard (2003) suggest that the
first level of coding starts with transcription. Secondly, it provided an opportunity to reflect
on the vocal behaviour of the informants, which often highlighted key aspects. To make the
process productive, memos were used as a key tool to record ideas during transcription.
100
In addition, because the second case study was in a foreign country where all interviews
were conducted in the local language “Urdu”, the major challenge was to translate from
Urdu to English. Although it was easy to find an independent consultant, the risk of losing
the real meaning during translation of technical jargon was a challenge. Therefore, all
transcriptions were completed by the researcher to maintain consistency. During data
analysis, the original recordings were used in addition to the written transcripts. This
allowed the researcher to eliminate any possible misinterpretation and misrepresentation
during data analysis.
3.7.9. Data Security
The data confidentiality agreement required the researcher to secure the information
collected from recorded audio interviews and company documents. All the information has
been stored in secure University servers and locked facilities; it will be disposed of within
next ten years. The transcriptions, informants’ descriptions and organisations’ names were
coded to ensure confidentiality. There will be no output, either in this thesis or any future
publications that could reveal the identity of the selected organisations or participants.
Data Analysis
As suggested by Charmaz (2014), data analysis starts right after the first interview and it
continues interview by interview. Although it was hard to achieve this process in its true
nature because the selected organisations had a time constraint on participation in the
study for an extended period that would allow every interview to be transcribed, coded and
analysed. However, this was achieved in two steps. After every one or two interviews, the
researcher listened to the recorded transcripts. This allowed the researcher to reflect, write
memos and prepare probing questions for the next interviews. In addition, data collection
was done in three chunks with sufficient time between for transcription and preliminary
analysis. This process allowed the researcher to slightly modify the data collection approach
to accommodate time constraints of both participating organisations and the personal PhD
project deadline.
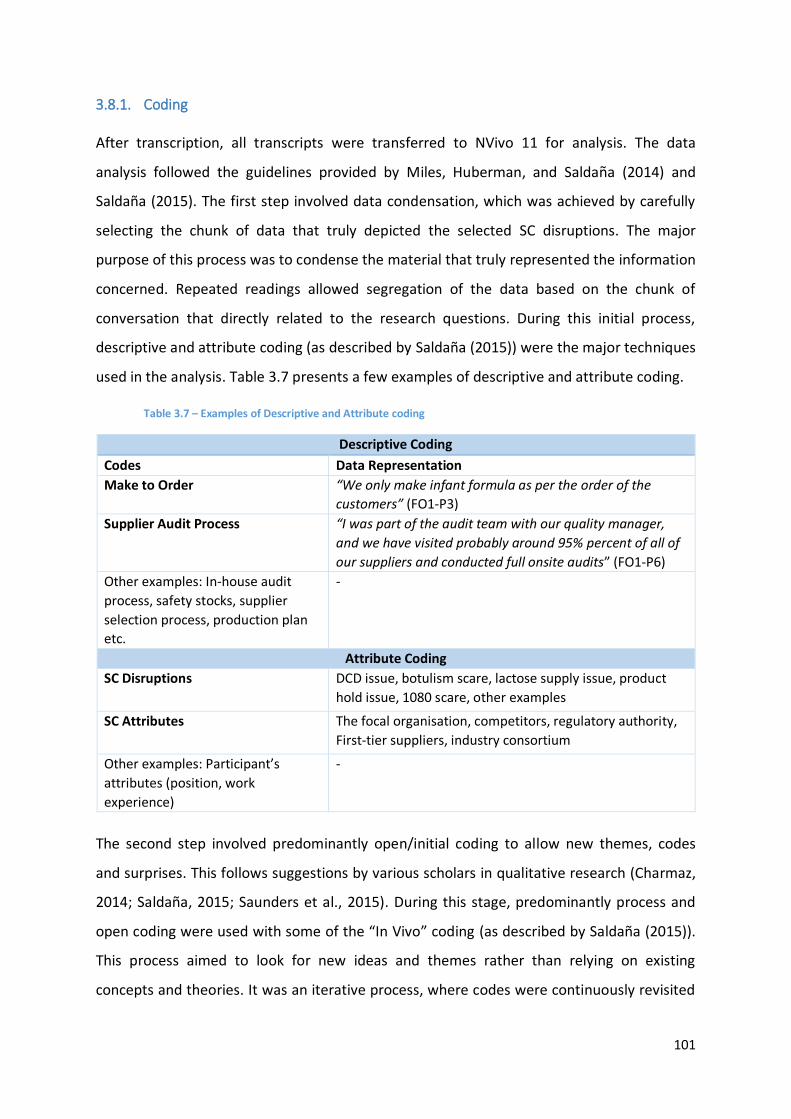
101
3.8.1. Coding
After transcription, all transcripts were transferred to NVivo 11 for analysis. The data
analysis followed the guidelines provided by Miles, Huberman, and Saldana (2014) and
Saldaña (2015). The first step involved data condensation, which was achieved by carefully
selecting the chunk of data that truly depicted the selected SC disruptions. The major
purpose of this process was to condense the material that truly represented the information
concerned. Repeated readings allowed segregation of the data based on the chunk of
conversation that directly related to the research questions. During this initial process,
descriptive and attribute coding (as described by Saldaña (2015)) were the major techniques
used in the analysis. Table 3.7 presents a few examples of descriptive and attribute coding.
Table 3.7 – Examples of Descriptive and Attribute coding
Descriptive Coding
Codes Data Representation
Make to Order “We only make infant formula as per the order of the
customers” (FO1-P3)
Supplier Audit Process “I was part of the audit team with our quality manager,
and we have visited probably around 95% percent of all of
our suppliers and conducted full onsite audits” (FO1-P6)
Other examples: In-house audit
process, safety stocks, supplier
selection process, production plan
etc.
-
Attribute Coding
SC Disruptions DCD issue, botulism scare, lactose supply issue, product
hold issue, 1080 scare, other examples
SC Attributes The focal organisation, competitors, regulatory authority,
First-tier suppliers, industry consortium
Other examples: Participant’s
attributes (position, work
experience)
-
The second step involved predominantly open/initial coding to allow new themes, codes
and surprises. This follows suggestions by various scholars in qualitative research (Charmaz,
2014; Saldaña, 2015; Saunders et al., 2015). During this stage, predominantly process and
open coding were used with some of the “In Vivo” coding (as described by Saldaña (2015)).
This process aimed to look for new ideas and themes rather than relying on existing
concepts and theories. It was an iterative process, where codes were continuously revisited

102
and revised as data analysis progressed during and after data collection as suggested by
Miles et al. (2014). Table 3.8 presents a few examples of the Process and In Vivo coding.
Table 3.8 – Examples of Process and In Vivo Coding
Process Coding
Codes Data Representation
Learning from Others’ Experiences “There were some small infant formula manufacturers
particularly up in [city], other than [the main dairy
company] that did have products that were stopped at the
border” (FO1-P4)
Assessing Product Information “So from that weekend, then straight on the Monday, we
were looking at what products we are about to ship, or
what products are actually about to get to the market or
like get to the border. We were assessing this information,
as we have retention samples, we can start testing those”
(FO1-P1)
Other examples: Developing new
testing procedures, communicating
with competitors, sharing resources
with competitors, utilising extra
resources (inventory) etc.
In-Vivo Coding
“Regulatory Changes” “Having said that, when this issue was going on, there
were concurrent issues accruing in infant formula business
in China where there were regulatory changes occurring”
(FO1-P3)
“Reliable Supplier” “Well, there are not many choices, to be honest with you.
But over the years we have become well known, reputable,
reliable supplier of suitable infant formula ingredient”
(FO1-P12)
Other examples: “Crisis
management team”, “faith in
process”, “root cause analysis
team.”
After this initial coding, data were categorised into different broad categories. First, the data
were categorised into three main groups. The first set included data that represented
quotes or sentences related to the general facts regarding each SC and disruption. These
were used during the description and context building (see Chapter 4). The second category
separated the codes and data related to the challenges, risks or vulnerabilities posted by
each SC disruption. Finally, the third chunk of codes and data included actions or strategies

103
adopted while dealing with a particular disruption. This process was built to establish
second order coding. The first level codes were also categorised into broader level themes.
After this process, the data were analysed using various lenses; this process is referred as
“Data Display” (Miles et al., 2014). First, this process started with familiarisation of the
distinct practices and actions in each focal organisation and then at the SC level.
Accordingly, this analysis allowed the researcher to see the influences, relationships and
connectivity of various factors at both levels, organisational and the SC level. This process
also allowed an understanding of how selected SC partners linked with each focal
organisation participated and managed the selected SC disruptions.
The data were then linked to the disaster management framework, which enabled linkages
of the various elements with each phase of a disruption and highlighted the importance of
some elements for a particular phase. Each broader theme then became a major analysis
focus, where each theme was analysed across the different stages of a disruption. Figure 3.5
presents an overview of the in-depth analysis, showing first order coding (data reduction),
second order coding, and finally the patterns and themes.

104
Figure 3.5 – An overview of coding
3.8.2. Cross-case Comparison
The cross-case comparison was conducted at two levels. First, SC disruptions was analysed
and compared within each SC (FO1 & FO2). Secondly, a cross-case comparison was
conducted to compare the two case SCs (i.e. FO1’s and FO2’s SCs) (see Chapter 6 for the
comparison).
Research Quality – Evaluation
The last consideration of the research methodology is to understand the quality and
strength of the selected research design. For a quantitative research design, it is determined
by testing the reliability and validity of the selected measures, where various statistical
analyses are used to ensure the quality of the research design (Saunders et al., 2015). In
qualitative research, there are specific criteria to address the research quality; they vary
based on the particular philosophical standpoint. Opposed to reliability and validity criteria,
scholars (Guba & Lincoln, 1994; Lincoln & Guba, 1985; Saunders et al., 2015) advocating a
qualitative research design suggest alternative approaches, which include addressing the
dependability, credibility, transferability, and conformability. The following sections explain
the researcher’s approach to address these four criteria.

105
3.9.1. Dependability
Dependability relates to the research reliability (Saunders et al., 2015), which deals with the
stability or consistency of a research design during multiple applications. For this study, it
was achieved by designing a standard research protocol based on the literature review.
Same broader questions were used with all informants to produce a consistent narrative
around the phenomenon. It is believed that, given the same context in future studies, using
same research protocol would likely produce similar research findings.
3.9.2. Credibility
Credibility corresponds to internal validity and refers to the appropriate representation of
research findings that actually rest on the participant’s intent (Saunders et al., 2015). For
this study, it was achieved by interviewing multiple informants from the same focal
organisation to get the various viewpoints of the same issue. Various members of the SC
network were approached to get their perspective, which increased the credibility of the
research findings. Furthermore, the multiple case study approach was used to develop
consistency among the various concepts and themes across the different cases. This method
is widely used in qualitative research to address the credibility challenges associated with a
single case study (Yin, 2014).
The rapport building with the participating organisations also helped to achieve credibility
for the data collected and, therefore, the research findings (Saunders et al., 2015). In
addition, the secondary sources also added richness and credibility to the research findings.
3.9.3. Transferability
Transferability, linked to generalisability, refers to the applicability of the research findings
in other research settings (Saunders et al., 2015). To enhance the transferability of this
study, various measures were taken. First, two case studies from two different countries
were selected to produce more transferable findings. Further, a full description of the
context, SC disruptions and the dairy sectors of both countries highlighted the premise of
this study, which provides a guideline for future researchers to understand the overall
context to apply the study’s findings in other settings. Qualitative research aims to achieve
theoretical generalisation rather than statistical generalisation (Miles et al., 2014), which
106
was the primary argument for the researcher to indulge in qualitative research, particularly
a case studies.
3.9.4. Conformability
Conformability deals with the researcher’s fairness and neutrality to establish research
findings that must be free of researcher bias and adequately represent the informants’ ideas
(Lincoln & Guba, 1985). This was achieved by using the systematic process of developing
themes and patterns from the raw data, which provided the full chain of evidence regarding
data analysis. Additionally, at every stage of data analysis, audio recordings of informants
were used, in parallel with the written transcripts, to ensure the actual meanings of the
conversations were incorporated.
Chapter Summary
The research methodology to explore the research questions was outlined in this chapter.
This research was set with the aim to identify the various factors that constitute a resilient
SC, and to bridge between the Disaster Management Framework and SC resilience. The
nature of the inquiry requires an in-depth contextual analysis to examine how SCs prepare
and respond to disruptions. Therefore, the qualitative approach, especially using case
studies, was considered a suitable research method for this study. The multiple and
comparative case study approach discussed in this chapter allowed the study to explore
various factors that constitute a resilient SC in multiple settings (New Zealand and Pakistan)
and across six SC disruptions.
To strengthen the selected research methods, a chain of evidence was drawn from the
researcher’s philosophical approach towards conducting this study. Particularly, the
moderate constructionism stance was adopted because it was in line with the qualitative
and abductive approaches, which are the main features of this thesis.
This chapter also highlighted research techniques and procedures for the selection of the
case SCs (FO1 & FO2) from both countries, New Zealand and Pakistan. In total, data
collection involved 42 interviews from 25 different organisations linked with two SCs plus
there were secondary source data from multiple sources. Finally, this chapter ends with a
brief overview highlighting the data analysis and coding processes used.

107
The next chapter provides descriptive and contextual information regarding each focal
organisation’s (FO1 & FO2) SC and their SC operations.

108
Chapter 4. Description of the Case Companies and their SCs
Introduction
This chapter provides a description of both FO1 and FO2. Predominantly, the discussion
entails an overview of the network partners beyond the generic SC, which produces a rich
contextual understanding. In addition, a model called “Supply Chain Operations Reference
(SCOR)” is espoused to understand the various strategies adopted by FO1 and FO2 across
different operational and SC processes. The SCOR model focuses on five SC processes: Plan,
Source, Make, Deliver, and Return (Huan, Sheoran, & Wang, 2004; Huang, Sheoran, &
Keskar, 2005; Lockamy III & McCormack, 2004; SCC, 2012; Stewart, 1997). The primary
purpose for incorporating this model is to understand various processes and to comprehend
the SC strategies adopted by FO1 and FO2 to manage, prevent or mitigate any potential SC
disruption. Later, in the analysis chapters (Chapters 5, 6, & 7), the contextual information
from this chapter will enhance the understanding of how some pre-existing network
structure, processes and strategies facilitate post-disruption activities.
This chapter comprises the following sections:
4.2 Focal Organisation 1 (FO1)
4.3 Focal Organisation 2 (FO2)
4.4 Chapter summary
Focal Organisation 1 (FO1)
The firm selected for this study is among the top dairy processing companies in New
Zealand. The company's core operations involve the collection of raw milk, processing &
packaging, marketing, and selling dairy products to a wide range of customers globally. Over
the years, the company has achieved an exceptional reputation for its high-quality dairy
products processed using state-of-art plants. In rest of the thesis, this company is referred
to as ‘FO1’.
4.2.1. Products
FO1 has a diverse product portfolio involving generic categories such as whole milk powder,
skim milk powder, by-products, and various value-added products. In terms of volume, the

109
generic milk category accounts for most of the production volume compared with the value-
added category. Regarding profitability, the value-added products, though low in overall
volume, provide a high-profit margin (almost three times more than the generic milk
category) (company website & archives6).
4.2.2. People and Culture
FO1 promotes and cultivates an open culture by investing in its human resource in training
programmes. Numerous managerial staff in the company have extensive experience in the
dairy industry and are thus equipped with a wealth of expertise and professional networks
with rival dairy companies. The HR team has invested a lot of time and effort in developing a
supportive culture through various activities and facilities, such as cross-departmental team
engagement exercises, leadership workshops and purpose-built office space.
All of these activities and facilities highlight an open culture within the organisation, which is
grounded in the open communication and teamwork. As highlighted by the sales manager
(FO1-P12) that he/she came across a particular issue (Disruption 3) by “just talking up [with
a colleague from another department] at the coffee machine”. Similarly, other informants
also associated this type of open communication and information sharing over multiple
instances.
4.2.3. SC Structure
4.2.3.1. Upstream SC – Supplier Base
For a typical dairy company, a major part of the upstream SC consists of procuring raw milk
from farmers. FO1 has a vast network of farmers. Other dairy ingredients such as whey
protein concentrate (WPC) and lactose, and non-dairy ingredients such as vegetable oils,
minerals, and vitamins, are predominantly purchased from various international suppliers.
Mainly, these dairy and non-dairy ingredients, except for lactose, are used in value-added
products, such as infant and speciality dairy powders. Lactose is primarily used in the
generic product category. Other supporting supplies comprise packaging materials and
energy supply, which are sourced locally.
6 For the purpose of confidentially, the web address of company website and archives has not been mentioned.

110
4.2.3.2. Downstream SC – Buyers’ Base
The company’s downstream SC includes multiple buyers, both domestically and
internationally, with a major focus on international buyers. The company has a strong
network of buyers in various countries, with a major focus on Asia and the Middle East.
Buyers of the generic dairy powder comprise various multinational corporations, which then
market finished products under their brand name. In terms of business volume, most of the
business is accounted for by big multinational companies, with the rest relatively medium to
small companies. Furthermore, the company’s buyer-base also includes various
independent agents, which then sell to various companies globally.
4.2.3.3. Other Stakeholders
In addition to the key SC partners mentioned above (also refer to Figure 4.1), there are
other stakeholders critical to FO1’s business:
Ministry of Primary Industries7 – the Ministry Primary Industries (MPI) is the central
governing body that facilitates, manages, oversees and regulates primary industry in
New Zealand. Among the primary industries, such as fishing, animal welfare,
forestry, and food, the dairy sector makes a pivotal contribution to the country's
economy. The central role of MPI in the dairy industry includes:
o developing policies to protect against the biological security risks;
o helping companies to explore export opportunities;
o monitoring quality and testing regimes; and
o providing a centralised administrative role in the case of a food security
issue.
Dairy Companies Association of New Zealand8 – the Dairy Companies Association of
New Zealand (DCANZ) was established with an aim to bring the dairy industry
together to work collectively on public policy issues. DCANZ consists of an executive
body with four representatives, whereas members of DCANZ includes
representatives from all dairy companies. DCANZ provides an opportunity for the
country’s dairy companies to discuss and collectively work on industry-wide issues.
7 https://www.mpi.govt.nz/ (Information retrieved on 29-04-16) 8 http://www.dcanz.com/ (Information retrieved on 29-04-16)

111
International regulatory authorities – For New Zealand’s dairy industry, exports of
dairy products are a major portion of any dairy company, which makes international
regulatory authorities indispensable stakeholders. Every country has its own
regulatory authorities, like MPI in New Zealand, to protect and regulate imported
dairy products from other countries, because these products could bring food and
safety concerns. Therefore, in addition to complying with MPI’s regulations, dairy
companies are required to follow regulations and policies of overseas regulators.
Other dairy players – Every company has to compete with its rivals, which often
comprise local and international players. In the case of the New Zealand dairy
industry, almost all informants highlighted the significant level of connectedness
among dairy players. Evidently, all dairy companies compete to secure and develop
their market share. However, in many ways, these companies complement each
other. For example, some dairy companies have an agreement to help each other
under various situations. Illustrations of such collaboration are discussed later in this
thesis.
Figure 4.1 shows the SC structure of FO1.
FO1
Non-Dairy SuppliersVeg Oil, Minerals, Vitamin
Milk Suppliers(Farmers)
Packaging Suppliers
Energy Suppliers
Export Agents
Buying Firms(Multinational
Companies)Retailers ConsumersDairy Ingredients
Suppliers (WPC, Lactose)
Raw Material Suppliers
Milk processing + Packaging
Intermediaries Value Addition +
PackagingDistribution Consumption
Figure 4.1 – SC structure of the FO1 supply chain
4.2.4. Risk Management Plans
A generic overview of a company’s risk management plans is a prerequisite for
understanding a company’s actions during any disruption. Since its inception, FO1 has put

112
significant effort into developing a comprehensive Risk Management Framework, which
broadly covers four components (Company Documents & Archives9):
Risk Management Policy – an overview of various risks and hazards within the
company.
Risk Management Procedures and Guidelines – provides guidelines for individual risk
and impact analysis.
Crisis Management Plan – specifies execution plans, roles and responsibilities, and
interaction with key stakeholders.
Incident Management Plan – activates in the case of a unique or unexpected event.
It specifies guidelines for response execution, roles and responsibilities and
interaction with the key stakeholders.
4.2.5. Generic SC Strategies – SCOR Model
An organisation is a citizen of its SC (Sheffi & Rice, 2005), where all the players have their
distinct roles and responsibilities. Apart from risk management planning, key SC strategies
occupy a critical role in mitigating and responding to an adverse event. To safeguard for
adversities, FO1 has espoused various SC strategies with its SC partners. In addition to the
FO1’s risk management plans, it is vital to understand the generic SC strategies that would
provide a rich understanding of the actions and strategies adopted during a SC disruption.
Most importantly, some of these strategies are based on risk management planning,
whereas the rest are generic strategies to perform day-to-day operations.
To explain SC level strategies, a generic SC structure model, highlighting SC related
strategies of suppliers, manufacturers, distributors and retailers, was considered (Collier &
Evans, 2017, p. 18). However, to maintain the symmetry and common terminology in
explaining SC strategies for both SCs (FO1 and FO2), a more detailed framework called the
“Supply Chain Operations Reference (SCOR)” is adopted to understand various SC practices
across different operations and SC processes. The SCOR model mainly focuses on four basic
SC processes: Plan, Source, Make and Deliver (Huan et al., 2004; Huang et al., 2005;
Lockamy III & McCormack, 2004; Stewart, 1997). This study incorporates a newly introduced
process “Return”, which is referred to as the fifth SC process in the SCOR model (SCC, 2012).
9 To maintain confidentiality, the links of documents are not provided in references or appendices.
113
This framework provides a systematic, uniform approach to model a SC and explains various
processes and sub-processes related to each element of the SC (Huang et al., 2005; Stewart,
1997). The framework includes different levels; level 1 highlighting the top-level processes,
level 2 explaining the configuration of processes, level 3 highlighting each process element
in detail and level 4 describing the implementation of the individual process elements. This
study broadly applies level 1 of this model that integrates five core processes: plan, source,
make, deliver and return. The application of the SCOR model provides a structured
approach to comprehending the various strategies linked to each process. Figure 4.2
displays the fundamental processes and subcategories of the SCOR model.

114
PLANP1 - Plan Supply Chain
P2 - Plan Source
P3 - Plan Make
P4 - Plan Deliver
P5 - Plan Return
Demand/supply planning Supply resourcesAggregate and prioritize demandInventory & distribution planningDetermine production
Plan infrastructureMake/buy decisionsSupply-chain configurationCapacity and resource planningManufacturing ramp-up, end-of-life
SOURCES1 - SourceStocked Product
S2 - SourceMake-to-Order
S3 - SourceEngineer-to-Order
Sourcing/material acquisition: Obtain,receive, inspect, hold and issue material
Source infrastructure: Vendor certificationand feedback, sourcing quality, manage inventory
MakeM1Make-to-Stock
M2Make-to-Order
M3Engineer-to-Order
Production execution: Receive material, manufacture and test product, package, hold and release product
Make infrastructure: Facilities & equipment,production status & quality, short-term capacity
DELIVERD1 – DeliverStocked Product
D2 – DeliverMake-to-Order
D3 – DeliverEngineer-to-Order
Demand managementOrder managementWarehouse managementTransportation managementInstallation management
D4 – DeliverRetail Product
Deliver infrastructure: Channel business rules, order rules, management of deliver inventories, management ofdeliver quantity
RETURNSR1 – Source Deliver Defective Product
DR1 –Deliver Return Defective Product
SR2 – Source Deliver MRO Product
DR2 –Deliver Return MRO Product
Receiving, verifying, and disposition of defective MRO or excessive productsReturn replacement or credit policy
Return policyRecall management
SR3 – Source Deliver Excess Product
DR3 –Deliver Return Excess Product
Figure 4.2 – The SCOR model - Adapted from Stewart (1997); SCC (2012); and Huang et al. (2005)
115
4.2.5.1. Planning
4.2.5.1.1. Demand/Supply Planning and Infrastructure
Smooth SC operations depend on the ability to forecast future demand and uncertainties
and then translate them into production and raw material planning. For this, FO1 aggregates
demand and supply planning for one calendar year. Based on this yearly forecast, the
company then plans other operations, such as a production schedule and material planning.
Where possible, the company factors extra caution into the yearly forecast to protect
against any disruption. This caution reflects in a certain amount of redundancies and duality
in resources, processes and operations (such as multiple suppliers and buyers, and buffer
stock). However, for specific resources such as overall plant capacity or, in certain processes
such as raw milk supply, the company has limited duality or redundancy.
Production planning – a yearly production plan is developed to determine the
overall capacity and raw material requirements for a year. The production plan is
then translated into a monthly and a weekly production schedule. The basic
predictor of the production planning is raw milk supply, which varies throughout the
year. Peak supply is in November and, in June and July, milk supply is minimal.
Planning of other resources and raw materials follows the same curve.
Raw material assessment – the procurement team develops a yearly forecast for
various raw materials and communicates with the relevant suppliers. For example,
the yearly forecast is shared with the packaging supplier, which enables it to commit
its production schedule accordingly.
Inventory planning – the procurement team also determines the optimal inventory
level for various raw materials based on the yearly forecast. Because of the remote
geographic location of New Zealand, the company preserves a certain level of buffer
stock to protect itself during any unexpected disruption. Most raw materials are
sourced internationally, which often requires longer lead-time for shipments. For
example, in the case of lactose, the company holds buffer stock of at least 4 to 6
weeks’ requirements. Inventory planning is applied to all dairy and non-dairy raw
materials except the raw milk. For raw milk, the company has to process it within 36
hours to avoid spoilage.
116
Warehouse and transportation planning – the yearly forecast is shared with the
logistics team for the yearly planning of on-site and offsite warehouse requirements.
Based on the assessment, the logistics team then communicates with its third-party
logistics (3PL) provider. This is essential for planning transportation and offsite
warehouse requirements.
4.2.5.2. Sourcing
4.2.5.2.1. Obtain/Multiple Sourcing
For most raw materials, FO1 has multiple suppliers both domestic and international. For
example, lactose is purchased predominantly from a supplier in the US, with backup
suppliers from that country and Europe. Most dairy and non-dairy ingredients are procured
from more than one supplier. Bagging material is the only exception to this; it is sourced
from one local supplier. In the case of services such as product testing and logistics and
warehouse solutions, the company has a single sourcing strategy.
4.2.5.2.2. Receive
For all inbound raw materials, FO1’s sole 3PL provider deals with transportation operations
from port to in-house or off-site warehouse facilities. Based on the forecasts and
manufacturing scheduled, the 3PL delivers the required raw materials to the factory.
4.2.5.2.3. Hold, Inspect and Issue Material
The quality team ensures all supplies, raw materials and packaging materials, align with the
specifications. This process, on average, takes one to two weeks. After inspection, the
products or supplies are released to be used for production or stored in the warehouse.
4.2.5.2.4. Procurement Infrastructure
The company’s procurement process includes following features:
Supplier selection and audit process – the procurement team conducts a formal
supplier selection process to recruit new suppliers. Until recently, a paper-based
audit system was in place. It required a potential supplier to answer around 100
different questions regarding its quality standards. In recent years, as of FO1’s

117
substantial growth and resource availability, a more extensive supplier selection and
audit system has been implemented. It requires an on-site audit.
Supplier certification – specifically for their farmers, the milk supply team has
various programmes to develop good farm practices across its farming community.
Feedback process – the supplier selection and audit provides an opportunity for
suppliers to improve their processes.
Risk analysis – the procurement team regularly conducts a risk analysis to
determine critical raw materials, which facilitates in determining sourcing strategies
such as multiple sourcing. This analysis also provides a vital input to the audit team
to decide on audit frequency for critical raw materials.
Supplier contract – in addition to a formal contract with suppliers, the procurement
team ensures that some of its suppliers, particularly for critical supplies, maintain
extra or redundant capacity and resources to fulfil any unexpected demand.
4.2.5.2.5. Single Sourcing Strategy
As mentioned above, FO1 has a couple of single-source suppliers, the packaging supplier
and the 3PL provider. They are selected based on their sizable scale and ability to invest in
their own extensive risk management plans.
4.2.5.3. Making/Manufacturing
4.2.5.3.1. Production Execution and Strategy
For generic dairy products, such as whole milk powder and skim milk powder, production
follows a make-to-stock strategy. In contrast, for value-added products, such as infant milk
powders, a make-to-order strategy is adopted as per the specific requirements of an
individual customer.
4.2.5.3.2. Manufacturing
This covers processing raw milk into standardised milk powders. For value added products,
the standardised milk powder goes through a blending and canning plant for processing,
where it is mixed with various other dairy and non-dairy ingredients.

118
4.2.5.3.3. Testing
Finished products undergo testing to ensure that each batch complies with the buyers’
specifications. The company has two levels of quality check in the production system. First,
multiple in-process checks in the manufacturing ensure the quality. After production, all
products are tested for anomalies. Additionally, samples of each batch are kept in-house in
the case of further testing and analysis.
4.2.5.3.4. Packaging
Generic products are packaged in generic packaging; value-added products, such as infant
formulas, are packed in the specific product containers as per the buyers’ requirements.
4.2.5.3.5. Infrastructure and Capacity Planning
FO1 has gone through substantial growth recently, which meant developing new processes.
To deal with any unusual situation, most dairy companies in New Zealand have mutual
agreements to swap milk. In an emergency, these agreements allow dairy companies to
share extra volume of the raw milk. FO1 is a member of this system and has swapped raw
milk with its competitors for multiple reasons.
4.2.5.4. Delivery
4.2.5.4.1. Warehouse and Transportation Management
Finished products are either stored in an on-site or off-site warehouse. As per the customer
orders, products are released for further packaging in desired transportation configurations.
To protect against any unauthorised access and possible contamination, all the shipments
are packed and sealed only by authorised staff. Transport and port operations are
performed under the supervision of authorised company staff.
4.2.5.4.2. Freight Management
Almost all products destined for overseas are shipped by sea. To cater for any unexpected
disruptions, the company has the alternative option of airfreight to meet delivery deadlines.
Recently, the company had to use the airfreight option a couple of times (see Disruption 4 in
Chapter 5).
119
4.2.5.4.3. Customer Strategy
Like the sourcing strategy, the company serves various markets and buyers around the
world.
4.2.5.5. Return
4.2.5.5.1. Return Policy
Dairy products can present a health and safety risk for consumers in the case of an internal
or external failure such as contamination during transport. The company has an adequate
recall policy to protect its customers.
4.2.5.5.2. Regulatory Requirements
MPI regulates the New Zealand dairy industry. In the case of any product quality lapse, FO1
is bound to communicate the problem to MPI within 24 hours. Based on the nature of an
issue, MPI then takes preventive actions such as putting the affected products on hold until
further investigation or activates a product recall plan.
4.2.5.5.3. Recall Management
To manage a recall, FO1 has invested time and effort to develop relevant processes. For
example, FO1 is part of a working group called the “Dairy Traceability Working Group” to
establish industry-wide practices to enhance product traceability within the dairy SC. In
addition, the company has invested in IT systems that contain updated information about
each batch. This information is kept aligned with sales information, which reflects product
knowledge in the downstream SC. This process ensures visibility and traceability across
FO1’s SC.
“We also maintain the traceability of all the raw materials going into the production
that is because if we put in WPC [Whey Protein Concentrate] that we bought from a
supplier in Europe, for example, we get certificates from them. So, their traceability
comes through to us, and we attach that in our final product that we produce. So, if we
have the code or the batch number on the can or on the bag, we can trace it back to all
levels and then trace it back to our suppliers’ level.” (FO1-P11)

120
FO1 had not experienced any actual product recall. However, top management has put an
enormous commitment into ensuring proper execution in any disruption. To check the
robustness of the system, the company often performs mock recall exercises that, over the
years, have made the existing systems and practices more robust and effective.
Table 4.1 presents the key strategies in broad categories and subcategories. In Chapters 5
and 6 these SC strategies will be further explored in the context of the selected SC
disruptions.
Table 4.1 – Key SC/operational strategies (FO1)
Broad Categories Subcategories
Diverse product mix Multiple product line (generic products, infant & adult nutritional powders)
Organisational structure Flat structure
Supportive culture Cross-departmental teams, staff engagement exercises, leadership workshops, purpose-built office space
Coopetition Informal agreement with competitors, collaboration – an industry consortium, professional and personal linkages
Risk management plan Risk management policy, risk management procedures and guidelines, crisis management plan, incident management plan
Planning & forecasting Production planning (yearly), raw material assessment (yearly), inventory planning (buffer stock), transportation planning (flexible transport option), warehouse planning (flexible contract with suppliers)
Sourcing strategy Multiple sourcing, single sourcing (bagging, and other services suppliers), raw material inspection, supplier audit and supplier certification, raw material risk analysis (periodic), risk planning with suppliers (redundant capacity)
Make/manufacture Generic products (make-to-stock), value-added products (make-to-order), product testing (finished product)
Deliver Backup transport mode
Buyers’ base Multiple buyers, diverse geographic location, single buyer (value-added product)
Return Product recall plan, product traceability systems and procedures, simulation/mock exercises, updated it systems and procedures
4.2.6. Summary – FO1’s SC
The previous section discussed FO1’s operations and generic SC strategies. The application
of a SCOR model provided a basic understanding of the various strategies used by FO1 to
protect against potential disruptions. The next section provides similar details regarding FO2
in Pakistan.

121
Focal Organisation 2 (FO2)
Like FO1, the dairy company selected from Pakistan is among the country’s top dairy
companies. The company’s operations mainly include collecting raw milk, then processing,
packaging, marketing and distributing it. In rest of the thesis, the company is referred as
simply ‘FO2’.
4.3.1. Products
Over the years, FO2 has developed a wide range of products, such as UHT milk, UHT skim
milk, tea whitener, cream, clarified butter (desi ghee in Urdu) and other by-products. Unlike
the FO1’s generic products, FO2 produces only retail packaged products under its own
brand name (company website and archives10).
Regarding profitability, UHT milk contributes the majority of the sales of the dairy products.
In terms of market share, the company faces severe competition, especially in the UHT milk
category. Other than dairy, FO2 operates under a diverse business portfolio, but for this
study, the information collected was concerned only with its dairy business.
4.3.2. People and Culture
FO2 has a formal management structure like any other medium to large organisation. To
support coordination between multiple departments, cross-functional team building
programmes are often organised by the company. The major purpose of these training
programmes is to support open communication and mutual understanding. According to the
dairy supply manager (FO2-P4), these programmes have become a standard feature of
employee training. FO2 often arranges simulation exercises called “risk awareness
exercises” to shape and encourage a positive attitude towards various operational
challenges.
“There is some cross-functional training like people from the SC or quality now come
here for training and then we go there for training like just to see and develop
knowledge that how they are working. [...] And likewise, the planning staff now know
much better that what challenges we face every day.” (FO2-P4)
10 For the purpose of confidentially, the web address of company’s website and archives has not been revealed
122
During the interviews, the researcher strongly noticed the coordination between staff from
different departments. The culture of the company was open and all informants were
willing to share the information needed for this study. Especially given Pakistan’s business
environment, the open culture within FO2 was a distinct feature compared with other dairy
companies (from Pakistan) that participated in this research.
4.3.3. SC Structure
4.3.3.1. Upstream SC – Supplier Base
The major activity of any dairy company is raw milk collection from farmers. FO2 has a vast
network of dairy farmers, ranging from small farmers with an output of 1 to 20 litres per
day, to mega-farmers with a daily output of over 1000 litres per day. Overall, the company
has a vast network of farmers, consisting both indirect and direct sources.
FO2 owns chilling centres across various cities, villages and provinces, where raw milk is
stored at a specific temperature, and then it is delivered to FO2’s UHT processing plant. The
company sources raw milk from two main types of farmer, direct and indirect sources. The
direct sources include direct delivery from farmers to the chilling station. Indirect sources
include intermediaries (called milkmen or doodhi in Urdu, or mini suppliers), who collect
milk from various farmers and deliver it to the chilling centres. The last category includes
strategic or commercial suppliers. These suppliers own chilling equipment and deliver direct
to the FO2’s UHT plant.
Other than milk, packaging material is a major supply because UHT milk requires special
packaging to protect it from light and bacteria. In addition, the company procures milk
powder, which primarily covers shortages of raw milk, particularly in the summer when the
milk supply is minimal. Some additional ingredients essential to balance the milk content are
procured from overseas suppliers. Lastly, the company uses a third-party logistics (3PL)
provider to fulfil all of its transport needs, both upstream and downstream of the SC.
4.3.3.2. Downstream SC – Buyers’ Base
UHT milk is a major dairy product processed by FO2, with wide-range of by-products.
Because of the high demand for UHT milk in the country, FO2 serves only domestic demand.
The company’s distribution channel is divided into three broad categories. First, FO2 has an
123
extensive network of distributors across every corner of the country, from major cities to
remote villages. Within some metropolitan cities such as Lahore and Karachi, FO2 has
multiple distributors who, in some cases, supply sub-distributors. These distributors bring
multiple benefits, including:
First, these distributors put their investment in various operations such as
warehouse space, transport fleets and sales staff.
Secondly, a distributor owns the inventory, which allows quick cash flow for FO2.
This distribution network gives FO2 coverage of a more extensive geographical area
without investing in warehousing and fleet operations.
Lastly, FO2 places its own staff at every distribution centre to oversee, guide and
manage the distributors’ operations. This strategy provides visibility and control over
the distributors’ operations.
Other than the distribution network, two other downstream channels exist – international
modern trade (IMT) and local modern trade (LMT). These channels include mega-retailers or
superstores requiring a significant amount of finished product that a typical distributor
cannot satisfy. To satisfy the enormous demand, FO2 directly works with these channels,
which requires separate sales staff and transport operations. The distribution network
drives most of the FO2’s business.
4.3.3.3. Other Stakeholders
Other than direct SC partners, such as suppliers and distributors, FO2 operates under the
influence of various stakeholders:
Dairy Associations – the dairy industry operates in collaboration with two industry
consortiums, Pakistan Agriculture & Dairy Farmers Association (PADFA)11 and the
Pakistan Dairy Association (PDS)12. PDS links all the major dairy players in the
country. PDS’s primary role includes the dissemination of trade and commerce
related information via publications – periodic journals and newsletters. The
executive committee includes members from all dairy companies in the country.
11 http://www.padfapak.org/ 12 http://www.pda.com.pk/

124
On the other hand, PADFA facilitates agriculture and dairy farmers in the country. It
helps to promote best practices, the adoption of new technology and provides other
essential help to its members, which mostly represent farming.
Although these two bodies have inspiring roles, almost all informants during the
interviews highlighted the limited role of these industry consortiums.
Government – the Pakistani government plays a central role in regulating the
country’s agricultural sector. The country has federal and provincial government
departments to govern and regulate agriculture including the dairy sector. The
primary role of government includes:
o Regulation or policy development to benefit all major stakeholders, such
as dairy companies, farmers, and consumers.
o Primarily, in context of a disaster such as a flood, various government
authorities, such as the National Disaster Management Authority
(NDMA)13 and Provincial Disaster Management Authority (PDMA)14,
provide essential resources.
o The leading role of these bodies includes the execution of disaster
management plan at the national and provincial level to facilitate
response, recovery and rehabilitation process.
Non-governmental organisations (NGOs) – the positive role of various NGOs was
highly endorsed by all of the informants during data collection. The farming sector in
the country mainly involves players with limited technical knowledge. Therefore,
NGOs, mainly USAID15, play a vital role. USAID has initiated various programmes in
collaboration with various institutes, such as the Dairy and Rural Development
Foundation, and various dairy companies, to improve dairy practices in the country.
For example, these projects include training programmes, breed improvement and
cost-sharing initiatives to develop the dairy farm infrastructure. During a disruption,
NGOs play a vital role in the initial response, recovery and rehabilitation process.
Competitors – FO2 faces enormous competition, especially for its UHT product.
Direct competitors include dairy companies offering UHT milk products. Recently,
13 http://www.ndma.gov.pk/ 14 http://www.pdma.gov.pk/ 15 https://www.usaid.gov/pakistan

125
consumers have started to prefer pasteurised milk, a key substitute for UHT milk. In
the past five years, many new companies have set up pasteurised milk processing
plants. UHT and pasteurised milk, comprise the formal milk processing and
distribution channel; it represents only 10 to 15 percent of the county’s total milk
production.
Mostly, the milk passes through a traditional channel, where traditional milkmen
(dhoodhi’) deliver milk to households daily. Most people consume fresh milk from
these milkmen and consider it a fresh and healthy option. This channel represents 85
to 90 percent of the milk production; FO2 considers this traditional channel as
indirect competition.
Figure 4.3 presents the FO2’s SC structure.
Milk Suppliers(Farmers) Chilling Centres FO2
Dairy and Non-Dairy Ingredients Suppliers
Packaging Supplier
Energy Suppliers
Distributors Sub-distributors Consumers
IMTs &LMTs (Large Retailers)
Retailers
Raw Material Suppliers
Milk processing + Value Addition + Packaging
Intermediaries(FO2 Owned)
Distribution Consumption
Figure 4.3 - SC structure of FO2
4.3.4. Generic SC strategies – SCOR Model
Over the years, FO2 has incorporated various SC strategies to cope with uncertain events.
This section provides an overview of these strategies using the SCOR model (Stewart, 1997).
4.3.4.1. Planning
4.3.4.1.1. Demand/Supply Planning and Infrastructure
For FO2, demand and supply planning is one of the critical components in running the
operations smoothly. The company has a “demand and supply planning department, […],
and it is a central planning department, where we plan for both downstream and upstream.
We capture and plan for both demand and supply” (FO2-P2).

126
Long-term planning – is based on five-year plans covering company’s long-term
targets.
Tactical planning – this involves forecasting for the succeeding 18 months, which
primarily incorporates a master production plan. It also reflects raw material, human
resource and other functional planning.
Operational planning – the operational horizon comprises three-monthly planning.
This document adjusts any short-term and on-going changes in demand and supply.
4.3.4.1.2. Production Planning
This is based on the tactical and operational plans. Production is mainly driven by the supply
of raw milk, which, in Pakistan, remains high in winter (December, January, and February)
and low in summer because of scorching weather. However, summer proffers eminently
high demand for milk products compared with winter when the demand for milk products
remains relatively low. Planning of critical resources and raw materials tracks the same
curve.
4.3.4.1.3. Raw Material Assessment
Based on the supply and demand planning, the procurement team collaborates with the
company’s suppliers. For example, apart from the raw milk supply, the packaging material is
a critical supply. Therefore, FO2 shares long-term and operational plans with its packaging
suppliers, which allows them to plan, develop and commit production capacity accordingly.
Inventory strategy – because of the high degree of uncertainty, FO2 maintains buffer
stock of all of its critical supplies and finished products. The only exception is raw
milk, which must be processed within few hours. FO2 requires its downstream SC
partners, such as distributors and retailers, to maintain a certain level of buffer stock.
This is centrally coordinated by FO2’s planning department.
4.3.4.2. Sourcing
4.3.4.2.1. Obtain/Multiple Sourcing
Most raw materials are sourced from multiple suppliers. For example, for dairy ingredients,
the company has a network of multiple suppliers internationally. Apart from internal
127
contingency planning, the company also requires its suppliers to incorporate contingency
planning into their operations.
4.3.4.2.2. Receive
All inbound and outbound logistics services are outsourced. The company has a key concern
about unplanned strikes and lockdowns that threaten its incoming and outgoing shipments.
For imported dairy ingredients, the primary transport method from the port to the factory is
by road, However, in case of strikes, the airfreight option is in the company’s contingency
planning.
4.3.4.2.3. Hold, Inspect and Issue Material
Raw milk is a critical input for FO2. The company has multiple levels of quality checks to
ensure the required standard is met.
4.3.4.2.4. Source Infrastructure
FO2’s sourcing infrastructure includes:
Supplier selection and audit – the farmer community is the most fragile and
sensitive part of FO2’s SC, because farming practices remain at a marginal level in
Pakistan. To cater this problem, the company selects its farmers based on their
ability to maintain good farming practices and deliver high-quality milk. In addition to
this, FO2’s field team regularly conducts audits to ensure implementation of the
expected farming practices.
Supplier development programmes – from its inception, FO2 has initiated various
programmes to develop farming practices in the country. For example, onsite and
offsite training programmes are regular features to develop and promote such
practices. FO2 runs these training programmes free of cost, especially for its farming
community. In addition, the company provides financial assistance to its farming
community, such as loan programmes and advance payments.
Continuous feedback loop – continuous feedback between FO2 and its farming
community allows the farmers to discuss and address any outstanding issues at the
farm.

128
“Actually, the milking process is all looked after by the company's staff.
[…..] The [company’s staff] comes like 2 or 3 times a week to see if all
things are working fine. [….] Our landlord meets with the Regional
Manager (RM) once in two or three weeks to discuss any issues at the
farms.” (FO2-S1)
Risk analysis and contingency plans – the procurement team conducts risk planning
and analysis exercises at a regular interval. For example, risks, such as floods, severe
weather and disease outbreak, have been identified through these exercises, which
include collaboration among various teams and departments. This enables relevant
departments and teams to develop contingency plans that provide actions and
strategies which need to be implemented in a disruption. Flood and disease
contingency plans are examples of such contingency plans.
4.3.4.3. Make/Manufacture
4.3.4.3.1. Production Execution and Strategy
FO2 has two manufacturing strategies for processing dairy products.
Make-to-stock – predominantly, FO2 uses a “make-to-stock” strategy. The raw milk
is processed immediately, either into the finished products or in powder form. The
company uses “make-to-stock” strategy because of the high demand for dairy
products, all the processed milk passes through the SC quickly. Notably, the SC
operations during summer are relatively lean because supply is low compared with
the demand. Therefore, the SC becomes lean with a low inventory level across all the
layers of the SC.
Postponement strategy – in contrast, during the flush winter period, the milk supply
is high compared with the demand. The company uses a postponement strategy,
where excess supply is processed into powder to increase the shelf life. The powder
is transformed into a liquid during the lean season. This strategy helps the company
to balance the issue of excess supply in the flush season and high demand in the lean
season.

129
4.3.4.3.2. Request and Receipt of Material
FO2’s operational plan provides daily and weekly requirements for all raw materials. Based
on the requirements, all non-dairy and dairy raw materials are released from the warehouse
to pass through testing like the raw milk before processing.
4.3.4.3.3. Manufacturing
The Company uses a UHT milk processing procedure. Table 4.2 compares UHT and
pasteurised milk processing. The differences include:
UHT milk is heated to 138° C during processing compared with 63-74° C for
pasteurised milk.
The application of the high temperature kills all bacteria, whereas only harmful
bacteria are killed in the case of pasteurised milk.
Pasteurised milk survives only 10-21 days, whereas UHT milk remains safe much
longer – approximately 3 to 6 months. The shelf life of UHT milk depends on
processing and environmental factors.
Pasteurised milk requires refrigerated storage and transport, whereas UHT milk
requires only room temperature.
In Pakistan, UHT milk represents most milk processing, with a few companies
offering pasteurised milk. Whereas, in New Zealand, pasteurised milk dominates milk
processing.
Table 4.2 – A comparison of pasteurised and UHT milk
Factors Pasteurised Milk UHT Milk
Temperature 63-74° C 138° C
Treatment Harmful bacteria only Kills all bacteria
Shelf-life 10-21 days 3-6 months
Packaging Traditional cartons Shelf-safe cartons
Storage Cold storage Room temperature
For the postponement operations, processing involves an extra step of converting the raw
milk into a powder then during the lean season processing it back to liquid milk by adding
liquid. Besides the in-house powder processing, the company also imports powdered milk
from various international suppliers to help meet the demand during the lean season.
130
4.3.4.3.4. Testing
Testing the finished products ensures the quality standards are met. For all production
batches, samples are kept for any future requirements and tests.
4.3.4.3.5. Packaging
Packaging of UHT milk is a critical component in ensuring long shelf-life. The packaging
materials are procured from qualified suppliers. Like the other raw materials, the packaging
materials pass through testing and inspection.
4.3.4.3.6. Infrastructure and Capacity Planning
The company has multiple production facilities. Therefore, in the case if any disruption at
one plant, a second production site can be used to fill the gap. Recently, FO2 has increased
its overall milk processing capacity, which has allowed the company to capture the
increasing demand for UHT milk in Pakistan.
4.3.4.4. Delivery
4.3.4.4.1. Warehouse and Transport Management
Transport from the factory to the company’s distributors which is outsourced to a 3PL
provider, is managed by FO2. Transport from the distributors to wholesalers or retailers is
controlled by the distributors. For few large customers (LMTs & IMTs), because of the
significant size of the orders, the company directly delivers through its 3PL provider to those
customers.
4.3.4.4.2. Distribution Network
This network is the most significant part of the company’s downstream SC. The company
maintains and protects its distribution network by enforcing various practices. For example,
the company has a strict requirement for fleet maintenance to ensure continuity; surprise
audits are the regular feature. Additionally, every distributor is required to maintain extra
delivery vehicles for emergencies. Similarly, the inventory strategy is centrally controlled by
FO2; the company’s dedicated staff at every distribution centre provide essential support to
maintain an optimal inventory level.

131
“The level of inventory at the distribution centre is guided by us, so we advise
them based on the sales and demand data, we advise them to hold a certain
amount of inventory with some extra stock so that they could handle any
[unexpected] delays.” (FO2-P3)
4.3.4.4.3. Customer Demand
FO2 focuses on demand from the end-customers, rather than on distributor demand. The
company has standardised IT systems at every distributor; these monitor the end-retailer
demand. These data are regularly shared with the head office, which provides essential
input for demand forecasting and inventory related decisions.
“We ensure that we do the forecasting based on the point of sales data so that
we do not end up supplying excessive inventory to one distributor as compared
to other. [...] So, we have a common system at every distributor so that we can
get the actual point of sales data.” (FO2-P3)
4.3.4.5. Return
4.3.4.5.1. Return Policy
As dairy products often present a health and safety risk in any quality issue, FO2 has a
formal return policy to ensure the safety of its customers.
4.3.4.5.2. Recall Management
This process deals with all types of issue concerned with the health and safety of
consumers. These issues may arise because of internal quality issues or from the company’s
suppliers. To receive complaints from customers, FO2 has a dedicated toll-free number to
address any issues. If determined as a real food safety issue, the issue is directly passed to
FO2’s quality team.
The company has invested enormous time and resources to run mock or simulated exercises
to test the robustness of its product traceability operations. Additionally, the informants
also emphasised that the company has acquired various systems, such as ERP and other IT
systems, to facilitate and track affected products in the case of a real recall.

132
Table 4.3 presents the key strategies (discussed above) in broad categories and
subcategories. Later, in Chapters 5 and 6, these operational and SC strategies will be further
explored in the context of the selected SC disruptions.
Table 4.3 – Key operational/SC strategies (FO2)
Broad Categories Subcategories
Diverse product mix Multiple product lines (UHT milk, UHT skim milk, tea whitener, cream, clarified butter, and other by-products), diverse business portfolio
Organisational structure
Hierarchical structure
Supportive culture Cross-departmental teams, employee training programmes
Buyer base Multiple buyers/channels, diverse geographic location
Collaboration with NGOs and government
Dairy training programmes
Risk management plan Contingency planning (e.g., flood and disease contingency plan)
Risk preparedness Simulation exercises, risk awareness exercises
Planning and forecasting
Centralised planning, multiple level planning and forecasting (long-term, tactical and operational), inventory planning (buffer stock)
Sourcing strategy Multiple sourcing (most raw materials), multiple geographic locations, risk planning with suppliers, backup transport modes, multiple level raw material testing, supplier audit and compliance programme, supplier development programmes, collaborative problem solving
Production strategy Alternative production process, postponement, raw material testing
Delivery Risk planning with distributors, multiple distribution channels, redundant resources, centralised planning (inventory control and other operations), synchronized it system and procedures
Return policy Recall management policy, product traceability systems and procedures, simulative/mock exercises, updated IT systems and procedures
4.3.5. Summary – FO2’s SC
The above discussion described FO2’s operation and its generic SC strategies that guard the
company against an uncertain situation. This discussion helps the understanding of the
various actions applied by FO2 with its SC partners to manage the SC disruptions.
Chapter Summary
In the context of a SC disruption, it is essential to understand the ‘business-as-usual’
practices that an organisation or SC follows. The pre-existing context and strategies
contribute to how an organisation or SC handles a disruption. It is also essential to
understand the SC structure before a disruption, which will help in exploring any structural
changes during and after a disruption.
133
This chapter presented each focal organisation’s descriptive information, such as their
operations, and highlighted its upstream and downstream SC partners. Both FO1 and FO2
operate in multiple layer SCs, involving SC partners from both domestic and international
markets. In addition to understanding SC structure, various operational and SC strategies
were outlined in this chapter. Both FO1 and FO2 incorporate various strategies, such as
multiple sourcing or collaborative forecasting, to eliminate or adequately manage a SC
disruption. This chapter outlined various operational and SC strategies across various
processes and operations using the SCOR model.
Understanding all of the ‘business-as-usual’ structures and operations will help in exploring
the various actions and decisions taken in dealing with a disruption, and essentially provide
an understanding of how some pre-existing strategies helped or hindered during a
disruption. This is explored in Chapters 5, 6 and 7.

134
Chapter 5. First Level Analysis: Identifying SC Resilience Elements
Introduction
This chapter presents an analysis of all six SC disruptions; four for FO1 in New Zealand, and
two for FO2 in Pakistan. The purpose of this chapter is to explore the impact of each SC
disruption on the respective organisations and to determine the strategies used to deal with
the disruptions. From this analysis, a generic list of elements that help to build a resilient SC
has been identified.
This chapter is in two main sections. The first section includes a discussion of all six SC
disruptions, including descriptive and contextual information. The second section includes a
discussion of the key elements of SC resilience as identified from all six disruptions. This
section includes an analysis of each SC resilience element with a discussion from all six SC
disruptions to avoid repetition. However, during data analysis, each SC disruption was
analysed separately. A thorough discussion of each SC disruption, including detailed
contextual information and in-depth analysis of key lessons and findings from each
disruption, can be found in the appendices (Appendix C to H).
The selected SC disruptions were analysed in chronological order, which provided an
opportunity to explore each disruption separately and to understand emerging elements,
both similar and different, across the various disruptions. The result was a refined list of SC
resilience elements. The discussion in this chapter leads to the second level analysis in
Chapters 6 and 7.
This chapter aims to explore the following research question:
RQ1: What are the elements that help build a resilient supply chain in the context of a
dairy supply chain?
Section A – Contextual Information on Selected SC Disruptions
This section presents brief contextual information on each SC disruption and its effects on
the respective focal organisation and its SC. In-depth contextual information including
impact and response from the FO1 and FO2 SCs to the respective disruptions is included in
Appendix C to H.

135
5.2.1. Disruption 1 – The Dicyandiamide (DCD) Issue
Dicyandiamide (DCD), known also as 2-cyanoguanadine, is commercially used in fertilisers
such as eco-n and DCn. These fertilisers were first introduced in 2004 to offer a range of
benefits such as environmental protection and rapid pasture growth. Before its introduction
in 2003, Landcare Research16 performed product testing to ensure that these new products
did not present any food safety concerns. Since its introduction, a small percentage of New
Zealand dairy farmers have been using these products on their farms, mostly twice a year –
in spring and autumn.
Until September 2012, the use of these fertilisers did not create any issues for any dairy
products. However, in September 2012, a routine test by Fonterra revealed minute traces of
DCD residues in some finished dairy products. It is uncertain what led to the detection of
DCD residues in this test compared with previous tests. A review of news reports revealed
that in 2011-12 “US Food and Drug Administration” (FDA) introduced a new testing method
for investigating various foreign matter in the dairy products, including DCD. This test
introduced more detailed testing for foreign matter, such as DCD, than the previous testing
method (NZHerald, 2013). This is potentially the reason for tracing DCD residues using the
new method.
After conducting a detailed investigation of the DCD issue, Fonterra informed the Ministry
of Primary Industry (MPI) about it in November 2012. Immediately, MPI formed a working
group including the representation from MPI, Fonterra, fertiliser companies (Ravensdown
and Ballance) and Dairy Companies Association of New Zealand (DCANZ17) (FarmersWeekly,
2013a). This working group recommended withdrawing the fertiliser from the market as a
precautionary measure until further investigation. On 24 January 2013, both fertiliser
companies voluntarily withdrew the DCD fertilisers (eco-n and DCn) from the market
(FarmersWeekly, 2013a). This withdrawal was supported and followed by MPI’s and
Fonterra’s press releases on the same day (Fonterra, 2013a; MPI, 2013a). According to FO1’s
informant, FO1 was informed regarding the issue at the same time as it unfolded in the
media on 24 January 2013.
16 Landcare Research’s core purpose is to drive innovation in the management of terrestrial biodiversity and land resources. http://www.landcareresearch.co.nz/about (information retrieved on 28-06-16) 17 DCANZ constitutes of an executive body including four representatives, whereas members of DCANZ includes representations from all the dairy companies.
136
These multiple press releases resulted in an aggressive response from the electronic media,
both local and international, and regulatory authorities all around the world. Although the
press releases explicitly mentioned that this issue did not raise any food safety concern, the
reaction from the media and various international markets was very aggressive; they
labelled it as a food safety issue. For example, countries like China closed their borders to all
incoming New Zealand dairy products and many other customers demanded additional
testing results for all dairy imports from New Zealand. From FO1’s perspective, the incident
impacted various SC operations in the following ways (and it can be assumed that it
impacted the other dairy players in the similar way as it was an industry-wide issue):
The interrupted flow of finished products: This incident disrupted the flow of FO1’s
finished products to its buyers in international markets, such as China, for a limited
period.
In-transit inventory challenges: Most shipments destined for specific markets were
put on hold at the borders, which created in-transit inventory challenges.
Additional transportation expenses (such as demurrage charges): All the shipments
put on hold at the international borders resulted in substantial demurrage charges
for FO1.
Additional testing and extra cost: To resolve this issue, FO1 had to perform extra
testing of various products, which resulted in extra costs for the company.
Rerouting of the finished products: FO1 had to reroute various products to other
markets.
The shift in the product mix: For a limited period, various international buyers
stopped buying value-added products, which meant a change in the product mix for
FO1.
Impacted the raw material suppliers: For value-added products, the company had to
cancel the order of various raw materials and then resume later that year (2013).
Based on this aggressive response from the international markets, FO1 implemented its risk
management plan (also referred as incident management plan). This included activation of
the crisis management team and, most fundamentally, the establishment of connections
with key stakeholders. The major manifesto of the crisis management team was to gather
relevant information especially regarding the response from the various international
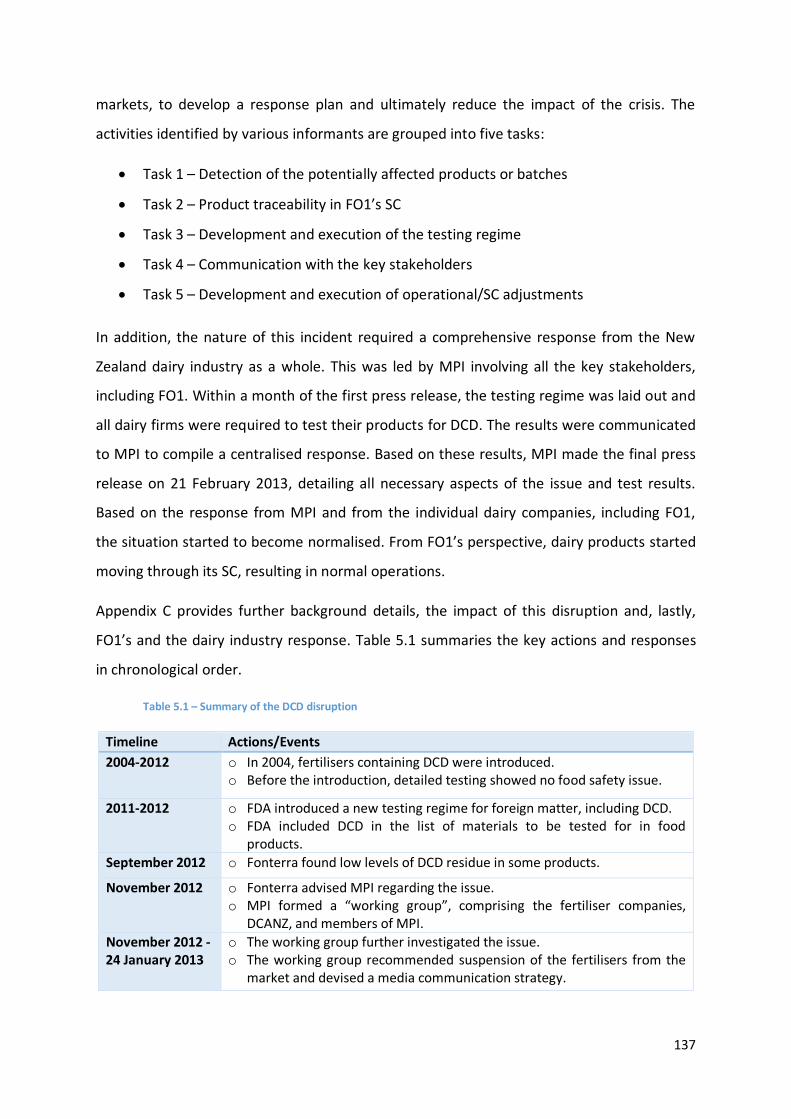
137
markets, to develop a response plan and ultimately reduce the impact of the crisis. The
activities identified by various informants are grouped into five tasks:
Task 1 – Detection of the potentially affected products or batches
Task 2 – Product traceability in FO1’s SC
Task 3 – Development and execution of the testing regime
Task 4 – Communication with the key stakeholders
Task 5 – Development and execution of operational/SC adjustments
In addition, the nature of this incident required a comprehensive response from the New
Zealand dairy industry as a whole. This was led by MPI involving all the key stakeholders,
including FO1. Within a month of the first press release, the testing regime was laid out and
all dairy firms were required to test their products for DCD. The results were communicated
to MPI to compile a centralised response. Based on these results, MPI made the final press
release on 21 February 2013, detailing all necessary aspects of the issue and test results.
Based on the response from MPI and from the individual dairy companies, including FO1,
the situation started to become normalised. From FO1’s perspective, dairy products started
moving through its SC, resulting in normal operations.
Appendix C provides further background details, the impact of this disruption and, lastly,
FO1’s and the dairy industry response. Table 5.1 summaries the key actions and responses
in chronological order.
Table 5.1 – Summary of the DCD disruption
Timeline Actions/Events
2004-2012 o In 2004, fertilisers containing DCD were introduced. o Before the introduction, detailed testing showed no food safety issue.
2011-2012 o FDA introduced a new testing regime for foreign matter, including DCD. o FDA included DCD in the list of materials to be tested for in food
products.
September 2012 o Fonterra found low levels of DCD residue in some products.
November 2012 o Fonterra advised MPI regarding the issue. o MPI formed a “working group”, comprising the fertiliser companies,
DCANZ, and members of MPI.
November 2012 - 24 January 2013
o The working group further investigated the issue. o The working group recommended suspension of the fertilisers from the
market and devised a media communication strategy.
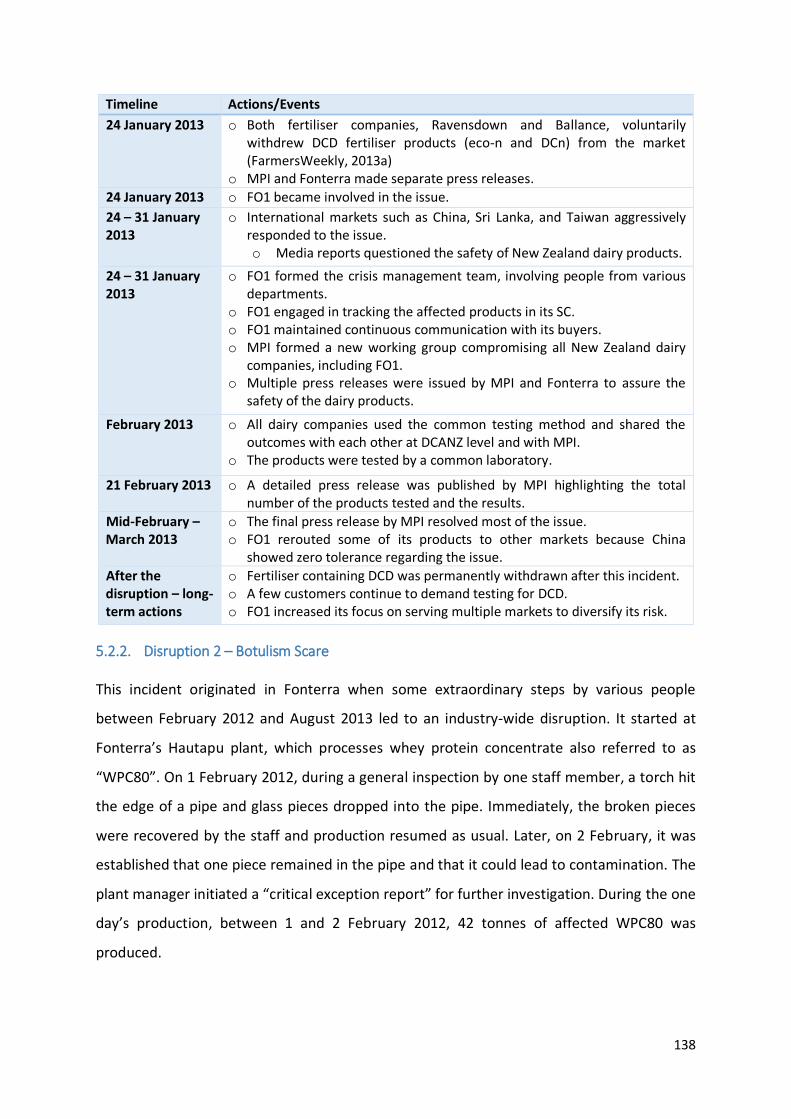
138
Timeline Actions/Events
24 January 2013 o Both fertiliser companies, Ravensdown and Ballance, voluntarily withdrew DCD fertiliser products (eco-n and DCn) from the market (FarmersWeekly, 2013a)
o MPI and Fonterra made separate press releases.
24 January 2013 o FO1 became involved in the issue.
24 – 31 January 2013
o International markets such as China, Sri Lanka, and Taiwan aggressively responded to the issue. o Media reports questioned the safety of New Zealand dairy products.
24 – 31 January 2013
o FO1 formed the crisis management team, involving people from various departments.
o FO1 engaged in tracking the affected products in its SC. o FO1 maintained continuous communication with its buyers. o MPI formed a new working group compromising all New Zealand dairy
companies, including FO1. o Multiple press releases were issued by MPI and Fonterra to assure the
safety of the dairy products.
February 2013 o All dairy companies used the common testing method and shared the outcomes with each other at DCANZ level and with MPI.
o The products were tested by a common laboratory.
21 February 2013 o A detailed press release was published by MPI highlighting the total number of the products tested and the results.
Mid-February – March 2013
o The final press release by MPI resolved most of the issue. o FO1 rerouted some of its products to other markets because China
showed zero tolerance regarding the issue.
After the disruption – long-term actions
o Fertiliser containing DCD was permanently withdrawn after this incident. o A few customers continue to demand testing for DCD. o FO1 increased its focus on serving multiple markets to diversify its risk.
5.2.2. Disruption 2 – Botulism Scare
This incident originated in Fonterra when some extraordinary steps by various people
between February 2012 and August 2013 led to an industry-wide disruption. It started at
Fonterra’s Hautapu plant, which processes whey protein concentrate also referred to as
“WPC80”. On 1 February 2012, during a general inspection by one staff member, a torch hit
the edge of a pipe and glass pieces dropped into the pipe. Immediately, the broken pieces
were recovered by the staff and production resumed as usual. Later, on 2 February, it was
established that one piece remained in the pipe and that it could lead to contamination. The
plant manager initiated a “critical exception report” for further investigation. During the one
day’s production, between 1 and 2 February 2012, 42 tonnes of affected WPC80 was
produced.
139
From February 2012 to June 2013, various teams within Fonterra and from other relevant
organisations (such as Fonterra Research & Development Centre (FRDC), AsureQuality,
AgResearch, and Danone) were involved at various stages to deal with the affected WPC80.
During this period, multiple decisions and actions were taken to avoid any food safety issue.
In June 2013, the company launched a detailed investigation of the issue. This involved an
investigation team, the review team, to review the incident. The team decided to examine
the WPC80 contamination at Haitapu plant in depth and the actions taken by the relevant
departments. After an initial investigation, the team recommended further product testing.
On 21 June, a manager authorised testing for any possible toxin, without realising that this
could mean authorisation for Clostridium botulinum testing.
The further testing between 29 and 31 July 2013 revealed a “Likely possibility of C.
botulinum”. AgResearch notified Fonterra about the results, which led to the formation of a
“Crisis Management Team”. The team organised urgent meetings on 31 July and 1 August to
determine the scale of the problem and decided to communicate the problem to affected
buyers and to MPI. Within 24 hours, MPI decided to make a public announcement regarding
the issue. With all stakeholders informed, MPI made the first press release at midday
Saturday 3 August 2013 titled as “Food safety issue advised by Fonterra” (MPI, 2013d).
This press release led to serious concerns among customers around the world. Like the fear
among the public and international regulators with the DCD issue, this issue initiated series
of tough questions and speculations from both local and international media. Although the
epicentre of this disruption was Fonterra, just like an earthquake, ripple effect also hit the
other dairy companies and initiated an international trade nightmare for the New Zealand
dairy industry (DIA, 2014).
From FO1’s perspective, this issue led to various SC and operational challenges for the
company, such as:
The interrupted flow of finished products in the downstream SC: Like the previous
disruption, it disrupted the flow of finished products to FO1’s downstream SC for a
limited period.
140
Additional testing (for C. botulinum): Though the issue was not about FO1’s
products, the company had to engage in additional testing. This was an extra cost for
FO1.
In-transit inventory challenges: All shipments bound for specific markets, such as
China, were put on hold, which resulted in extra demurrage charges for a short
period.
Reputational damage (to the New Zealand dairy industry): This disruption beginning
just six months after the DCD issue (D1) presented a compound effect to the New
Zealand dairy industry.
Change in the product mix: After D1 and D2, some buyers from certain countries
claimed a reduction in demand for various value-added products, which resulted in
changes in FO1’s product mix.
Like the DCD issue (D1), in reply to the aggressive response from the international markets,
FO1 evoked its risk management plan. This included activation of the crisis management
team and, most fundamentally, the establishment of collaboration with relevant
stakeholders (including MPI and other dairy players). The actions opted for by FO1 in
collaboration with various stakeholders are grouped into six tasks:
Task 1: Understanding the scale and impact of the issue
Task 2: Product traceability in the SC
Task 3: Development and execution of the testing regime
Task 4: Communication with the key customers
Task 5: Communication with the key stakeholders
Task 6: Development and execution of operational/SC adjustments
From 3 to 28 August 2013, the issue remained in the media spotlight and it became an
industry-wide issue. Within a week after the first press release, MPI sent samples of the
affected WPC80 to an overseas laboratory in the US for further testing. MPI received initial
results that provided negative results for C. botulinum. As the results were preliminary, MPI
waited for confirmatory results. Upon confirmation, MPI gave a press release on 28 August
and declared the whole incident a false-positive. After this press release, the issue started to
dilute in the media.
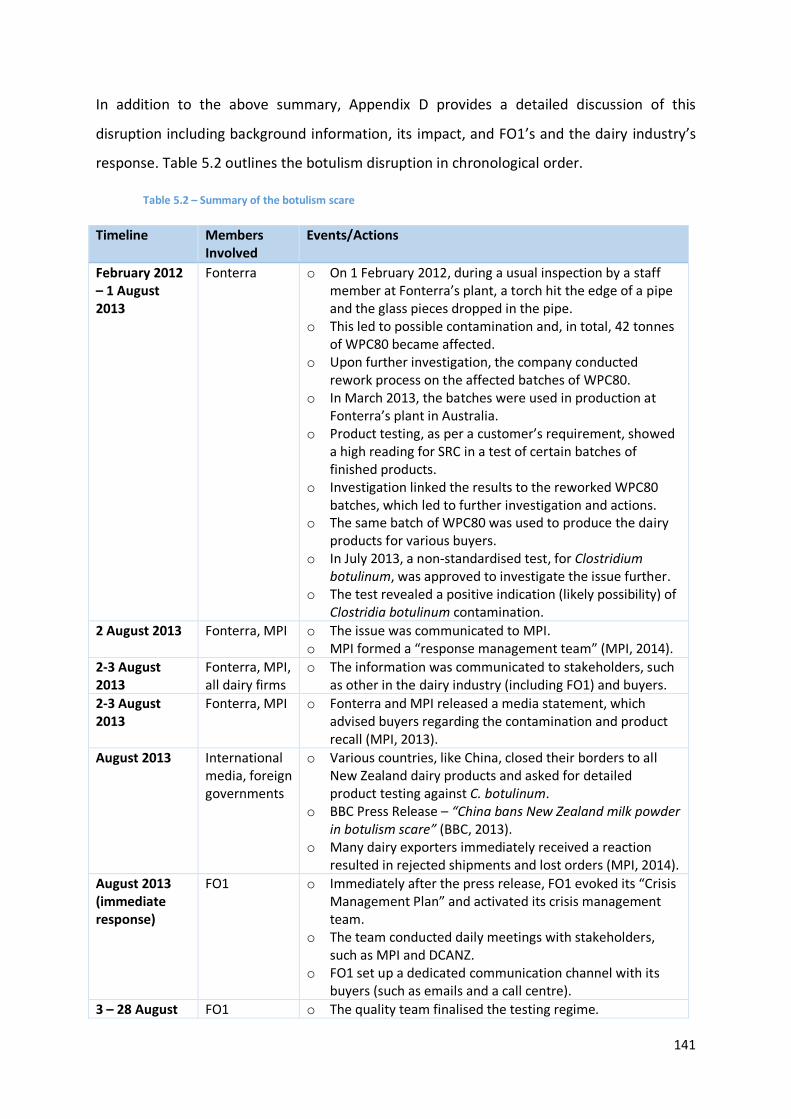
141
In addition to the above summary, Appendix D provides a detailed discussion of this
disruption including background information, its impact, and FO1’s and the dairy industry’s
response. Table 5.2 outlines the botulism disruption in chronological order.
Table 5.2 – Summary of the botulism scare
Timeline Members Involved
Events/Actions
February 2012 – 1 August 2013
Fonterra o On 1 February 2012, during a usual inspection by a staff member at Fonterra’s plant, a torch hit the edge of a pipe and the glass pieces dropped in the pipe.
o This led to possible contamination and, in total, 42 tonnes of WPC80 became affected.
o Upon further investigation, the company conducted rework process on the affected batches of WPC80.
o In March 2013, the batches were used in production at Fonterra’s plant in Australia.
o Product testing, as per a customer’s requirement, showed a high reading for SRC in a test of certain batches of finished products.
o Investigation linked the results to the reworked WPC80 batches, which led to further investigation and actions.
o The same batch of WPC80 was used to produce the dairy products for various buyers.
o In July 2013, a non-standardised test, for Clostridium botulinum, was approved to investigate the issue further.
o The test revealed a positive indication (likely possibility) of Clostridia botulinum contamination.
2 August 2013 Fonterra, MPI o The issue was communicated to MPI. o MPI formed a “response management team” (MPI, 2014).
2-3 August 2013
Fonterra, MPI, all dairy firms
o The information was communicated to stakeholders, such as other in the dairy industry (including FO1) and buyers.
2-3 August 2013
Fonterra, MPI o Fonterra and MPI released a media statement, which advised buyers regarding the contamination and product recall (MPI, 2013).
August 2013 International media, foreign governments
o Various countries, like China, closed their borders to all New Zealand dairy products and asked for detailed product testing against C. botulinum.
o BBC Press Release – “China bans New Zealand milk powder in botulism scare” (BBC, 2013).
o Many dairy exporters immediately received a reaction resulted in rejected shipments and lost orders (MPI, 2014).
August 2013 (immediate response)
FO1 o Immediately after the press release, FO1 evoked its “Crisis Management Plan” and activated its crisis management team.
o The team conducted daily meetings with stakeholders, such as MPI and DCANZ.
o FO1 set up a dedicated communication channel with its buyers (such as emails and a call centre).
3 – 28 August FO1 o The quality team finalised the testing regime.
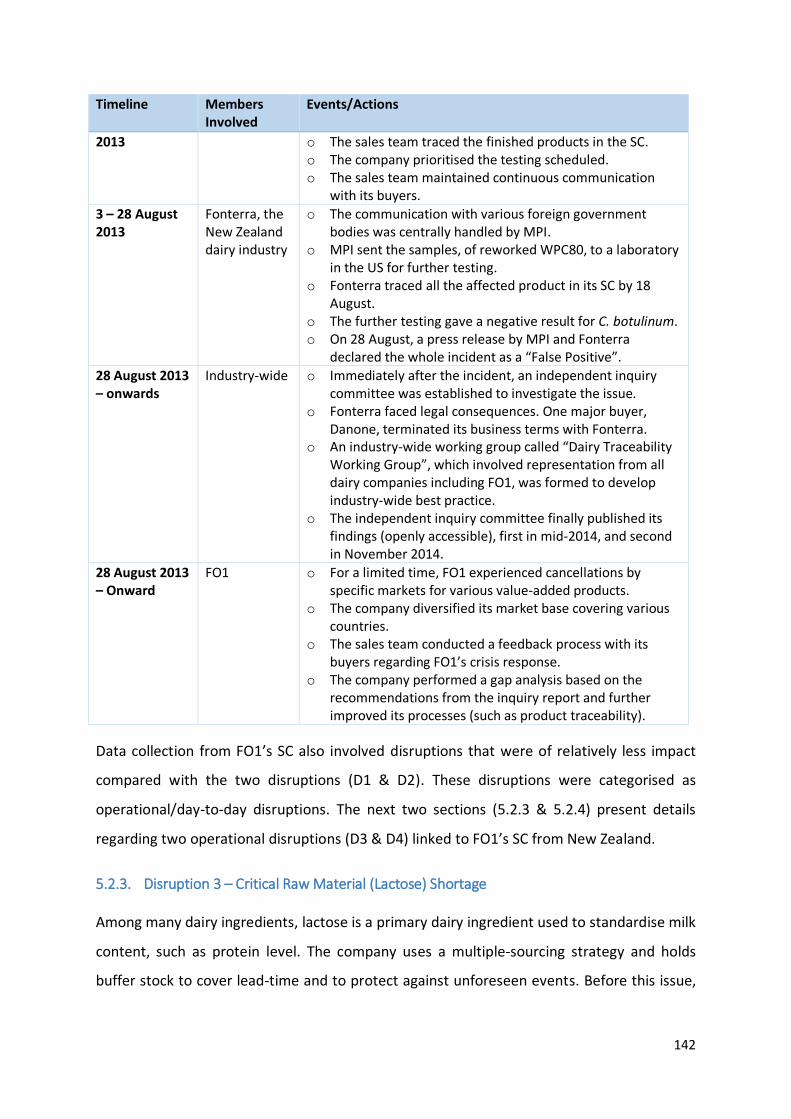
142
Timeline Members Involved
Events/Actions
2013 o The sales team traced the finished products in the SC. o The company prioritised the testing scheduled. o The sales team maintained continuous communication
with its buyers.
3 – 28 August 2013
Fonterra, the New Zealand dairy industry
o The communication with various foreign government bodies was centrally handled by MPI.
o MPI sent the samples, of reworked WPC80, to a laboratory in the US for further testing.
o Fonterra traced all the affected product in its SC by 18 August.
o The further testing gave a negative result for C. botulinum. o On 28 August, a press release by MPI and Fonterra
declared the whole incident as a “False Positive”.
28 August 2013 – onwards
Industry-wide o Immediately after the incident, an independent inquiry committee was established to investigate the issue.
o Fonterra faced legal consequences. One major buyer, Danone, terminated its business terms with Fonterra.
o An industry-wide working group called “Dairy Traceability Working Group”, which involved representation from all dairy companies including FO1, was formed to develop industry-wide best practice.
o The independent inquiry committee finally published its findings (openly accessible), first in mid-2014, and second in November 2014.
28 August 2013 – Onward
FO1 o For a limited time, FO1 experienced cancellations by specific markets for various value-added products.
o The company diversified its market base covering various countries.
o The sales team conducted a feedback process with its buyers regarding FO1’s crisis response.
o The company performed a gap analysis based on the recommendations from the inquiry report and further improved its processes (such as product traceability).
Data collection from FO1’s SC also involved disruptions that were of relatively less impact
compared with the two disruptions (D1 & D2). These disruptions were categorised as
operational/day-to-day disruptions. The next two sections (5.2.3 & 5.2.4) present details
regarding two operational disruptions (D3 & D4) linked to FO1’s SC from New Zealand.
5.2.3. Disruption 3 – Critical Raw Material (Lactose) Shortage
Among many dairy ingredients, lactose is a primary dairy ingredient used to standardise milk
content, such as protein level. The company uses a multiple-sourcing strategy and holds
buffer stock to cover lead-time and to protect against unforeseen events. Before this issue,

143
the company had two primary sources of lactose, one from the US, the primary source, and
the rest, some backup options from European suppliers.
Until 2014, the company had not faced any issues in sourcing lactose from its US suppliers.
The first sign of possible disruption began in late November 2014, when the procurement
team observed delays in the lactose shipments from the US. These delays originated from
on-going negotiations with port workers for a new contract at the US West Port. The
negotiations started in mid-May 2014. The shortage got worse in mid-January and February
2015, when shipment delays stretched up to 5 to 6 weeks, which indicated a possible stock
out for FO1.
Finally, in mid-February 2015, the US port operations were temporarily shut down for a
couple of days; all inbound and outbound shipments were halted at the port, which
confirmed FO1’s fear of a lactose stock-out. In response to this disruption, FO1 took various
actions which successfully mitigated the issue. These actions are grouped into three tasks,
based on the response timeline:
FO1’s response before the US port lockdown
FO1’s response after the US port lockdown
FO1’s response once US port became fully-functional
Full descriptive information regarding this disruption is provided in Appendix E. Table 5.3
presents the key events of this disruption in chronological order.
Table 5.3 – Summary of the D3 (lactose shortage)
Timeline Events/Actions
Till December 2014
o FO1 predominantly sourced the lactose (a major dairy raw material) from two sources from the same region in the US.
o In 2014, based on the risk analysis of critical raw materials, the procurement team initiated a process of adding additional suppliers from Europe to diversify the risk associated with procuring from suppliers within same country/region.
o In parallel, the company reviewed its inventory strategy and revised its buffer stock strategy for lactose from four weeks to six weeks.
o This decision was based on optimising capital spending and warehouse capacity.
November – December 2014
o The procurement team observed delays in shipments of lactose coming from its US supplier.
o The delays were associated with on-going negotiations between the US port officials and the US west coast port workers’ union.
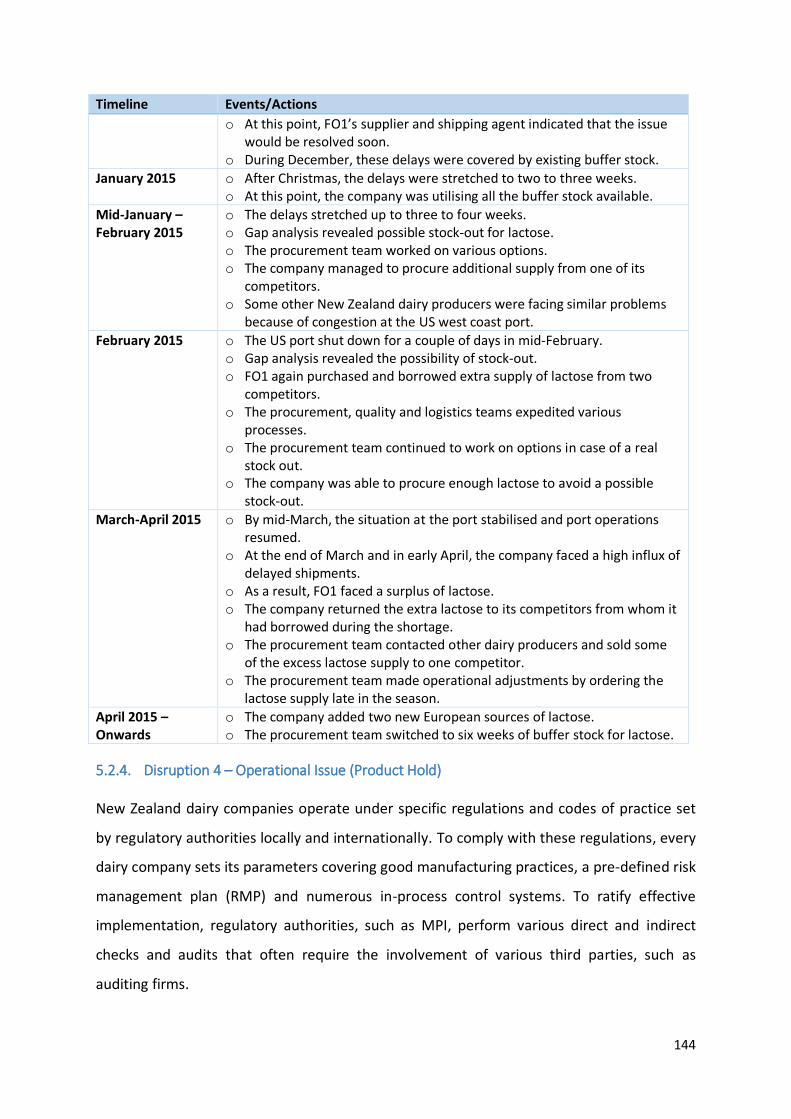
144
Timeline Events/Actions
o At this point, FO1’s supplier and shipping agent indicated that the issue would be resolved soon.
o During December, these delays were covered by existing buffer stock.
January 2015 o After Christmas, the delays were stretched to two to three weeks. o At this point, the company was utilising all the buffer stock available.
Mid-January – February 2015
o The delays stretched up to three to four weeks. o Gap analysis revealed possible stock-out for lactose. o The procurement team worked on various options. o The company managed to procure additional supply from one of its
competitors. o Some other New Zealand dairy producers were facing similar problems
because of congestion at the US west coast port.
February 2015 o The US port shut down for a couple of days in mid-February. o Gap analysis revealed the possibility of stock-out. o FO1 again purchased and borrowed extra supply of lactose from two
competitors. o The procurement, quality and logistics teams expedited various
processes. o The procurement team continued to work on options in case of a real
stock out. o The company was able to procure enough lactose to avoid a possible
stock-out.
March-April 2015 o By mid-March, the situation at the port stabilised and port operations resumed.
o At the end of March and in early April, the company faced a high influx of delayed shipments.
o As a result, FO1 faced a surplus of lactose. o The company returned the extra lactose to its competitors from whom it
had borrowed during the shortage. o The procurement team contacted other dairy producers and sold some
of the excess lactose supply to one competitor. o The procurement team made operational adjustments by ordering the
lactose supply late in the season.
April 2015 – Onwards
o The company added two new European sources of lactose. o The procurement team switched to six weeks of buffer stock for lactose.
5.2.4. Disruption 4 – Operational Issue (Product Hold)
New Zealand dairy companies operate under specific regulations and codes of practice set
by regulatory authorities locally and internationally. To comply with these regulations, every
dairy company sets its parameters covering good manufacturing practices, a pre-defined risk
management plan (RMP) and numerous in-process control systems. To ratify effective
implementation, regulatory authorities, such as MPI, perform various direct and indirect
checks and audits that often require the involvement of various third parties, such as
auditing firms.
145
FO1 has to comply with all these regulations. Sometimes, the review processes can result in
various regulatory requirements that could mean putting finished products on hold for
further investigation. In 2015, this happened to FO1 and it resulted in significant operational
challenges.
In the first quarter of 2015, a usual change of staff by a third-party service provider (an
auditing firm) brought a significant challenge to the understanding and endorsement of the
regulations, though FO1 had not changed any of its documentations, procedures or
processes. This resulted in a product hold for various finished products for extra
documentation. Initially, it was perceived as a one-off incident. Therefore, the situation was
primarily handled at the tactical level by relevant staff.
After June 2015, the situation changed significantly when the company realised that the
situation was an ongoing operational issue. This was 6 to 8 weeks after the first indication
that the issue had started to affect FO1’s SC operations. The on-going product hold and
extra documentation resulted in delays in meeting delivery deadlines. Initially anticipated as
an ordinary issue, the scenario started to affect delivery deadlines and create order backlogs
and unsatisfied buyers.
In response, the senior management initiated an integrated approach to resolve the issue.
This involved collaboration with the stakeholders and discussion with the industry (DCANZ).
The response can be divided into four steps:
Step 1: Operational/tactical level response
Step 2: Collaboration with competitors (DCANZ)
Step 3: Communication with the key buyers
Step 4: Process improvement
The issue was still alive at the conclusion of the data collection. However, it is believed that
these actions would have resolved the issue.
Appendix F provides in-depth information regarding this disruption. Table 5.4 outlines the
key events of the disruption in chronological order.
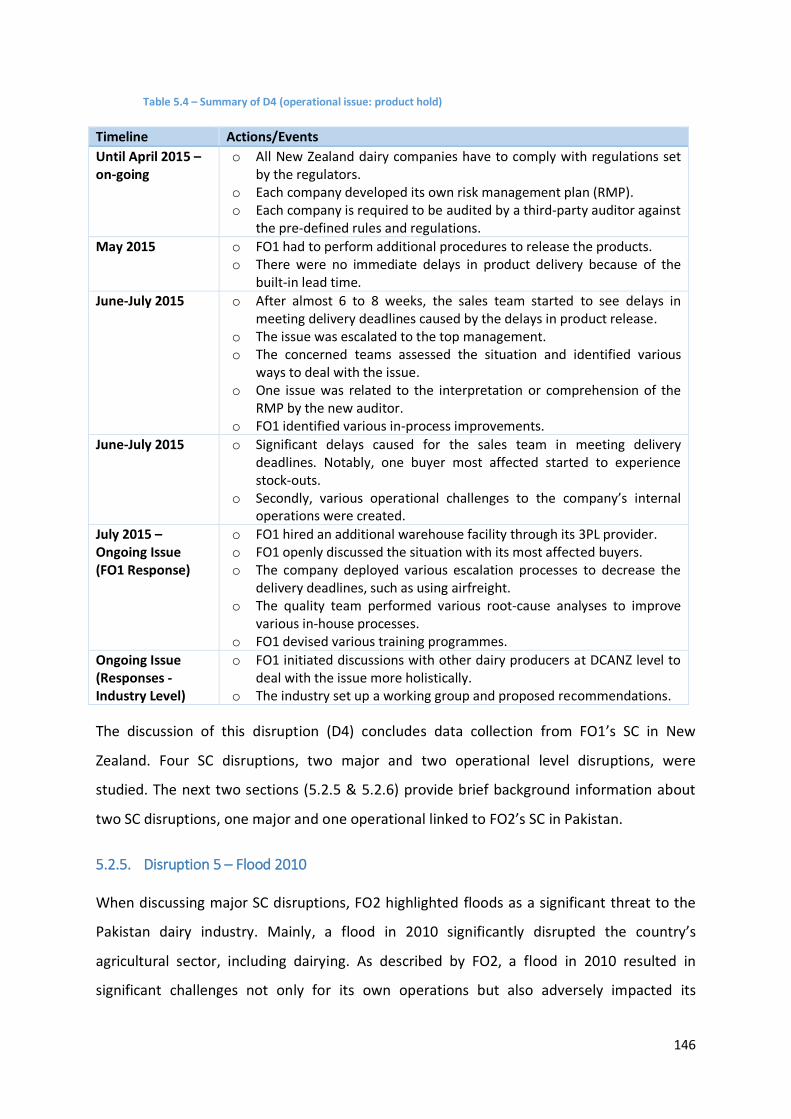
146
Table 5.4 – Summary of D4 (operational issue: product hold)
Timeline Actions/Events
Until April 2015 – on-going
o All New Zealand dairy companies have to comply with regulations set by the regulators.
o Each company developed its own risk management plan (RMP). o Each company is required to be audited by a third-party auditor against
the pre-defined rules and regulations.
May 2015 o FO1 had to perform additional procedures to release the products. o There were no immediate delays in product delivery because of the
built-in lead time.
June-July 2015 o After almost 6 to 8 weeks, the sales team started to see delays in meeting delivery deadlines caused by the delays in product release.
o The issue was escalated to the top management. o The concerned teams assessed the situation and identified various
ways to deal with the issue. o One issue was related to the interpretation or comprehension of the
RMP by the new auditor. o FO1 identified various in-process improvements.
June-July 2015 o Significant delays caused for the sales team in meeting delivery deadlines. Notably, one buyer most affected started to experience stock-outs.
o Secondly, various operational challenges to the company’s internal operations were created.
July 2015 – Ongoing Issue (FO1 Response)
o FO1 hired an additional warehouse facility through its 3PL provider. o FO1 openly discussed the situation with its most affected buyers. o The company deployed various escalation processes to decrease the
delivery deadlines, such as using airfreight. o The quality team performed various root-cause analyses to improve
various in-house processes. o FO1 devised various training programmes.
Ongoing Issue (Responses - Industry Level)
o FO1 initiated discussions with other dairy producers at DCANZ level to deal with the issue more holistically.
o The industry set up a working group and proposed recommendations.
The discussion of this disruption (D4) concludes data collection from FO1’s SC in New
Zealand. Four SC disruptions, two major and two operational level disruptions, were
studied. The next two sections (5.2.5 & 5.2.6) provide brief background information about
two SC disruptions, one major and one operational linked to FO2’s SC in Pakistan.
5.2.5. Disruption 5 – Flood 2010
When discussing major SC disruptions, FO2 highlighted floods as a significant threat to the
Pakistan dairy industry. Mainly, a flood in 2010 significantly disrupted the country’s
agricultural sector, including dairying. As described by FO2, a flood in 2010 resulted in
significant challenges not only for its own operations but also adversely impacted its

147
upstream and downstream SC partners. Therefore, 2010 flood was taken as a major SC
disruption for FO2.
As the scope of a flood spans beyond the boundaries of a single company, this discussion
begins with a generic description of floods in Pakistan and the actions initiated by the
government to deal with these kinds of disruption.
Until 2005 in Pakistan, disaster management was limited to immediate response and rescue
operations by the relevant authorities, such as the Police, Army or Rescue operations,
during a catastrophic event. After a massive earthquake in 2005, along with the global
influence of the “United Nations International Strategy for Disaster Reduction” (UNISDR),
the Pakistan Government finally took serious steps in 2006 to establish a National Disaster
Management Authority (NDMA) and National Disaster Management System Ordinance
(NDMO).
Until June 2010, NDMA with the help of Provincial Disaster Management Authorities
(PDMA), District Disaster Management Authorities (DDMA), NGOs and other United Nations
departments, initiated various activities in planning, mitigation and reduction of
catastrophic events, such as floods or earthquakes (NDMA, 2009). During the 2010 flood,
disaster management authorities were evolving and strengthening policies and planning to
combat nation-wide natural disruptions.
It is important to mention here that, before the 2010 flood, NDMA took various steps in
anticipation of severe weather conditions in the country. The first step involved a pre-
monsoon conference on 28 June 2010, in which the underlying aim was to collaborate with
all the stakeholders such as NDMA and other bodies to review preparatory measures for the
upcoming monsoon season (NDMA, 2010a). Then, on 20 July 2010, the Pakistan
Meteorological Department (PMD) issued the first official warning of excessive rain in
various parts of the country.
PMD again issued flood warnings on 27 and 28 July 2010 highlighting the high rainfall and
flooding in various districts around the country. NDMA furthered issued a flood advisory to
the relevant authorities and departments on 26 and 29 July 2010 to conduct necessary
actions. These flood advisories communicated a warning of a high level of flooding from 03

148
to 07 August in different parts of the country (NDMA, 2011). The relevant department in
FO2 got these flood advisories, which enabled FO2 to take various pre-emptive actions.
Following these advisories, the country experienced excessive rain and flooding in different
parts of the country. The flood seriously affected the country’s economy. The UN Secretary-
General termed the 2010 flood as a “Slow Evolving Tsunami” (NDMA, 2010a), which
resulted in country-wide devastation. Starting in the third week of July it lasted for almost
one and half months and spread its devastation in almost 80 districts of the 141 districts in
the country.
This enormous impact resulted in massive disruption to FO2’s operations because most of
FO2’s field operations were directly affected by the flood. The following points briefly
highlight the impact on FO2’s SC:
Upstream SC
o Disruption to transport operations: The flood adversely affected the roads,
which resulted in delays and interruptions in transporting raw milk from
farms to FO2’s factory.
o Major loss in milk supply: The flood negatively impacted farmers, which
meant a loss of livestock and lower milk production.
FO2’s operations
o Loss of production (short-term): As the raw milk supply dropped for a time,
there was a loss of production compared with planned production.
Downstream SC
o Disruption to transport operations: As the flood adversely affected the
roads, it impacted on transport from FO2’s factory to its downstream SC
partners, such as distributors and retailers.
o Disruption to the distribution network: The production loss impacted
distributors in terms of lower inventory.
o A sudden surge in demand: During the flood, the demand for essential
products such as milk products increased.
o Stock-outs: For a short period, the company faced stock-outs of its finished
products in the market.

149
In response to these challenges, FO2 initiated various actions and activities that can be
categorised into three groups:
FO2’s internal response
o Monitoring of the early warning signs and pre-disruption evacuation
o Activation of the Flood Contingency Plan
o Understanding the market situation
o Activating postponement operations
FO2’s supply-side response
o Collaboration and information sharing
o Reallocation of operations
o Activation of alternative options
o Supplier development programmes
FO2’s buyers-side response
o Collaboration and information sharing
In conclusion, FO2 faced various challenges as result of this flood. However, various actions
opted for by the company helped it and its SC partners deal with the disruption.
The full descriptive information of this disruption is provided in Appendix G. Table 5.5
presents the critical highlights of this disruption in chronological order.
Table 5.5 – Summary of D5 (flood-2010)
Timeline Players Actions/Events
Before June 2010
Government o After the 2005 earthquake, the Pakistani Government established the National Disaster Management Authority (NDMA), Provincial Disaster Management Commissions (PDMA) and District Disaster Management Authorities (DDMA).
o In 2006, the National Disaster Management System Ordinance (NDMO) was passed.
o Until June 2010, NDMA with the help of PDMA, DDMA, NGOs and United Nations departments engaged in many activities in planning, mitigation and reduction of a range of disruptions, including floods (NDMA, 2009).
Before June 2010
FO2’s SC o FO1 has various advance warning systems to trace threats of severe weather conditions and possible flooding.
o The company also engaged in various supplier development programmes to educate its suppliers on these kinds of risk.
June-July Government o The first action involved a pre-monsoon conference held on

150
Timeline Players Actions/Events
2010 28 June 2010. o Pakistan Meteorological Department (PMD) issued flood
warnings on 27 and 28 July 2010 highlighting high rainfall and flooding in various districts around the country.
o NDMA issued a flood advisory to relevant authorities and departments on 26 and 29 July 2010 for them to take necessary actions.
o Before the actual flood, all the relevant organisations such as NDMA, PDMA and DDMA initiated collaborative work with all the stakeholders to execute an evacuation plan.
June-July 2010
FO2’s SC o The pre-flood warning was communicated to the relevant FO2 departments.
o The company engaged in various pre-cautionary actions across its SC, such as early evacuation of its field operations and farmers.
July-August 2010
Government o Starting in the third week of July and lasting for almost one and half months, the flood spread its devastation in almost 80 of 141 districts in the country.
o The government launched its response with the collaboration of various stakeholders, including temporary relocation of various communities to safe locations.
o Regarding the dairy sector, this relocation helped farmers to relocate their livestock, provide shelter, feed and medicines.
July-August 2010
FO2’s SC o The first phase involved saving life and critical assets. o FO2 regularly communicated with the PMD for the latest
weather updates and planned accordingly. o The company continuously communicated with and helped
its suppliers and buyers in response and recovery operations. o The company started to look at backup plans, such as
procuring milk from other locations and using the buffer stock of milk powder (postponement strategy).
August 2010 – long-term
FO2’s SC o After this disruption, the company worked on various shortcomings and learning from the situation.
o Based on the lessons, the company improved various in-house and SC operations, such as permanently relocating its field operations to safe locations.
o The company also developed and trained its suppliers to better prepare and respond to this type of disruption.
5.2.6. Disruption 6 – Foot and Mouth Disease (FMD)
The second disruption highlighted by FO2 was foot and mouth disease (FMD). In Pakistan,
every year FMD costs the dairy industry approximately PKR 6 billion (USD 60 million), which
directly constrains the country’s economic growth and, most importantly, negatively affects
international trade (Anjum, Hussain, Zahoor, Irshad, & Farooq, 2004).

151
FMD, a viral and highly contagious disease, is caused by an RNA virus belonging to the
Aphthovirus genus (Jamal, Ahmed, Hussain, & Ali, 2010). FMD affects animals’ health
resulting in high fever and blisters around the mouth and hooves. The disease agent
survives in affected animals’ saliva, breath, urine and in other defecations, which makes it
highly contagious.
Although the disease is a global concern, a few countries such as Australia, New Zealand,
North America, Chile and some European countries either have eradicated it entirely or
control it on a larger scale. Various other regions, such as Asia (including Pakistan), Africa,
and South America, are more prone to outbreaks of FMD (APHIS, 2013).
To combat FMD, many local and international agencies operating in Pakistan, such as the
Food and Agriculture Organization (FAO) of the United Nations, have allocated substantial
resources and funds to control the spread of this disease. These projects initiated formal
disease reporting systems and upgrading of old information systems to better track this
disease across the country. Introduced 15 years ago, this project has produced data
regarding the spread of FMD in various provinces, regions and towns. The project provides
the relevant authorities such as the government, dairy companies (including FO2) and NGOs
information to better understand the issue. This ultimately led to the development of
various training programmes and warning systems by the authorities to control and
eradicate the disease (Anjum et al., 2004).
Despite various efforts by the government and various agencies, FMD is one of the major
animal diseases, significantly affecting the livelihood of the country’s farming community.
From the interview data, it was established that FMD substantially affects the farming
community. However, the impact on an individual dairy processing company is minimal.
Therefore, from FO2’s perspective, this research identifies FMD as an operational
disruption.
For FO2, the disease results in various operational constraints that mean a low supply of raw
milk from the affected areas or farmers, additional resource commitment and slight changes
in the production schedule. FMD also adversely impacts FO2’s farming network, which is
reflected in production loss, livestock loss and adverse financial implications.
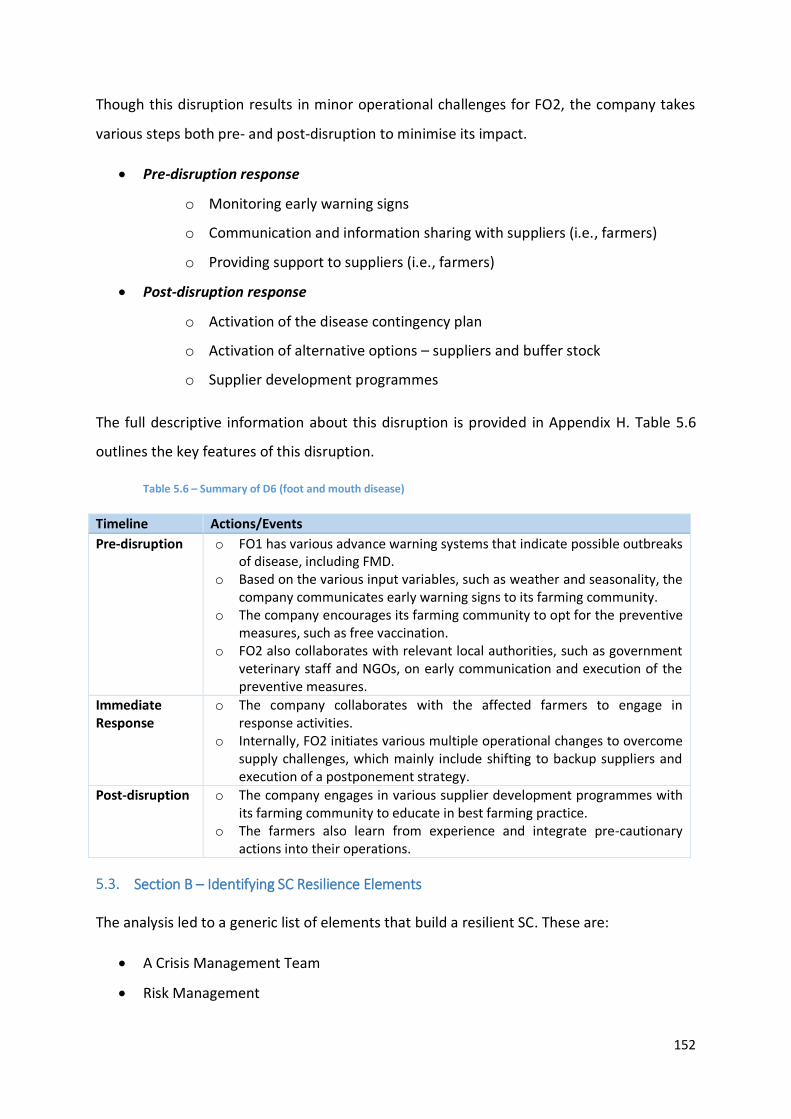
152
Though this disruption results in minor operational challenges for FO2, the company takes
various steps both pre- and post-disruption to minimise its impact.
Pre-disruption response
o Monitoring early warning signs
o Communication and information sharing with suppliers (i.e., farmers)
o Providing support to suppliers (i.e., farmers)
Post-disruption response
o Activation of the disease contingency plan
o Activation of alternative options – suppliers and buffer stock
o Supplier development programmes
The full descriptive information about this disruption is provided in Appendix H. Table 5.6
outlines the key features of this disruption.
Table 5.6 – Summary of D6 (foot and mouth disease)
Timeline Actions/Events
Pre-disruption o FO1 has various advance warning systems that indicate possible outbreaks of disease, including FMD.
o Based on the various input variables, such as weather and seasonality, the company communicates early warning signs to its farming community.
o The company encourages its farming community to opt for the preventive measures, such as free vaccination.
o FO2 also collaborates with relevant local authorities, such as government veterinary staff and NGOs, on early communication and execution of the preventive measures.
Immediate Response
o The company collaborates with the affected farmers to engage in response activities.
o Internally, FO2 initiates various multiple operational changes to overcome supply challenges, which mainly include shifting to backup suppliers and execution of a postponement strategy.
Post-disruption o The company engages in various supplier development programmes with its farming community to educate in best farming practice.
o The farmers also learn from experience and integrate pre-cautionary actions into their operations.
Section B – Identifying SC Resilience Elements
The analysis led to a generic list of elements that build a resilient SC. These are:
A Crisis Management Team
Risk Management

153
Situational Awareness and Quick Decision Making
Collaboration
Crisis Communication
Operational/SC Re-engineering
Quality Management
Product Traceability and SC Visibility
Supportive Organisational Culture and Learning Attitude
It is important to highlight that each SC resilience element emerged from the analysis of all
six SC disruptions and each is discussed holistically in this section. Appendices C to H present
a detailed discussion of each resilience element separately for each SC disruption. Table 5.7
briefly recaps all six SC disruptions highlighted in Section 5.2.
Table 5.7 – A Summary of the SC disruptions
SC Abbreviation SC Disruption Year Type of Disruption
FO1’s SC – New Zealand
D1 DCD issue 2013 Major
D2 Botulism scare 2013 Major
D3 Shortage of critical raw material (lactose)
2015 Operational
D4 Operational issue (product hold)
2015 Operational
FO2’s SC – Pakistan
D5 Flood 2010 2010 Major
D6 Foot and mouth disease (FMD)
Ongoing Operational
5.3.1. Crisis Management Team
Once an organisation experiences a disruption that threatens its normal operations, it often
requires a centralised response from top management. It was noted that a central piece to
managing a disruption includes the deployment of a crisis management team that runs
centrally and coordinates all response activities, especially during the initial response and
recovery stage. For example, in D1 and D2, in response to an aggressive reaction from
various international markets, FO1 immediately realised the depth of the issue and FO1’s
top management instantly activated its risk management plan that involved deployment of
the crisis management team.

154
"Right after the (first) press release (in case of D1), a crisis management team was
formed, and it just followed the procedures that we had." (FO1-P11)
Similarly, for D5 (Flood 2010), FO2 immediately activated its flood contingency plan and
deployed the crisis management team. Primarily, two points were analysed here; first, the
composition of the crisis management teams and, secondly, the role of the crisis
management team in achieving SC resilience.
5.3.1.1. The Composition of a Crisis Management Team
Regarding composition, the analysis suggests that a crisis management team involves
representation from top management and key personnel from relevant departments.
Examples in D1, D2 and D5 showed that personnel from various departments constituted
the crisis management team.
"Our milk supply team and some of the senior managers and our quality team,
probably 30 people were involved. So that was within our organisation (FO1)." (FO1-
P11)
In addition to the crisis management team, various sub-teams or departments were also
involved to deal with these major disruptions (D1, D2 & D5). It was found that these major
SC disruptions impact various operations in an organisation, which requires multiple teams
to respond to the challenges. For example, during D2, in conjunction with the FO1’s crisis
management team, various functional level teams such as quality and sales teams were
actively involved in response activities. Similarly, in D5, in addition to the crisis team at the
FO2’s head office, various teams (such as the milk supply and field teams) were involved in
early response and recovery efforts. Primarily, analysis suggests that the crisis management
team focused on establishing collaboration with the key stakeholders and making strategic
decisions, whereas the sub-teams aimed at more technical and operational responses in
close coordination with the crisis management team.
Effective response to a disruption involves multiple teams at multiple levels of the SC or
industry. In D1 and D2, in addition to FO1’s crisis management team, other teams in the
New Zealand dairy industry level, involving MPI and DCANZ (including FO1, FO1-C1 and FO1-
C2), managed and executed the industry level response. It was observed that the industry
155
level team was fundamental to deal with the issues more holistically. For example, in D1,
the industry level team collaborated on the testing regime and the results from all dairy
players, and communicated with relevant stakeholders, which resolved the challenges to
the whole New Zealand dairy industry. It can be inferred that without the industry-wide
team it would have been difficult to resolve the industry-wide issue. Similarly, in D5 (Flood
2010), additional to FO2’s response, the country-wide response was managed by various
teams from NDMA, PDMA, DDMA, official authorities, NGOs and army personnel.
In D3, D4 and D6, where the disruption was more focussed on a functional or a small part of
the organisation, sub-teams at the functional level played a central role in managing the
response and recovery activities. For example, in D3 (lactose shortage), mainly the
procurement team, with the top management and relevant departments, was involved in
coordinating the response. Similarly, in D6 (FMD), the milk supply team usually coordinated
response and recovery efforts with FO2’s farmers.
Analysis shows that a pre-defined risk management plan, including a pre-defined team and
communication structure, enables quick deployment of the crisis management team after a
disruption. This is further discussed in Section 5.3.2.
5.3.1.2. Crisis Management Team’s Role in Achieving SC Resilience
A disruption inherits intense uncertainties and can present numerous challenges to an
organisation and its SC that could interrupt the flow of products and services. For example,
with D1 and D2 for a limited time, specific markets, such as China, closed their borders or
raised serious questions for all products coming from New Zealand. From FO1’s perspective,
it meant an interrupted flow of products for its downstream SC partners. Similarly, for D5,
flood-affected FO2’s upstream and downstream SC operations. To analyse and resolve these
challenges during a disruption, an organisation and its SC need a centralised response and a
crisis management team.
As discussed above, all six SC disruptions highlighted different levels of centralised response,
where a crisis management team played a central role. For example, in D1 and D2, FO1’s
crisis management team was activated in addition to a broader team at the dairy industry
level. Similarly, in D5, FO2’s centralised planning team was responsible for making SC-wide

156
decisions. In operational disruptions (D3, D4, & D6) the centralised response was handled by
a relevant functional team.
The data showed that a crisis management team was primarily responsible for gathering,
analysing and communicating information to various stakeholders. For example, in D1 and
D2, FO1’s crisis management team established connections with its competitors (other dairy
companies) and MPI to gather and share information. During D1, FO1 exchanged
information regarding the responses by international markets, the testing regime and
results. This information enabled teams at both levels, FO1 and the New Zealand dairy
industry, to devise response and recovery activities. For example, based on the information
regarding reactions by various international markets, FO1’s crisis management team
analysed and decided to reroute finished products to other international markets. Similarly,
FO2’s team gathered information from stakeholders regarding the possibility of a flood,
which enabled them to analyse and decide on different response and recovery strategies,
such as pre-flood evacuation and rationalisation of inventory level at the distribution
network.
“We have a crisis management team that would quickly get together and do all the
analysis and research we need to understand the risks and whether it a real or
perceived issue” (FO1-P4)
In summary, the following points highlight the various activities and roles of a crisis
management team in all six cases:
To analyse the post-disruption environment and provide a strategic, cohesive,
coordinated and timely response
To collaborate and closely work with internal teams (functional/sub-teams) and
external stakeholders (SC partners and other stakeholders)
To develop and execute response and recovery strategies to deal with the disruption
To develop a communication strategy and act as a hub for communication
To provide input for a collective industry response in an industry-wide issue such as
D1 and D2
To execute rescue and response operations in a natural disruption such as D5
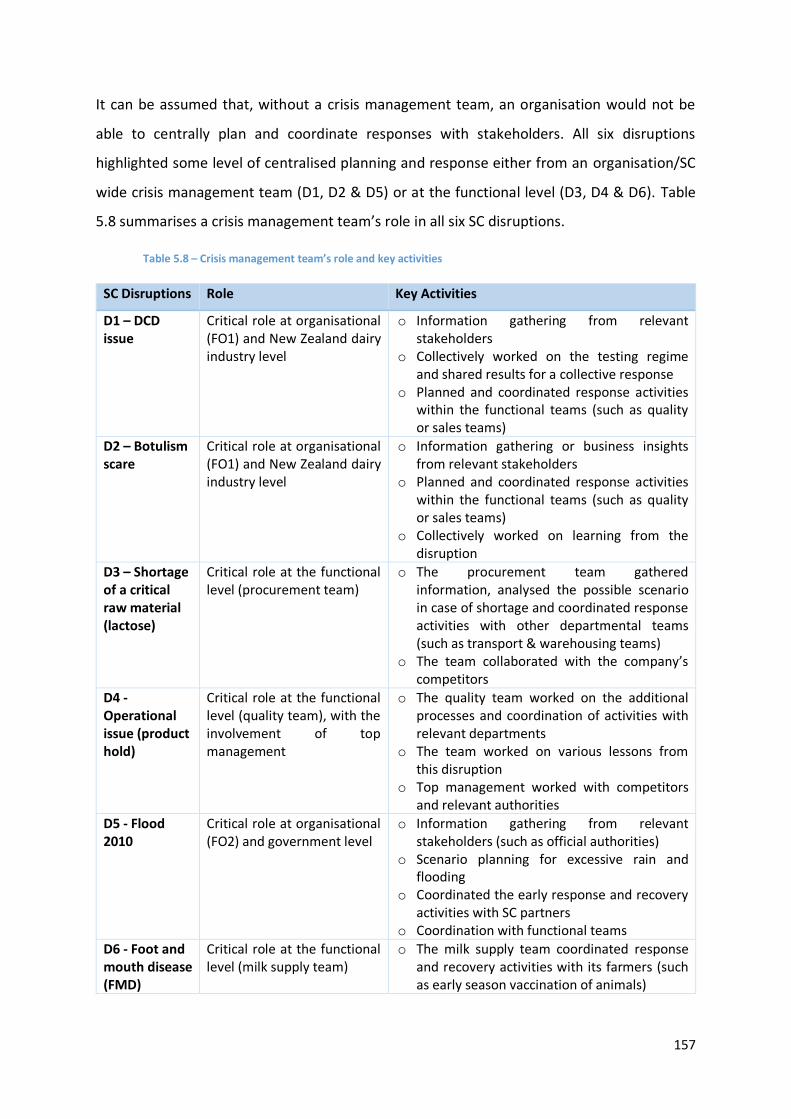
157
It can be assumed that, without a crisis management team, an organisation would not be
able to centrally plan and coordinate responses with stakeholders. All six disruptions
highlighted some level of centralised planning and response either from an organisation/SC
wide crisis management team (D1, D2 & D5) or at the functional level (D3, D4 & D6). Table
5.8 summarises a crisis management team’s role in all six SC disruptions.
Table 5.8 – Crisis management team’s role and key activities
SC Disruptions Role Key Activities
D1 – DCD issue
Critical role at organisational (FO1) and New Zealand dairy industry level
o Information gathering from relevant stakeholders
o Collectively worked on the testing regime and shared results for a collective response
o Planned and coordinated response activities within the functional teams (such as quality or sales teams)
D2 – Botulism scare
Critical role at organisational (FO1) and New Zealand dairy industry level
o Information gathering or business insights from relevant stakeholders
o Planned and coordinated response activities within the functional teams (such as quality or sales teams)
o Collectively worked on learning from the disruption
D3 – Shortage of a critical raw material (lactose)
Critical role at the functional level (procurement team)
o The procurement team gathered information, analysed the possible scenario in case of shortage and coordinated response activities with other departmental teams (such as transport & warehousing teams)
o The team collaborated with the company’s competitors
D4 - Operational issue (product hold)
Critical role at the functional level (quality team), with the involvement of top management
o The quality team worked on the additional processes and coordination of activities with relevant departments
o The team worked on various lessons from this disruption
o Top management worked with competitors and relevant authorities
D5 - Flood 2010
Critical role at organisational (FO2) and government level
o Information gathering from relevant stakeholders (such as official authorities)
o Scenario planning for excessive rain and flooding
o Coordinated the early response and recovery activities with SC partners
o Coordination with functional teams
D6 - Foot and mouth disease (FMD)
Critical role at the functional level (milk supply team)
o The milk supply team coordinated response and recovery activities with its farmers (such as early season vaccination of animals)
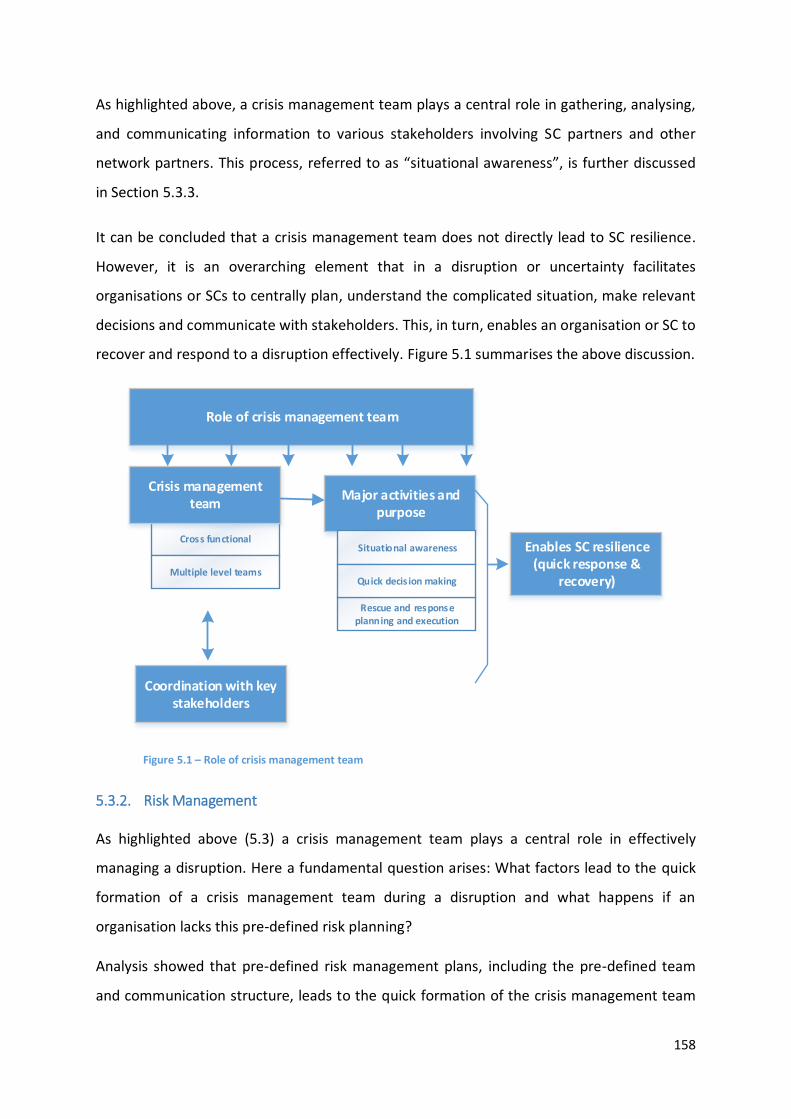
158
As highlighted above, a crisis management team plays a central role in gathering, analysing,
and communicating information to various stakeholders involving SC partners and other
network partners. This process, referred to as “situational awareness”, is further discussed
in Section 5.3.3.
It can be concluded that a crisis management team does not directly lead to SC resilience.
However, it is an overarching element that in a disruption or uncertainty facilitates
organisations or SCs to centrally plan, understand the complicated situation, make relevant
decisions and communicate with stakeholders. This, in turn, enables an organisation or SC to
recover and respond to a disruption effectively. Figure 5.1 summarises the above discussion.
Cross functional
Multiple level teams
Crisis management team
Major activities and purpose
Coordination with key stakeholders
Situational awareness
Rescue and response planning and execution
Quick decis ion making
Enables SC resilience(quick response &
recovery)
Role of crisis management team
Figure 5.1 – Role of crisis management team
5.3.2. Risk Management
As highlighted above (5.3) a crisis management team plays a central role in effectively
managing a disruption. Here a fundamental question arises: What factors lead to the quick
formation of a crisis management team during a disruption and what happens if an
organisation lacks this pre-defined risk planning?
Analysis showed that pre-defined risk management plans, including the pre-defined team
and communication structure, leads to the quick formation of the crisis management team
159
after a disruption. It was noted in Chapter 4 (4.2.4) that FO1 had various risk management
plans that provided essential guidelines on the key vulnerabilities or risks, response
measures, and roles and responsibilities of key personnel during a disruption. In D1 and D2,
analysis showed that these pre-defined plans enabled FO1 to deploy the crisis management
team quickly.
“We have, what we call, a crisis management plan. So, we have it prior to this issue
[DCD disruption]. This plan actually describes the key personnel needed to be
involved in these kinds of disruptions and also tells the individual roles and
responsibilities.” (FO1-P2)
"Right after the (first) press release, a crisis management team was formed, and it
just followed the procedures that we had." (FO1-P11)
Similarly, in FO2, the company had various predefined plans, such as flood contingency
plans and disease contingency plans, to deal effectively with any vulnerabilities. Analysis
showed that these pre-defined plans quickly guided FO2 to deploy various personnel and
also provided immediate actions to be taken during a disruption. For example, in D5 (Flood
2010), FO2 immediately activated its flood contingency plan, which outlined a pre-defined
approach to deal with the emergency.
“If a flood strikes and affects the areas in which we have chillers, then we have
already identified in the plan that in which areas we would be shifting our chillers.”
(FO2-P1)
A risk management plan also defines various anticipatory measures or early warning tools
such as weather forecasts that provide a company with advance warning of an upcoming
event. In the 2010 flood (D5), the flood contingency plan helped FO2 implement various risk
reduction activities before the flood season. For example, the early warning systems
provided the company time to engage in early evaluation of its most vulnerable operations
(i.e., FO2’s chilling centre). Secondly, once the scale of flood indicated a real catastrophe,
the pre-defined risk plan enabled the company to quickly activate various
functional/departmental teams to engage in response activities. Like FO2, other
participating organisations in Pakistan (such as FO2-C1, FO2-C2, FO2-R1, and FO2-R2)
160
indicated a similar emphasis on pre-defined risk plans, which enabled quick anticipation and
response in the 2010 flood.
It can be inferred that, in the absence of these pre-defined teams and structure, it would be
difficult for organisations to promptly set-up and deploy a crisis management team. Any
delay in forming a crisis management team could compromise the whole centralised
planning process and the response to the disruption. Secondly, if an organisation does not
pre-plan the activities or actions to be taken during a disruption, it could jeopardise the
response efforts. For example, if FO2 had not defined the processes and locations for
shifting its critical operations, it could have been impossible for it to promptly start the
evacuation or relocation process of critical operations during the 2010 flood (D5).
Here, two outcomes can be inferred, first a risk management plan includes pre-defined
procedures and protocols, team structures and early warnings systems, which comply with
the typical risk management process (also suggested by various authors such as Ho et al.
(2015), Manuele (2005), and Tummala and Schoenherr (2011)). Most importantly, these risk
management plans positively influence an organisation’s ability to quickly deploy relevant
teams and engage in response operations during a disruption, and hence achieve SC
resilience.
In addition, the analysis of D5 and D6 suggested that various SC partners of FO2, such as
farmers, distributors and retailers, mostly showed limited understanding of formal risk
management. However, many took anticipatory measures in case of flood 2010 (D5), and
quickly responded and survived. The analysis highlighted that though these SC partners had
insufficient knowledge of formal risk management, FO2 established centralised risk planning
for their less developed and knowledgeable SC partners. For example, on behalf of FO2’s
farmers, “we [FO2] have identified the ways and procedures to shift the animals of the
farmers" (FO2-P1). Similarly, FO2 engaged in various risk management exercises, such as
simulation exercises, with its SC partners. This indicates that all firms who quickly
anticipated and responded relatively well to this disruption relied on pre-defined risk
management practices, either by in-house risk management or endorsed by the hub-firm
such as FO2 or FO2-C1. This supports the earlier assertion that risk management tools
positively influence an organisation’s ability to respond to a risk quickly.

161
Figure 5.2 summarises the discussion on risk management and the crisis management team
(5.3.1) and describes how these two elements lead to SC resilience.
Risk management plan
Pre-defined team structure
Pre-defined communication structure
Pre-defined roles & responsibility
SC risk analysis and planning
Cross functional
Crisis management team
Major activities and purpose
Coordination with key stakeholders
Situational awareness
Rescue and response planning and execution
Quick decis ion making
Enables SC resilience(quick response &
recovery)
Role of crisis management team
SC disruption
Multiple level teams
Figure 5.2 - Key features and sub-elements of risk management and a crisis management team
5.3.3. Situational Awareness and Quick Decision Making
As highlighted above, a SC disruption results in an interruption of goods and materials
within a SC (Craighead, Blackhurst, Rungtusanatham, & Handfield, 2007), and characterises
a chaotic environment with high degree of uncertainty. For example, in D1 after the first
press release, the stable business environment for New Zealand dairy companies suddenly
became immensely chaotic and uncertain. As described by one respondent (FO1-P1), just
after the first press release, “It was uncertain for first few days that what is going to play”.
D2 presented almost same challenges for the whole New Zealand dairy industry. There was
a lot of uncertainty around the reaction from international markets and countries because,
in both cases, various international markets took it as a New Zealand wide issue.
Similar observations were noted for other disruptions, where the early days of the
disruptions were characterised as highly uncertain and chaotic. It was noted that a degree of
uncertainty remains high in a major SC disruption, such as D1 (DCD) or D5 (flood), whereas it
remains relatively low in an operational disruption such as D3 (lactose shortage) or D6
(FMD).

162
It was noted what enables an organisation from the day of disruption or uncertainty until it
arrives at a course of action to respond and recover from the disruption. Analysis showed
that, to develop a set of actions or strategies to normalise the situation, managers need to
understand and analyse the post-disruption situation (also highlighted by Luokkala and
Virrantaus (2014)), especially during the early days of a disruption.
The first step in understanding and analysing the post-disruption environment involves
gathering relevant information from both within the organisation and from relevant
stakeholders, also referred to as “business intelligence process” (Pettit et al., 2010). This can
be achieved by establishing connections with key stakeholders during a disruption. For
example, in D1 and D2, it was achieved by contacting other dairy players (competitors),
DCANZ and MPI. During the first few days of the disruption, the connection was on a daily
basis to take gather information.
“In the midst of that all we had daily calls with MPI in Wellington and with a lot of
other industry participants.” (FO1-P11)
In D3, critical information came from FO1’s suppliers, the freight company and the
company’s competitors. Similarly, during D5, analysis showed that FO2 gathered
information from the stakeholders, such as the Pakistan Meteorological Department (PMD)
for weather forecasts and official authorities for pre-warning flood advisories. The
connection with key stakeholders provides a company with key developments and insights
that are essential to understand and analyse the situation. In addition, a company’s
information systems also provide the critical information required for analysing the situation
and making relevant decisions. For example:
For D1 and D2, it involved information regarding product traceability in FO1’s SC.
For D3, it entailed information regarding the current stock levels of the raw material.
In case of D5, it included information regarding the stock levels at various points of
FO2’s SC.
It can be inferred that effective information gathering is the product of having pre-defined
links with stakeholders, having an understanding of the key stakeholders and adequate
information systems. For example, FO1 had adequate product traceability systems before
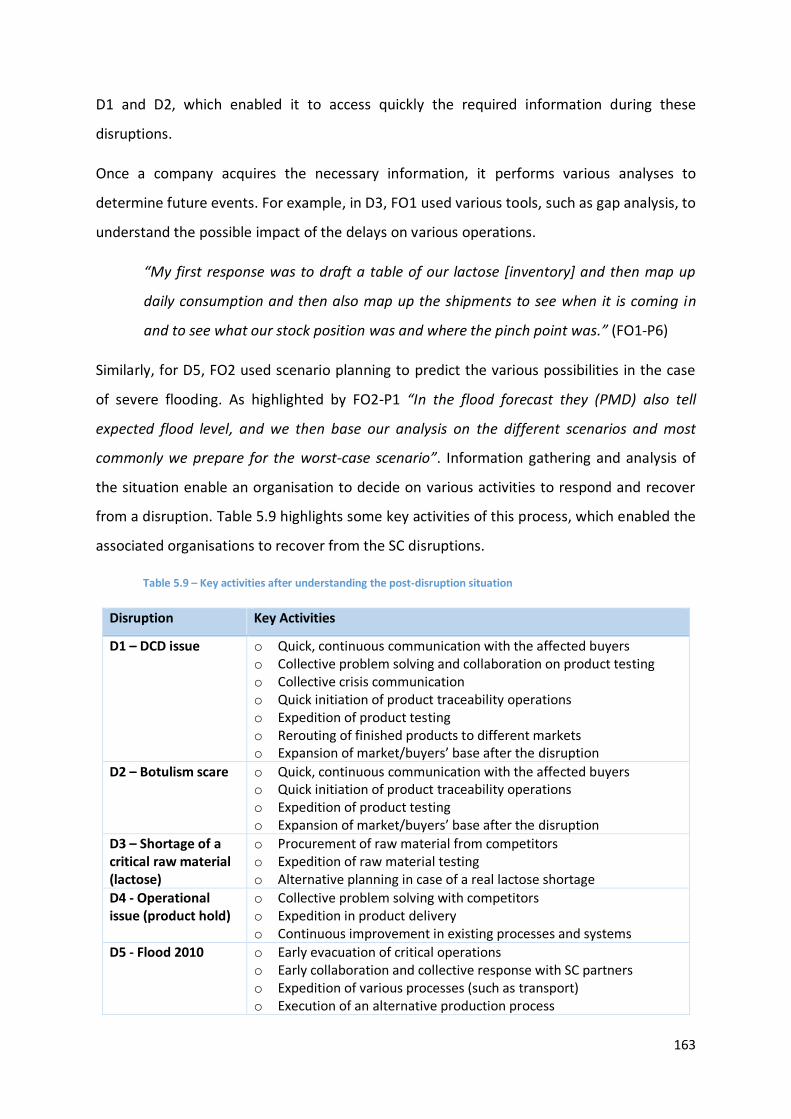
163
D1 and D2, which enabled it to access quickly the required information during these
disruptions.
Once a company acquires the necessary information, it performs various analyses to
determine future events. For example, in D3, FO1 used various tools, such as gap analysis, to
understand the possible impact of the delays on various operations.
“My first response was to draft a table of our lactose [inventory] and then map up
daily consumption and then also map up the shipments to see when it is coming in
and to see what our stock position was and where the pinch point was.” (FO1-P6)
Similarly, for D5, FO2 used scenario planning to predict the various possibilities in the case
of severe flooding. As highlighted by FO2-P1 “In the flood forecast they (PMD) also tell
expected flood level, and we then base our analysis on the different scenarios and most
commonly we prepare for the worst-case scenario”. Information gathering and analysis of
the situation enable an organisation to decide on various activities to respond and recover
from a disruption. Table 5.9 highlights some key activities of this process, which enabled the
associated organisations to recover from the SC disruptions.
Table 5.9 – Key activities after understanding the post-disruption situation
Disruption Key Activities
D1 – DCD issue o Quick, continuous communication with the affected buyers o Collective problem solving and collaboration on product testing o Collective crisis communication o Quick initiation of product traceability operations o Expedition of product testing o Rerouting of finished products to different markets o Expansion of market/buyers’ base after the disruption
D2 – Botulism scare o Quick, continuous communication with the affected buyers o Quick initiation of product traceability operations o Expedition of product testing o Expansion of market/buyers’ base after the disruption
D3 – Shortage of a critical raw material (lactose)
o Procurement of raw material from competitors o Expedition of raw material testing o Alternative planning in case of a real lactose shortage
D4 - Operational issue (product hold)
o Collective problem solving with competitors o Expedition in product delivery o Continuous improvement in existing processes and systems
D5 - Flood 2010 o Early evacuation of critical operations o Early collaboration and collective response with SC partners o Expedition of various processes (such as transport) o Execution of an alternative production process
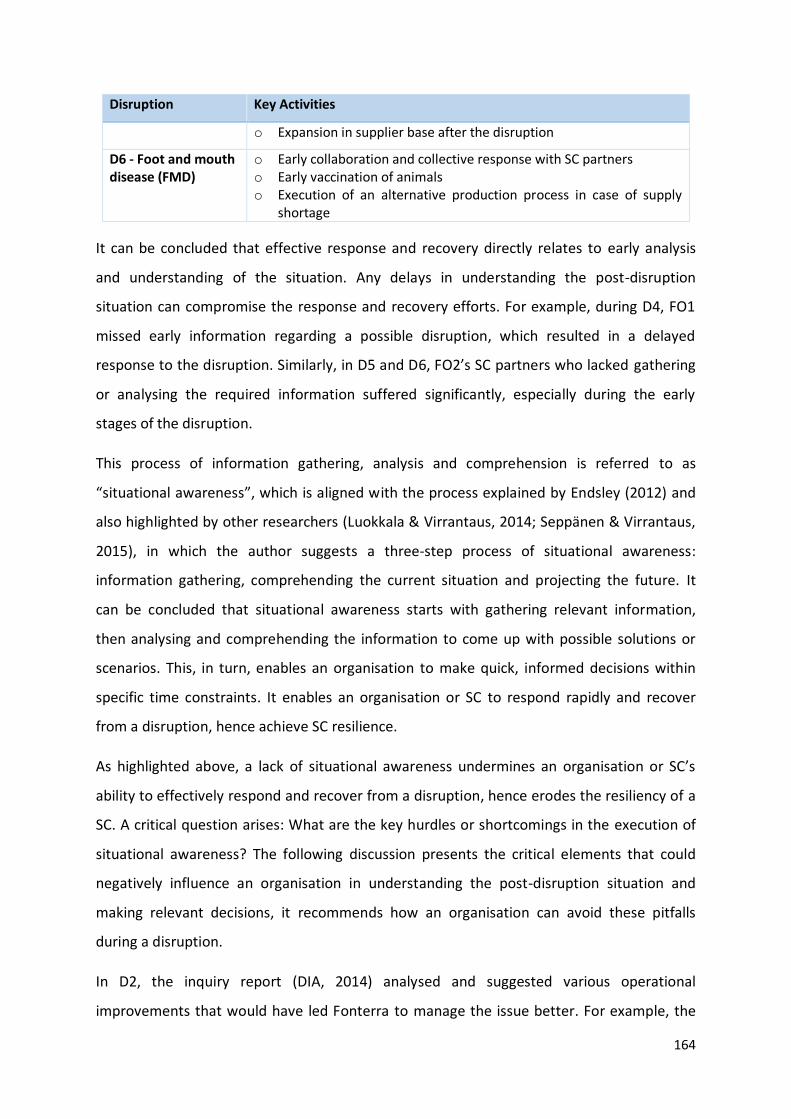
164
Disruption Key Activities
o Expansion in supplier base after the disruption
D6 - Foot and mouth disease (FMD)
o Early collaboration and collective response with SC partners o Early vaccination of animals o Execution of an alternative production process in case of supply
shortage
It can be concluded that effective response and recovery directly relates to early analysis
and understanding of the situation. Any delays in understanding the post-disruption
situation can compromise the response and recovery efforts. For example, during D4, FO1
missed early information regarding a possible disruption, which resulted in a delayed
response to the disruption. Similarly, in D5 and D6, FO2’s SC partners who lacked gathering
or analysing the required information suffered significantly, especially during the early
stages of the disruption.
This process of information gathering, analysis and comprehension is referred to as
“situational awareness”, which is aligned with the process explained by Endsley (2012) and
also highlighted by other researchers (Luokkala & Virrantaus, 2014; Seppänen & Virrantaus,
2015), in which the author suggests a three-step process of situational awareness:
information gathering, comprehending the current situation and projecting the future. It
can be concluded that situational awareness starts with gathering relevant information,
then analysing and comprehending the information to come up with possible solutions or
scenarios. This, in turn, enables an organisation to make quick, informed decisions within
specific time constraints. It enables an organisation or SC to respond rapidly and recover
from a disruption, hence achieve SC resilience.
As highlighted above, a lack of situational awareness undermines an organisation or SC’s
ability to effectively respond and recover from a disruption, hence erodes the resiliency of a
SC. A critical question arises: What are the key hurdles or shortcomings in the execution of
situational awareness? The following discussion presents the critical elements that could
negatively influence an organisation in understanding the post-disruption situation and
making relevant decisions, it recommends how an organisation can avoid these pitfalls
during a disruption.
In D2, the inquiry report (DIA, 2014) analysed and suggested various operational
improvements that would have led Fonterra to manage the issue better. For example, the
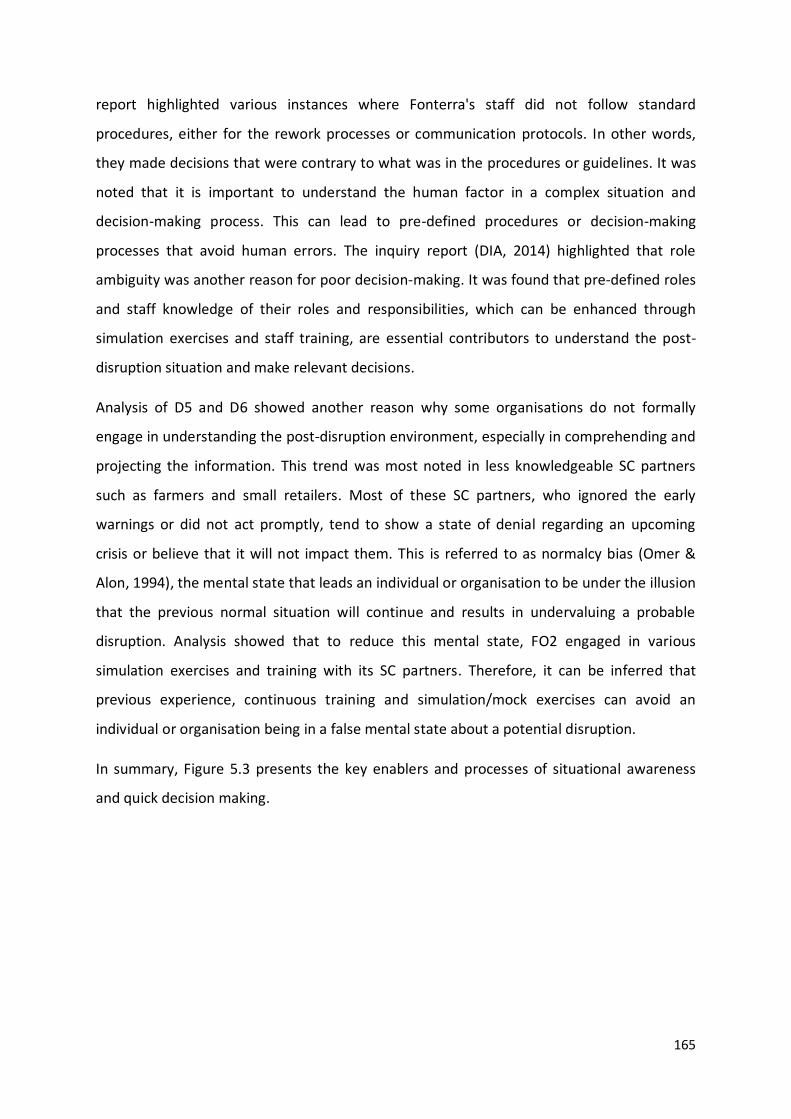
165
report highlighted various instances where Fonterra's staff did not follow standard
procedures, either for the rework processes or communication protocols. In other words,
they made decisions that were contrary to what was in the procedures or guidelines. It was
noted that it is important to understand the human factor in a complex situation and
decision-making process. This can lead to pre-defined procedures or decision-making
processes that avoid human errors. The inquiry report (DIA, 2014) highlighted that role
ambiguity was another reason for poor decision-making. It was found that pre-defined roles
and staff knowledge of their roles and responsibilities, which can be enhanced through
simulation exercises and staff training, are essential contributors to understand the post-
disruption situation and make relevant decisions.
Analysis of D5 and D6 showed another reason why some organisations do not formally
engage in understanding the post-disruption environment, especially in comprehending and
projecting the information. This trend was most noted in less knowledgeable SC partners
such as farmers and small retailers. Most of these SC partners, who ignored the early
warnings or did not act promptly, tend to show a state of denial regarding an upcoming
crisis or believe that it will not impact them. This is referred to as normalcy bias (Omer &
Alon, 1994), the mental state that leads an individual or organisation to be under the illusion
that the previous normal situation will continue and results in undervaluing a probable
disruption. Analysis showed that to reduce this mental state, FO2 engaged in various
simulation exercises and training with its SC partners. Therefore, it can be inferred that
previous experience, continuous training and simulation/mock exercises can avoid an
individual or organisation being in a false mental state about a potential disruption.
In summary, Figure 5.3 presents the key enablers and processes of situational awareness
and quick decision making.

166
Situational awareness
Collaboration with key stakeholders
Gathering data or information
Comprehe nsion and proje ction
Network/SC understanding
Monitoring early warning signals
Gap analysis
Scenario planning
Business inte lligence
Information systems
Quick decision makingEnables SC resilience
(quick response & recovery)
Mistake-proofing process
Role clarity
Figure 5.3 – Key enablers and processes of situational awareness and quick decision making
Additionally, the analysis also suggests that the process of situational awareness reflects at
various levels; such as the organisational, SC and industry levels. The nature and
requirements of a disruption define the level of involvement of various stakeholders. The
following points summarise different level stakeholders involved in the situational
awareness process:
Level 1 – Functional level: involves functional teams to analyse the situation affecting
operational activities during a disruption. For instance, in D1 and D2, the quality
team was responsible for understanding the complexity involved with setting up the
testing regime and results. Similarly, during D5, the milk supply and field teams were
responsible for analysing and responding to decisions related to the farming
network.
Level 2 – Organisational level: refers to a crisis management team to analyse the
situation on behalf of the organisation or SC. For example, FO1’s crisis management
team was involved in understanding the situational during D1 and D2, and FO2’s
crisis management team was involved during D5.
Level 3 – Industry/SC Level: refers to a team or teams at the industry/SC level to
analyse and decide on behalf of the whole dairy industry or SC. For example, in D1
and D2, it refers to a team at the dairy industry level including members from all
New Zealand dairy companies and other stakeholders. Similarly, various teams of
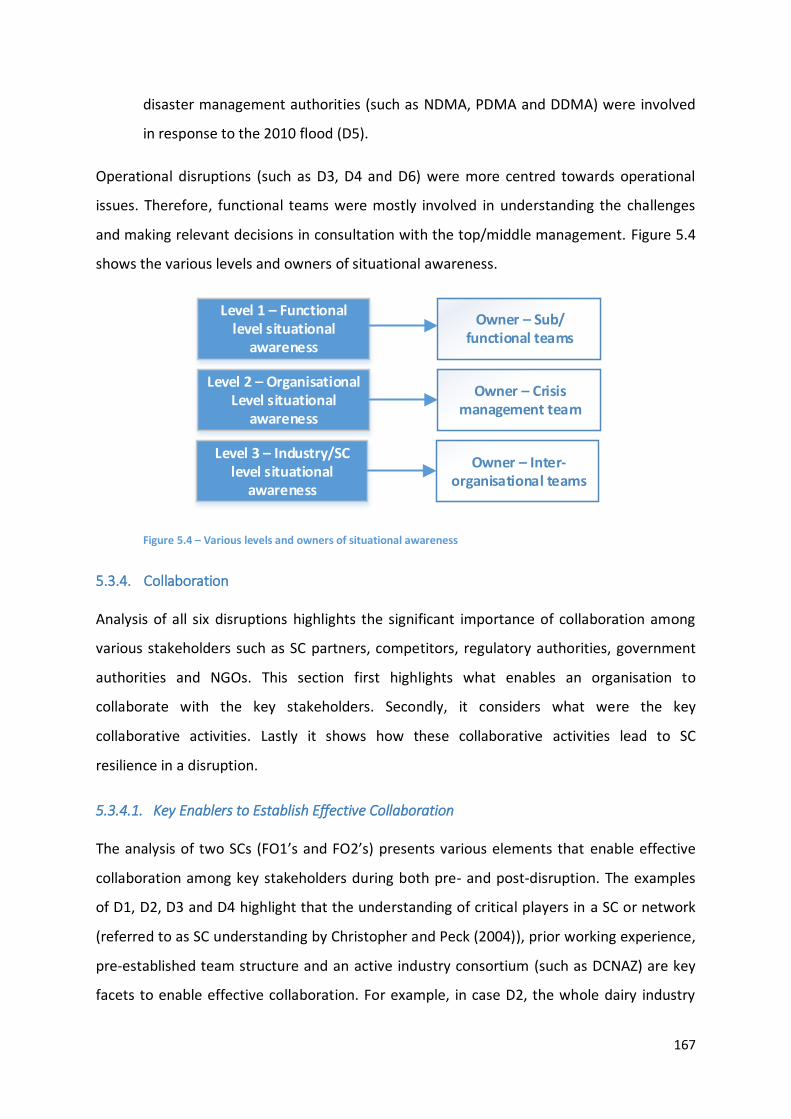
167
disaster management authorities (such as NDMA, PDMA and DDMA) were involved
in response to the 2010 flood (D5).
Operational disruptions (such as D3, D4 and D6) were more centred towards operational
issues. Therefore, functional teams were mostly involved in understanding the challenges
and making relevant decisions in consultation with the top/middle management. Figure 5.4
shows the various levels and owners of situational awareness.
Owner – Sub/ functional teams
Level 1 – Functional level situational
awareness
Owner – Crisis management team
Level 2 – Organisational Level situational
awareness
Owner – Inter-organisational teams
Level 3 – Industry/SC level situational
awareness
Figure 5.4 – Various levels and owners of situational awareness
5.3.4. Collaboration
Analysis of all six disruptions highlights the significant importance of collaboration among
various stakeholders such as SC partners, competitors, regulatory authorities, government
authorities and NGOs. This section first highlights what enables an organisation to
collaborate with the key stakeholders. Secondly, it considers what were the key
collaborative activities. Lastly it shows how these collaborative activities lead to SC
resilience in a disruption.
5.3.4.1. Key Enablers to Establish Effective Collaboration
The analysis of two SCs (FO1’s and FO2’s) presents various elements that enable effective
collaboration among key stakeholders during both pre- and post-disruption. The examples
of D1, D2, D3 and D4 highlight that the understanding of critical players in a SC or network
(referred to as SC understanding by Christopher and Peck (2004)), prior working experience,
pre-established team structure and an active industry consortium (such as DCNAZ) are key
facets to enable effective collaboration. For example, in case D2, the whole dairy industry

168
collaborated pre- and post-disruption, which enabled FO1 to quickly devise a response
strategy for its SC. It was found that the dairy industry had previously worked on a similar
issue (D1), which enabled it to quickly establish the connections with the stakeholders. After
D1, the dairy industry consortium (DCANZ) became active. It provided a pre-defined
structure for dairy players to discuss such industry-wide disruptions. Similarly, in D4, all the
factors again helped FO1 to establish linkages with stakeholders to respond adequately to
the issue.
Likewise, analysis of D5 and D6 highlighted that FO2 had a good understanding of its SC
network, especially the constraints of its SC partners (such as farmers, distributors and small
retailers). These constraints were linked to various contextual factors, such as operating in
Pakistan where dairy industry is a relatively underdeveloped sector. SC partners such as
farmers, distributors and small retailers have less knowledge or understanding of risks and
crisis management, which undermines their ability to respond to a disruption. FO2 had a
good understanding of these constraints and factored them into its planning. For example,
various SC and risk management strategies, such as the level of buffer stock for FO2’s
downstream SC partners, were centrally channelled from FO2’s head office. Similarly, the
collaborative activities involved other key stakeholders, such as local authorities and NGOs.
Overall, FO2’s understanding of its network and local constraints enabled the company to
establish effective collaboration with the stakeholders.
5.3.4.2. Collaborative Activities
Analysis showed various collaborative activities enabled organisations to deal with
disruptions effectively. For example, in D1 and D2, the stakeholders collaborated to:
share information, such as reactions by international markets and regulators;
engage in joint problem solving and decision making. For example, in D1, it meant
working on a testing regime. In D2, the industry came up with a joint working group
called the “dairy traceability working group”, involving participation by all dairy
companies;
develop a centralised crisis communication strategy, such as joint crisis
communication in D1; and
169
share key lessons with each other, such as the learning from D2 that were shared
among all stakeholders.
Similarly, D3 and D4 highlighted various examples of such collaborative activities between
the industry partners, such as:
During D3, FO1 temporarily procured lactose (the raw material) from its competitors
to resolve the issue. This indicates joint problem solving between competitors.
In D4, the company shared relevant information with its competitors and jointly
worked to resolve the issue holistically.
In the case of FO2’s SC (D5 and D6), the findings suggest various activities, both pre- and
post-disruption, such as:
Information sharing – especially in D5, which involved crisis communication that led
to an early response to the disruption such as early evacuation. Crisis communication
involved sharing pre-warnings as well as valuable information after the disruption.
"So then they (the field team) communicated with the farmers like if they
[farmers] were in the affected areas, we told them the information in advance
to take precautionary measures." (FO2-P1)
Joint problem-solving – in D5 and D6 many farmers worked together and shared
resources to resolve the challenges presented by the disruptions.
Supplier development – in D5, FO2 provided financial support, such as loans and
advance payments to its farming community, which enabled the farmers to survive
and quickly return to their normal operations after the disruption.
Mutual dependency – it was also noted that collaborative efforts between farmers
were moderated by FO2. For example, the field teams connected its farmer
community with each other and represented their role as “connecting the dots”
(FO2-P1). Similarly, the key account manager (FO2-P3) highlighted that during a
disruption like this, the company rationalises the product inventory across its
distribution network, which means sharing additional buffer stock between
distributors. Therefore, it can be inferred that the mutual dependency of SC partners
on its hub firm (FO2) enables collective problem solving between competitors (SC
partners).
170
5.3.4.3. Collaborative Activities in Achieving SC Resilience
With the collaborative activities highlighted above, the relevant organisations collectively
worked on response and recovery efforts, which led to effective management of the
disruption. For example, in D1 and D2, pre-disruption collaboration among the stakeholders
was noted as a critical aspect in effectively dealing with a disruption. Notably, during D1,
before the first press release, a working group, including representation from Fonterra, MPI,
AsureQuality and DCANZ, was formed to work on the issue. This meant that the issue should
have been brought to FO1’s attention, since DCANZ involves members from almost all New
Zealand dairy companies, including FO1. However, FO1 claimed that, before the first press
release, there was no collaboration or information sharing.
“So what happened, prior to the press release, was that [Fonterra] only worked with
MPI, so no other dairy company was involved.” (FO1-P3)
It was analysed that collaboration, before the first press release (D1), between all the dairy
producers, including FO1, would have led to a better response. For example, before the first
press releases, only limited products were tested, which led to a compromised crisis
communication with the media. Better collaboration among all dairy producers would have
led to a more comprehensive response. This type of pre-disruption collaboration was noted
during D2, which led to a better response from FO1’s perspective.
"Yeah after DCD the industry more closer. So in [D2], we all knew before the press
release. So the information was communicated, and all of the industry players did
some of the brainstorming regarding how to handle the situation." (FO1-P2)
Similarly, after D2, the dairy industry collectively worked and developed best practice
around product traceability systems to better deal with future disruptions. The examples of
other disruptions, D3, D4, D5 and D6, highlighted that collaborative activities enable
relevant organisations in a SC to better prepare, respond, recover and learn from a
disruption, thus enhancing SC resilience. Lastly, analysis suggests various levels of
collaboration, horizontal, vertical and intra-organisational.
Horizontal level – horizontal or industry level collaboration involves collaboration
among competitors, regulatory authorities, government authorities and NGOs.

171
Collaboration among competitors is also known as “coopetition” (Bengtsson & Kock,
2000; Osarenkhoe, 2010), which is noted as a critical element in all six SC disruptions.
For example, in D1, D2, D3 and D4, it involved collaboration among New Zealand
dairy competitors. In D5 and D6, it involved collaboration among farmers and
distributors.
Vertical (SC) level – the vertical level involves collaboration among SC partners both
upstream and downstream. For example, in D5 and D6, it involved the collaboration
of FO2 and its suppliers and buyers (distributors and retailers).
Intra-organisational level – this involves collaboration among various functions or
departments within an organisation. Understanding the functional impact of a
disruption is a pivotal driver to decide which functions or teams within a company
need to be involved during a disruption. For example, in D1 and D2, it involved
functions such as quality, sales and customer service, and the SC department
“Right after that [the first press release], we worked in teams like sales,
quality and various other teams.” (FO1-P1)
From the above discussion, it can be concluded that (see Figure 5.5):
SC/network understanding, prior working experience, a pre-established team (such
as an industry consortium, e.g., DCNAZ) and situational awareness regarding local
constraints are the key facets that facilitate effective collaboration.
Active collaboration features information or knowledge sharing, joint problem
solving, centralised communication, synchronised decision making, resource sharing,
and supplier development programmes. These collaborative activities enable an
organisation or SC to better prepare, respond, recover and learn from a disruption.
Various features of such collaboration have been highlighted by previous authors
(Daugherty et al., 2006; Scholten et al., 2014). Additionally, previous authors (Ergun,
Heier Stamm, Keskinocak, & Swann, 2010; Jüttner & Maklan, 2011; Pettit et al.,
2010; Scholten & Schilder, 2015) have attributed collaboration as a key source in
achieving SC resilience.
Lastly, though previous studies discussed various features of effective collaboration,
this study reflects on the various levels of collaboration: horizontal, vertical and
intra-organisational. Furthermore, previous researchers stressed more on
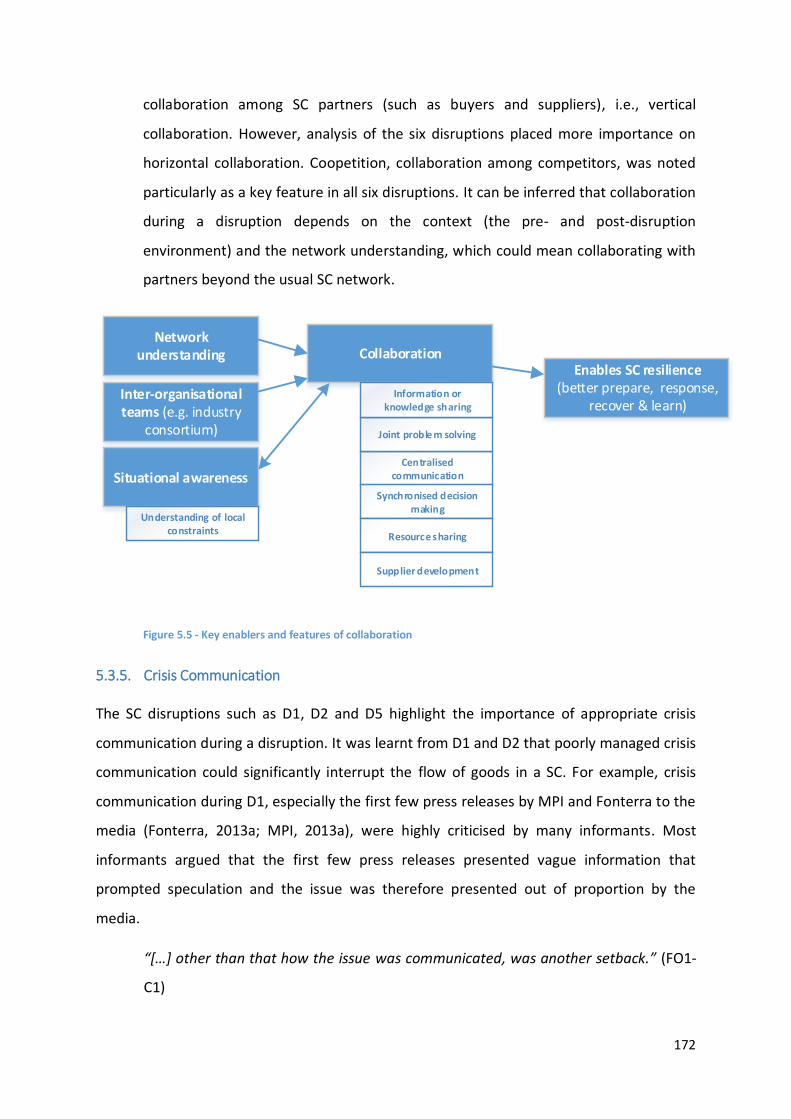
172
collaboration among SC partners (such as buyers and suppliers), i.e., vertical
collaboration. However, analysis of the six disruptions placed more importance on
horizontal collaboration. Coopetition, collaboration among competitors, was noted
particularly as a key feature in all six disruptions. It can be inferred that collaboration
during a disruption depends on the context (the pre- and post-disruption
environment) and the network understanding, which could mean collaborating with
partners beyond the usual SC network.
Situational awareness
Collaboration
Understanding of local constraints
Network understanding
Centralised communication
Joint proble m solving
Information or knowledge sharing
Synchronised decision making
Resource sharing
Inter-organisational teams (e.g. industry
consortium)
Supplier development
Enables SC resilience(better prepare, response,
recover & learn)
Figure 5.5 - Key enablers and features of collaboration
5.3.5. Crisis Communication
The SC disruptions such as D1, D2 and D5 highlight the importance of appropriate crisis
communication during a disruption. It was learnt from D1 and D2 that poorly managed crisis
communication could significantly interrupt the flow of goods in a SC. For example, crisis
communication during D1, especially the first few press releases by MPI and Fonterra to the
media (Fonterra, 2013a; MPI, 2013a), were highly criticised by many informants. Most
informants argued that the first few press releases presented vague information that
prompted speculation and the issue was therefore presented out of proportion by the
media.
“[…] other than that how the issue was communicated, was another setback.” (FO1-
C1)

173
“But I think, the whole thing was badly managed and communicated to the media.”
(FO1-P8)
In D2, analysis highlights that the total of 219 words of media communication (first press
release) by MPI lacked various critical details. Similarly, in D5 and D6, early crisis
communication to stakeholders (such as farmers and distributors) enabled early execution
of various strategies, such as early evacuation before the disruption. These examples show
that better crisis communication positively influences response activities, whereas, poorly
managed crisis communication can confuse stakeholders and compromise response.
This section first highlights various lessons regarding crisis communication from D1 and D2.
This analysis provides the key components of effective crisis communication that facilitates
better management of a disruption.
As both of these crisis communications were related to food safety issues, therefore the
guidelines from the Food and Agriculture Organization (FAO) (DIA, 2014; FAO, 1998) should
have been used. According to FAO, a crisis communication should show:
Full knowledge of the problem (i.e., a food safety issue)
The risks involved and knowledge of the potentially affected products
Consumer advice
Measures being taken to control and avoid the issue
Overall, effective crisis communication would answer all or most of the queries of the
stakeholders or, in other words, do not lead to confusion or misunderstanding. Grounded
on these principles the content of both press releases was analysed as shown in Table 5.10.

174
Table 5.10 – Analysis of crisis communication for D1 and D2
Guidelines for Crisis Communication – Food Safety Issue (DIA, 2014; FAO, 1998)
D1 – DCD Issue 1st Press Release by MPI (MPI,
2013a)
D2 – Botulism Case 1st Press Release (MPI)
Comments Complies with the FAO guidelines (√) or missing (X)
Comments Complies with the FAO guidelines (√) or missing (X)
What is known about the food safety issue?
Generic statement The issue considered a non-food safety issue
Very generic, broad statement
X
Risk involved with the contaminated products
Not clearly identified
X Very generic broad statement
X
Contaminated or affected products
No detail provided X No detail provided
X
Measures taken to control the crisis
No measures were identified for potentially affected products
X No clear steps, work-in-progress
X
The source of the contaminated food
Identified Clearly Identified
What to do with any suspected product with consumers – health advice
Considered as a non-food safety issue.
X No direction X
Preventive measures taken to eliminate further spread
Identified and executed
Work-in-progress
X
Information or contact details for further information
General Helpline General Helpline
With D1, the first press release had a number of flaws including a vague statement
regarding the issue and a lack of scientific evidence. For example, it did not present details
of the tested products nor what low level DCD residues meant in a finished product or for
human consumption. Many respondents believed that the lack of proper crisis
communication created confusion among the media (both domestic and international) and
regulatory authorities. In contrast to the first press release, the final media communication
presented all the critical information regarding the issue, such as a number of samples
tested from all major dairy companies and the test results. It was noted that the final press
release solved most of the concerns of stakeholders and the situation started to normalise.

175
Similarly, in D2, the first press release lacked critical details, such as no specific details of the
products affected because of the incident, the steps taken to deal with the situation, the
health risk involved and possible advice to the general public. Many informants argued that
the first press release led to a “PR disaster” and vague information was noted as the key
culprit.
“Then the crazy thing was when they did choose to announce, after all that time they
still do not have the data that how much product was affected, where it go and has it
been used or not.” (FO1-P2)
The above comparison highlights (see Table 5.10) that at-large, critical, concrete information
regarding the issue was missing in both press releases, which intensified the scale of these
disruptions. For example, for D2, this lack of information triggered a plethora of questions
and confusion from both local and international media, as indicated in the news reports
(Bloomberg, 2013; Fox, 2013b; Guardian, 2013a; Locke, 2013; Newshub, 2013a). This
ultimately disrupted the SC operations of almost all New Zealand dairy companies, because
it was regarded as a country-wide issue.
These two disruptions highlight various reasons that lead to such vague information and the
key lessons regarding effective crisis communication. With D1, before the first press release,
the working group involving various stakeholders, did not anticipate the potential impact on
the other dairy players. Considering that had the working group, before the first press
release, analysed and anticipated the situation more holistically, then there might have
been comprehensive preparation, such as product testing by all other dairy players and
proper media communication.
“Well, other dairy players should have been involved from the start. […] and it would
have led to quick and better communication with the buyers [FO1’s buyers], we
would have worked on product traceability and testing regime in advance, and avoid
overwhelming response from different markets.” (FO1-P2)
With D2, the inquiry report (DIA, 2014) highlighted that a proper risk assessment and
decision-making process, based on scientific evidence, should have been adopted by MPI
and Fonterra before the first press release. For example, the first laboratory report on the C.
botulinum test stated it as “likely to be C. botulinum”, and “other close relatives cannot be

176
ruled out”. Furthermore, the test was done only for research purposes (DIA, 2014).
However, Fonterra considered it a positive indication and informed MPI about the test as
“confirmed C. botulinum” (DIA, 2014). It can be claimed that any second opinion or detailed
testing at this stage would have provided more depth regarding the issue.
Secondly, the missing information from the first press release and conflicting information in
the following press releases during D2, were caused by the unavailability of information
regarding the affected products and batches, which directly relates to product traceability
systems (further discussed in Section 5.3.8).
Here it can be concluded that adequate situational awareness including proper anticipation
of possible reactions, the scientific decision-making process and proper risk assessment
would lead to better understanding of an issue, which would enable stakeholders to prepare
better and present appropriate crisis communications. Additionally, having updated IT
systems and information (product traceability systems) can play a critical role in devising an
appropriate crisis communication. Lastly, effective crisis or media communication should
include all necessary information, such as affected products or batches, health risks and
steps taken, to avoid any confusion among the general public. Figure 5.6 shows the key
enablers and features of effective crisis communication.
Situational awareness Crisis communication
Knowledge of the problem
Risks involved
Contaminated or affected products
Preventive measures taken to control the crisis
The source of contaminated food
Health advice
Details for further information
Decision making
Root cause analysis
IT systems
Product traceability systems
Scientific decis ion-making
Enables SC resilience(effective response
and recovery)
Figure 5.6 - Key enablers and features of effective crisis communication

177
5.3.6. Operational/SC Re-engineering
Analysis of all six disruptions highlights various examples of modifications, improvements or
changes in several SC processes and operations, which is referred as operational or SC re-
engineering. Mainly, these adjustments focus on maintaining or restoring the flow of goods
or services in response to a disruption.
For example, during D1 several buyers required FO1 and other New Zealand dairy
companies to come up with a specific testing method for DCD to resolve the problem. The
extra testing was considered a change in existing requirements for which FO1 had to adjust
associated processes. Similarly, in D2, the quality department was required to develop and
execute a testing regime for C. botulinum. During D3, FO1 had to change its sourcing
strategy by quickly adding new suppliers to fill the gap caused by the port shutdown. This
affects changes in other operations, such as the raw material approval process and
warehousing and logistics operations. All of these adjustments and changes focused on
maintaining the flow of goods in the SC, hence responding and restoring the operations
during a disruption, which is a key characteristic of ensuring SC resilience. Table 5.11
highlights the key operational/SC re-engineering activities learnt from each disruption.
Table 5.11 – Operational/SC re-engineering activities learnt from each disruption
Disruptions Operational/SC Re-engineering Activities
D1 – DCD issue o Testing method and changes in associated processes o Rerouting of finished products (temporarily) o Market expansion
D2 – Botulism scare o Testing method and changes in associated processes o Market expansion o Improvement in product traceability systems
D3 – Shortage of a critical raw material (lactose)
o Sourcing from a new supplier and changes in the associated procurement process
o Revision of sourcing and inventory strategy after the disruption
D4 - Operational issue (product hold)
o Execution of alternative delivery options o Continuous improvement in existing processes and
systems
D5 - Flood 2010 o Reallocation of various critical operations o Use of an alternative production process (postponement) o Supplier base expansion
D6 - Foot and mouth disease (FMD)
o Use of alternative production process (postponement)
178
Christopher and Peck (2004) describe SC re-engineering as designing SC operations with the
aim to reduce potential risk. The authors described SC understanding, supply base strategy
and SC design principles as key sub-factors that enable an organisation to design SC
operations to combat an uncertain event. Mainly, the supply base strategy and SC design
principles involve building up flexibility in operations (such as multiple sourcing and
postponement) or redundancy (such as slack capacity and buffer stock) (Christopher & Peck,
2004; Pettit et al., 2010; Sheffi & Rice, 2005).
Though these researchers emphasise designing these principles into the SC before a
disruption, the analysis of all six disruptions highlighted that in addition to developing pre-
existing strategies, companies are often required to adjust or adopt new processes during a
disruption. For example, in response to D1, FO1 had to initiate a new testing requirement in
its operations. This required the company to update various associated activities (such as
export documentation). Similarly, with D2, FO1 needed to perform additional testing
(against botulism), which required modifications to various processes. In D3, FO1 added a
few new supply sources to manage shortages from its existing supply network.
It can be concluded that a combination of both pre-existing SC strategies and the
introduction of new processes enables an organisation or SC to maintain the flow of
products and effectively respond to and recover from a disruption. Analysis highlighted
various pre-existing SC strategies that enable an organisation to re-engineer or adjust its
processes quickly to manage a disruption. Chapter 4 discussed various pre-existing SC
strategies linked to both focal organisations (see Table 4.1 and Table 4.3). The following
discussion highlights few of these pre-existing strategies noted in all six SC disruptions.
First, buffer stock or redundant resources were noted as a prominent strategy that allows
an organisation to deal quickly with the various challenges presented by a disruption. In the
literature, this is referred to as redundancy (Christopher & Peck, 2004; Sheffi & Rice, 2005;
Zsidisin & Wagner, 2010). It was recognised that this pre-existing strategy provides extra
time (Zsidisin & Wagner, 2010) and an opportunity to evaluate various options during a
disruption. For example, in D3, FO1 had four weeks of buffer stock of lactose to cover for
periods of shortage. Similarly, in D5 and D6, FO2 had various redundant resources (such as
buffer stock at various levels of the SC) to manage shortages during the disruptions.

179
Though these redundancy options provide an organisation additional time, the primary task
during a disruption is to explore the options. For example, in D3, FO1’s approach to quickly
adjust its sourcing strategy by adding new sources of lactose supply enabled the company to
avoid the disruption. Similarly, in D5, FO2 used an alternative production process, also
referred to as a postponement strategy, that enabled the company to cover storage by
maintaining production levels. Such pre-existing strategies are also known as flexibility
(sourcing flexibility and production flexibility) (Pettit et al., 2010; Sheffi & Rice, 2005).
Along with redundancy and flexibility, various other pre-existing strategies such as pre-
defined product traceability systems and updated IT systems enable an organisation to
quickly adjust its operations to meet the challenges of a disruption. For example, in D1 and
D2, FO1 had adequate product traceability systems before these disruptions, which enabled
the company to quickly trace its products in the SC. Similarly, in D5, FO2 had adequate IT
systems before this disruption, which enabled it to have visibility of finished products across
its downstream SC. It was noted that companies build these processes and SC operations
before a disruption and apply a combination of these strategies by analysing the distinct
requirements and challenges of a disruption.
Analysis also highlighted that a company identifies and analyses various processes by
analysing the post-disruption situation, which could be a bottleneck during a disruption, and
therefore expedite these processes to facilitate a fast response and recovery. For example,
in D4, FO1 used another transport option to expedite the shipping time to its customers.
Similarly, during D5, FO2 quickly transported maximum finished products to its distribution
network and relocated its finished products between distributors. The updated IT systems
enabled FO2 to quickly determine stock levels and optimal requirements of each distributor.
It can be concluded that various pre-existing strategies such as pre-defined processes and
systems, updated IT systems, redundancy (such as buffer stock) and flexibility (such as
sourcing flexibility) enable a company to quickly and effectively deal with a disruption, thus
achieve SC resilience (Craighead et al., 2007; Pettit et al., 2010; Sheffi & Rice, 2005; Zsidisin
& Wagner, 2010). Secondly, adequate situational awareness enables an organisation to use
a combination of these strategies, which may result from adjusting existing processes or
introducing a new process to manage a disruption effectively. Figure 5.7 presents the key
enablers and activities of operational/SC re-engineering.
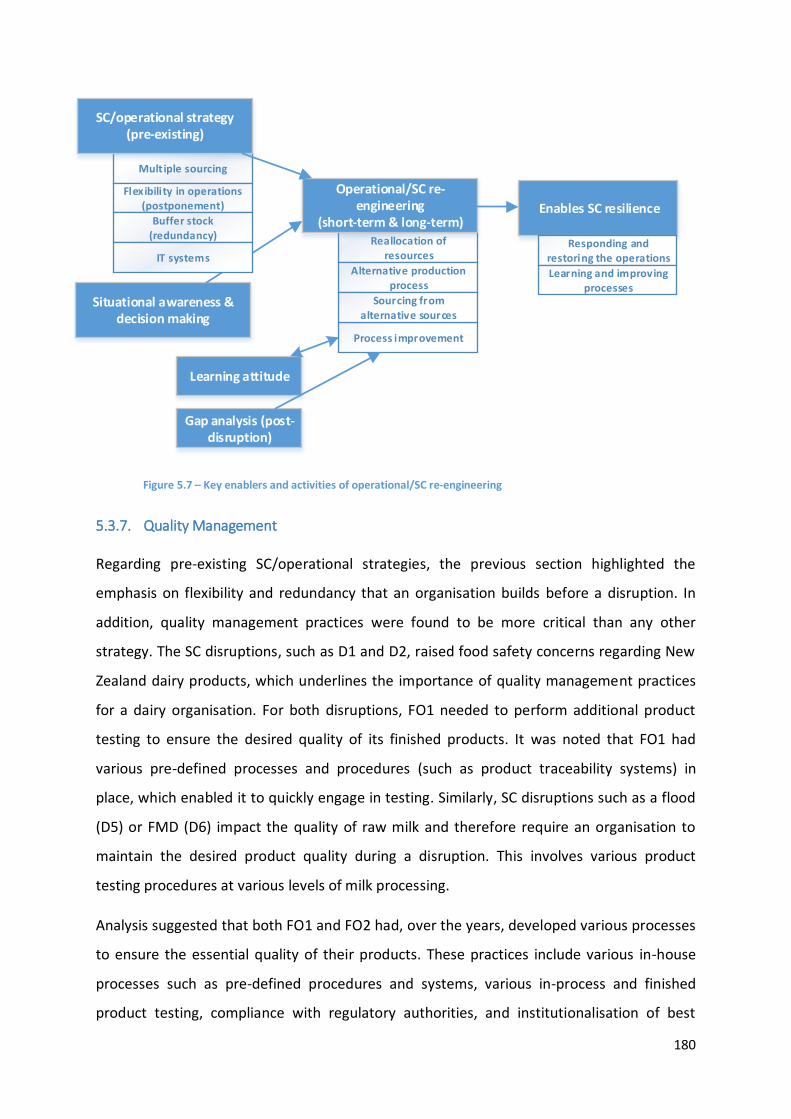
180
Reallocation of resources
Mult iple sourcing
Flexibility in operations (postponement)
Operational/SC re-engineering
(short-term & long-term)
SC/operational strategy (pre-existing)
Process improvement
Buffer stock (redundancy)
Situational awareness & decision making
Alternative production process
Sourcing from alternative sources
Learning attitude
Gap analysis (post-disruption)
IT systems
Enables SC resilience
Responding and restoring the operations
Learning and improving processes
Figure 5.7 – Key enablers and activities of operational/SC re-engineering
5.3.7. Quality Management
Regarding pre-existing SC/operational strategies, the previous section highlighted the
emphasis on flexibility and redundancy that an organisation builds before a disruption. In
addition, quality management practices were found to be more critical than any other
strategy. The SC disruptions, such as D1 and D2, raised food safety concerns regarding New
Zealand dairy products, which underlines the importance of quality management practices
for a dairy organisation. For both disruptions, FO1 needed to perform additional product
testing to ensure the desired quality of its finished products. It was noted that FO1 had
various pre-defined processes and procedures (such as product traceability systems) in
place, which enabled it to quickly engage in testing. Similarly, SC disruptions such as a flood
(D5) or FMD (D6) impact the quality of raw milk and therefore require an organisation to
maintain the desired product quality during a disruption. This involves various product
testing procedures at various levels of milk processing.
Analysis suggested that both FO1 and FO2 had, over the years, developed various processes
to ensure the essential quality of their products. These practices include various in-house
processes such as pre-defined procedures and systems, various in-process and finished
product testing, compliance with regulatory authorities, and institutionalisation of best
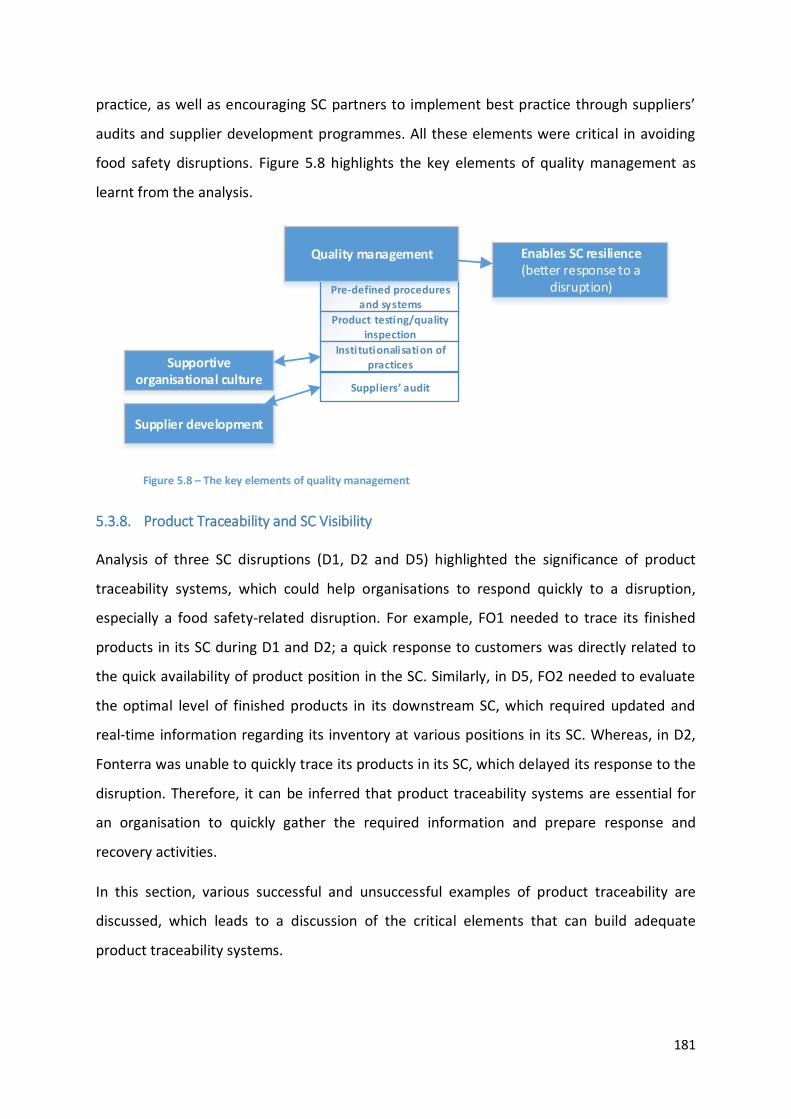
181
practice, as well as encouraging SC partners to implement best practice through suppliers’
audits and supplier development programmes. All these elements were critical in avoiding
food safety disruptions. Figure 5.8 highlights the key elements of quality management as
learnt from the analysis.
Pre-defined procedures and systems
Quality management
Suppliers’ audit
Product testing/quality inspection
Institutionalisation of practices Supportive
organisational culture
Supplier development
Enables SC resilience(better response to a
disruption)
Figure 5.8 – The key elements of quality management
5.3.8. Product Traceability and SC Visibility
Analysis of three SC disruptions (D1, D2 and D5) highlighted the significance of product
traceability systems, which could help organisations to respond quickly to a disruption,
especially a food safety-related disruption. For example, FO1 needed to trace its finished
products in its SC during D1 and D2; a quick response to customers was directly related to
the quick availability of product position in the SC. Similarly, in D5, FO2 needed to evaluate
the optimal level of finished products in its downstream SC, which required updated and
real-time information regarding its inventory at various positions in its SC. Whereas, in D2,
Fonterra was unable to quickly trace its products in its SC, which delayed its response to the
disruption. Therefore, it can be inferred that product traceability systems are essential for
an organisation to quickly gather the required information and prepare response and
recovery activities.
In this section, various successful and unsuccessful examples of product traceability are
discussed, which leads to a discussion of the critical elements that can build adequate
product traceability systems.

182
One key stakeholder during D2 (botulism issue) was Fonterra, which found it difficult to
trace the affected products in its SC, especially during the initial stages of the issue. As
highlighted by the inquiry report (DIA, 2014), because of this issue multiple revisions were
made regarding the exact amount of affected product. Fonterra’s inability to quickly trace
the affected products ultimately compromised the crisis communication, as highlighted in
Section 5.3.5. The analysis suggested the following possible reasons for Fonterra’s inability
to trace its products;
During the time of this issue, Fonterra’s plants associated with this disruption were
changing their systems from manual to fully computerised SAP systems (DIA, 2014).
More importantly, during an IT switchover, staff members need to understand how
the changes affect their day-to-day operations. However, during Fonterra’s
switchover (DIA, 2014), the staff’s inability to input correct details into the new
system led to a misrepresentation of product details. It can be inferred that proper
training for the IT changeover would have helped the relevant staff to input the
required information accurately into the system.
Based on this discussion, one can only conclude that the system switchover played a
critical part in Fonterra’s inability to quickly and accurately trace the affected
products in its SC. Had this incident happened during the previous system or after
full implementation of the new system, Fonterra’s ability to get the required product
information would have been different and possibly better. The literature on IT
system switchover presents similar operational and SC challenges. For example, the
Nike IT implementation (1999-2001) and the Levi Strauss IT revamp (2003-2008)
highlight that the switchover period is the most critical point during such IT
implementation projects (Flyvbjerg & Budzier, 2011).
For these reasons, Fonterra was unable to quickly trace its finished products, which
compromised the first crisis communication (as highlighted in Section 5.3.5) and led to a
delayed response.
On the other hand, during both D1 and D2, FO1 was also required to track the finished
products in its downstream SC, especially products destined for specific markets. It was
found that FO1 was able to quickly get the required product information in its SC for both

183
disruptions. Many informants associated this with reliable IT systems and procedures
implemented before these disruptions.
“For us, it was quite easy to get that information as we have all the information in
our systems to track down that and then essentially have samples of all of these
products here.” (FO1-P1)
As discussed in the previous chapter, FO1 had systems and processes that identify how
information from its upstream SC partners, such as raw material suppliers and downstream
SC partners, are stored and integrated into its IT systems. This enabled it to quickly retrieve
the required information when it was needed during the disruption.
It was also found that FO1’s regular training of its staff and simulation (mock) exercises of
product recall played a definite role in embedding the practices in the organisation. These
training sessions led staff to understand their roles and responsibilities during highly
complex, uncertain situations, such as a product recall. Secondly, these mock product recalls
would have integrated FO1’s systems with those of its SC partners, which enabled FO1 to
build information visibility across its SC.
“We have done a mock recall recently, [in which we] identified [a] product and then
we had gone to, like to our customers, that we are doing a mock recall and you tell us
this is the lot number. Can you tell us where that product is? Where it has gone?
Because they need to do that in their systems as well.” (FO1-P1)
Similarly, with FO2, the company uses a standardised IT system for its distribution network.
That integrates all information at different distributors with FO2’s own system. This creates
information visibility among the SC partners and enables FO2 to monitor real-time
information of its finished products in its downstream SC. This helped FO2 during D5 to
quickly rationalise and reallocate optimal levels of inventory in its downstream SC.
Finally, it can be inferred that quick product traceability during a disruption encompasses
the following enablers that help organisations to build information visibility across its SC and
enable quick responses to a disruption (summarised in Figure 5.9)
Pre-defined procedures and robust IT systems
Real-time information sharing
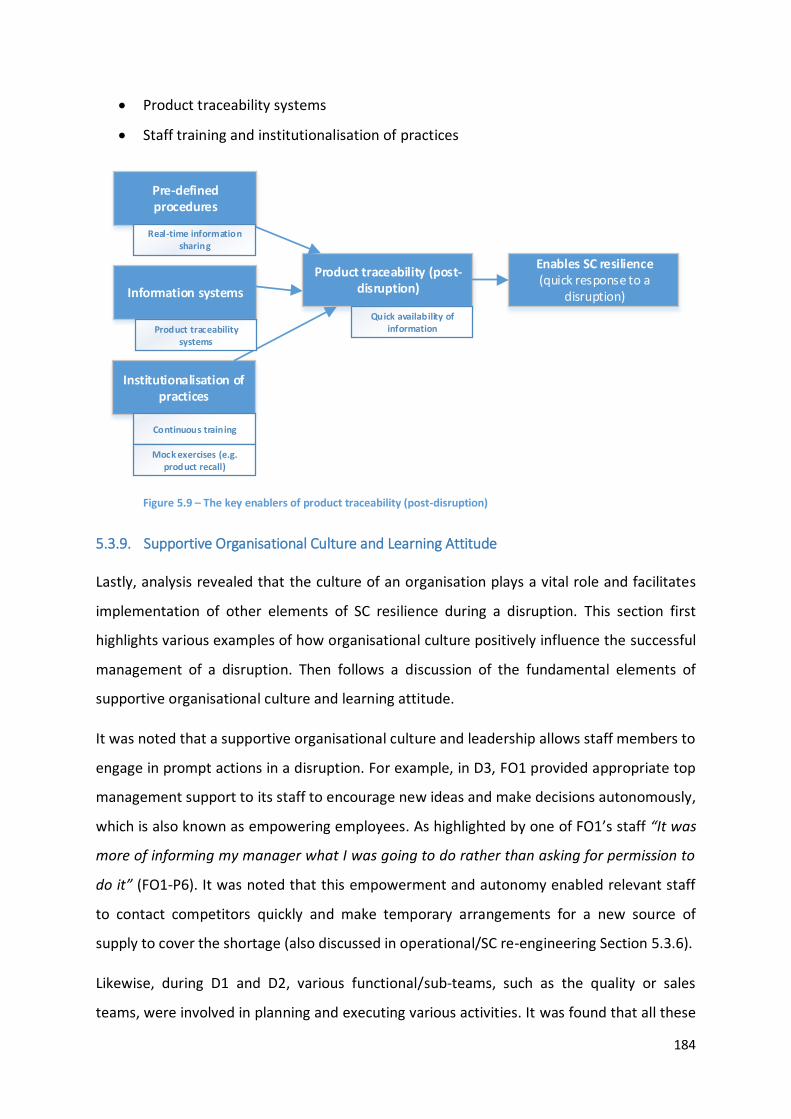
184
Product traceability systems
Staff training and institutionalisation of practices
Pre-defined procedures
Product traceability (post-disruption)Information systems
Institutionalisation of practices
Quick availability of information
Continuous training
Mock exercises (e.g. product recall)
Real-time information sharing
Product traceability systems
Enables SC resilience(quick response to a
disruption)
Figure 5.9 – The key enablers of product traceability (post-disruption)
5.3.9. Supportive Organisational Culture and Learning Attitude
Lastly, analysis revealed that the culture of an organisation plays a vital role and facilitates
implementation of other elements of SC resilience during a disruption. This section first
highlights various examples of how organisational culture positively influence the successful
management of a disruption. Then follows a discussion of the fundamental elements of
supportive organisational culture and learning attitude.
It was noted that a supportive organisational culture and leadership allows staff members to
engage in prompt actions in a disruption. For example, in D3, FO1 provided appropriate top
management support to its staff to encourage new ideas and make decisions autonomously,
which is also known as empowering employees. As highlighted by one of FO1’s staff “It was
more of informing my manager what I was going to do rather than asking for permission to
do it” (FO1-P6). It was noted that this empowerment and autonomy enabled relevant staff
to contact competitors quickly and make temporary arrangements for a new source of
supply to cover the shortage (also discussed in operational/SC re-engineering Section 5.3.6).
Likewise, during D1 and D2, various functional/sub-teams, such as the quality or sales
teams, were involved in planning and executing various activities. It was found that all these
185
teams worked autonomously and were aligned with the direction set by FO1’s crisis
management team. For example, during both disruptions, FO1 needed to work on a testing
regime. The quality team worked with the relevant teams to decide on the testing regime
and schedule. It was noted that top management provided full support and complimented
the efforts of the quality team. Similarly, in D4, the warehousing and transport team needed
to solve issues with additional inventory; the manager concerned worked on various
solutions with the support of top management. The team decided to hire additional space
from a competitor with the help of its third-party logistics company. It was noted that all
these decisions were decentralised to the department level, which led to a quick response
from the individual teams.
In addition to autonomy and empowerment, communication and information sharing
between the teams and with the crisis management team were observed as fundamental
characteristics of a supportive organisational culture. It was noted that FO1 encourages
open communication between departments, which helps in the exchange of critical
information during a disruption. One informant (FO1-P12) highlighted that the issue was
communicated by “just talking up at the coffee machine”. This shows a low barrier level
between departments and the issue quickly went to the right person in the organisation. It
was also noted that FO2 encourages cross-departmental training to allow quick information
sharing during a disruption.
“We have an open type of environment while dealing with any situation […] like if
milk supply team is facing any problem, then we openly tell the planning team to
avoid any negative implications.” (FO2-P1)
It was noted that this open communication allows members of the organisation to
understand the key impacts of any decision-making on other departments, which becomes
critical during the implementation of a response or recovery plan.
"So there is always a general understanding that any decision that is not just related
to production or procurement to say alone that let’s do this. Because there is a
customer implication. So there is a general understanding that one decision can
affect others in the organisation, so let’s discuss with them in advance." (FO1-P12)

186
Similarly, a supportive organisational culture entails open and transparent communication
with stakeholders. In was noted that FO1 maintained open communication with all of its
stakeholders such as buyers. For example, in D4, FO1 openly and regularly shared key
information with its most concerned buyers.
"Well, with the customers that were impacted the most, we had face-to-face
meetings with them to explain and to make sure they have a good understanding of
why the issue happened. […] So I guess that would have given them enough
confidence that something is going on. But it is still a disruption, so I guess
maintaining a good communication loop would erode some of the anxiety." (FO1-P4)
Likewise, it was noted that FO1 initiated a debate at DCANZ to resolve the issue holistically,
which meant sharing information with its competitors. It was learnt that openness in
sharing information and exploring a silver lining to resolve a mutual problem was observed
as an integral part of New Zealand’s business culture.
“I think it is more related to the openness and helping out each other during those
difficult situations rather than gaining any financial benefit out of it." (FO1-P9)
This openness and transparency among the stakeholders enabled quick communication and
information sharing. This enabled stakeholders to understand the post-disruption
environment (referred as situational awareness in Section 5.3.3) and encouraged them to
work collectively on response and recovery activities (referred as collaboration in Section
5.3.4).
In contrast to FO1’s culture, in D2, the inquiry report (DIA, 2014) highlighted several
reservations over the risk culture of Fonterra, particularly criticising the escalated process
that lacked the quick communication of the issue from a staff member to relevant managers
or top management. Whereas, as highlighted above, information sharing and the escalation
process in FO1 was noted at an optimal level. Similarly, during D5 and D6, analysis
suggested that FO2’s SC partners (such as farmers), who were open to sharing resources
and information with each other were the ones who benefited more and were able to
recover quickly. Therefore, it can be concluded that the supportive culture of an
organisation enables quick situational awareness and collaboration among the stakeholders,
which leads to planning and implementation of response and recovery efforts.

187
Analysis also showed various ways to build a supportive culture in an organisation. For
example, in FO2, to develop a cohesive culture within the organisation, it was noted that the
top management regularly engages in various cross-functional training. Primarily, this cross-
training allowed various teams to understand the impact of decision-making on other
departments during a disruption. The informants (FO2-P1 & FO2-P2) from FO2 highlighted
that top management support and cross-functional training enabled them to be more open
and to make informed decisions during these kinds of disruptions (D5 & D6).
Similarly, in FO1, the company regularly engages in training exercises to develop effective
leadership and a team-oriented culture. These training sessions involved people from lower
staff to top management. Additionally, during data collection, it was noted that specific
policies and facilities for managerial and production staff were part of the top
management’s commitment to developing a cohesive culture from top to bottom.
Furthermore, to embed and institutionalise these practices, both FO1 and FO2 regularly
engage in simulation exercises (e.g., a product recall). For example, FO2 tests its risk
management plans, such as flood contingency planning, in collaboration with relevant SC
partners. As these exercises usually involve other SC partners, this also promotes a risk
culture among those SC partners. Secondly, these simulation exercises also prepare relevant
staff, which helps them to engage quickly in response operations during a disruption.
Lastly, a learning attitude was noted as a critical aspect of organisational culture. For
example, FO1 learnt from D1 and D2 and improved various operations, such as the company
diversified its customer base by spreading its customer base more evenly to different
countries, which reduced the risk of serving only one big customer or market. FO1 also
improved and strengthened its traceability operations. Similar learning was noted at the
dairy industry level, where the whole industry got closer after this disruption. This led to
future collaboration among the dairy players at the industry consortium (DCANZ) to deal
with such kinds of industry-wide issues. After D2, the New Zealand dairy industry
established a working group to develop best practice around product traceability systems.
Similarly, with FO2, the example of the 2010 flood (D5) enabled FO2 and its SC partners to
analyse and improve their operations. This showed learning and continuous improvement
behaviour that led FO1 to develop and improve various in-house processes and SC

188
operations to deal with future disruptions. It can be inferred that a learning attitude enables
an organisation to reflect on key lessons from a disruption and accordingly improve various
processes to safeguard against future disruptions.
Regarding the literature, various authors (Christopher & Peck, 2004; Pettit et al., 2013;
Sheffi & Rice, 2005) suggest that top management support is a crucial facet to cultivate a
supportive culture in an organisation, which is essential to achieve SC resilience. Meshkati
and Khashe (2015, p. 90) highlight that “Without understanding the vital role of human and
organizational factors” in an unexpected event, “recovery will be a sweet dream and
resiliency will only be an unattainable mirage”.
Therefore, in line with the findings of this study, it can be concluded that the right
organisational culture is fundamental to facilitate various SC resilience elements, such as
situational awareness and decision-making, collaboration with key stakeholders and
operational/SC re-engineering by learning from a disruption. A supportive organisational
culture includes various sub-elements such as an open culture, empowerment, top
management support, the institutionalisation of practices and continuous training. The
learning attitude of an organisation includes sub-elements such as learning from
mistakes/previous experience, review teams, gap analysis and continuous improvement,
which enable an organisation to strengthen its ability to avoid or effectively manage future
disruptions. Figure 5.10 presents the key features of a supportive organisational culture and
learning attitude and the linkages with other SC resilience elements.

189
Empowerment
Top management support
Supportive organisational culture
Situational awareness and decision making
Operational/SC re-engineering
Collaboration
Institutionalisation of practices
Open culture
Contin uous training
Learning attitude
Review teams
Gap analysis
Contin uous improvement
Learning from mistakes/previous experience
Enables SC resilience(better prepare, response,
recover & learn)
Figure 5.10 – Key features of a supportive organisational culture and learning attitude
SC Resilience Elements
In summary, SC resilience elements refer to the guiding principles that enable an
organisation or SC to better prepare, respond, recover and learn from a disruption. Section
5.3 highlighted various elements identified as a result of the analysis of all six disruptions.
Table 5.12 summarises the SC resilience elements, their definitions and sub-elements.
Table 5.12 – SC resilience elements, definitions and sub-elements
SC Resilience
Elements
Definitions Sub-elements
Crisis
management
team
Involves top management
to timely and effectively
deal with response and
recovery operations
Deployment of a crisis management team, cross-
functional teams, multiple level teams, adaptation of
team structure, escalation process
Risk
management
Involves activities to
foresee, plan and prepare
for a potential disruption
SC risk analysis and planning, pre-defined team
structure, pre-defined communication structure, pre-
defined roles and responsibilities, simulation/mock
exercises (e.g., product recall)
Situational
awareness &
Ability to understand the
environment and make
Continuous updates and information sharing, analysing
the situation (comprehending & projecting), monitoring
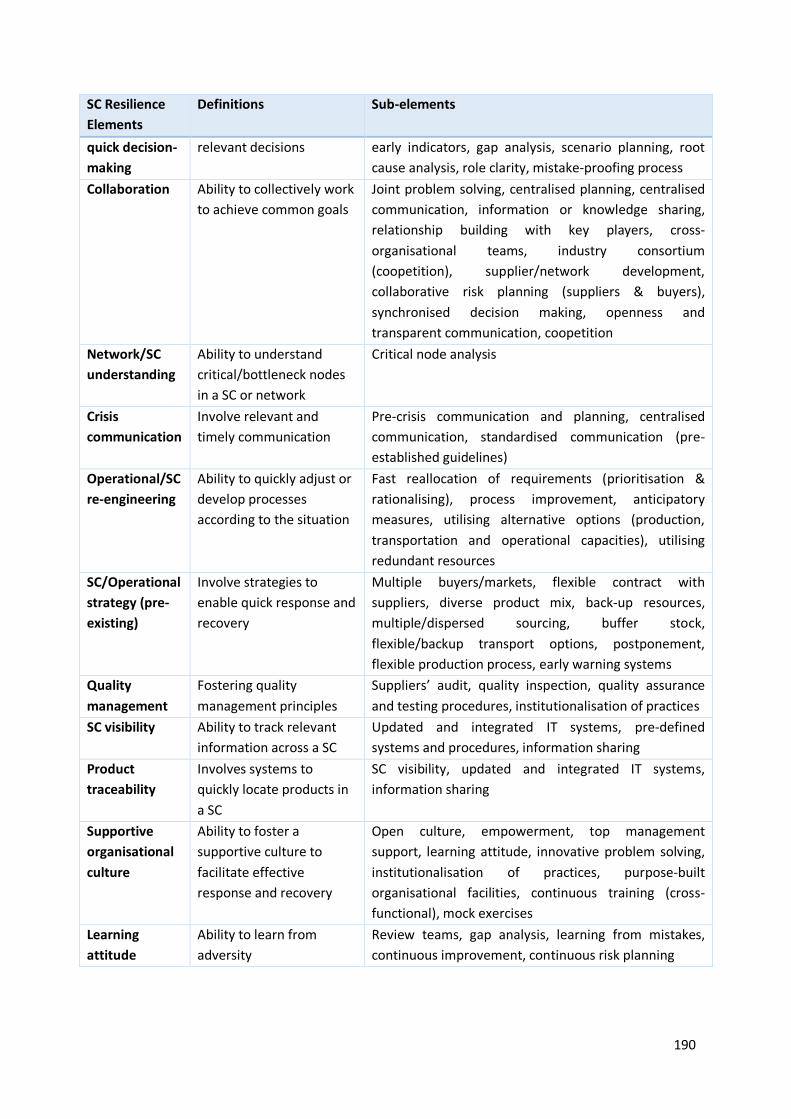
190
SC Resilience
Elements
Definitions Sub-elements
quick decision-
making
relevant decisions early indicators, gap analysis, scenario planning, root
cause analysis, role clarity, mistake-proofing process
Collaboration Ability to collectively work
to achieve common goals
Joint problem solving, centralised planning, centralised
communication, information or knowledge sharing,
relationship building with key players, cross-
organisational teams, industry consortium
(coopetition), supplier/network development,
collaborative risk planning (suppliers & buyers),
synchronised decision making, openness and
transparent communication, coopetition
Network/SC
understanding
Ability to understand
critical/bottleneck nodes
in a SC or network
Critical node analysis
Crisis
communication
Involve relevant and
timely communication
Pre-crisis communication and planning, centralised
communication, standardised communication (pre-
established guidelines)
Operational/SC
re-engineering
Ability to quickly adjust or
develop processes
according to the situation
Fast reallocation of requirements (prioritisation &
rationalising), process improvement, anticipatory
measures, utilising alternative options (production,
transportation and operational capacities), utilising
redundant resources
SC/Operational
strategy (pre-
existing)
Involve strategies to
enable quick response and
recovery
Multiple buyers/markets, flexible contract with
suppliers, diverse product mix, back-up resources,
multiple/dispersed sourcing, buffer stock,
flexible/backup transport options, postponement,
flexible production process, early warning systems
Quality
management
Fostering quality
management principles
Suppliers’ audit, quality inspection, quality assurance
and testing procedures, institutionalisation of practices
SC visibility Ability to track relevant
information across a SC
Updated and integrated IT systems, pre-defined
systems and procedures, information sharing
Product
traceability
Involves systems to
quickly locate products in
a SC
SC visibility, updated and integrated IT systems,
information sharing
Supportive
organisational
culture
Ability to foster a
supportive culture to
facilitate effective
response and recovery
Open culture, empowerment, top management
support, learning attitude, innovative problem solving,
institutionalisation of practices, purpose-built
organisational facilities, continuous training (cross-
functional), mock exercises
Learning
attitude
Ability to learn from
adversity
Review teams, gap analysis, learning from mistakes,
continuous improvement, continuous risk planning

191
One key finding that emerged from the previous section was that firms build various
elements before a disruption, which helps them successfully manage and respond to a
disruption. For example, the discussion on the crisis management team and risk
management (5.3.1 and 5.3.2) highlighted that firms build various risk management
practices, such as a pre-established team structure, that enables them to quickly deploy a
crisis management team during a disruption. Similarly, robust IT systems, information
visibility and product traceability systems before a disruption enable firms in a SC to quickly
gather the required information regarding products in a disruption, such as a food safety
disruption (Section 5.3.8). This finding brought out two major categories of SC resilience
elements, proactive and reactive.
5.4.1. Pre-disruption – Proactive Elements
A pre-disruption stage is a period in which a firm aims to build and enhance its ability to deal
with an unexpected event. The analysis suggested various SC resilience elements that reflect
an organisation’s efforts to build its ability to deal with a potential disruption. For example,
organisations work on various risk management activities such as pre-defined team
structure and communication structure before a disruption, which enables quick
deployment of these activities after a disruption (as highlighted in Sections 5.3.2 & 5.3.4).
Similarly, SC disruptions such as D1 and D2 highlighted that having an effective industrial
consortium and pre-defined team structure before a disruption enable the required
collaboration among industry partners to deal with an industry-wide issue (5.3.4).
Based on these arguments, this study classifies various SC resilience elements from Table
5.12 as proactive elements that an organisation or SC builds before a disruption
(summarised in Table 5.13).
5.4.2. Post-disruption – Reactive Elements
Similarly, analysis of all six disruptions highlighted various activities opted for by both FO1
and FO2 with their SC or network partners to deal with post-disruption challenges. Mainly,
these activities allow an organisation to understand the post-disruption environment and
then enable managers to choose appropriate strategies to deal with a disruption and attain
normal operational performance. All these post-disruption activities were grouped as
reactive SC resilience elements and are summarised in Table 5.13.

192
Table 5.13 - Proactive and reactive sc resilience elements
SC Resilience Elements
Proactive Elements (Pre-disruption) Reactive Elements (Post-disruption)
o Risk management
o SC/operational strategy (pre-existing)
o Collaboration
o Network/SC understanding
o Product traceability and SC visibility
o Quality management
o Supportive organisational culture & learning
attitude
o Crisis management team
o Situational awareness and quick decision
making
o Operational/SC re-engineering
o Crisis communication
o Collaboration
o Supportive organisational culture & learning
attitude
Here it is important to highlight that these two broad categories emerged during the
analysis. However, it is essential to acknowledge that previous researchers have highlighted
similar categories of SC resilience elements (Bakshi & Kleindorfer, 2009; Hohenstein et al.,
2015; Kleindorfer & Saad, 2005). This study aims to provide an in-depth classification of
each SC resilience element into different phases of a disruption (discussed separately in
Chapter 7), for which these classifications, proactive and reactive, provide useful insights.
Chapter Summary
This chapter presented the analysis and findings from the six SC disruptions from New
Zealand and Pakistan. The first four SC disruptions were selected from a New Zealand dairy
company (FO1); the data collection entailed multiple interviews with FO1 and its network
partners. The last two SC disruptions were linked to FO2 in Pakistan, which involved
interviews with FO2 and its network partners.
Mainly, this chapter focused on exploring the first question (RQ1), which aims at exploring
the various SC resilience elements to build a resilient SC. The answer to this research
question was explored in the light of all six SC disruptions. It can be inferred that the
elements that emerged from the analysis enable an organisation to prepare, manage and
respond to a SC disruption successfully and effectively. Table 5.12 summarises the SC
resilience elements, their definitions and sub-elements as identified from analysis of all six
disruptions.
The next chapter presents further analysis based on the findings in this chapter. This leads
to a higher-level framework of SC resilience.
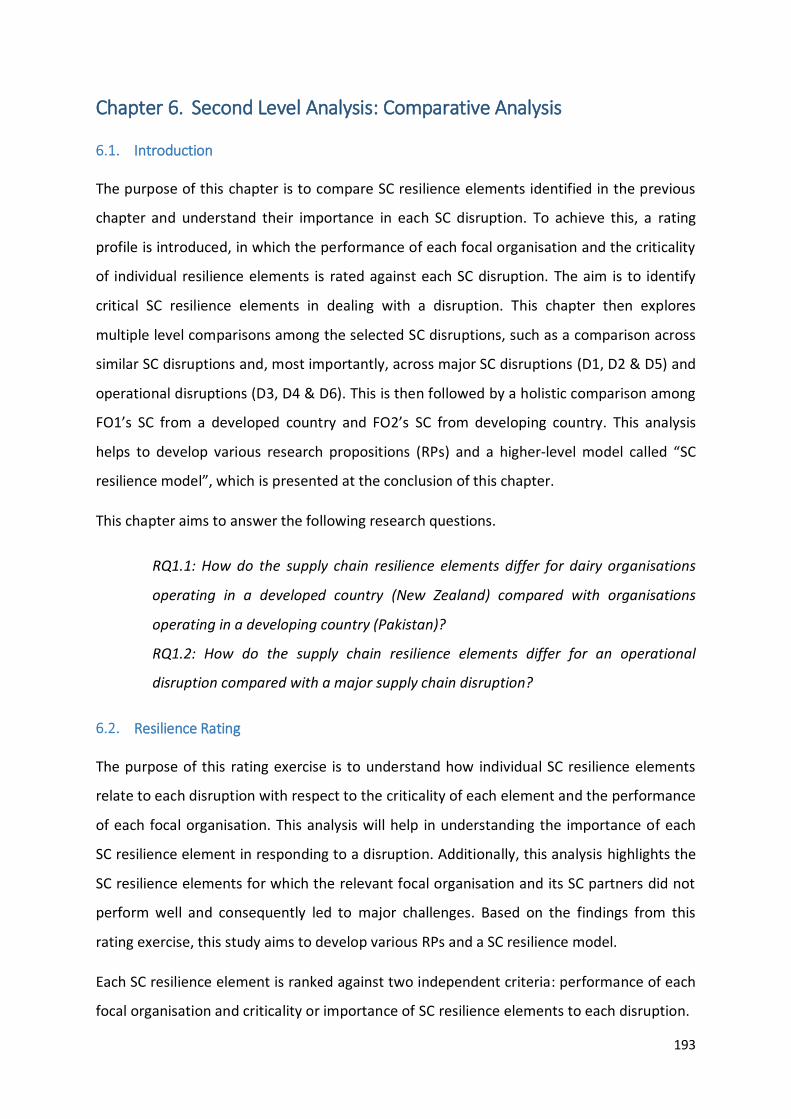
193
Chapter 6. Second Level Analysis: Comparative Analysis
Introduction
The purpose of this chapter is to compare SC resilience elements identified in the previous
chapter and understand their importance in each SC disruption. To achieve this, a rating
profile is introduced, in which the performance of each focal organisation and the criticality
of individual resilience elements is rated against each SC disruption. The aim is to identify
critical SC resilience elements in dealing with a disruption. This chapter then explores
multiple level comparisons among the selected SC disruptions, such as a comparison across
similar SC disruptions and, most importantly, across major SC disruptions (D1, D2 & D5) and
operational disruptions (D3, D4 & D6). This is then followed by a holistic comparison among
FO1’s SC from a developed country and FO2’s SC from developing country. This analysis
helps to develop various research propositions (RPs) and a higher-level model called “SC
resilience model”, which is presented at the conclusion of this chapter.
This chapter aims to answer the following research questions.
RQ1.1: How do the supply chain resilience elements differ for dairy organisations
operating in a developed country (New Zealand) compared with organisations
operating in a developing country (Pakistan)?
RQ1.2: How do the supply chain resilience elements differ for an operational
disruption compared with a major supply chain disruption?
Resilience Rating
The purpose of this rating exercise is to understand how individual SC resilience elements
relate to each disruption with respect to the criticality of each element and the performance
of each focal organisation. This analysis will help in understanding the importance of each
SC resilience element in responding to a disruption. Additionally, this analysis highlights the
SC resilience elements for which the relevant focal organisation and its SC partners did not
perform well and consequently led to major challenges. Based on the findings from this
rating exercise, this study aims to develop various RPs and a SC resilience model.
Each SC resilience element is ranked against two independent criteria: performance of each
focal organisation and criticality or importance of SC resilience elements to each disruption.
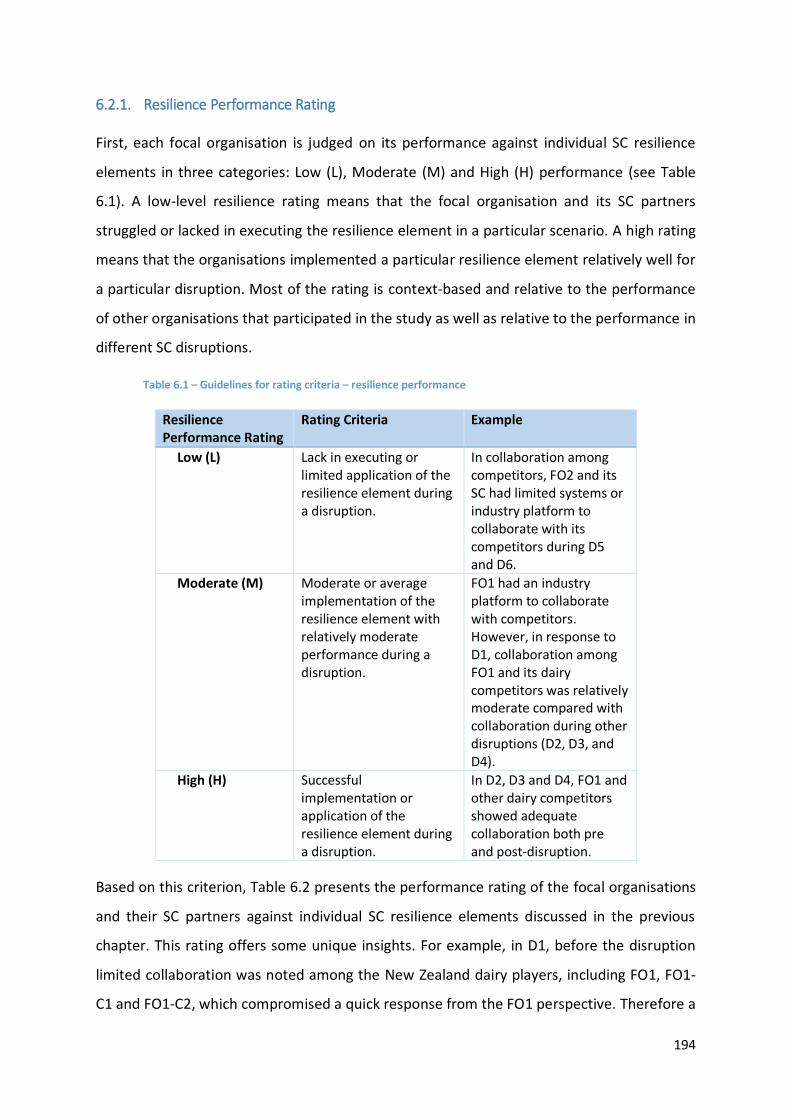
194
6.2.1. Resilience Performance Rating
First, each focal organisation is judged on its performance against individual SC resilience
elements in three categories: Low (L), Moderate (M) and High (H) performance (see Table
6.1). A low-level resilience rating means that the focal organisation and its SC partners
struggled or lacked in executing the resilience element in a particular scenario. A high rating
means that the organisations implemented a particular resilience element relatively well for
a particular disruption. Most of the rating is context-based and relative to the performance
of other organisations that participated in the study as well as relative to the performance in
different SC disruptions.
Table 6.1 – Guidelines for rating criteria – resilience performance
Resilience Performance Rating
Rating Criteria Example
Low (L) Lack in executing or limited application of the resilience element during a disruption.
In collaboration among competitors, FO2 and its SC had limited systems or industry platform to collaborate with its competitors during D5 and D6.
Moderate (M) Moderate or average implementation of the resilience element with relatively moderate performance during a disruption.
FO1 had an industry platform to collaborate with competitors. However, in response to D1, collaboration among FO1 and its dairy competitors was relatively moderate compared with collaboration during other disruptions (D2, D3, and D4).
High (H) Successful implementation or application of the resilience element during a disruption.
In D2, D3 and D4, FO1 and other dairy competitors showed adequate collaboration both pre and post-disruption.
Based on this criterion, Table 6.2 presents the performance rating of the focal organisations
and their SC partners against individual SC resilience elements discussed in the previous
chapter. This rating offers some unique insights. For example, in D1, before the disruption
limited collaboration was noted among the New Zealand dairy players, including FO1, FO1-
C1 and FO1-C2, which compromised a quick response from the FO1 perspective. Therefore a

195
low rating was attributed to collaboration (pre-disruption). Further explanations and
justifications of this rating exercise are given in the Sections 6.2.3 to 6.2.8.
Table 6.2 – Rating of FO1's & FO2's SC - resilience performance
SC Resilience Elements D1 – DCD Disruption
D2 – Botulism Scare
D3 – Lactose Supply Issue
D4 – Operational Issue
D5 – Flood 2010
D6 – FMD
FO1’s SC FO1’s SC FO1’s SC FO1’s SC FO2's SC
FO2's SC
Proactive elements
Risk management H H M H M M
Collaboration (coopetition) L H H H M M
Network/SC understanding L H H - L M
Product traceability H H - - - -
Quality management H H - H - -
SC visibility H H - - M M
Supportive organisational culture
H H H M M M
Reactive elements
Crisis management team H H H H M M
Collaboration (competitors) M H H H L L
Collaboration (SC) H H H M H H
Crisis communication L L - - M -
Situational awareness & decision making
H H H L M M
Operational/SC re-engineering H H H H M M
Supportive organisational culture
H H H M M M
Learning attitude H H H H H M
6.2.2. Criticality of Individual SC Resilience Elements to a Disruption
Secondly, each resilience element is ranked for its criticality or importance in a particular
disruption. Here, grey scale colours are used to indicate the criticality of each element. A
lighter colour represents a low level of criticality, whereas a darker colour represents a high
level of criticality (see Table 6.3). A high score indicates that the individual SC resilience
element was critically important in a disruption, whereas, a lower score indicates a lower
importance of a SC resilience element compared with others. For example, in D1 and D2,
crisis communication was noted as a critical element because the implication of the first few
press releases influenced the entire New Zealand dairy industry, therefore it is considered a
highly critical SC resilience element for these two disruptions.
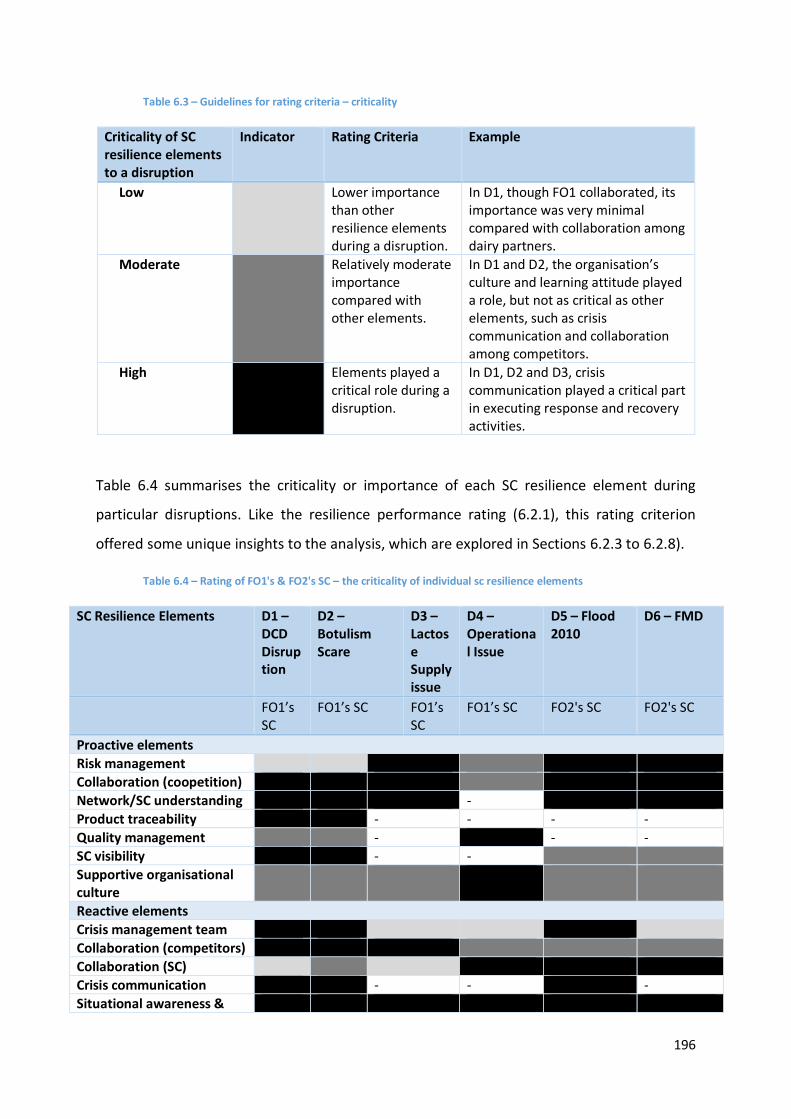
196
Table 6.3 – Guidelines for rating criteria – criticality
Criticality of SC resilience elements to a disruption
Indicator Rating Criteria Example
Low Lower importance than other resilience elements during a disruption.
In D1, though FO1 collaborated, its importance was very minimal compared with collaboration among dairy partners.
Moderate Relatively moderate importance compared with other elements.
In D1 and D2, the organisation’s culture and learning attitude played a role, but not as critical as other elements, such as crisis communication and collaboration among competitors.
High Elements played a critical role during a disruption.
In D1, D2 and D3, crisis communication played a critical part in executing response and recovery activities.
Table 6.4 summarises the criticality or importance of each SC resilience element during
particular disruptions. Like the resilience performance rating (6.2.1), this rating criterion
offered some unique insights to the analysis, which are explored in Sections 6.2.3 to 6.2.8).
Table 6.4 – Rating of FO1's & FO2's SC – the criticality of individual sc resilience elements
SC Resilience Elements D1 – DCD Disruption
D2 – Botulism Scare
D3 – Lactose Supply issue
D4 – Operational Issue
D5 – Flood 2010
D6 – FMD
FO1’s SC
FO1’s SC FO1’s SC
FO1’s SC FO2's SC FO2's SC
Proactive elements
Risk management
Collaboration (coopetition)
Network/SC understanding -
Product traceability - - - -
Quality management - - -
SC visibility - -
Supportive organisational culture
Reactive elements
Crisis management team
Collaboration (competitors)
Collaboration (SC)
Crisis communication - - -
Situational awareness &
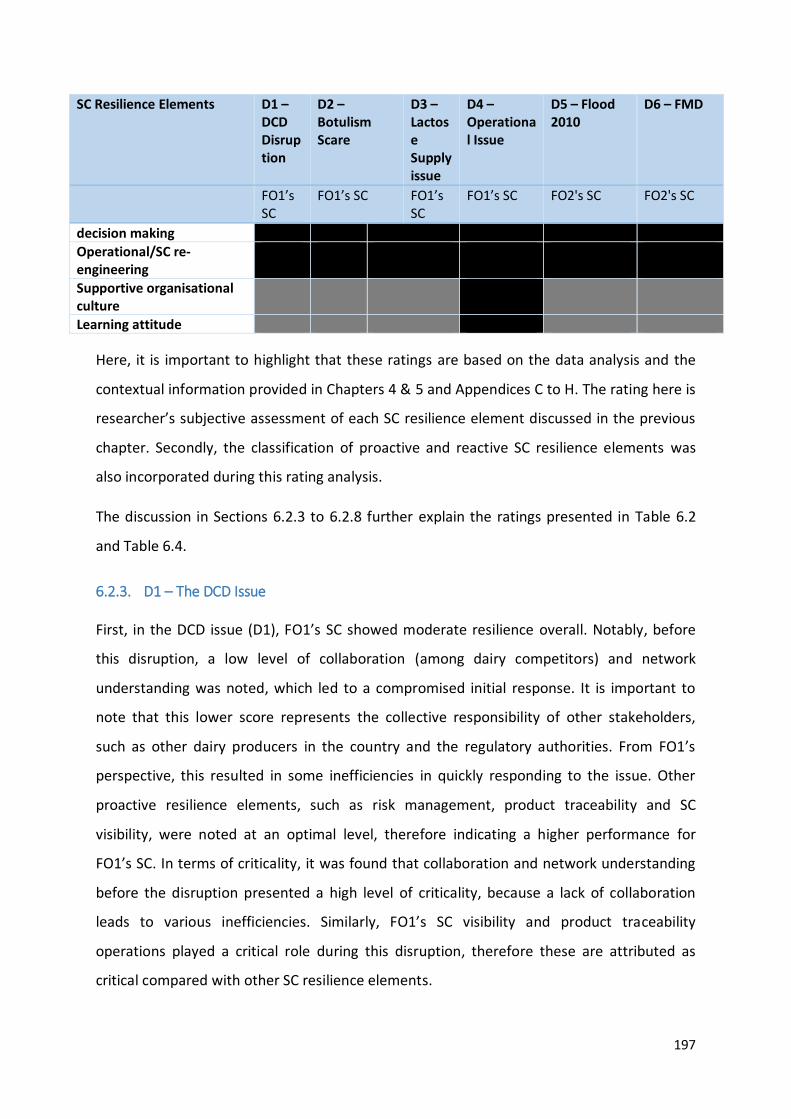
197
SC Resilience Elements D1 – DCD Disruption
D2 – Botulism Scare
D3 – Lactose Supply issue
D4 – Operational Issue
D5 – Flood 2010
D6 – FMD
FO1’s SC
FO1’s SC FO1’s SC
FO1’s SC FO2's SC FO2's SC
decision making
Operational/SC re-engineering
Supportive organisational culture
Learning attitude
Here, it is important to highlight that these ratings are based on the data analysis and the
contextual information provided in Chapters 4 & 5 and Appendices C to H. The rating here is
researcher’s subjective assessment of each SC resilience element discussed in the previous
chapter. Secondly, the classification of proactive and reactive SC resilience elements was
also incorporated during this rating analysis.
The discussion in Sections 6.2.3 to 6.2.8 further explain the ratings presented in Table 6.2
and Table 6.4.
6.2.3. D1 – The DCD Issue
First, in the DCD issue (D1), FO1’s SC showed moderate resilience overall. Notably, before
this disruption, a low level of collaboration (among dairy competitors) and network
understanding was noted, which led to a compromised initial response. It is important to
note that this lower score represents the collective responsibility of other stakeholders,
such as other dairy producers in the country and the regulatory authorities. From FO1’s
perspective, this resulted in some inefficiencies in quickly responding to the issue. Other
proactive resilience elements, such as risk management, product traceability and SC
visibility, were noted at an optimal level, therefore indicating a higher performance for
FO1’s SC. In terms of criticality, it was found that collaboration and network understanding
before the disruption presented a high level of criticality, because a lack of collaboration
leads to various inefficiencies. Similarly, FO1’s SC visibility and product traceability
operations played a critical role during this disruption, therefore these are attributed as
critical compared with other SC resilience elements.

198
In the reactive elements, mainly crisis communication to the media during first few days of
the disruption, was noted as a main hurdle in executing an efficient response, which
indicates the critical role of this element. Again, other industry stakeholders played a critical
role in devising the overall crisis communication. Therefore the lower score represents the
collective responsibility of all stakeholders. For all other resilience elements, FO1 with its SC
partners performed relatively well. Overall, the company was able to resolve the various
challenges presented because of this disruption coupled with some financial and non-
financial implications, therefore, indicating moderate resilience.
6.2.4. D2 – The Botulism Scare
Compared with D1, the botulism scare (D2) highlighted an optimal level of network
collaboration and network understanding among the key stakeholders before the
disruption, which led to early information sharing among the stakeholders and this enabled
a quick response from FO1’s perspective. The analysis highlighted that collaboration at the
industry consortium (DCANZ) became more productive after the DCD and botulism incidents
and the whole dairy industry got experience in dealing with such industry-wide issues. For
example, after this issue (D2), the New Zealand dairy industry was confronted by another
industry-wide issue, a 1080 scare18. Again, it required collaboration among all the New
Zealand dairy players, MPI, the New Zealand police and other stakeholders before the actual
disruption that was the first press release regarding the issue. It can be concluded that
proactive elements such as collaboration involving an effective industry consortium and a
pre-defined cross-organisational team and network/SC understanding of the critical
stakeholders are the key to effective management of a disruption, therefore these SC
resilience elements are highlighted as critical for this disruption.
In the previous disruption, FO1’s SC visibility and product traceability operations played
critical roles during this disruption, therefore are highlighted critical compared with other SC
resilience elements. Regarding FO1’s performance, it was noted that the company with its
SC partners had adequate systems and procedures before this disruption, which indicates an
18 On 27 November, 2014, A letter was send to Fonterra and Federated Farmers posing a threat to contaminate infant formula with 1080 (pesticide), if the application of 1080 pesticide is not stopped by a particular date. For the next three to four months the key stakeholders worked together to plan and execute early responses to neutralise the threat. This early planning and collaboration enabled the NZ dairy industry to totally avoid the issue. The press-conference to the media about the issue was made on 10 March, 2015, with all the precautionary measures implemented well in advance. Finally, on 13 October 2015, the mastermind of the threat was arrested on a charge of blackmail. For more details: http://www.stuff.co.nz/business/72976288/the-1080-milk-crisis-from-beginning-to-end
199
optimal performance for these elements. In addition, the pre-defined risk management,
involving a pre-defined team structure, roles and responsibilities, and a communication
structure to handle a disruption, was noted at the optimal level.
For the reactive elements, once again crisis communication at industry level was noted as a
primary reason that hindered an adequate response from FO1’s perspective. It was found
from both disruptions (D1 and D2) that a crisis communication, especially for a food security
issue, should incorporate critical information to avoid any confusion among the
stakeholders, therefore it is considered a critical element in these situations. Further, it is
important to highlight here that a lower score for crisis communication in this case also
represents the performance of all stakeholders, since this disruption was mainly linked to
Fonterra’s (FO1’s competitor) actions, which made it an industry-wide issue. Though the
matter was communicated to other industry players, however, in this case, FO1’s
involvement was limited in devising the crisis communication.
In addition, the performance of FO1’s SC for other reactive elements was relatively good,
which indicates a high level of resilience during this disruption. For example, FO1 was able
to quickly trace its products in its SC, which enabled a quick response in setting up the
testing regime, thus indicating an optimal performance. Similarly, FO1 established a
connection with key stakeholders, which enabled adequate situational awareness and quick
decision making. Additionally, it was noted that the SC resilience elements such as
situational awareness and quick decision making led by the crisis management team play a
central role in executing the required operational/SC adjustments (re-engineering) during a
disruption, therefore it is highlighted as critical reactive elements. Compared with D1, this
disruption resulted in relatively less financial and non-financial implications for FO1.
Therefore, it can be concluded that FO1 handled this disruption relatively well compared
with other disruptions, especially D1.
6.2.5. D3 – Lactose Supply Issue
In D3, the proactive elements such as network collaboration and network understanding
were noted as effective, hence indicating a higher performance. It was found that previous
working experience with other dairy producers and previous disruptions (D1 and D2),
enabled FO1 to establish the necessary connections at the industry level. During this

200
disruption, these connections played a critical role in quickly responding to various
challenges, therefore they are classified as critical elements. For risk management, mainly
linked with risk planning of the lactose supply, FO1’s performance was noted as moderate.
For example, before this disruption, the company recognised various risks associated with
procurement of lactose and subsequently initiated some strategies to rectify those risks.
However, time did not allow FO1 to implement all of these decisions. Subsequent to this
disruption, FO1 updated its risk management planning, particularly for this raw material to
avoid future disruption.
Analysis of D3 suggested that FO1’s commitment to proactively develop a supportive
organisational culture helped its staff deal with this disruption efficiently and proactively.
For example, top management support and empowerment emerged as crucial aspects that
enabled the relevant staff to make quick decisions during this disruption, hence highlighting
appropriate performance.
Similarly, for reactive elements, the company showed optimal performance against all
critical elements. Mainly, situational awareness and quick decision making were found to be
critical, which allowed FO1 to take prompt action to collaborate with its network partners,
such as competitors, and to engage in various re-engineering operations. Overall, the higher
performance against these elements enabled FO1 to avoid any negative consequences of
this disruption.
6.2.6. D4 – Operational Issue
This disruption presented significant operational challenges to FO1 and brought various
findings that can differentiate successful disruption management from an unsuccessful one.
Regarding the proactive resilience elements, FO1 showed a similar performance regarding
risk management practices, network collaboration and quality management principles.
However, this disruption highlighted FO1’s struggle to embed specific practices in staff
behaviour, resulting in a moderate performance for FO1’s organisational culture. It is
important to highlight that this rating represents only a particular aspect of culture, other
than this, FO1’s culture remained as in the previous disruptions (D1, D2 and D3).
FO1 performed relatively lower on situational awareness and quick decision making
especially during the initial stage of this issue, which led to delays in executing the initial

201
response. More significantly, this affected FO1’s performance in other resilience elements,
such as quickly setting up collaboration with stakeholders or engaging in quick
operational/SC re-engineering. Therefore, situational awareness, quick decision making and
operational/SC re-engineering were noted as central parts of the response and recovery
efforts.
Once FO1 recognised the issue, it placed sufficient resources to enable effective
collaboration, situational awareness and quick decision making. In relation to the other
disruptions, FO1’s resilience during this disruption (D4) was classified as moderate, because
of the delayed initial response and various financial and operational implications for the
company.
6.2.7. D5 – Flood 2010
The resilience rating of FO1’s SC against first four disruptions resulted in a benchmark, that
allowed the researcher to rate FO2’s SC resilience relative to FO1’s SC performances.
Furthermore, data collection involved multiple dairy players (FO2, FO2-C1 & FO2-C2), which
also allowed a comparison among these industry players. For instance, in terms of
supportive organisational culture, FO2 was rated relatively higher than its competitors (FO2-
C1 & FO2-C2), but, compared with FO1’s culture, FO2 lagged behind in the various avenues.
For example, FO2’s informants highlighted concerns about cohesiveness among various
departments, hence compromising smooth information sharing within the organisation.
Therefore, overall, FO2 is given a moderate rating for its organisational culture.
In terms of the proactive elements, FO2 performed lower regarding its understanding of its
SC compared with FO1. For example, FO2 had various field operations and SC partners
directly operating in the flood-prone areas that were affected by the 2010 flood. After this
disruption, FO2 learnt from the experience and analysed various vulnerabilities associated
with its critical nodes (SC partners), and re-engineered its operations and SC network
accordingly. Overall, FO2 performance was average for the proactive elements. In terms of
criticality, risk management, collaboration with key stakeholders and network
understanding played an important role in executing responses after the disruption,
therefore these are highlighted as critical elements.
202
With the reactive elements, FO2 immediately deployed various teams and established
linkages with the key stakeholders. However, compared with FO1’s disruption management
and integration with key stakeholders, FO2 and its SC partners were rated relatively lower.
Similarly, the situational awareness and decision making of FO2 were relatively better than
other players in the industry in Pakistan. However, many of FO2’s field operations and SC
partners were affected by underplaying the possibility of a flood, which resulted in a
delayed response. It is noted that delayed situational awareness and decision making
negatively impacted other resilience elements, such as crisis communication, collaboration
and, most importantly, in executing operational/SC re-engineering. Therefore, like the
previous disruptions, situational awareness and operational/SC re-engineering were noted
as central parts of the response and recovery efforts.
The learning attitude of FO2 and its SC partners was noted as adequate, because the
company, with its SC partners, learned and improved its operations after this disruption.
Thus FO2’s learning attitude was noted as relatively identical to FO1. This indicates a higher
performance for FO2’s learning ability.
The overall performance of FO2 in this disruption was rated as moderate because it resulted
in both financial and non-financial implications for FO2 and its SC partners.
6.2.8. D6 – Foot and Mouth Disease (FMD)
For the FMD (D6) disruption, FO2 reported it as an ongoing operational disruption with a
periodic occurrence. Therefore, the usual planning and response of FO2 and its SC partners
were rated rather than selecting a particular focal point in this disruption.
In the proactive elements, FO2’s performance was rated as average. Mainly, FO2 showed a
strong influence on contingency planning for these diseases, but, in many instances, FO2’s
SC partners did not integrate or embed these practices. Similarly, regarding the reactive
elements, FO2’s SC lacked collaboration with the stakeholders, such as the government and
other dairy industry players. FO2’s SC partners showed a lack of understanding in taking
adequate anticipatory measures.
203
Overall, it can be concluded that for this disruption FO2 showed moderate resilience and it
continues to present operational challenges for FO2 and significant financial and non-
financial implications for FO2’s farming community.
6.2.9. Resilience Rating – Summary
This section presented and explained the resilience rating for both focal organisations in all
six SC disruptions. This analysis highlighted a few of the important SC resilience elements
that are equally applicable to all six disruptions:
During a disruption, situational awareness and quick decision making enables an
organisation or SC to make required operational/SC adjustments (re-engineering) to
respond to and recover from challenges. Table 6.4 shows three elements, situational
awareness, quick decision making and SC/operational re-engineering, equally critical
for all six SC disruptions. Therefore, it can be concluded that these three SC resilience
elements are the most important reactive SC resilience elements.
It was noted that collaboration, a supportive organisational culture and a learning
attitude play important roles before and after a disruption (as highlighted in Table
6.2 and Table 6.4).
Additionally, this analysis highlights that:
Various proactive elements, such as risk management, network understanding and
collaboration among key stakeholders, positively impact a firm’s response and
recovery efforts after a disruption.
This section presented the resilience ratings and offered various findings. These findings are
used in Section 6.5 to develop a higher-level SC resilience model and research propositions
(RPs), in conjunction with the following comparative analysis.
Sections 6.3 and 6.4 further explore the above comparison (Table 6.2 and Table 6.4) in the
context of major versus operational SC disruptions in FO1’s SC from New Zealand versus
FO2’s SC from Pakistan.
204
SC Resilience Elements: A Comparison of Major SC Disruptions (D1, D2 & D5) and
Operational Disruptions (D3, D4 & D6)
As highlighted in the literature review, the concept of SC resilience was mainly introduced to
study SC disruptions featuring low probability and high impact. The early advocates of the
concept mainly explored major SC disruptions such as the September 2001 terrorist attacks,
the UK fuel protest in 2000, the FMD breakout in the UK in 2001, the global financial crisis,
and earthquakes and tsunamis (Christopher & Peck, 2004; Jüttner & Maklan, 2011; Peck,
2005; Rice & Caniato, 2003; Sheffi, 2001, 2005a, 2015; Sheffi & Rice, 2005). To the best of
the researcher’s knowledge, it can be argued that most research in SC resilience talks about
exploring major disruptions, with limited focus on operational or day-to-day disruptions.
This study aimed at exploring a range of disruptions including major SC disruptions (D1, D2
and D5) and operational disruptions (D3, D4 and D6). The intent was to explore how various
SC resilience elements interact with the two entirely different types of disruption. Table 6.2
and Table 6.4 compare these two types of disruption. The following are the key findings of
this comparison:
The main difference lies in the scale of a disruption and its implications for various
members of an organisation. For instance, an operational disruption requires the
involvement of only one or a few departments/organisations in managing and
resolving the issue. For example, with lactose issue (D3), mainly FO1’s procurement
team was involved in planning and executing the response to manage the challenges
presented by this disruption. A few other functions such as logistics provided only
additional support and complemented the actions initiated by the procurement
team. In contrast, a major SC disruption requires the involvement of almost all
functions in an organisation and other stakeholders. For example, the 2010 flood
(D5) affected all operations starting from the suppliers through FO2’s downstream
SC operations such as warehousing, distribution network and transport. Therefore, it
required a SC level planning and response. A similar finding was noted in the first two
disruptions, the DCD disruption (D1) and the botulism issue (D2), which required a
full organisational and network level response to resolve adequately the challenges
presented by these disruptions.

205
Interestingly, despite this difference, various SC resilience elements involved in
responding to disruptions, both major and operational disruptions, were noted as
similar. It was found that criticality of three elements, situational awareness, quick
decision making and operational/SC re-engineering, remain similar in dealing with
any disruption regardless of its nature (as highlighted in Table 6.4). For example,
situational awareness and the quick decision making of a manager in an operational
disruption (such as D3 – lactose supply) were as critical as in a major disruption (such
as D1 – DCD disruption). As highlighted by the analysis, delayed situational
awareness during D4 compromised FO1’s initial response. Similarly, delayed
situational awareness and decision making affected the execution of various
anticipatory measures during FO2’s response to the 2010 flood. Therefore, based on
these findings it can be concluded that these three SC resilience elements are
fundamental to increase SC resilience.
Lastly, it can be argued that an operational disruption enables an organisation to
learn and embed fundamental elements, such as situational awareness, quick
decision making and operational/SC re-engineering, in advance of a catastrophic
event. The analysis highlighted that learning from one disruption becomes useful in
planning and executing responses to later events. Therefore, it can be concluded
that these SC resilience elements can apply to the diverse nature of disruptions.
SC Resilience Elements: A Comparison of FO1’s SC in a Developed Country and FO2’s SC
in a Developing Country
As highlighted in the literature review, the literature on SC resilience typically focuses on
developed countries such as North America and Europe (Jüttner & Maklan, 2011; Pettit et
al., 2013; Scholten & Schilder, 2015; Sheffi, 2015), where most empirical investigation has
been done. It is believed that developing and under-developed economies present a distinct
business environment and, consequently, different challenges and vulnerabilities (Rwakira,
2015; Tukamuhabwa et al., 2015). The literature review revealed a limited amount of
empirical research on developing countries. A recent study by Benjamin et al. (2017) is
among the few that investigated SC resilience from a developing country’s perspective. To
best of the researcher’s knowledge, this study is unusual in investigating and comparing SC
disruptions from both developing and developed countries. This section highlights the

206
various insights from comparing SC disruptions linked to FO1’s SC from New Zealand and
FO2’s SC from Pakistan.
6.4.1. Distinct Vulnerabilities
First, it is essential to understand the distinct vulnerabilities and environmental challenges
associated with operating in a developing country compared with a developed country. The
following points highlight these distinct challenges, as observed through the analysis:
A key challenge for dairy companies operating in a developing country such as
Pakistan relates to the environmental or contextual factors. For example, Pakistan’s
dairy sector mostly comprises small farmers (1-4 animals per farmer) with less
knowledge of contemporary practices and technology. During the data collection, it
was noted that lack of resources from the government to build a supportive
environment and infrastructure for dairy farmers brings challenges for both the
farming community and the dairy companies. Additionally, the dairy sector is
negatively influenced by local challenges, such as regular power outages, an unstable
political environment, and unfavourable economic and financial decisions by the
government. It was noted that all these challenges negatively impact a dairy
company in running a smooth SC operation. For example, FO2 and FO2-C1
highlighted political unrest, such as a politically motivated strike, as a leading
challenge to its SC operations.
Compared with Pakistan, New Zealand’s dairy sector mostly comprises large farms
with the advantage of having sufficient financial backing and technological
knowledge. Secondly, it was noted that most environmental factors, such as political
stability, supportive weather conditions and appropriate infrastructure, are relatively
favourable for all sectors in New Zealand, including the dairy sector.
Therefore, it can be concluded that a dairy company operating in Pakistan deals with
additional vulnerabilities including various environmental or contextual factors (see Table
6.5)
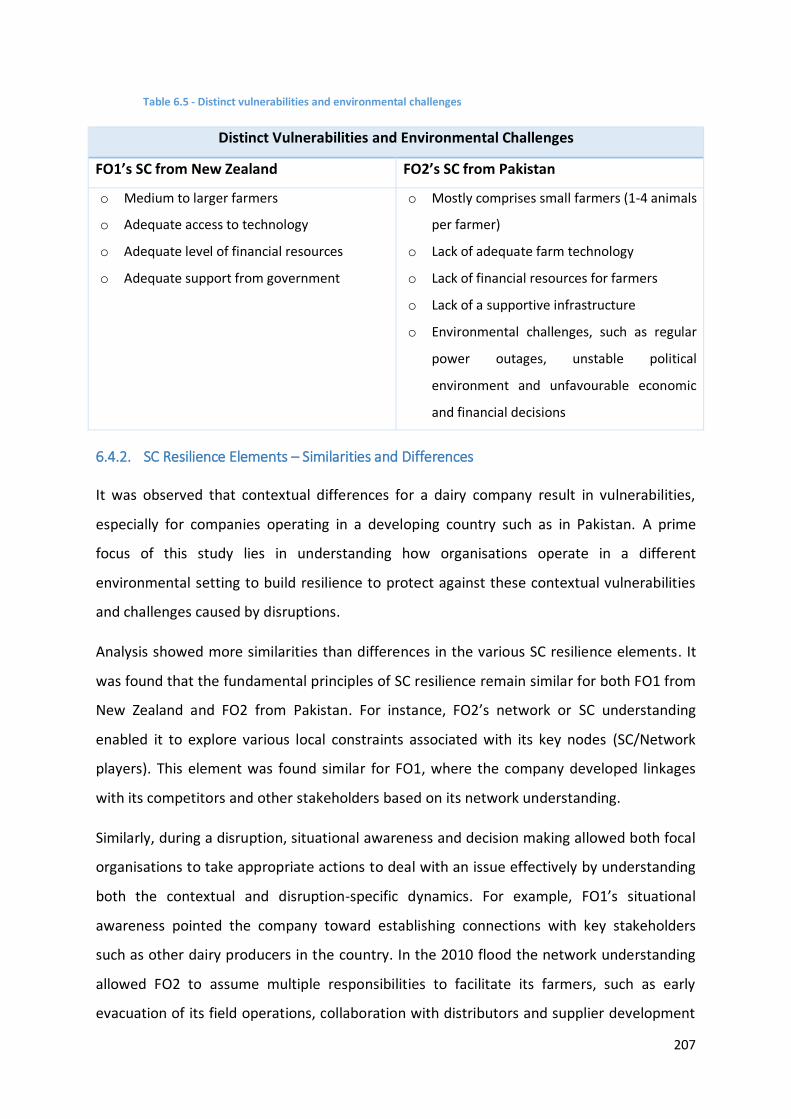
207
Table 6.5 - Distinct vulnerabilities and environmental challenges
Distinct Vulnerabilities and Environmental Challenges
FO1’s SC from New Zealand FO2’s SC from Pakistan
o Medium to larger farmers
o Adequate access to technology
o Adequate level of financial resources
o Adequate support from government
o Mostly comprises small farmers (1-4 animals
per farmer)
o Lack of adequate farm technology
o Lack of financial resources for farmers
o Lack of a supportive infrastructure
o Environmental challenges, such as regular
power outages, unstable political
environment and unfavourable economic
and financial decisions
6.4.2. SC Resilience Elements – Similarities and Differences
It was observed that contextual differences for a dairy company result in vulnerabilities,
especially for companies operating in a developing country such as in Pakistan. A prime
focus of this study lies in understanding how organisations operate in a different
environmental setting to build resilience to protect against these contextual vulnerabilities
and challenges caused by disruptions.
Analysis showed more similarities than differences in the various SC resilience elements. It
was found that the fundamental principles of SC resilience remain similar for both FO1 from
New Zealand and FO2 from Pakistan. For instance, FO2’s network or SC understanding
enabled it to explore various local constraints associated with its key nodes (SC/Network
players). This element was found similar for FO1, where the company developed linkages
with its competitors and other stakeholders based on its network understanding.
Similarly, during a disruption, situational awareness and decision making allowed both focal
organisations to take appropriate actions to deal with an issue effectively by understanding
both the contextual and disruption-specific dynamics. For example, FO1’s situational
awareness pointed the company toward establishing connections with key stakeholders
such as other dairy producers in the country. In the 2010 flood the network understanding
allowed FO2 to assume multiple responsibilities to facilitate its farmers, such as early
evacuation of its field operations, collaboration with distributors and supplier development
208
in both the short- and long-term. Furthermore, the concept of operational/SC re-
engineering was similar regardless of the contextual differences between the countries. It
was noted that, based on the situational awareness, both focal FO1 and FO2 engaged in
various short- and long-term re-engineering of their internal operations and SC processes.
In contrast, analysis showed that a major contextual difference in developing SC resilience
lies around understanding how various players in a SC work and evolve. In Pakistan, a dairy
processing company (such as FO2 or FO2-C1) plays the role of hub firm in developing and
promoting various principles around SC resilience for its SC partners. For example, it was
found that of various local constraints, FO2 played multiple roles in promoting SC resilience
to both its upstream and downstream SC players. With the 2010 flood (D5), it was noted
that FO2 helped its farming community rather than just waiting for government actions.
Similarly, FO2 centrally controlled various strategic decisions to provide sufficient support to
its downstream distributors’ network. As highlighted by FO2, the company promotes risk
management practices and centralised planning on behalf of its various SC partners, since
most of its SC partners lack the ability to independently develop these practices.
The above discussion highlights how a network works in developing SC resilience in a SC.
The analysis showed that like in Pakistan, a dairy company in New Zealand plays the role of
a hub firm, by connecting with a network of suppliers (including farmers) and downstream
SC partners. However, this mainly entails operations such as product and information flow
from one end of the SC to the other. Most importantly, it was observed that SC players work
relatively independently, but complement each other in developing SC resilience.
Conversely, in Pakistan, a hub firm (such as FO2 or FO2-C2) plays a paramount additional
role to promote SC resilience on behalf of its SC partners, reflecting supplier/network
development. It is important to highlight that FO1 also engages in various supplier
development activities, but with FO2 in Pakistan the level of involvement relatively recedes.
It can be concluded that though organisations operate in different environments and may
encounter distinct challenges and vulnerabilities, the fundamental elements of SC resilience
largely remain similar in dealing with those challenges. Particularly, situational awareness
and quick decision making were noted as critical elements that allow organisations to
understand distinct challenges and then produce a customised solution for the context and
209
disruption-specific dynamics. Similarly, a network or SC understanding enables organisations
to develop appropriate proactive or reactive strategies to encounter disruptions.
Synthesis and Research Propositions
The analysis in Chapter 5, resilience rating (Section 6.2) and comparative analysis (6.3 & 6.4)
in this chapter enables this study to propose various RPs and develop a framework
presenting SC resilience elements that could be applicable in multiple settings.
First, as highlighted in Chapter 5, the analysis of all six cases highlighted various SC resilience
elements that were sub-divided into two categories: proactive and reactive elements. This
classification resembles the suggestions by Chowdhury and Quaddus (2016) and Hohenstein
et al. (2015). The analysis in Chapter 5 suggested that proactive elements correspond to an
organisation’s or SC’s effort to develop its ability to deal with potential disruptions before a
disruption. It was noted that companies engage in various activities or strategies such as risk
management plans, pre-defined cross organisation teams, foster supportive organisational
culture and develop SC visibility operations to ensure preparedness against disruptions (see
Table 5.12).
Similarly, the analysis highlighted various activities opted for by both FO1 and FO2 with their
SC or network partners to deal with the post-disruption challenges; these were categorised
as reactive SC resilience elements (see Table 5.12). Building on this categorisation, the
analysis in this chapter explored the importance of SC resilience elements across various SC
disruptions.
First, analysis of all six SC disruptions highlighted various reactive elements that enable an
organisation or SC to deal effectively with a disruption. Notably, it was observed that
situational awareness is a central part of effectively dealing with a disruption. This leads to
quick decision making and operational/SC re-engineering. As highlighted in Sections 6.2, 6.3
and 6.4 regardless of the nature of a disruption (operational or catastrophic event), or the
focal organisation’s operating environment (developing or developed country), situational
awareness, quick decision making and operational/SC re-engineering remain equally critical
(see Table 6.4). An organisation that performs relatively well in these elements can respond
to and recover quickly from a disruption. For example, delayed situational awareness and
slow decision making compromised the response in D4, whereas good situational awareness
210
and quick decision making by FO1 during D3 led to effective response and recovery (as
highlighted in 6.2.5 and 6.2.6). Therefore, based on these findings, this study proposes that:
RP1: Situational awareness, quick decision making and operational/SC re-engineering
are the key reactive elements that enable an organisation or SC to quickly respond to
and recover from a disruption, therefore enhancing SC resilience.
This chapter also highlighted various SC resilience elements that remain equally important
in both the pre- and post-disruption stages. It was found that a supportive organisational
culture, collaboration (both intra- and inter-organisation) and learning attitude (as
highlighted in Table 6.2 and Table 6.4) are equally applicable as proactive and reactive SC
resilience elements. The data analysis of all six cases highlighted that these SC resilience
elements enabled both FO1 and FO2 to engage positively in other proactive and reactive
activities. For example, collaboration among relevant stakeholders was noted as critical for
both phases, pre- and post-disruption, during D1 and D2 (see Sections 6.2.3 and 6.2.4).
Therefore, it can be proposed that:
RP2: Collaboration, a supportive organisational culture and a learning attitude
positively influence both pre- and post-disruption phases, hence help in improving SC
resilience.
Lastly, the findings from this analysis highlight that various proactive elements positively
influence an organisation’s ability to engage quickly in response and recovery efforts (as
noted in Section 6.2). For example, a pre-defined risk management policy promptly leads to
quick deployment of a crisis management team and a pre-defined communication structure
that enables the quick, efficient flow of information during a disruption. Therefore it can be
proposed that:
RP3: Proactive elements enable an organisation or SC to effectively and quickly
engage in response and recovery operations, hence enhancing SC resilience.
Based on these RPs, a higher-level model presenting SC resilience elements is developed
(see Figure 6.1). This figure summarises the findings from this chapter and, most
importantly, the RPs. This figure highlights that a disruption can be divided into two stages,
pre- and post-disruption. Proactive elements during the pre-disruption stage positively
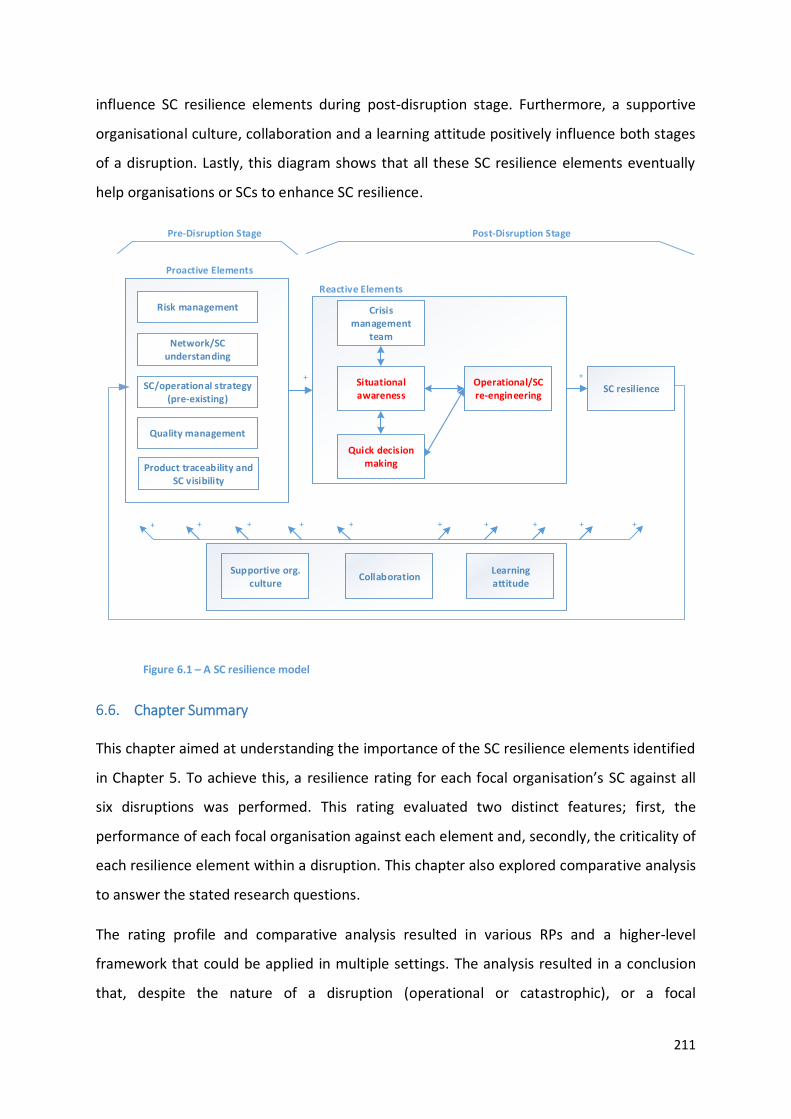
211
influence SC resilience elements during post-disruption stage. Furthermore, a supportive
organisational culture, collaboration and a learning attitude positively influence both stages
of a disruption. Lastly, this diagram shows that all these SC resilience elements eventually
help organisations or SCs to enhance SC resilience.
Situational awareness
Quick decision making
Operational/SC re-engineering
Risk management
Quality management
Crisis management
team
SC/operational strategy (pre-existing)
Proactive Elements
Reactive Elements
Learning attitude
CollaborationSupportive org.
culture
+
+++ + + +
Pre-Disruption Stage Post-Disruption Stage
Network/SC understanding
Product traceability and SC visibility
SC resilience
+
+ +++
Figure 6.1 – A SC resilience model
Chapter Summary
This chapter aimed at understanding the importance of the SC resilience elements identified
in Chapter 5. To achieve this, a resilience rating for each focal organisation’s SC against all
six disruptions was performed. This rating evaluated two distinct features; first, the
performance of each focal organisation against each element and, secondly, the criticality of
each resilience element within a disruption. This chapter also explored comparative analysis
to answer the stated research questions.
The rating profile and comparative analysis resulted in various RPs and a higher-level
framework that could be applied in multiple settings. The analysis resulted in a conclusion
that, despite the nature of a disruption (operational or catastrophic), or a focal

212
organisation’s working environment (developed or developing country) the fundamental
principles of achieving SC resilience remain similar.
The next chapter analyses the SC resilience elements in relation to the disaster management
framework, which highlights various phases of a disruption – readiness, response, recovery
and learning & growth. This helps to further refine the framework proposed in this chapter.
213
Chapter 7. Second Level Analysis: SC Resilience Elements and the
Disaster Management Cycle
Introduction
This chapter outlines the SC resilience elements explored in Chapter 5 in context of the
disaster management framework. As identified in the literature, the concept of SC resilience
profoundly relates to different phases a disruption. However, the influence of individual SC
resilience elements on distinct phases of a disruption is still to be established. In this
chapter, the disaster management framework is used as a theoretical underpinning to
explain the various elements distinct to different phases of a disruption: readiness,
response, recovery, and learning & growth. This chapter explores the following research
question.
RQ2: How do the various elements of supply chain resilience relate to the Disaster
Management Framework – Readiness, Response, Recovery and Learning & Growth?
Disaster Management Framework
As discussed in Chapter 2, many authors define SC resilience as an ability to plan, respond,
recover (survive) and grow in face of a disruption (Golgeci & Ponomarov, 2013; Peck, 2005;
Pettit et al., 2013; Ponis & Koronis, 2012; Ponomarov & Holcomb, 2009). In contrast, the
disaster management literature describes the various stages of a disruption as prevention/
mitigation, preparedness, response and reconstruction/recovery (Coppola, 2006; Hale &
Moberg, 2005). Much of the disaster management literature attributes the growth and
learning aspect to the recovery phase. However, Clarinval and Ahmad (2015) suggest
development or growth as a separate process from the recovery phase.
In terms of the SC resilience literature, Hohenstein et al. (2015) attribute growth to a
separate phase. Sheffi (2005c) explains that firms who capitalise on the opportunity, create
a sustainable competitive advantage. Firms that merely consider this stage as restoring the
business operations may face long-term recovery difficulties and may suffer from a bad
reputation among customers (Sheffi & Rice, 2005). Therefore, the growth phase is an
integral part of achieving SC resilience.

214
Based on the argument by Scholten et al. (2014) that SC resilience and disaster management
are interrelated, this study marries the definition of SC resilience and disaster management
phases into (see Figure 7.1):
A readiness phase before a disruption involving mitigation and preparedness of the
disaster management framework corresponds to the planning aspect of the SC
resilience definition; and
the response, recovery and development phase of the disaster management
framework corresponds to the response, recover (survive and adapt) and learning
and growth aspects of the SC resilience definition.
Disaster Management
Cycle
(Mit
iga
tio
n &
Pre
par
ed
ne
ss)
DisasterOccurence
Response Phase
Re
cov
ery
Ph
ase
Learning & Growth Phase
Re
ad
ine
ss P
ha
se
Figure 7.1 – The disaster management cycle
The Disaster Management Framework Revisited
The analysis showed that various SC resilience elements as part of a distinct phase that
departs from the existing phases of the disaster management framework. Notably, these
elements are attributable to a period in which organisations foresee a particular disruption
before it actually occurs. This study refers to this period as “prelude-to-disruption”. It was
learnt from the analysis of all six SC disruptions that organisations rely on distinct SC

215
resilience elements to effectively manage this phase. This section describes the underlining
justification for introducing this new phase as a result of the analysis.
Analysis in the context of the disaster management framework highlighted that, before an
actual disruption, organisations get early indications regarding a potential crisis. For
example, during the DCD issue (D1), the first sign of a potential issue emerged almost five
months before the actual disruption on 24 January 2013. Similarly, with the botulism issue
(D2), an early sign of a potential problem emerged several months before the first press
release. Figure 7.2 and Figure 7.3 show the timelines of D1 and D2 in relation to the disaster
management framework.
Figure 7.2 – D1 timeline
Figure 7.3 – D2 timeline
Like D1 and D2, all the other SC disruptions (D3, D4, D5, & D6) presented various early signs
of a potential issue/disruption before the event; the timeline ranged from a few hours to
many months. For example, in the 2010 floods (D5), an early sign of floods emerged almost
a week before the flooding. The analysis attributed two distinct features of this phase:
Why it is not the readiness phase? – A readiness phase involves measures an
organisation takes to identify a number of potential issues and develop measures to
protect against these potential stresses before a disruption (Altay & Green, 2006;
Cozzolino, 2012; Van Wassenhove, 2006). These measures mainly reflect generic
strategies such as risk assessment, building flexible operations or doing mock

216
exercises; most are conducted during normal or a relatively stable business
environment.
In contrast, once the threat of a potential issue becomes real, it suddenly changes
the stable business environment into a chaotic or uncertain environment. The
potential threat of a disruption could lead to resource deployment to analyse,
manage and early respond to the situation. For example, with US west coast port
lockout in 2002, it cost billions of dollars to the US economy and adversely affected
many multinational companies (Hall, 2004). Though many companies suffered, Dell
managed to avert the disaster. In response to months of heated negotiations with
the officials of the labour union, Dell’s advance warning systems alarmed it to do
early planning (May, 2007). Dell planned and allocated resources for alternative
shipments by chartering 18 Boeing aircraft at $500,000 per plane (May, 2007). The
phase from the first sign of a potential lockout emerged (on-going negotiations) until
the actual day of disruption (the day of the port lockdown) can be referred to as the
“Prelude-to-Disruption” phase. Dell’s advance warning system and quick decision
making during the prelude-to-disruption enabled it to avert the disaster.
Building on a similar concept, the analysis in this study highlighted similar
opportunities for concerned focal organisations (FO1 & FO2) to engage in early
resource deployment and early response planning. For example, with D3, FO1’s
ability to foresee a potential shortage before the actual port lockdown enabled it to
engage in early planning and response. Hence the disruption was neutralised.
Why it is not the response phase? – Based on the example of Dell, the company
allocated resources and invested in contracts for alternative shipment options that
came in handy when the country faced 10 days of port shutdown. It was equally
possible that the labour negotiations end with a positive outcome without a
lockdown. The early planning and resource allocation would have been an extra, an
opportunity cost of averting a disruption. It can be inferred that the response phase
starts with the occurrence of an actual. Whereas, in case of prelude-to-disruption
phase, though a potential threat is recognised, its occurrence or non-occurrence
remain equally possible.
In case of D1 and D2, the early indication of a potential issue occurred several
months before the actual disruption (i.e., the day of the first press release). The
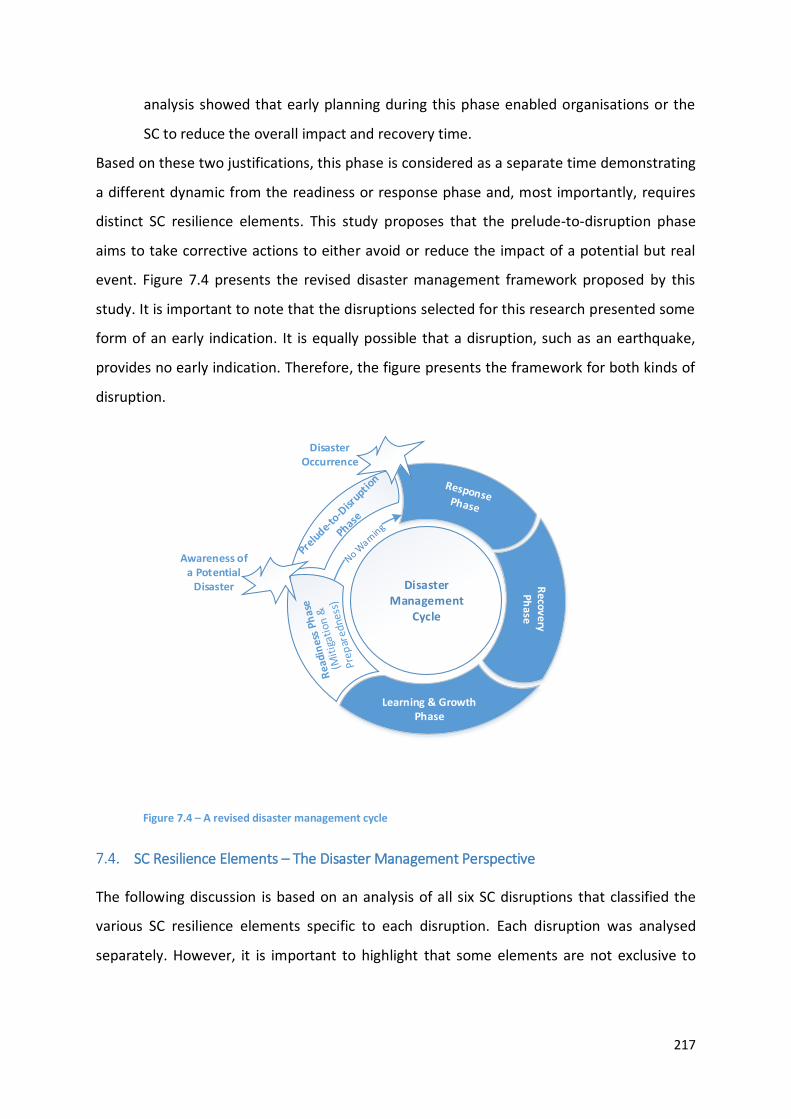
217
analysis showed that early planning during this phase enabled organisations or the
SC to reduce the overall impact and recovery time.
Based on these two justifications, this phase is considered as a separate time demonstrating
a different dynamic from the readiness or response phase and, most importantly, requires
distinct SC resilience elements. This study proposes that the prelude-to-disruption phase
aims to take corrective actions to either avoid or reduce the impact of a potential but real
event. Figure 7.4 presents the revised disaster management framework proposed by this
study. It is important to note that the disruptions selected for this research presented some
form of an early indication. It is equally possible that a disruption, such as an earthquake,
provides no early indication. Therefore, the figure presents the framework for both kinds of
disruption.
Disaster Management
Cycle
DisasterOccurrence
RecoveryPh
ase
Learning & Growth Phase
Awareness of a Potential
Disaster
Figure 7.4 – A revised disaster management cycle
SC Resilience Elements – The Disaster Management Perspective
The following discussion is based on an analysis of all six SC disruptions that classified the
various SC resilience elements specific to each disruption. Each disruption was analysed
separately. However, it is important to highlight that some elements are not exclusive to
218
each phase, i.e., various elements interact with multiple phases of a disruption to a certain
degree.
Chapter 5 highlighted individual SC resilience elements in detail, this chapter presents how
these elements are linked to different phases of the revised disaster management cycle. The
previous categorisation of proactive and reactive SC resilience elements (Section 5.4) and
the SC resilience model (Section 6.5) are further analysed through the lens of the revised
disaster management framework.
7.4.1. Readiness Phase
The readiness phase refers to the activities in which an organisation or SC engages before a
disruption or crisis; it is divided into two separate phases: Mitigation and Preparedness.
7.4.1.1. The Mitigation Phase
The mitigation phase refers to anticipatory measures to protect against any stress or to
reduce vulnerabilities. Broadly, this phase aims to either entirely eliminate a potential risk or
reduce its consequences (Altay & Green, 2006; Cozzolino, 2012). When asked about
measures or strategies to protect against a potential disruption, both FO1 and FO2 and their
SC partners highlighted various measures either to eliminate a potential risk totally or to
reduce its impact. As presented in Chapter 5, all these measures or strategies were grouped
into various SC resilience elements.
To analyse the distinct elements corresponding to this phase, categorisation of data was
based on the following two principles:
activities organisations engage in before a disruption or during stable environment,
and
elements aim to eliminate a risk or to reduce its impact.
7.4.1.1.1. Risk Management
The analysis suggested that organisations tend to engage in various risk management
practices to mitigate potential risks or reduce their impact. Practices such as risk
identification and analysis allow an organisation to understand the potential hazards linked
to critical nodes or operations, which results in the development of strategies to avert these
219
hazards. For example, with D5 (flood 2010) and D6 (FMD), risk planning allowed the
associated organisations (FO2 & FO2-C1) to develop an alternative production process (also
called postponement) during the storage of the raw milk supply. Similarly, SC disruptions
like D1 (the DCD issue) and D2 (the botulism scare), highly unpredictable events from FO1’s
perspective, also presented the importance of these risk management practices. For
example, FO1’s risk management policies before these disruptions included a pre-defined
team structure (both inter & intra organisational), and a pre-established communication
structure that allowed the company to quickly deploy the crisis management team and
establish links with the relevant stakeholders (FO1-C1, FO1-C2 & FO1-RA).
This pre-planning led to a quick response, which reflected agility during a disruption, a
fundamental characteristic of a resilient SC (Christopher & Peck, 2004; Christopher &
Rutherford, 2004). Sheffi and Rice (2005) argue that pre-planning can be done for
foreseeable or frequent events, such as a flood, supply shortage, or a disease breakout. For
these kinds of disruptions, risk identification and assessment lead to the development of
specific strategies (Christopher & Peck, 2004), such as developing advance warning signals
(Pettit et al., 2010). Though this study agrees with earlier research, the analysis highlighted
the relevance of early planning and risk management practices with unknown and highly
unpredictable events, e.g., D1 and D2 were highly unpredictable from FO1’s perspective.
In relation to the SC resilience literature, interestingly, the initial discussion on SC resilience
began with an argument that the traditional risk management strategies have various
limitations in identifying and planning for unknown events (Christopher & Holweg, 2011;
Howard, 2006; Pettit, 2008; Pettit et al., 2010), which led to an academic discussion on the
SC resilience concept. On the other hand, research by Christopher and Peck (2004)
emphasises risk management as part of corporate decision making and considered it as part
of SC risk management culture. Though other authors (Chowdhury & Quaddus, 2016;
Scholten et al., 2014) used Christopher and Peck (2004) framework, they bring more focus
on risk awareness and cultural aspects of risk management rather than concentrating on
core elements of SC risk management. This study extends the initial understanding of SC risk
management in the SC resilience literature and suggests that formal risk management
practices as a separate construct from risk awareness or culture. These risk management
220
practices complement other SC resilience elements and have an essential role in the
mitigation phase.
7.4.1.1.2. Network/SC Understanding
SC understanding entails mapping out critical nodes or paths in a SC. A study by Christopher
and Peck (2004) suggested that this understanding can be achieved using a SC risk register
and critical path analysis. Additionally, this SC understanding enables an organisation to
create custom operational or SC strategies as per requirements. For example, understanding
critical nodes allows an organisation to create various strategies such as a multiple suppliers
strategy for a bottleneck supplier. In line with the findings of Christopher and Peck (2004),
this study presents a similar importance to SC understanding. For example, both FO1 and
FO2 mentioned various activities to understand the critical nodes or SC players, which led
them to design various strategies, such as multiple sourcing and diverse product mix.
Though the concept of SC understanding was similar in this study as discussed in previous
studies, it was found that this understanding is not limited to just the SC level, such as
upstream and downstream SC partners. It is not about understanding pinch points in a SC
and creating alternative options. This research found that this understanding entails a
broader network beyond a usual SC, therefore, referring it to the network level of
understanding. For example, disruptions such as D1 and D2 highlighted the role of various
stakeholders such as competitors, media, and national and international regulators. Though
these players were not part of FO1’s usual SC structure, many of them influenced either
positively or negatively in dealing with both these disruptions. Therefore, as an outcome,
FO1 and other dairy organisations established various strategies to manage the stakeholders
effectively.
In line with these findings, it can be concluded that understanding the broader network
enables organisations to understand critical points or players, both internal and external, to
an SC, which allows them to develop various network or SC level strategies and hence form
a resilient SC.
221
7.4.1.1.3. SC/Operational Strategy (Pre-existing)
As discussed above, a critical aspect of risk management includes identification of potential
risk events, which then enables organisations in a SC to modify or introduce various
operational or SC strategies to avert or effectively deal with these risk events.
The analysis suggested that both FO1’s and FO2’s SC incorporated various strategies to build
redundancy and flexibility into their operations. It was learnt that redundant resources, such
as a buffer or backup inventory, buys extra time for organisations to continue the flow of
products during a sudden change in supply and demand (refer to D3, D4, D5 and D6,
Chapter 5). In contrast, flexible operations allow organisations to readjust or redeploy
resources as required by the situation. For example, FO1’s ability to quickly shift its finished
products from one market to another enabled continuity of its downstream SC operations in
D1. This ability was linked to other strategies such as standardised products and flexible
customer base. Both these strategies allow organisations to quickly respond and recover
from a disruption (Dmitry et al., 2014; Ishfaq, 2012; Park, 2011; Rice & Caniato, 2003; Sheffi,
2005a; Sheffi & Rice, 2005). Chowdhury and Quaddus (2016) link flexibility and redundancy
as a part of pre-emptive resilience capabilities that allow an organisation to develop such
operations in advance to protect against any disruption. In line with suggestions by
Chowdhury and Quaddus (2016), this study proposes redundancy and flexibility as critical
parts of a pre-existing SC/operational strategy, which often come as an outcome of risk
planning.
7.4.1.1.4. Quality Management
Apart from promoting flexibility and redundancy, the analysis brought more importance to
quality management practices than to any other strategies. SC disruptions like D1 (DCD
issue) and D2 (botulism) placed more focus on developing and integrating quality processes
as a core resilience strategy to prevent a disruption. For example, during these two
disruptions, FO1 had redundant or flexible operations. However, these options remained
mostly useless since all customers wanted was quality assurance. Fundamentally, the whole
botulism issue began with a lapse in basic quality management principles. Designing quality
practices and promoting these practices among staff were noted as critical strategies to
prevent these kinds of disruptions, particularly in D2.

222
The importance of quality management can also be explained by the argument that this
study was conducted in the dairy sector. It can be argued that the distinct dynamics of food
industries, such as a dairy SC, reflect this finding. Acceptable quality is assessed as a
principal performance indicator for organisations operating in this industry. Any lapse in
quality operations, such as product testing, can significantly disrupt SC operations, as
highlighted in D1 and D2. Additionally, to achieve an acceptable product quality, the quality
management practices need to be integrated throughout the SC. For example, an
organisation, in this study a dairy company, builds its suppliers’ network based on their
ability to maintain acceptable quality products and operations.
The mainstream SC resilience literature does not give importance to quality management to
avoid or effectively manage a disruption. The closest reference to quality management can
be drawn from Christopher and Rutherford (2004) study, in which the authors link agile six
sigma principles with SC resilience. However, most of the research remains unfamiliar with
quality management principles as an integral part of SC resilience. Therefore, this study
proposes that better quality management principles enable an organisation to detect early
and resolve potential issues, which is a crucial characteristic of a resilient SC. In the context
of disaster life cycle phases, these processes can be inbuilt and promoted before a
disruption. Therefore, they are linked to the mitigation phase before a disruption.
7.4.1.1.5. Early Warning Systems
A systematic approach to designing critical warning systems allows an organisation to
monitor and pre-emptively deal with a potential disruption. For example, past trends,
political and economic decisions, market trends and business intelligence are the
fundamental approaches to monitor and foresee an unfavourable event. Before a
disruption, an organisation designs these indicators as a result of risk assessment and
network/SC understanding. These indicators provide an early start in mobilising resources
and developing effective crisis communication, which helps in reducing the impact of a
disruption. Disruptions such as D5 and D6 highlight the importance of incorporating early
warning systems as a part of the mitigation phase. It can be concluded that designing early
warning systems is a key strategy before a disruption that enables pre-emptive measures to
either totally naturalise a disruption or reduce its impact.
223
7.4.1.1.6. SC Visibility and Product Traceability Systems
As important as quality management, SC visibility and having product traceability systems
were also found as critical parts of achieving SC resilience especially for a dairy SC. One
critical challenge associated with a food SC, especially a dairy SC, is a food security lapse,
which can significantly cripple a SC’s operations, as highlighted in D1 and D2. To properly
manage and quickly respond to these kinds of disruption, an organisation’s ability to quickly
identify the products in the SC is fundamental. This can be achieved by building product
traceability systems that entail ensuring a desirable level of product and information
visibility across the SC. From a dairy company’s perspective, such as FO1 or FO2, product
traceability can be built by increasing both upstream and downstream visibility into the SC
before a disruption.
Previous researchers expressed SC visibility as part of monitoring downstream market
demand or in ensuring information sharing to understand key vulnerability across a SC
(Carvalho, Azevedo, & Cruz-Machado, 2012; Pettit et al., 2010; Priya Datta et al., 2007). This
study adds an extra dimension to SC visibility by arguing that SC visibility and product
traceability operations complement each other and organisations design these capabilities
before a disruption to avoid or quickly manage a disruption.
Overall the mitigation phase, before a disruption, deals primarily with risk management
practices that subsequently result in designing various operational or SC strategies to either
avoid a SC disruption or effectively manage it. In addition, an organisation also engages in
various preparedness strategies, which are discussed in the next section. Table 7.1 presents
quotations from the data classifying the SC resilience elements in relation to the mitigation
phase.

224
Table 7.1 – Quotations from the data - mitigation phase
SC Resilience Elements Quotations from the Data
Mitigation Phase
Risk management
SC risk analysis “[Last year] we did our analysis of identifying the various raw materials and […] obviously identified risks associated with each raw material that we procure….” (FO1-P6)
Pre-defined plans “We have planning and contingencies for this disease [FMD]” (FO2-P1) “We have a guideline here that if this type of situation happens then what are the measures that we need to take” (FO2-C1-P1) Risk Management Policy – Covers overview of various risks and hazards within the company (FO1’s Document)
Pre-defined team structure
“We have various risk management teams in each function or concerned area, and we also have a risk management team including various people from each department” (FO2-P2) “We have a group of people which are from all over the organisation, and we do risk planning for all short of potential risks” (FO1-P4)
SC/operational strategy – pre-existing
Redundancy
Buffer stock “We maintain buffer stock for certain type of products that are more in demand and that are also prone to stock-outs” (FO2-R1) “Mostly we have buffer stock at the factory like we hold ten days of the buffer at the factory on average” (FO2-C1-P1)
Flexibility
Multiple suppliers “So for example in case of dairy if we face difficulty in procuring fresh raw milk, then we have alternative plan to buy milk powders. For that, we have the biggest source [XYZ supplier]” (FO2-P2)
Flexible transportation capabilities
“So if something happens like any strike and if we require a raw material on an urgent basis, so we have a contingency to ship it by air” (FO2-P2) “We use multiple sources or ways to bring the milk supply to our chilling centres” (FO2-P1)
Multiple buyers/markets
“The majority of our products are not just for one customer or market, some of them may be for one customer, but we can still shift to different parts of the markets if we need to” (FO1-P2)
Postponement “Now even though we experience flooding in the summer season, but we can manage it quite effectively by switching [the production process] to powdered milk, we only use this process to manage the demand” (FO2-C1)
Quality management
Suppliers’ audit “We have visited probably around 95% percent of all of our suppliers and conducted full onsite audits” (FO1-P6) “They [FO1-C1] audit once or twice a year to see whether we comply these practices or not” (FO2-C1-D1)
Quality inspection “Before consolidating in the chilling centre, we first do various quality checks” (FO2-P4) “So, every raw material that comes into through the door we fully test to make sure that the results [product quality test results] are aligned with the certificate of analysis [from the suppliers]” (FO1-P6)
Early warning systems We have one designated person here in the head office, who has a responsibility to oversee the weather updates. [We are] also linked with the
225
SC Resilience Elements Quotations from the Data
weather department to take regular updates, especially in the summer season or just before the Monson season” (FO2-P4)
SC visibility and product traceability systems
Product traceability processes
“We get certificates [product quality tests] from them [suppliers]. So their traceability comes to us, and we attach that in our final product that we produce. So if you have the code or the batch number on the [product], we can trace it back to all levels and then trace it back to our suppliers’ level” (FO1-P11) “All the stock has certain batch numbers that we have here in the systems. […] The distributors’ sales team actually upload that information in the system that a particular batch number is sold to [ABC retailer]” (FO2-P3)
Updated information systems
“We have a common system at every distributor so that we can get the actual point of sales data” (FO2-P3) “We have all the information in our systems to track done that, and then essentially we have samples of all of these products here” (FO1-P3)
7.4.1.2. Preparedness phase
From a disaster management perspective, the preparedness phase refers to pre-disruption
activities to prepare an effective, efficient response (Altay & Green, 2006; Scholten et al.,
2014; Tomasini & Van Wassenhove, 2009). From the perspective of this study, various
participating organisations highlighted strategies to prepare themselves for disruptions such
as earthquakes, floods or a product recall.
7.4.1.2.1. Simulation/Mock Exercises
As explained above, mitigation results in designing various contingency plans that can be
implemented in disruption. To make sure that everyone in the organisation or SC partners,
understands these contingency plans, organisations often engage in simulation or mock
exercises. The analysis showed that these mock exercises enable an organisation to:
Test, review and update plans – enables an organisation to test the applicability of
these plans. Based on this review, there is an opportunity to improve shortcomings
before an event happens.
Train staff – these exercises help organisations to train their employees in how to
handle stressful situations.
Institutionalise risk culture – these training and mock sessions allow employees to
get out of their daily routine and enable them to practise various problem-solving
approaches under the uncertain situations.

226
In addition to inter-organisational mock exercises, it was found that organisations also test
their plans with their SC partners. For example, one key concern for a dairy company is to
test product traceability operations with their SC partners. These plans enable an
organisation (for example FO1) to check the desired level of information and product
visibility across its SC and, most importantly, it allows the company to check if all of its SC
partners can trace the products in a timely manner.
In the context of the literature, mostly the preparedness phase and mock exercises are
discussed in terms of staff training or promoting a risk culture in an organisation (Blackhurst
et al., 2011; Christopher & Peck, 2004; Mandal, 2012; Sheffi & Rice, 2005). However, this
study presents the preparedness phase as a separate construct that enables an organisation
to increase its responsiveness in a real disruption, which is a vital indicator of a resilient SC
(Christopher & Peck, 2004). Table 7.2 presents various quotes from the data linked to the
preparedness phase.
Table 7.2 – Quotations from the data – the preparedness phase
SC Resilience Elements
Quotations from the Data
Preparedness Phase
Simulation/mock exercises
“We have done mock recall recently, [in which we] identified a canned product and […] [asked] our customers that we are doing a mock recall, and you tell us this is the lot, can you tell us where that product is, where it has gone, because they need to do that in their systems as well” (FO1-P1) “Like during these mock exercises, I came for work one-day [during last mock exercise], but they [management] told me that you do not have access to the office today and that was just testing our contingency plans. So, I needed to go to my other designated spot, which was [our] sales office” (FO2-P2)
Trained staff “These training aspects also reflect that our staff is aware of the responsibility to do their roles, as therefore it is essential that our staff is aware and do their job in a responsible manner” (FO1-P3) “We talked to people, the operators, to make sure that they follow good procedures” (FO1-P4)
Additionally, collaboration and a supportive organisational culture were found to be SC
resilience elements applicable to the readiness phase. However, these resilience elements
were found equally crucial for other phases of a disruption. Therefore they are discussed in
Section 7.4.6.
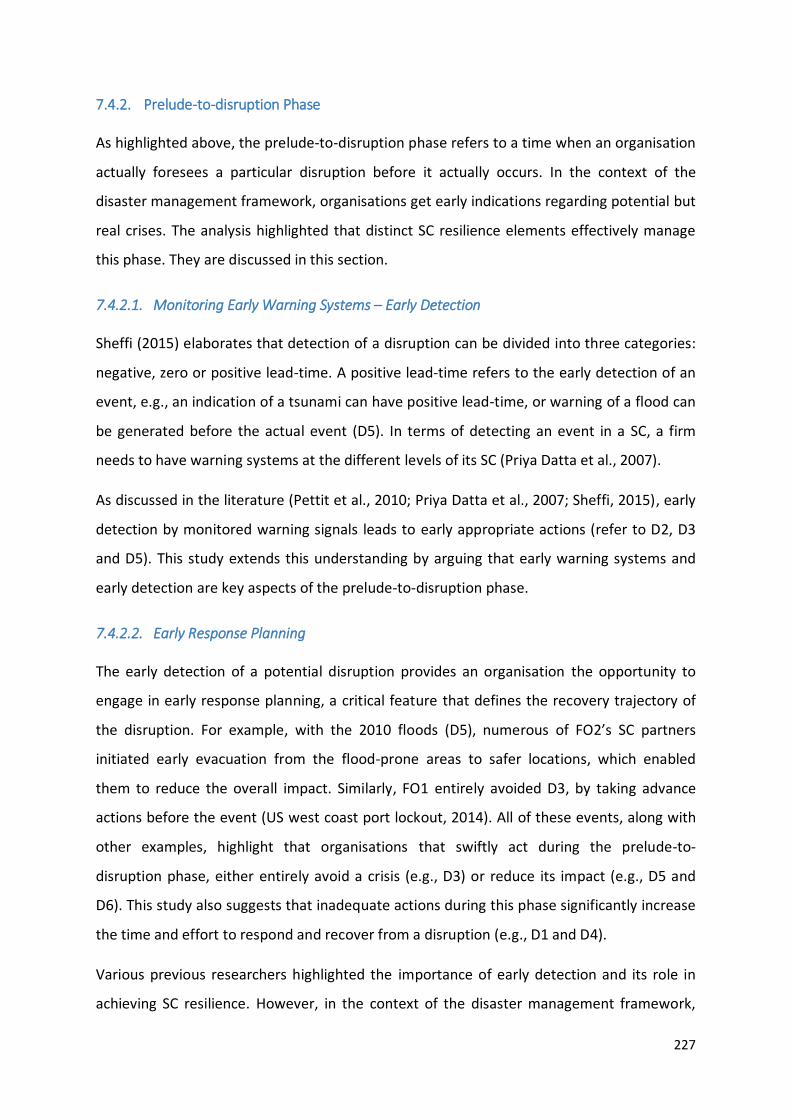
227
7.4.2. Prelude-to-disruption Phase
As highlighted above, the prelude-to-disruption phase refers to a time when an organisation
actually foresees a particular disruption before it actually occurs. In the context of the
disaster management framework, organisations get early indications regarding potential but
real crises. The analysis highlighted that distinct SC resilience elements effectively manage
this phase. They are discussed in this section.
7.4.2.1. Monitoring Early Warning Systems – Early Detection
Sheffi (2015) elaborates that detection of a disruption can be divided into three categories:
negative, zero or positive lead-time. A positive lead-time refers to the early detection of an
event, e.g., an indication of a tsunami can have positive lead-time, or warning of a flood can
be generated before the actual event (D5). In terms of detecting an event in a SC, a firm
needs to have warning systems at the different levels of its SC (Priya Datta et al., 2007).
As discussed in the literature (Pettit et al., 2010; Priya Datta et al., 2007; Sheffi, 2015), early
detection by monitored warning signals leads to early appropriate actions (refer to D2, D3
and D5). This study extends this understanding by arguing that early warning systems and
early detection are key aspects of the prelude-to-disruption phase.
7.4.2.2. Early Response Planning
The early detection of a potential disruption provides an organisation the opportunity to
engage in early response planning, a critical feature that defines the recovery trajectory of
the disruption. For example, with the 2010 floods (D5), numerous of FO2’s SC partners
initiated early evacuation from the flood-prone areas to safer locations, which enabled
them to reduce the overall impact. Similarly, FO1 entirely avoided D3, by taking advance
actions before the event (US west coast port lockout, 2014). All of these events, along with
other examples, highlight that organisations that swiftly act during the prelude-to-
disruption phase, either entirely avoid a crisis (e.g., D3) or reduce its impact (e.g., D5 and
D6). This study also suggests that inadequate actions during this phase significantly increase
the time and effort to respond and recover from a disruption (e.g., D1 and D4).
Various previous researchers highlighted the importance of early detection and its role in
achieving SC resilience. However, in the context of the disaster management framework,

228
early detection of a potential disruption and early response planning are never attributed to
a distinct phase. By introducing this new phase, prelude-to-disruption, this study suggests
that it is the critical phase of the disaster management framework and, therefore, it
improves SC resilience.
Additionally, the analysis presented various other SC resilience elements, apart from early
detection and early response planning, linked to this phase. However, as these elements,
such as SC/network collaboration, situational awareness and supportive organisational
culture, interact with other phases, they are discussed Section 7.4.6. Table 7.3 presents data
linked to the prelude-to-disruption phase.
Table 7.3 – Quotations from the data – prelude-to-disruption
SC Resilience Elements
Quotations from the Data
Prelude-to-Disruption
Monitoring early warning systems
“In this case, we know, and we have historical data that certain diseases break out in certain seasons or time in the year” (FO2-P1) “Pre-crisis communication with the concerned stakeholders would have led to quick and better communication with buyers, [we would have] worked on product traceability and testing regime in advance, and should have avoided overwhelming response from different markets” (FO1-P2)
Early execution of response
Pre-crisis communication
“Actually, it is one of the major challenges, like to warn them in the flooding season and we have made short instructions pamphlets to distribute. […] So we do inform the farmers regarding the flooding season in advance” (FO2-P4) “So, there is a general understanding that one decision can affect others in the organisation, so let’s discuss with them in advance” (FO1-P12)
Taking precautionary actions
"So at the start of every season, the company staff at the chillers [chilling centres] actually advise us to do the vaccination" (FO2-C1-S1) "I think on the DCD situation; if we had any advance warning, even 12 hours or even a few hours of warning, we would have provided fast, swift and more comprehensive response to the customers" (FO1-P3)
7.4.3. Response Phase
As described by Sheffi and Rice (2005), the initial response phase involves controlling the
situation and preventing further damage. For example, in a natural disruption, such as a
flood or earthquake, the initial response involves activities such as saving lives. It often
requires collaboration and coordination among all relevant stakeholders to engage in
response activities. From a humanitarian SC perspective, Cozzolino (2012) describes two
primary objectives of this phase:

229
to activate a temporary network, involve in response activities, and
to restore necessary operations.
In a commercial SC, such as FO1 and FO2 SCs, the response phase reflects an elevated level
of uncertainty and an organisation experiences an interrupted the flow of finished products.
This demands that the SC partners establish quick collaboration and coordination activities
to minimise the negative impact and to restore the basic level of operations. Based on this
understanding and the characteristics of the response phase, the data were classified
accordingly, highlighting various strategies demonstrated by various organisations, linked to
FO1 and FO2 SCs, to quickly respond to SC disruptions. These strategies or sub-elements
were classified under broad SC resilience elements, as described in Chapter 5. The following
section discusses major SC resilience elements particularly applicable to the response phase.
7.4.3.1. Crisis Management Team
An immediate impact of a SC disruption involves an increased level of uncertainty. During
these highly uncertain situations, a rapid response is a key criterion to show resilience
(Blackhurst et al., 2011; Knemeyer, Zinn, & Eroglu, 2009; Wieland & Wallenburg, 2013). A
delayed response to a disruption can result in financial implications, and diminishes
competitive advantage (Pettit et al., 2013; Sheffi & Rice, 2005). As the response phase
reflects a highly volatile environment compared with the stable business environment, it
requires managers to make sense of these uncertainties. A crisis management team plays a
critical role and enables communication with key partners and acts as a knowledge hub to
gather, analyse, decide and disseminate information to the relevant stakeholders (as
highlighted in Sections 5.3.1 & 5.3.3).
Previous studies in disaster management literature highlight the importance of
collaboration between various humanitarian relief partners (such as government
authorities, donor agencies, and NGOs) to initiate relief and rescue operations (Cozzolino,
2012; Kovács & Spens, 2007). Similarly, Scholten et al. (2014) studied Voluntary Organisation
Active in Disaster (VOAD) and highlights that immediate response to a disruption requires
developing communication ties and collaboration among the relevant stakeholders to
initiate the relief operations that include implementation of response plans and
measurements. Similarly, from a commercial SC perspective, some scholars highlight crisis
230
management as part of responding and recovering from a disruption. For example, Sheffi
(2015) explains the example of General Motors (GM) in response to Japan’s 2011
earthquake. Immediately after the disruption, senior management at GM convened a war-
room involving key people across the organisation. This team then collaborated with the key
stakeholders (suppliers and buyers) to understand various uncertainties and became
involved in rapid decision-making. Similar examples of a team, referred to as a crisis
management team in this study, are highlighted by other authors when discussing a
response to a SC disruption, such as Toyota’s response to a fire in its supplier’s plant (Aisin)
in 1997 (Nishiguchi & Beaudet, 1998).
This study suggests that a crisis management team plays an overarching role in dealing with
a disruption. Notably, a crisis management team establishes communication links with the
relevant stakeholders, which is a critical part of planning the response and recovery
activities.
7.4.3.2. Crisis Communication
Information sharing and collaborative communication, along with others, are critical SC
collaborative activities (Cao & Zhang, 2011). Scholten and Schilder (2015) report that
collaborative communication, information sharing and joint knowledge enable visibility and
velocity across a SC, hence lead to a resilient SC. Other studies have also highlighted the
importance of SC collaboration, including information sharing, in achieving resilience
(Carvalho, Barroso, Machado, Azevedo, & Machado, 2011; Fiksel, Polyviou, Croxton, &
Pettit, 2015; Pettit et al., 2010; Ponis & Koronis, 2012; Ponomarov & Holcomb, 2009; Sheffi,
2015; Sheffi & Rice, 2005; Tukamuhabwa et al., 2015). Though this research found a similar
criticality of SC collaboration in preparing for, responding to and recovering from a
disruption. However, within SC collaboration, crisis communication with the key
stakeholders, such as media, regulatory authorities and customers are found fundamentally
critical during the response phase.
In a food safety issue (D1 & D2), timely, accurate and regular communication with external
stakeholders directly define the effective responsiveness of a company. Poorly managed
crisis communication can cause reputation loss to a company (Coombs & Holladay, 2002;
Koronis & Ponis, 2012), and it can be because of ineffective crisis communication (see D1 &

231
D2, Section 5.3.5). A literature review brings many examples of organisations unable to
effectively manage crisis communication with the key stakeholders, which impacts
negatively on a company’s reputation (Burke, Martin, & Cooper, 2011), such as Nike’s
response to negative publicity about labour exploitation in its overseas suppliers’ factories
(Spar & Burns, 2000). In parallel, disruptions like a flood or a disease breakout (D5 & D6),
effective crisis communication allows organisations or government bodies to disseminate
critical information and immediate response guidelines to the most vulnerable members in
a SC (such as local communities or farmers).
Therefore, this study suggests that crisis communication is a separate construct from the
other elements of collaboration and it is found that effective crisis communication results in
increased responsiveness especially during the immediate response phase, and hence
increases the resiliency of a SC.
In addition to these two elements, situational awareness, quick decision making, a
supportive organisational culture and learning attitude were noted as SC resilience elements
not only linked to the response phase but also to other phases. As these elements are
important to multiple phases, they are discussed separately in Section 7.4.6. Table 7.4
presents quotations from the data classified under the response phase.
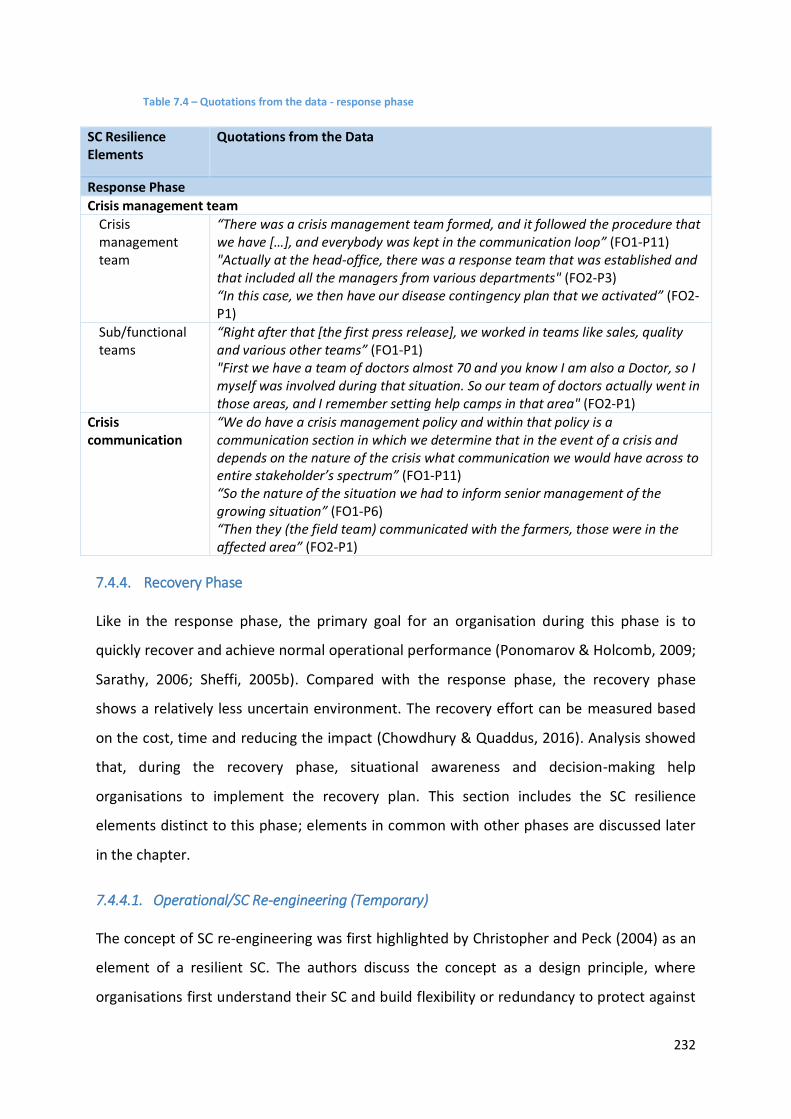
232
Table 7.4 – Quotations from the data - response phase
SC Resilience Elements
Quotations from the Data
Response Phase
Crisis management team
Crisis management team
“There was a crisis management team formed, and it followed the procedure that we have […], and everybody was kept in the communication loop” (FO1-P11) "Actually at the head-office, there was a response team that was established and that included all the managers from various departments" (FO2-P3) “In this case, we then have our disease contingency plan that we activated” (FO2- P1)
Sub/functional teams
“Right after that [the first press release], we worked in teams like sales, quality and various other teams” (FO1-P1) "First we have a team of doctors almost 70 and you know I am also a Doctor, so I myself was involved during that situation. So our team of doctors actually went in those areas, and I remember setting help camps in that area" (FO2-P1)
Crisis communication
“We do have a crisis management policy and within that policy is a communication section in which we determine that in the event of a crisis and depends on the nature of the crisis what communication we would have across to entire stakeholder’s spectrum” (FO1-P11) “So the nature of the situation we had to inform senior management of the growing situation” (FO1-P6) “Then they (the field team) communicated with the farmers, those were in the affected area” (FO2-P1)
7.4.4. Recovery Phase
Like in the response phase, the primary goal for an organisation during this phase is to
quickly recover and achieve normal operational performance (Ponomarov & Holcomb, 2009;
Sarathy, 2006; Sheffi, 2005b). Compared with the response phase, the recovery phase
shows a relatively less uncertain environment. The recovery effort can be measured based
on the cost, time and reducing the impact (Chowdhury & Quaddus, 2016). Analysis showed
that, during the recovery phase, situational awareness and decision-making help
organisations to implement the recovery plan. This section includes the SC resilience
elements distinct to this phase; elements in common with other phases are discussed later
in the chapter.
7.4.4.1. Operational/SC Re-engineering (Temporary)
The concept of SC re-engineering was first highlighted by Christopher and Peck (2004) as an
element of a resilient SC. The authors discuss the concept as a design principle, where
organisations first understand their SC and build flexibility or redundancy to protect against
233
SC disruptions. Here, the basic understanding revolves around designing various SC
operations before a disruption. Building on this understanding, Scholten et al. (2014)
describe the application of SC re-engineering in the recovery phase. That study focused on
voluntary organisations active in a disruption, such as a relief SC, and found that restoring
operations at the desired level may require re-engineering of various SC nodes or players.
Building on the concept of SC re-engineering introduced by Scholten et al. (2014), this study
offers a slightly enhanced application of the concept during the recovery phase. As
discussed in the readiness phase, SC/network understanding enables an organisation to
design various strategies to protect against a disruption, which means introducing strategies
such as switching from a single supplier strategy to multiple suppliers or diversifying the
product mix. In addition, the analysis also highlighted that, during a disruption, an
organisation might also need to innovate or modify its SC design characteristics, e.g.,
sourcing from an entirely new source (such as from its competitors, see D3) or temporarily
serving a different customer base (such as D1 and D5). It may also require quickly
developing new processes (such as designing/modifying testing methods, see D1 and D2).
Here, SC/operational re-engineering involves a combination of other strategies/sub-
elements such as leveraging from flexible operations, utilising redundant resources or
introducing an entirely new process/source of supply. All of these adjustments are assessed
based on the distinct requirements of a disruption and then an organisation/SC implements
a combination of these strategies to restore its operations.
Secondly, the analysis highlighted that SC/operational re-engineering during the recovery
stage reflects only a temporary change, meaning that organisations shift back to the
previous structure or adapt to an entirely new structure or process after a disruption. For
example, during the recovery stage procuring from a new source (such as competitors)
means a change in SC design. However, the example D3 showed that FO1 did not continued
sourcing from its competitors after the disruption, which indicates FO1 re-engineered its SC
operations on a temporary basis during the recovery phase. The literature also highlights
examples of such approach, e.g., Toyota’s response to a fire in its supplier’s (Aisin) plant
required it to develop new sources of supply that enabled the company to restore its
operations (Nishiguchi & Beaudet, 1998). However, once the supplier’s plant was back to
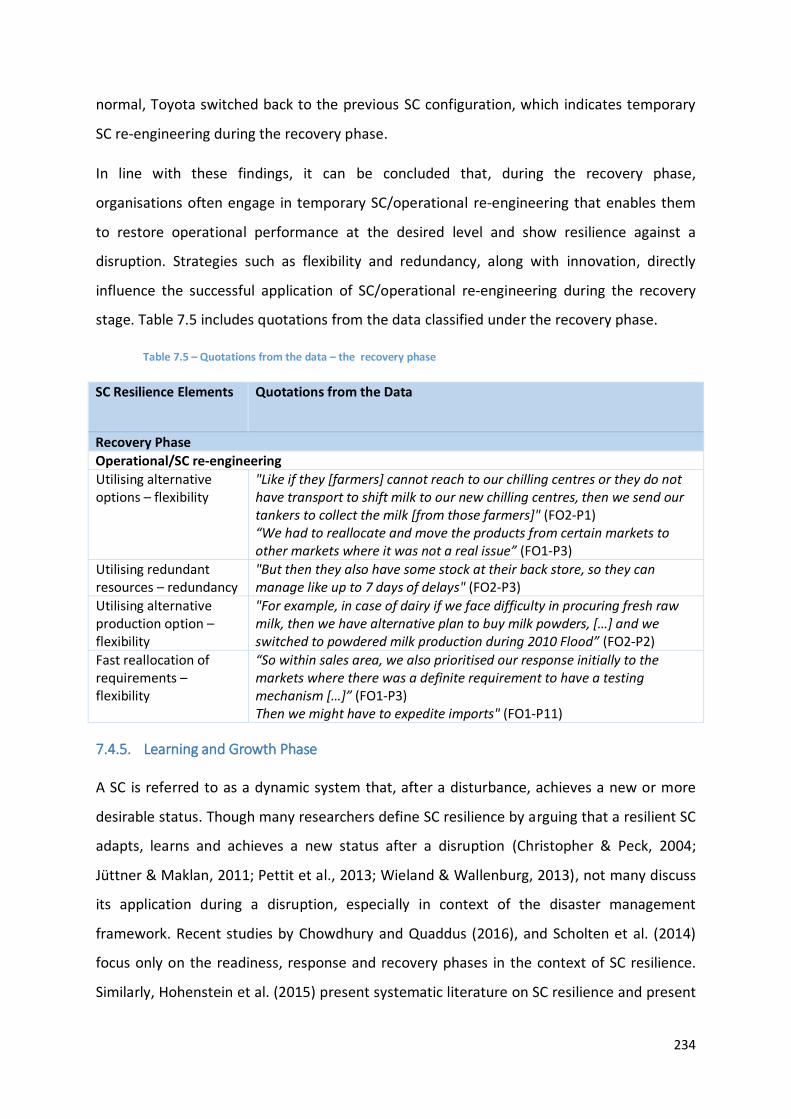
234
normal, Toyota switched back to the previous SC configuration, which indicates temporary
SC re-engineering during the recovery phase.
In line with these findings, it can be concluded that, during the recovery phase,
organisations often engage in temporary SC/operational re-engineering that enables them
to restore operational performance at the desired level and show resilience against a
disruption. Strategies such as flexibility and redundancy, along with innovation, directly
influence the successful application of SC/operational re-engineering during the recovery
stage. Table 7.5 includes quotations from the data classified under the recovery phase.
Table 7.5 – Quotations from the data – the recovery phase
SC Resilience Elements Quotations from the Data
Recovery Phase
Operational/SC re-engineering
Utilising alternative options – flexibility
"Like if they [farmers] cannot reach to our chilling centres or they do not have transport to shift milk to our new chilling centres, then we send our tankers to collect the milk [from those farmers]" (FO2-P1) “We had to reallocate and move the products from certain markets to other markets where it was not a real issue” (FO1-P3)
Utilising redundant resources – redundancy
"But then they also have some stock at their back store, so they can manage like up to 7 days of delays" (FO2-P3)
Utilising alternative production option – flexibility
"For example, in case of dairy if we face difficulty in procuring fresh raw milk, then we have alternative plan to buy milk powders, […] and we switched to powdered milk production during 2010 Flood” (FO2-P2)
Fast reallocation of requirements – flexibility
“So within sales area, we also prioritised our response initially to the markets where there was a definite requirement to have a testing mechanism […]” (FO1-P3) Then we might have to expedite imports" (FO1-P11)
7.4.5. Learning and Growth Phase
A SC is referred to as a dynamic system that, after a disturbance, achieves a new or more
desirable status. Though many researchers define SC resilience by arguing that a resilient SC
adapts, learns and achieves a new status after a disruption (Christopher & Peck, 2004;
Jüttner & Maklan, 2011; Pettit et al., 2013; Wieland & Wallenburg, 2013), not many discuss
its application during a disruption, especially in context of the disaster management
framework. Recent studies by Chowdhury and Quaddus (2016), and Scholten et al. (2014)
focus only on the readiness, response and recovery phases in the context of SC resilience.
Similarly, Hohenstein et al. (2015) present systematic literature on SC resilience and present
235
growth as a separate phase from recovery. Interestingly, their study reported that the
readiness and growth phases are relatively less researched aspects of SC resilience.
The definition of SC resilience highlights growth as a concept to exploit a disruption by
developing specific elements to boost performance and learning by reflecting on the event.
Additionally, learning, adapting and exploring new opportunities are the main
characteristics discussed by many authors when defining the concept (Christopher & Peck,
2004; Jüttner & Maklan, 2011; Pettit et al., 2013; Wieland & Wallenburg, 2013; Yilmaz
Borekci et al., 2015). This section brings in the distinct SC resilience elements applicable
especially during learning and growth phase as learnt from the analysis.
7.4.5.1. Learning Attitude – Review Teams and Gap Analysis
Achieving a competitive advantage is considered as one outcome of SC resilience (Datta,
2017; Leat & Revoredo-Giha, 2013; Ponomarov & Holcomb, 2009; Soni, Jain, & Kumar,
2014). Pettit et al. (2010) attribute learning attitude to part of adaptability and inter-
organisational capability. This study found that a learning attitude is an integral part of
learning and growth, which an organisation initiates once it attains normal operational
performance after a disruption. The examples of D1 and D2 highlight that FO1, with the
collaboration of relevant partners learnt from various shortcomings. For example, an
outcome of D2 was an industry-wide working group to recommend best practice regarding
product traceability for the dairy companies. Other examples showed review teams and gap
analysis as major elements of learning. Learning ability also enables a company to better
prepare for future disruptions (Ponomarov & Holcomb, 2009), and post-disruption analysis
positively influences SC resiliency (Blackhurst et al., 2011).
In line with these findings, it is proposed that learning ability, including crisis review teams
and gap analysis, is an essential element of the learning and growth phase and this learning
ability increases SC resilience against future events.
7.4.5.2. Operational/SC Re-Engineering (Permanent)
As discussed in the previous section, operational/SC re-engineering entails an organisation’s
ability to maintain normal or the desired performance by reconfiguring operations or the SC
structure. On a similar understanding, the growth phase contributes to permanent re-
236
engineering, either by reconfiguring to the pre-disruption status or changing to a new
configuration/process.
The findings highlight that once an organisation achieves normal operational performance in
the recovery stage, it reconfigures its operations or SC configuration again during the
learning phase. For example, during flood 2010, FO2 changed its production process (by
adopting an alternative production process). After the disruption, the company shifted back
to the normal process. Here, a crisis review and gap analysis provide an organisation with a
suitable option, either to permanently re-engineer or switch back to the previous
configuration. The discussion here is not around whether a company should or should not
change its operational/SC structure or configuration. The analysis of all six disruptions
highlighted that crisis review teams and gap analysis after a disruption enable managers to
take these decisions as per the requirements.
Therefore, it can be concluded that a crisis review and gap analysis provide an organisation
with the ability to engage permanently in operational/SC re-engineering after a disruption,
which, in turn, enhances its ability to protect against future disruptions. This phase then
feeds into the readiness phase, which makes the disaster management framework a cyclic
process rather than a linear process.
In addition to the two elements discussed above, other resilience elements are part of the
learning and growth phase that are discussed in Section 7.4.6. Table 7.6 presents quotes
from the data under learning and growth phase.
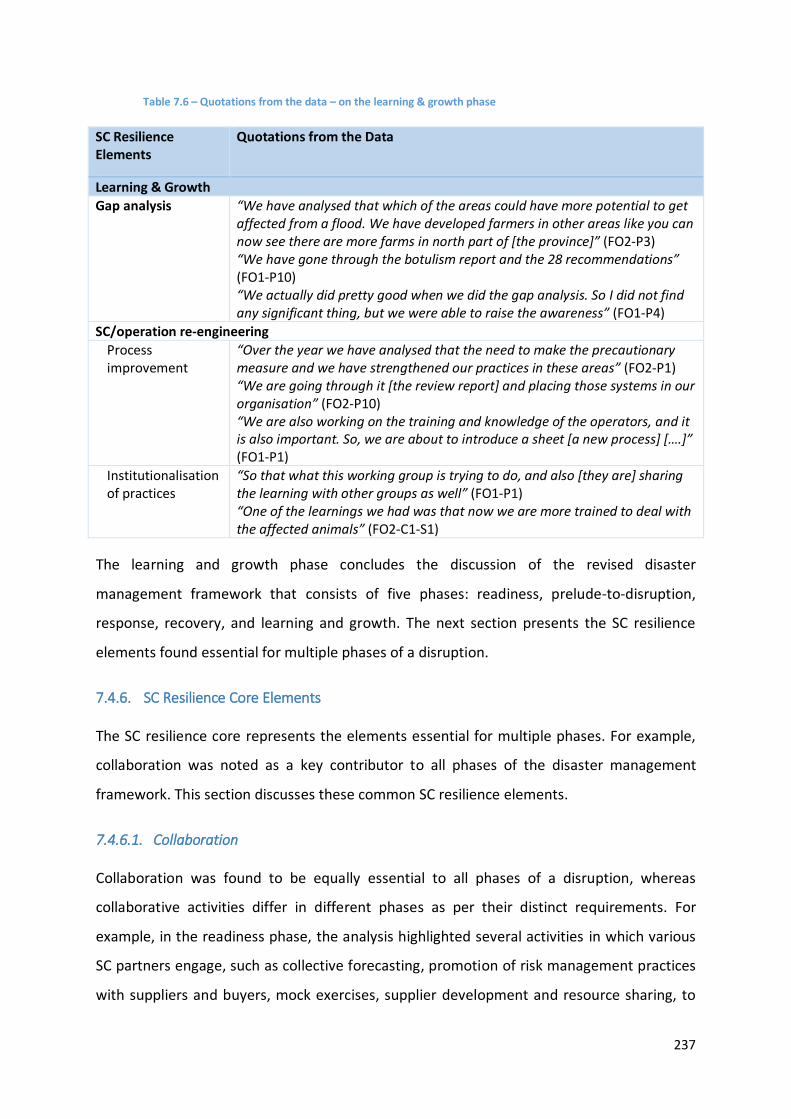
237
Table 7.6 – Quotations from the data – on the learning & growth phase
SC Resilience Elements
Quotations from the Data
Learning & Growth
Gap analysis “We have analysed that which of the areas could have more potential to get affected from a flood. We have developed farmers in other areas like you can now see there are more farms in north part of [the province]” (FO2-P3) “We have gone through the botulism report and the 28 recommendations” (FO1-P10) “We actually did pretty good when we did the gap analysis. So I did not find any significant thing, but we were able to raise the awareness” (FO1-P4)
SC/operation re-engineering
Process improvement
“Over the year we have analysed that the need to make the precautionary measure and we have strengthened our practices in these areas” (FO2-P1) “We are going through it [the review report] and placing those systems in our organisation” (FO2-P10) “We are also working on the training and knowledge of the operators, and it is also important. So, we are about to introduce a sheet [a new process] [….]” (FO1-P1)
Institutionalisation of practices
“So that what this working group is trying to do, and also [they are] sharing the learning with other groups as well” (FO1-P1) “One of the learnings we had was that now we are more trained to deal with the affected animals” (FO2-C1-S1)
The learning and growth phase concludes the discussion of the revised disaster
management framework that consists of five phases: readiness, prelude-to-disruption,
response, recovery, and learning and growth. The next section presents the SC resilience
elements found essential for multiple phases of a disruption.
7.4.6. SC Resilience Core Elements
The SC resilience core represents the elements essential for multiple phases. For example,
collaboration was noted as a key contributor to all phases of the disaster management
framework. This section discusses these common SC resilience elements.
7.4.6.1. Collaboration
Collaboration was found to be equally essential to all phases of a disruption, whereas
collaborative activities differ in different phases as per their distinct requirements. For
example, in the readiness phase, the analysis highlighted several activities in which various
SC partners engage, such as collective forecasting, promotion of risk management practices
with suppliers and buyers, mock exercises, supplier development and resource sharing, to
238
protect against a potential disruption. During the response and recovery phases, the SC or
network partners work together to collectively plan and implement the response and
recovery activities. Lastly, in the context of the learning and growth phase, various examples
from the analysis highlight that organisations collectively learn from a disruption and
develop various strategies to deal with future events.
The literature on SC resilience presents the importance of SC collaboration as an essential
element (Hohenstein et al., 2015; Kamalahmadi & Parast, 2016; Tukamuhabwa et al., 2015).
However, this study extends the understanding of collaboration by arguing that
collaborative activities and actors (SC/network partners) differ during different phases of a
disruption. SC/network understanding and situational awareness provide an organisation
with insights around critical SC or network partners essential for resolving the issue as per
requirements of each phase.
7.4.6.2. Situational Awareness and Quick Decision Making
Compared with other SC resilience elements, situational awareness and quick decision
making were the two elements noted as the distinct contribution of this study. Notably,
recent systematic reviews on SC resilience do not highlight situational awareness or quick
decision making contributing factors to achieve SC resilience (see Datta (2017);
Kamalahmadi and Parast (2016); Hohenstein et al. (2015); Tukamuhabwa et al. (2015).
However, in literature from organisational resilience or emergency management, various
scholars have recognised situational awareness as an element to effectively manage a
crisis/disaster (Gabler, Richey, & Stewart, 2017; Lee, Vargo, & Seville, 2013; Luokkala &
Virrantaus, 2014; Seppänen & Virrantaus, 2015; Seville & Vargo, 2011). For example, Lee et
al. (2013) highlight that quick decision making and situational awareness contribute to an
organisation’s adaptive capacity, a key indicator of resilience. This study presents similar
findings on situational awareness and quick decision-making to increase responsiveness,
hence improve SC resilience.
Though situational awareness links with multiple phases of a disruption, it was learnt that
prelude-to-disruption and the response phase create a high-level of an uncertain
environment. Therefore, it is profoundly linked with these two phases. For example, in flood
2010 (D5), the prelude-to-disruption phase commenced when FO2 started receiving early
239
warnings regarding upcoming adverse weather condition. FO2’s quick understanding of the
situation and decision making enabled it to reduce the impact of the flood for its SC
operations. Therefore, in line with these findings, this study proposes that situational
awareness and quick decision making directly influence organisations’ or SCs’ ability to
quickly plan, respond, recover and learn from a disruption, hence enhance SC resilience.
7.4.6.3. Supportive Organisational Culture and Learning Attitude
The findings of this study highlight a supportive organisational culture and learning attitude
as key elements that interact with multiple phases of a disruption. Regarding the readiness
phase, the analysis highlighted that top management builds a supportive culture within an
organisation through activities like team building exercises and cross-functional training
sessions. The literature talks about building a risk management culture in an organisation
through top management support and establishing cross-functional teams (Blackhurst et al.,
2011; Christopher & Peck, 2004; Pettit et al., 2010; Sheffi, 2005c; Sheffi & Rice, 2005;
Tukamuhabwa et al., 2015). During the readiness phase it is essential to train, empower and
educate employees on risk management practices and contingency planning through
various activities. However, this study found a role for a day-to-day informal culture to
increase responsiveness during a disruption. For example, an informal culture details how
people in different departments or organisations interact with each other on a daily basis. It
was learnt that this informal culture influences the fast and smooth flow of critical
information sharing during a disruption.
In the context of the response and recovery phases, supportive leadership or top
management facilitates staff members to make quick decisions. Similarly, an open culture
between the SC/network partners enables quick sharing of critical information (as
highlighted in D1 and D2). Similarly, a learning attitude appears in all phases of a disruption.
In the readiness phase, learning from others’ mistakes and previous disruptions was
identified as a critical enabler of preparing for future disruptions (strongly noted in D1, D2,
and D5). During the prelude-to-disruption phase, an organisation needs to monitor and
learn from early warning signals to plan early and respond to a disruption. Likewise, after a
disruption, organisations in a SC individually and collectively must reflect and learn from
their performance during the disruption.

240
This study suggests that a supportive organisational culture and learning attitude facilitate
various other SC resilience elements, such as situational awareness and quick decision
making, which enable effective planning and management of a disruption. Table 7.7
presents quotations from the data applicable to all stages of the disaster management
framework.
Table 7.7 – Quotations from the data - essential for all phases
SC Resilience Elements
Quotations from the Data
Essential to all Phases
Situational awareness
Continuous updates and information sharing
“[For that] We gathered information from the buyers and also gathered from the system that we had here at that time” (FO1-P3) "I managed the daily call back to MPI, and they informed the people from the industry" (FO1-P11) "So just before the announcement and then probably for the three weeks after, there were daily conference calls. […] we just wanted the data and more information from Fonterra to see the full scale of the problem" (FO1-P2)
Analysing situation – comprehending & projecting
“Based on the information we receive, they then run various analysis to understand how the weather would going to impact us. We also analysis that how this is going to affect our farmers and distributors. […] we have dedicated person working on these kinds of analysis" (FO2-P1) “My first response was to draft a table of our lactose and then map up dairy consumption and then also map up the shipments to see when it is coming in and to see what our stock position were and where the pinch point was” (FO1-P6)
Supportive organisational culture
Open culture “I think it is more related to the openness and helping out each other during those difficult situations rather than gaining any financial benefit out of it" (FO1-P9)
Institutionalisation of practices
“One part is developing the procedures [or systems], and other is then to execute and implement that in the factory. So that where we are struggling too” (FO1-P1)
Learning attitude “We focused on where we saw some potential improvements” (FO1-P4) “While talking to some of our other colleagues in the industry, there were some manufacturers other than Fonterra that did have products that were stopped at the borders" (FO1-P4)
SC collaboration
Information sharing “We get regular updates from Pakistan Meteorological Department. […]" (FO2-P1) “So, what we did was we tried to initiate a debate at DCANZ, and we found out that the others were also facing the same kind of problem” (FO1-P2)
Joint problem solving
“We also helped farmers to move their livestock from the potentially affected areas” (FO2-P1) "Once FO2 figured out that there might be a flood that could affect our operations. Then they actually asked us to hold more inventory" (FO2-D1)
Coopetition “So, the information was communicated, and all of the industry players did some of the brainstorming regarding how to handle the situation" (FO1-P2)
241
SC Resilience Cycle
Based on the discussion in this chapter, the SC resilience model proposed in Chapter 6
(Section 6.5) is further explored and refined in the context of the disaster management
framework. The above discussion can be summarised in the following points:
SC resilience elements distinct to each phase of a disruption help in implementing
various strategies (sub-elements) as per the requirements of that phase.
Overall, SC resilience is a cyclic process and organisations build resilience as an
ongoing process.
Various SC resilience elements of the readiness phase directly influence an
organisation’s performance during the response and recovery phase (also
highlighted in Section 6.5.
Various SC resilience elements were applicable to multiple phases of a disruption;
these are the “SC resilience core elements”.
Lastly, a new phase called “prelude-to-disruption” allows an organisation to foresee
a potential disruption and, accordingly, pre-plan for response and recovery efforts.
In conclusion, Figure 7.5 presents the SC resilience cycle and highlights the various SC
resilience elements attached to each phase. The figure shows two sets of SC resilience
elements. The first set interacts with a single phase, such as readiness phase involving risk
management and response phase involving the crisis management team. The second set
involves SC resilience elements that interact with multiple phases of the framework
(highlighted in the middle circle), such as the SC/network, collaboration and situational
awareness.
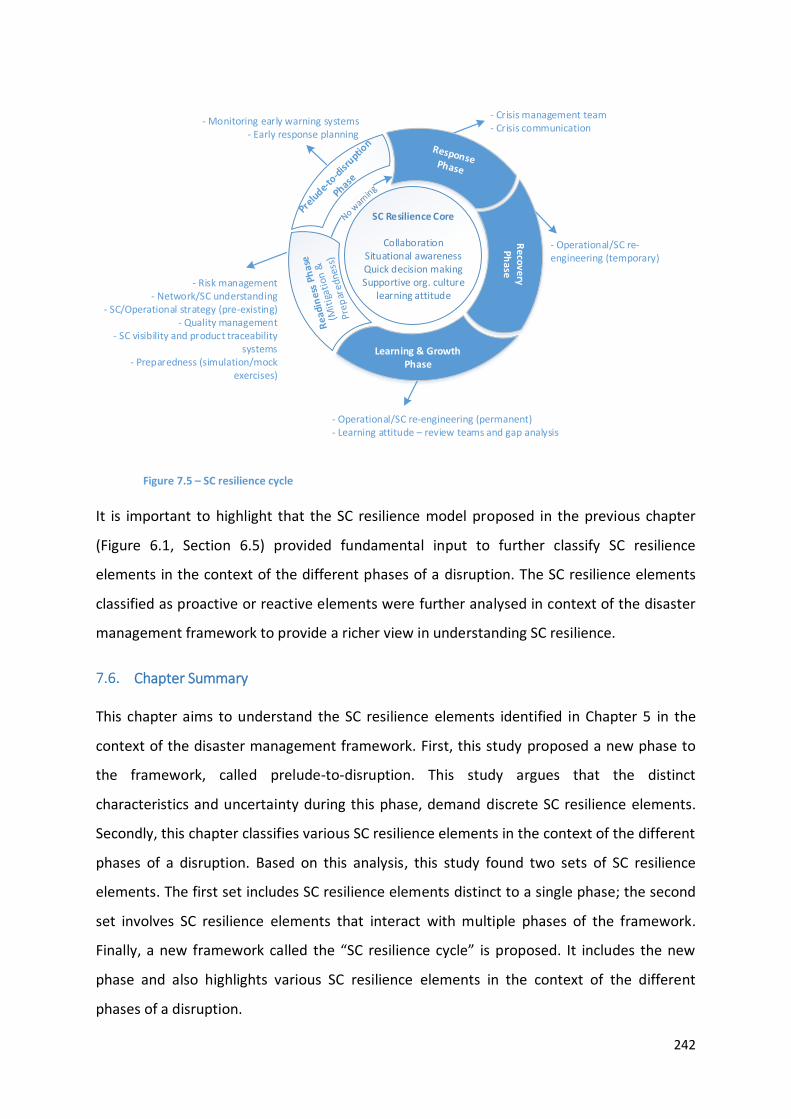
242
SC Resilience Core
CollaborationSituational awarenessQuick decision makingSupportive org. culture
learning attitude- Risk management
- Network/SC understanding- SC/Operational strategy (pre-existing)
- Quality management- SC visibility and product traceability
systems- Preparedness (simulation/mock
exercises)
- Monitoring early warning systems- Early response planning
- Crisis management team- Crisis communication
- Operational/SC re-engineering (temporary)
- Operational/SC re-engineering (permanent)- Learning attitude – review teams and gap analysis
Re
cov
ery
Ph
ase
Learning & Growth Phase
Figure 7.5 – SC resilience cycle
It is important to highlight that the SC resilience model proposed in the previous chapter
(Figure 6.1, Section 6.5) provided fundamental input to further classify SC resilience
elements in the context of the different phases of a disruption. The SC resilience elements
classified as proactive or reactive elements were further analysed in context of the disaster
management framework to provide a richer view in understanding SC resilience.
Chapter Summary
This chapter aims to understand the SC resilience elements identified in Chapter 5 in the
context of the disaster management framework. First, this study proposed a new phase to
the framework, called prelude-to-disruption. This study argues that the distinct
characteristics and uncertainty during this phase, demand discrete SC resilience elements.
Secondly, this chapter classifies various SC resilience elements in the context of the different
phases of a disruption. Based on this analysis, this study found two sets of SC resilience
elements. The first set includes SC resilience elements distinct to a single phase; the second
set involves SC resilience elements that interact with multiple phases of the framework.
Finally, a new framework called the “SC resilience cycle” is proposed. It includes the new
phase and also highlights various SC resilience elements in the context of the different
phases of a disruption.
243
Chapter 8. Discussion and Conclusions
Introduction
This thesis set out to identify various elements that help organisations build a resilient SC
and to find out how these elements relate with different phases of a disruption. This aim
was achieved by investigating six SC disruptions affecting two dairy SCs, one from New
Zealand and the other in Pakistan. In Chapter 5, the key SC resilience elements were
identified. The chapter includes an explanation of how these elements help to improve SC
resilience. The SC resilience elements have been classified into two categories: proactive
and reactive elements. In Chapter 6, the relative importance of the SC resilience elements
has been identified. This resulted in the identification of various research propositions and a
SC resilience model. In Chapter 7, a revised disaster management cycle was proposed that
includes a new phase called “prelude-to-disruption”. Chapter 7 also identified the
importance of SC resilience elements within each phase of the disaster management cycle.
Chapter 8 discusses the implications and contributions of this study. It consists of following
sections:
A summary and discussion of the findings
The contribution of this study to knowledge
The limitations of this study
Future research directions
Summary and Discussion of Findings
In today’s complex business environment, interest in SC resilience has grown significantly
because it provides the SC with the ability to better prepare and manage any adversity.
Particularly, SC resilience literature highlights various elements or strategies that enable an
organisation to deal with an SC disruption effectively. For example, flexibility enables an
organisation or SC to alter or adjust various processes as required during a disruption,
whereas, redundancy reflects an organisation’s efforts to keep an extra cushion against
various resources that can be used during a disruption (Dmitry et al., 2014; Ishfaq, 2012;
Sheffi & Rice, 2005; Yi et al., 2011). Though the literature offers various elements to build SC
resilience, they do not explain how these elements relate to the different phases highlighted
244
in the SC resilience definition (Hohenstein et al., 2015). Fundamentally, the SC resilience
definition reflects four main characteristics – ability to prepare, respond, recover and grow
in the face of a disruption (Golgeci & Ponomarov, 2013; Peck, 2005; Pettit et al., 2013; Ponis
& Koronis, 2012; Ponomarov & Holcomb, 2009), which correspond to the disaster
management cycle highlighted in various stages of a disruption (Ponomarov & Holcomb,
2009). Though theoretical similarities exist between SC resilience and disaster management
cycle, the literature offers limited empirical investigation on the subject. To best of the
researcher’s knowledge, two studies (Chowdhury & Quaddus, 2016; Scholten et al., 2014)
explore the concept of SC resilience in the concepts of event readiness (Mitigation &
Preparedness), response and recovery. However, both of these studies ignore an essential
element of resilience and disaster management framework, i.e., the growth phase.
To explore SC resilience in the context of the disaster management cycle, first, this study
explores “elements that help build a resilient SC in the context of a dairy SC”. The basic
rationale for empirically investigating SC resilience elements was based on the following
reasons:
The literature review indicates that most theory building studies are based on the
manufacturing sector; limited focus has been given to the agricultural sector.
Organisations operating in agriculture have inherent distinct challenges, such as the
perishable nature of the products, food safety concerns and high fluctuations in
demand and supply (Green, 2010; Salin, 1998; Shukla & Jharkharia, 2013; Van der
Vorst & Beulens, 2002), which can create more challenges for organsiations
operating in such an industry. These distinct characteristics and numerous
vulnerabilities during a disruption provide an opportunity to explore the SC resilience
concept in the agricultural context.
Secondly, most studies on SC resilience are based on organisations and SC disruption
linked to developed countries. Tukamuhabwa et al. (2015) highlight that
organisations operating in developing countries encounter distinct challenges that
may require distinct capabilities to deal with them. This study explores SCs from both
a developed and a developing country, which is unique in the SC resilience literature.
Based on these research gaps, this study aimed to explore the following research questions:
245
RQ1: What are the elements that help build a resilient supply chain in the context of a
dairy supply chain?
RQ1.1: How do the supply chain resilience elements differ for dairy organisations
operating in a developed country (New Zealand) compared with organisations
operating in a developing country (Pakistan)?
RQ1.2: How do the supply chain resilience elements differ for an operational
disruption compared with a major supply chain disruption?
RQ2: How do the various elements of supply chain resilience relate to the Disaster
Management Framework – Readiness, Response, Recovery and Learning & Growth?
This section summarises the key findings that emerged from this study and highlights the
relevance of these findings within the literature.
8.2.1. SC Resilience Elements
To answer the research questions, this study applied the case study method to empirically
explore six SC disruptions affecting two dairy SCs, one from New Zealand and the other in
Pakistan. Primarily, this study identified various SC resilience elements that enable
organisations in a SC to better prepare, respond, recover and learn from a disruption. To
recap, the following list briefly presents the SC resilience elements identified in Chapter 5:
A crisis management team
Risk management
Situational awareness and quick decision making
Collaboration
Network/SC understanding
Crisis communication
SC/operational strategy (pre-existing)
Operational/SC re-engineering
Quality management
SC visibility
Product traceability
A supportive organisational culture
246
A learning attitude
These elements provide the key insights to achieving SC resilience. First, situational
awareness and quick decision making were found to be critical elements in responding to a
disruption. Particularly, this study found that the response and recovery phases of a
disruption present a chaotic environment, which the organisations in the SC first need to
understand. All subsequent decisions, such as utilising redundant resources or switching to
a new or backup supplier, are subjective to the organisation’s or SC’s situational awareness.
Previous research focused more on operational factors such as building flexibility or
redundancy in SC operations in responding to a disruption (Dmitry et al., 2014; Ishfaq, 2012;
Rice & Caniato, 2003; Sheffi & Rice, 2005). For example, Hohenstein et al. (2015) synthesise
various elements of SC resilience and highlight flexibility, visibility, capacity and redundancy
as key elements for the response and recovery stages. This study found flexibility and
redundancy in SC operations as strategies to combat a disruption. However, decisions
regarding these operational reconfigurations depend on an organisation’s or SC’s ability to
understand the dynamic environment, which then leads to relevant and quick decision
making.
Comparative analysis showed that situational awareness and quick decision making are the
guiding principles that differentiate a quick response to a disruption versus a delayed
response. This finding can be explained by the fact that organisations first need to
understand the uncertainties and dynamics during a disruption, which then enables the
execution of appropriate strategies to deal effectively with that disruption. It can be inferred
that a lack of situational understanding during a disruption could result in delays or
misaligned execution, which can negatively influence SC resilience.
This finding can be explained by the fact that this study used the disaster management
cycle, which defines the distinct environmental dynamics associated with each phase. This
study finds that organisations in a SC first need to adhere the situational dynamic to take
appropriate decisions. Various scholars from other disciplines, such as organisational
resilience or emergency management, have recognised situational awareness as an element
to effectively manage a crisis/disaster (Gabler et al., 2017; Lee et al., 2013; Luokkala &
Virrantaus, 2014; Seppänen & Virrantaus, 2015; Seville & Vargo, 2011). For example, Lee et

247
al. (2013) highlight that quick decision making and situational awareness contribute to an
organisation’s adaptive capacity, a key indicator of resilience. This study presents similar
findings on situational awareness and quick decision-making to increase responsiveness,
hence improve SC resilience.
Further, collaboration among the SC or network partners was noted as another important
element to plan effectively and deal with a disruption. Particularly, collaboration and
situation awareness complement each other during a disruption. For example, collaboration
allows organisations and SC partners to share information regarding environmental
dynamics, which then enables them to understand the situation. An organisation’s
understanding of the situation allows it to identify critical nodes or SC partners during a
disruption, which then leads to collaboration among those SC partners. Collaborative
activities among SC partners include knowledge sharing, joint problem solving, centralised
communication, synchronised decision making, resource sharing and supplier development.
The literature on SC resilience presents the importance of SC collaboration as an essential
element and highlights collaborative activities (Hohenstein et al., 2015; Kamalahmadi &
Parast, 2016; Tukamuhabwa et al., 2015). However, this study extends the understanding of
collaboration by arguing that collaborative activities and actors (SC/network partners) differ
during different phases of a disruption. SC/network understanding and situational
awareness provide an organisation with insights around critical SC or network partners,
which is essential for resolving the issue as per requirements of each phase.
Particularly, this study highlighted the role of coopetition, i.e., collaboration among
competitors, in building SC resilience. Though dairy companies compete to achieve a better
market position, in an industry-wide disruption collaboration among competitors allows
them to resolve the disruption holistically. The analysis showed that these collaborative
efforts during an industry-wide disruption (D1 & D2) among competitors allows them to
build synergies and relationships, which enable them to collaborate on company-specific
operational disruptions (D3 & D4). Predominantly, FO1’s SC from New Zealand showed a
high level of collaboration among the dairy competitors. The structure of the New Zealand
dairy industry could be one reason behind such collaboration among competitors; Fonterra
is a dominant player and any issue involving Fonterra could affect others (such as the
botulism scare, the DCD issue or the 1080 scare). Fonterra is also a co-operative, which

248
means one of its foundation values is collaboration. This could be another reason for the
company’s influence in the industry that tends it towards a collaborative approach.
Secondly, analysis showed that an industry consortium (DCANZ) plays an important role in
bringing all competitors on one platform to engage in collaborative activities. In the context
of FO1’s SC, FO1 was the hub-firm, making decisions and coordinating operations with its SC
partners. However, to resolve industry-wide issues (D1 and D2), the industry consortium
was established as a hub-entity, including participation from all dairy companies, to engage
in information sharing, decision making and other collaborative activities for the whole dairy
industry.
The literature on SC resilience stressed more focus on collaboration among SC partners
(such as buyers and suppliers) (Hohenstein et al., 2015; Pettit et al., 2010; Ponomarov &
Holcomb, 2009), whereas Scholten and Schilder (2015) and Borekci, Rofcanin, and Sahin
(2014) are among the few who categorically highlight collaboration among competitors as a
way to increase SC resilience. Though the findings suggest the presence of collaboration
among SC partners in dealing with the disruption, collaboration among competitors,
referred to as coopetition, was more prominent and enables organisations in a SC to better
prepare and respond to a disruption.
8.2.2. SC Resilience – The Disaster Management Framework
In this study, the disaster management framework has been adapted to understand how the
various SC resilience elements relate to the different phases of a disruption. The study by
Ponomarov and Holcomb (2009) first recognised SC resilience in the context of three
different disruption phases – event readiness, efficient response and recovery. A few
researchers (Chowdhury & Quaddus, 2016; Scholten et al., 2014) later adopted the disaster
management framework to understand SC resilience empirically. Most importantly, these
studies ignored an essential phase of a disruption, i.e., the learning and growth phase (as
highlighted by Hohenstein et al. (2015)). This study comprehensively explores SC resilience
in the context of the disaster management framework and highlights some important
findings. Using that framework, this study presents SC resilience as a cyclic process and
explains various elements distinct to each phase of a disruption.
249
First, this study identified a new phase called “prelude-to-disruption” in the disaster
management framework. This phase enables an organisation to design and monitor early
warning signals and execute an early response to avoid or reduce the impact of a potential
disruption. The analysis of all six SC disruptions showed the presence of this phase. This
phase allows organisations to engage in early response and mobilisation of critical resources
in anticipation of a potential, but the real threat, which allows them to quickly respond and
recover from a disruption. Notably, the analysis showed that lack of early response during
this phase could result in operational inefficiencies and erode a firm’s ability to deal
effectively with a disruption.
Previous studies highlighted the importance of monitoring early warning signals as part of
anticipation or visibility (Pettit et al., 2010). Sheffi (2015) proposed a timescale in terms of
detecting a disruption. This study argues that once indications of a potential disruption
become real, such as a flood warning or a potential labour strike, this takes an organisation
or SC from business-as-usual mode to the prelude-to-disruption stage, that somewhat
departs from the readiness phase as it shows relatively stable business environment or the
response phase as it characterises an actual disruption. Therefore, the analysis highlighted
that this phase demands distinct SC resilience elements to respond quickly to a potential
disruption such as monitoring early warning systems and early response planning and
execution. By introducing this new phase and highlighting the distinct SC resilience
elements, this study offers an important finding for researchers in both the SC resilience and
disaster management domains.
In the context of the readiness phase, this study highlights various elements that allow
organisations and SCs to better prepare for a disruption. Particularly, the participating
organisations in this study stressed risk management principles to mitigate and manage
both foreseeable and unforeseeable disruptions. As discussed in the literature review
(Chapter 2), early researchers in this domain had reservations about traditional risk
management approaches in effectively planning for an unforeseeable event (Christopher &
Holweg, 2011; Howard, 2006; Pettit, 2008; Pettit et al., 2010). For example, according to
some authors, the traditional risk management strategies are unable to foresee or plan for
threats that are highly unexpected or unpredictable and are unable to understand the
connectedness among various threats (Pettit, 2008; Starr et al., 2003). In contrast, some

250
scholars positively associate SC risk management practices in building a resilient SC (Jüttner
& Maklan, 2011). The findings from this study reveal that these risk management practices
are equally applicable to highly unforeseeable events, where pre-defined teams,
communication structure and contingency planning enable quick deployment of a crisis
management team. This enables an organisation to quickly understand the various
uncertainties and make quick decisions in response to a disruption. Any delays in such
responses could result in lower performance and erode a firm’s profitability. Therefore, this
study contributes to the literature by asserting that risk management is an important
element during the pre-disruption stage and it positively influences a quick response and
recovery.
The application of the disaster management framework showed two types of resilience
elements. The first set involves the SC resilience elements distinct to particular phases, e.g.,
a crisis management team for the response phase or operational/SC re-engineering for the
recovery phase. The second set includes elements essential to multiple phases of a
disruption that are referred to as the “resilience core elements”. This categorisation of SC
resilience elements into different phases of a disruption is another key finding and
contribution to the literature; this study is unusual in taking a comprehensive approach to
exploring SC resilience in the context of the disaster management framework.
Figure 8.1 shows the final output framework of this study, the “SC resilience cycle”.
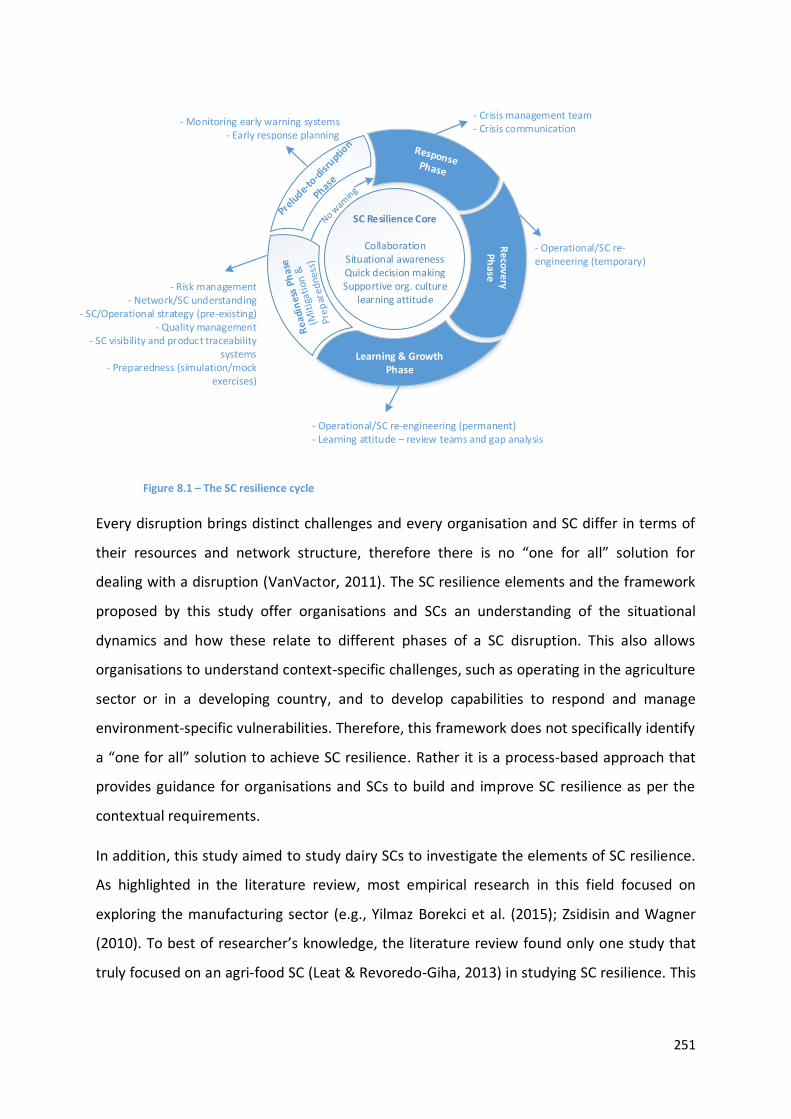
251
SC Resilience Core
CollaborationSituational awarenessQuick decision makingSupportive org. culture
learning attitude- Risk management
- Network/SC understanding- SC/Operational strategy (pre-existing)
- Quality management- SC visibility and product traceability
systems- Preparedness (simulation/mock
exercises)
- Monitoring early warning systems- Early response planning
- Crisis management team- Crisis communication
- Operational/SC re-engineering (temporary)
- Operational/SC re-engineering (permanent)- Learning attitude – review teams and gap analysis
Re
cov
ery
Ph
ase
Learning & Growth Phase
Figure 8.1 – The SC resilience cycle
Every disruption brings distinct challenges and every organisation and SC differ in terms of
their resources and network structure, therefore there is no “one for all” solution for
dealing with a disruption (VanVactor, 2011). The SC resilience elements and the framework
proposed by this study offer organisations and SCs an understanding of the situational
dynamics and how these relate to different phases of a SC disruption. This also allows
organisations to understand context-specific challenges, such as operating in the agriculture
sector or in a developing country, and to develop capabilities to respond and manage
environment-specific vulnerabilities. Therefore, this framework does not specifically identify
a “one for all” solution to achieve SC resilience. Rather it is a process-based approach that
provides guidance for organisations and SCs to build and improve SC resilience as per the
contextual requirements.
In addition, this study aimed to study dairy SCs to investigate the elements of SC resilience.
As highlighted in the literature review, most empirical research in this field focused on
exploring the manufacturing sector (e.g., Yilmaz Borekci et al. (2015); Zsidisin and Wagner
(2010). To best of researcher’s knowledge, the literature review found only one study that
truly focused on an agri-food SC (Leat & Revoredo-Giha, 2013) in studying SC resilience. This
252
study investigated two dairy SCs, which brought some key insights for organisations
operating in such industries. The next section highlights findings unique to a dairy SC.
8.2.3. SC Resilience of a Dairy SC
This study focused on exploring a dairy SC and presents several findings specific to the dairy
sector or likely to be applicable to food-related industries. For example, two of six SC
disruptions were related to a food safety issue, which arguably can be considered a major
vulnerability for organisations operating in such industries. The findings suggest that quality
management practices are critical to avoid and manage such food safety issues. Very few
previous studies suggest quality management practices to avoid and manage a SC
disruption. A study by Chowdhury and Quaddus (2015) is among the few that categorically
attributed quality control to mitigate vulnerabilities and improve SC resilience.
This study suggests that to deal with quality related disruptions, organisations need to
develop and promote quality management principles within the organisation as well as with
their SC partners. Particularly, the findings suggest that rigorous product testing, standard
procedures, understanding international requirements and specifications, employee training
and regular auditing are the key fundamentals. These practices need to be considered as a
core strategy for a dairy organisation. This finding can be explained by the fact that any
collapse of these quality management practices could result in dairy products with serious
food security concerns for the general public. Therefore, to avoid a food security disruption,
organisations operating in a dairy or a food-related industry need to integrate acceptable
quality management practices.
SC visibility is a well-known concept that enhances SC resilience (Carvalho et al., 2011; Pettit
et al., 2010; Scholten & Schilder, 2015). This study explains an important application of this
concept in the dairy sector. SC visibility is the ability to see through the whole SC
(Tukamuhabwa et al., 2015), which can be achieved through information sharing, integrated
IT systems and business intelligence (Pettit et al., 2010). The findings of this study reveal
that SC visibility also helps organisations to develop product traceability systems throughout
the SC, which is critical in dealing with a food safety-related disruption. A quick response,
during a food safety-related issue, directly depends on an organisation’s ability to track the
affected products throughout its SC.

253
In addition, crisis communication was noted as another key element in responding to a food
security issue. Poorly managed crisis communication can cost in the reputation loss to a
company (Coombs & Holladay, 2002; Koronis & Ponis, 2012), which was learnt in the DCD
issue (D1) and botulism scare (D2). Crisis communication that lacks critical details regarding
the issue can panic the key stakeholders. In such cases, the media can also raise serious
questions, which then intensifies the whole issue. In contrast, effective crisis communication
covers all the critical aspects of a food-safety issue and helps to avoid misrepresentation or
confusion among stakeholders. The findings suggest that a crisis management team,
collaboration among key stakeholders and the availability of critical information (e.g.,
product traceability) positively influence organisations to produce effective crisis
communication.
In the context of previous research, communication or information sharing is considered as
part of collaborative activities (Cao & Zhang, 2011; Scholten & Schilder, 2015). This study
considered crisis communication as a separate construct to SC collaboration. Particularly, for
a dairy organisation, it is critical to provide effective crisis communication to the key
stakeholders (such as media, regulatory authorities and customers) to effectively respond to
a disruption.
In conclusion, this study argues that, for a dairy SC, quality management practices, SC
visibility, product traceability systems and crisis communication are the critical elements to
enhance SC resilience. It is important to highlight that these elements may also be
applicable to organisations operating in other industries, such as manufacturing, however,
for a dairy SC, these elements are significantly more important to avoid or effectively
manage food-safety related disruptions.
8.2.4. Understanding SC Resilience from a sub-network Perspective
During the data collection, this study explored multiple SC players linked with the hub
organisation (FO1 and FO2). This departs from the usual approach of taking a single firm
perspective to investigate a SC concept. Many previous scholars focus their investigation on
a single firm or focal organisation to understand SC resilience (Golgeci & Ponomarov, 2013;
Jüttner & Maklan, 2011; Pettit et al., 2010; Ponomarov, 2012; Rice & Caniato, 2003), with
very few of studies exploring a dyadic relationship or SC level analysis (Blackhurst et al.,

254
2011; Scholten & Schilder, 2015; Yilmaz-Börekçi et al., 2014). To explore SC resilience,
studying multiple players in a SC is well demanded in the literature (Kim et al., 2015;
Mandal, 2014). Following these suggestions, this study investigated multiple SC player SC
during data collection, which is itself a contribution of this study that produced some
important findings.
The findings indicate that each phase of a disruption demands the involvement of different
stakeholders, which may include players beyond the usual SC network. For example, a
disruption may require a focal organisation, such as a dairy processing company, to
collaborate or coordinate with its competitors, NGOs, media players, regulatory authorities,
government authorities or even with law enforcement agencies. In reference to the
literature, many studies stress developing SC resilience mainly with SC partners, such as
establishing a relationship with suppliers/buyers. A widely adopted framework of SC
resilience by Christopher and Peck (2004) explains “SC Understanding” as an essential
prerequisite to building SC resiliency, where it is considered understanding ‘pinch points’ in
upstream or downstream SC partners is important. Though this is arguably a critical
element, the findings of this study highlight that it is more about understanding the broader
network beyond the usual SC network. Furthermore, network/SC understanding is not just
limited to exploring the ‘pinch points’, but it also enables an organisation to establish
collaborative activities with those broader network partners both pre- and post-disruption.
8.2.5. Achieving Resilience in a Developing Country
This study explored SC resilience in both a developed and developing country. Most
previous research in the field explored SC resilience in developed countries (Leat &
Revoredo-Giha, 2013; Park, 2011; Pettit et al., 2010; Scholten et al., 2014; Zsidisin &
Wagner, 2010), with a few exceptions that focused on developing countries (Benjamin et al.,
2017; Rwakira, 2015). By studying SC disruptions in both developed and developing
countries, this study brought out some new insights.
In FO2’s SC in Pakistan, the analysis highlighted that few players, such a focal organisation,
in a SC network play a critical role in developing, promoting and maintaining SC resilience
for the whole network, i.e., for farmers, distributors, retailers, and other suppliers. In this
study, the selected focal organisation (FO2) was involved in understanding the local
255
constraints and then was involved in developing and promoting SC resilience across its SC
network. However, in contrast, of FO1’s SC in New Zealand highlighted that individual
players, such as farmers, third-party logistics providers and other suppliers, in the SC
independently contribute to the network resilience and complement each other.
This finding can be explained by the fact that local constraints or contextual factors, such as
the economic, infrastructural and cultural aspects of developing countries, undermine the
ability of various SC players to cultivate resilience principles in their organisation, which also
compromises a dairy processing company’s resilience. For example, financial constraints and
a low literacy rate limit the farming community in a developing county, such as Pakistan, to
invest in risk management practices, which therefore undermine the ability to plan and
respond to a disruption. Therefore, the role of a focal or hub organisation (a dairy
processing company) is vital in building and promoting SC resilience to deal with a
disruption across its SC or network partners. This finding predominantly contributes to
managerial decision making in multinational companies operating in developing countries
such as Pakistan.
Though contextual factors drive how SCs works and influence various players in developing
and promoting SC resilience practices, the elements and capabilities to build SC resilience
remain largely similar. This can be explained by the fact that this study proposes an SC
resilience cycle that identifies a roadmap to develop resilience. The framework shows
companies must first understand the contextual dynamics of the different phases of a
disruption and local or industry-specific requirements. This enables them to develop SC
resilience capabilities as per the requirements.
8.2.6. SC Resilience in context of other SC Concepts
SC Management entails effective management of a network of relationships among SC
partners to facilitate the flow of material, information, services and money flow with the
aim to maximise profit and add value by maintaining efficiencies and achieving customer
satisfaction (Stock & Boyer, 2009). Over the years, the complexity and length of SCs have
increased significantly (Blackhurst et al., 2005), which requires companies to understand
vulnerabilities and develop capabilities to work in a chaotic environment. Particularly, SC
resilience entails identifying and proactively building strategies to reduce the impact of an
256
adverse event and allow SCs to respond and recover to their original or new stage after a
disruption (Jüttner & Maklan, 2011), which facilitate SCs in achieving the fundamental aims
of SC management. Therefore, SC resilience integrates the various concepts discussed in the
broader literature of SC management. This study highlights various SC management
concepts, such as SC collaboration, SC visibility, product traceability, SC re-engineering and
SC risk management, and offers a comprehensive framework to plan, respond and recover
effectively from an adversity. The study’s findings also relate to other SC management
concepts, such as SC vulnerability and SC integration that are briefly discussed in this
section.
SC vulnerability is an exposure/threat of a serious disturbance that could arise from
risks within the SC or risks external to the SC (Christopher & Peck, 2004). These
vulnerabilities then directly affect operations/performance (part or full disruption of
the flow of goods) of either a node in a SC or a part or full SC. SC resilience elements
help reduce vulnerabilities by planning, early detecting, preventing or reducing the
occurrence of SC disruptions (Craighead et al., 2007; Pettit et al., 2010). This study’s
findings directly relate to SC vulnerability literature by suggesting various strategies
to prevent, reduce or effectively manage SC vulnerabilities arising from SC
disruptions.
Similarly, the concept of SC resilience is related to SC integration. The basic goal of
SC integration is to achieve effective and efficient flows of products and services,
information, money and decisions, to provide maximum value to the customer at
low cost and high speed. This is achieved through strategic collaboration, which is an
ongoing partnership to achieve mutually beneficial strategic goals (Flynn, Huo, &
Zhao, 2010). This is similar to the concept of SC resilience, where these efficiencies
are achieved through collaboration with SC partners to successfully manage an SC
disruption.
In addition, the study’s findings can also be viewed in the context of established theories in
the literature. Broadly, this study opted for an empirical approach to explore SC resilience
elements and used the disaster management framework to understand the relationships of
these elements to the different phases of a disruption. Though beyond the disaster
257
management framework, this study did not use a specific theory, but the findings of this
study can be explained through the following theories:
Resource Based View (RBV) – RBV theory explains that a firm’s rationale to combine
resources, capabilities and strategic assets depends on its drive to achieve a
competitive advantage (Knudsen, 2003). RBV claims that through integration and
investment in relationships, partnering organisations build a sustainable advantage
over their competitors, as these relation-specific capabilities are hard to imitate
(Knudsen, 2003). Fundamentally, RBV provides theoretical reasoning to the SC
resilience concept, since many scholars debate that SC resilience enables
organisations to achieve sustainable competitive advantage (Blackhurst et al., 2011;
Leat & Revoredo-Giha, 2013; Ponomarov & Holcomb, 2009). Therefore, SC partners
build unique capabilities. This study defines these as the SC resilience elements and
companies engage in collaborative activities through knowledge exchange and
mutual decision making (SC collaboration) that enable them to effectively deal with a
disruption. RBV says that by integrating and developing these capabilities, firms can
achieve a market advantage and gain a sustainable completive advantage (Knudsen,
2003).
Resource Dependency Theory – This study’s findings can be explained in the context
of the resource dependency theory. One key argument of the resource dependency
theory that it centres solely on resources is that they must be attained from the
external environment to allow an organisation to survive or thrive (Barringer &
Harrison, 2000). This can be applied in SC network context, where SC partners
collaborate with each other to obtain critical resources, allowing them to increase
their relative power against other SCs (Cao & Zhang, 2012). This aligns with one of
the arguments of SC resilience of building capability to survive and thrive.
Particularly, SC partners engage in collaborative activities pre- and post-disruption to
develop and acquire vital resources that enable them to survive in an adverse event.
The Contributions of this Study
The findings of this study present implications for theory and practice that are highlighted in
this section.

258
8.3.1. Theoretical Implications
This study investigated six SC disruptions linked to two dairy SCs and identified various
elements that build a resilient SC. The findings divide these elements into two broad
categories: proactive and reactive SC resilience elements. Based on the comparative analysis
of the selected SC disruptions and the focal organisations, this study proposes various
research propositions (RP), which are:
RP1: Situational awareness, quick decision making and operational/SC re-engineering
are the key reactive elements that enable an organisation or SC to quickly respond to
and recover from a disruption, therefore enhancing SC resilience.
RP2: Collaboration, a supportive organisational culture and a learning attitude
positively influence both pre- and post-disruption phases, hence help in improving SC
resilience.
RP3: Proactive elements enable an organisation or SC to effectively and quickly
engage in response and recovery operations, hence enhancing SC resilience.
A major contribution of this study lies in identifying the various SC resilience elements that
help organisations build resilience across their SCs. Previous researchers in the field
discussed various elements and strategies to achieve resilience. For example, the studies by
Pettit et al. (2010) and Christopher and Peck (2004) highlight various elements that help
organisations to deal with uncertainties. In contrast, this research highlights a few distinct
SC resilience elements that are critical for organisations to avoid or deal effectively with
disruptions. As highlighted in Section 8.2.1, situational awareness and quick decision making
were found to be critical elements in responding to a disruption.
Further, this study suggests that for a dairy SC, food-safety issues are common. To deal with
this type of issue, organisations need to develop quality management practices. Rigorous
product testing, standard procedures, understanding international requirements and
specifications, employee training and regular auditing are key fundamentals to avoid quality
related disruptions and thus increase SC resilience. By highlighting these distinct SC
resilience elements, this study attempts to expand previous knowledge about this concept.
259
Another contribution lies in understanding SC resilience in relation to the disaster
management framework, which describes readiness, response, recovery, and learning and
growth phases of a disruption. A review of SC resilience definitions found most attribute the
concept to an ability to prepare, respond and recover from a disruption, while maintaining
the desired goal (such as service level) in the face of a disruption. Broadly, the definitions of
SC resilience correspond to different phases of a disruption. A systematic review of SC
resilience by Hohenstein et al. (2015) highlighted various phases of SC resilience and
encouraged researchers to focus on these four consecutive phases. Studies such as
Chowdhury and Quaddus (2016) and Scholten et al. (2014) are among the few that focus on
studying SC resilience in the context of the various phases of a disruption. However, that
ignores learning and growth as a separate phase. Secondly, a study by Scholten et al. (2014)
focused on SCs active in a disruption, which is different from a normal commercial SC.
Therefore, recognising these research gaps, this study contributes to the literature by
exploring the application of the SC resilience elements to different phases of a disruption.
Notably, this analysis classified SC resilience elements into the different phases of a
disruption. This study presented some interesting findings that are highlighted in the
following points.
This study proposes a new phase, called prelude-to-disruption, based on the
argument that this phase has distinct characteristics compared with other existing
phases. This phase enables an organisation to design and monitor early warning
signals and execute an early response to avoid or reduce the impact of a potential
disruption.
In the context of the disaster management framework, this study classified two
types of SC resilience elements. The first set includes the elements that were
essential for a particular phase and the second set were critical for more than one
phase (see Figure 8.1).
In addition, this study of the dairy sector highlighted some distinct findings. As this study is
among few to study SC resilience in this context, it makes a valuable contribution to the
literature. Notably, this study found that SC resilience elements such as quality management
practices, product traceability systems and SC visibility are critical to a SC disruption for an
organisation operating in the dairy sector.
260
Furthermore, most previous research on SC resilience talks about major SC disruptions. For
example, early advocates of SC resilience mainly focused on major disruptions with low
probability and high impact, such as the terrorist attack of September 11, 2001, in the US,
the UK fuel protest in September 2000 and the foot and mouth disease in February 2001
(Christopher & Peck, 2004; Christopher & Rutherford, 2004; Peck, 2005; Rice & Caniato,
2003; Sheffi, 2005a). This study covers both types of disruption, major SC disruptions as well
as operational/day-to-day disruptions, to understand the various similarities and differences
in responding to the disruptions. The findings suggest that three SC resilience elements,
situational awareness, quick decision making and operational/SC re-engineering, remain
equally critical in dealing with any disruption regardless of its nature.
Lastly, while comparing SC disruptions linked to FO1’s SC in New Zealand (a developed
country) and FO2’s SC in Pakistan (a developing country), this study found that an
organisation operating in a developing country encounters numerous vulnerabilities related
to the local context and environment. There a hub firm, such as a dairy processing company,
plays a fundamental role in developing and promoting resilience on behalf of its SC partners.
In contrast, in a developed country, organisations in a SC build resilience practices
individually and, overall, they complement each other. This is an important finding in SC
resilience and, to best of the researcher’s knowledge, this study is unusual in exploring the
context in both a developed and developing country.
8.3.2. Practical Implications
Apart from the theoretical contributions, this study presents some important insights for
managers that are discussed in the following sub-section.
8.3.2.1. Situational Awareness and Quick Decision Making
As highlighted in all six SC disruptions, understanding the dynamic situation and making
quick, relevant decisions are critical aspects of the successful execution of response and
recovery operations. Therefore, organisations need to train their employees so that they
can comprehend and understand stressful situations and make appropriate decisions under
uncertainty. This can be done by various team building or mock exercises. It is worth noting
that informed decision making based on full understanding of a situation leads an
organisation or SC towards a fast recovery trajectory.

261
8.3.2.2. Developing Quality Management Practices
This study highlighted that the most common vulnerability to organisations operating in the
dairy sector is a food safety issue. For example, D1 (DCD issue) and D2 (botulism scare) were
directly considered food safety issues, whereas disruptions like D5 (flood) and D6 (FMD)
could also result in food safety issues. These kinds of disruption can destroy an
organisation’s or industry’s goodwill and reputation. For countries like New Zealand, where
the primary industry significantly contributes to the country’s economy, these disruptions
could present a serious threat to the country’s exports.
For these reasons, organisations operating in food industries need to develop and promote
quality management principles to avoid or manage any food safety-related disruption.
Managers need to understand the risks related to product safety and need to integrate the
quality management practices within their organisation as well as with SC partners.
8.3.2.3. Competitors as Key Network Partners
Lastly, managers need to understand the role of competitors in dealing with a disruption.
Investigation of extended SC networks during this study highlighted how various players
(SC/network partners) contribute critically in dealing with a disruption. Managers need to
rethink their assumptions regarding competitors from treating them solely as competitors
to consider them as strategic partners, especially during an industry-wide disruption. A
disruption, such as a food safety issue, flood, earthquake or outbreak of a disease, could
hurt equally other players in the industry. The findings of this study highlight that
developing synergies with competitors during such events benefits all in the industry in
most cases.
8.3.2.4. Achieving SC Resilience is a Journey
As highlighted earlier, SC resilience is a cyclic process therefore managers should consider
developing resilience in their organisation or SC as a journey, rather than a one-off event.
The examples from this study show that every new disruption presents a focal organisation
or SC with an opportunity to learn, reflect and improve. Resilience against one event does
not guarantee resilience for all future events. However, SC resilience can be cultivated both
262
during a disruption and during normal business activities. This gives an ability to
organisations or SCs to combat uncertain events.
8.3.2.5. Challenges Dealing in a Developing Country
The study also presents various insights for multinational companies operating in
developing countries. Managers in such companies need to understand the local constraints
of their highly vulnerable SC partners and need to develop strategies to deal with those
constraints. The extended SC networks in this study show that a focal organisation, e.g. a
dairy processing company, sometimes needs to take multiple roles in a SC. For example, a
dairy processing company often needs to perform activities or provide facilities on behalf of
government authorities, especially during a catastrophic event. The presence of such
support from a focal organisation significantly lifts the whole SC’s ability to deal effectively
with a disruption.
8.3.2.6. Operational Versus Major SC Disruptions
Lastly, this study presents findings from both operational and major SC disruptions.
Managers should invest time and effort in building resilience in day-to-day or operational
disruptions since many of the fundamental elements to achieve resilience are replicated
during a major SC disruption. In most cases, operational issues occur more frequently than a
major disruption. This provides organisations practice in various capabilities, such as making
decisions under uncertainties, thus increasing the resilience capability to deal effectively
with major SC disruptions.
Research Limitations
The main limitation of this research lies in the depth and breadth of data collection. This
study followed a case study approach by selecting two SCs and six SC disruptions.
Predominantly, this study focused on the ego of the SC and analysed SC resilience in the
context of a hub firm and SC partners that played essential roles in dealing with the
disruptions. This study took Halinen and Törnroos (2005)’s rationale of limiting the
boundary of an extended SC network to conduct research on business networks. This
approach is different from taking a full network or SC perspective. Therefore, it is important
to acknowledge the various limitations of this approach.
263
This study focused on hub firms, called focal organisations, in the SC network.
Mainly, the dairy products and SC disruptions associated with these FOs were
considered. The discussion with selected SC partners mainly focused on the product
strategies, risk management practices and other operational strategies associated
with the FOs. Therefore, the case descriptions in Chapter 4 mainly focus on dairy
products linked to the ego of the SC. This study acknowledges that exploring and
discussing risk management and other operational strategies for each SC partner in
detail would have presented a detailed picture of the case. Secondly, it would have
enabled more detailed discussion on how SC resilience attributes differ at the
different levels of an SC, such as the upstream and downstream levels.
Further, the two FOs were exemplary in their respective countries. Particularly, in
the context of Pakistan because of its scale, FO2 is considered a prominent dairy
player in initiating and developing dairy practices. This resulted in a relatively
positive image of both focal organisations. It is important to acknowledge that
selecting more case SCs might have led to more discussion on the shortcomings and
factors that reduce SC resilience. Particularly in the case of Pakistan, a major part of
dairy product flows in traditional channels (from milkmen to consumer without milk
processing). Therefore, taking these traditional channels in the study would have led
to more contextual factors that limit SCs from building SC resilience.
Lastly, during the data collection, mainly top management and CEOs of the
respective organisations were selected for interview. Though this approach resulted
in strengthening the data collection since top management presents a more holistic
and full view of the organisation with more understanding of the relationships with
other organisations. However, it is important to acknowledge that the top
management mostly highlighted a positive image of the organisation. Though this is
a limitation, the study incorporated other avenues to strengthen the data, such as
interviewing multiple informants, especially from each FO, interviewing SC partners
and taking information from secondary sources (such as news article, media releases
and company documents).
The above choices present limitations of this study. However, many of these choices also
show the strength of the study. For example, this study took Halinen and Törnroos (2005)’s
264
rationale for limiting the boundary of the SC network. Though this study used a small unit
for analysis, it can be argued that the properties and characteristics of these small units (FOs
and SC partners associated with each disruption) apply to larger SC networks that make the
findings of this study representable to a larger SC. Secondly, the main strength of this study
lies in its in-depth approach to investigate SC disruptions deeply with the focal organisations
and SC partners that played a critical role in dealing with the disruption. Taking this
approach resulted in detailed information regarding each SC disruption, which led to in-
depth analysis and identification of SC resilience in each disruption. Through this process,
the study got full command of and high insight into each disruption. Taking an in-depth
approach on a few case studies can be criticised for its inability to produce research findings
applicable to a larger population. However, the rationale behind conducting such research
lies in embarking on theoretical generalisation rather than statistical generalisation.
The researcher acknowledges that the application of a theoretical lens would have further
strengthened the relationships among SC resilience elements and enhanced the
generalisability to different contexts. Particularly, the SC resilience concept can be explained
through the resource-based view and the resource dependency theory, which become
potential lenses with which future researchers can analyse SC resilience. The researcher also
acknowledges that the concept of SC resilience integrates various other concepts of SC,
especially SC vulnerability and SC integration, which provides other researchers with an
opportunity to explore the application and interdependencies of these concepts with SC
resilience.
Every disruption has its own dynamics and focusing only on dairy SCs could be a limitation.
For example, some of the selected SC disruptions might link only to the dairy industry, or
just to food-related industries. Nonetheless, this study provides various important findings
for the literature by conducting a study of the dairy sector. This study tried to distinguish
between findings that can apply only to a dairy SC compared with ones applicable to a
broader setting. However, there are limitations based on context-specific findings.
The researcher also believes that an organisation or SC goes through a dynamic process
during a disruption. However, this study takes a cross-sectional view that may be a
limitation. It may be argued that studying a disruption throughout its dynamic process in
265
real time would increase a researcher’s understanding of the issue. The time limitation
presented by a PhD study made a longitudinal study impractical.
Future Research Directions
The findings from this study provide various opportunities for further investigation. These
are highlighted in this section.
8.5.1. SC Resilience Elements – Situational Awareness and Quick Decision Making
This study highlights situational awareness and quick decision making as key aspects to
improve SC resilience. The discussion in Chapter 7 attributes these elements as central to
multiple phases of a disruption and suggests a strong relationship with other SC resilience
elements. Therefore, this study recommends that there is a strong need for future studies of
these aspects of SC resilience and their relationship with the other SC resilience elements.
8.5.2. Application of the Disaster Management Framework
One output of this study was the development of the framework called the SC resilience
cycle, by linking various SC resilience elements with each phase of a disruption. Mainly, this
study proposes a new phase in the disaster management framework called the prelude-to-
disruption. Therefore, this study encourages future researchers to apply empirically and
understand the applicability of the SC resilience cycle to other contexts, which later can be
used to develop a quantifiable scale to check the resiliency of each phase of an
organisation’s SC.
8.5.3. Longitudinal Study
As a SC disruption is a dynamic process, a longitudinal study would provide a higher level of
understanding on the vulnerabilities linked to each phase of a disruption and of the SC
resilience elements.
8.5.4. Extended SC Network Approach
As this study acknowledges the limitations of exploring small units considering a hub firm
(FO) and SC partners associated with the FO’s products and SC disruptions. There is an
opportunity for future researchers to explore extended SC networks as a fundamental

266
approach to understanding and analysing SC resilience and its related constructs.
Particularly, future researchers can explore how the SC resilience elements differ or relate
to the position in the SC network, such as upstream SC farmers and suppliers, and
downstream distributors and retailers. Exploring an extended SC network with a focus on
upstream and downstream SC partners may provide distinct findings on how a SC evolves
and behaves during a disruption.
8.5.5. Empirical Testing
Lastly, this study recommends various research propositions and a SC resilience model,
therefore there is an opportunity for future researchers to test these propositions and the
model in different research settings. This will increase the generalisability and applicability
of the findings found from this study.
Concluding Remarks
The purpose of this study was to explore the various elements of SC resilience and study the
relationship of these elements to the different phases of a disruption. This study is primarily
based on an inductive approach, specifically, a case study methodology was adopted to
explore the phenomenon grounded in rich contextual data. The aims were achieved by
studying six SC disruptions linked to two dairy SCs one from New Zealand and one from
Pakistan. This study produced three key findings.
First, this study identified a comprehensive list of elements that help an organisation/SC to
foster SC resilience. A comparison of SC disruptions and two SCs highlighted various findings
and provided different research propositions and a model describing two sets of SC
resilience elements, proactive and reactive.
Secondly, the application of the disaster management framework highlighted various SC
resilience elements critical to the different phases of a disruption. This study proposes a
new phase called prelude-to-disruption and provides a list of elements that are equally
important for the multiple phases of a disruption, referred to as the SC resilience core
elements. This new model, called the SC resilience cycle, reflects that SC resilience is a cyclic
process, where learning from past events feeds into readiness for future ones.
267
Lastly, this study was aimed at dairy SCs, which gave some critical insights for companies
operating in the dairy sector or food related industries This study’s results suggest that, for a
dairy SC, quality management practices, SC visibility, product traceability systems and crisis
communication are the critical elements to enhance SC resilience.
In conclusion, SC disruptions bring many challenges for organisations and it is often hard to
totally avoid disruptions. Organisations that learn from adversities and improve their
operations are the ones better prepared for future disruptions, since disruptive events are
inevitable in today’s world.

268
References Abe, M., & Ye, L. (2013). Building resilient supply chains against natural disasters: the cases of Japan
and Thailand. Global Business Review, 14(4), 567-586. Achrol, R. S., & Kotler, P. (1999). Marketing in the network economy. Journal of Marketing, 63, 146-
163. Adams, C. (2013). Swift backlash over dairy DCD. NZHerald. Retrieved from
http://www.nzherald.co.nz/business/news/article.cfm?c_id=3&objectid=10862219 ADB. (2013). Indus basin floods: mechanisms, impacts, and management. Pakistan: Asian
Development Bank. Retrieved from http://www.gwp.org/globalassets/global/toolbox/case-studies/asia-and-caucasus/Pakistan_Indus_Basin_Floods_Mechanisms_Impacts_and_Management_445.pdf.
Alexandersen, S., & Mowat, N. (2005). Foot-and-mouth disease: host range and pathogenesis. Current Topics in Microbiology and Immunology, 288, 9-42.
Alfalla-Luque, R., & Medina-Lopez, C. (2009). Supply chain management: unheard of in the 1970s, core to today's company. Business History, 51(2), 202-221.
Altay, N., & Green, W. G. (2006). OR/MS research in disaster operations management. European Journal of Operational Research, 175(1), 475-493.
Anderson, C. (2013). World asks: is NZ milk safe to drink? Stuff. Retrieved from http://www.stuff.co.nz/business/industries/8228299/World-asks-is-NZ-milk-safe-to-drink
Anderson, J. C., Håkansson, H., & Johanson, J. (1994). Dyadic business relationships within a business network context. The Journal of Marketing, 58(4), 1-15.
Angeles, P. A. (1981). Dictionary of philosophy. New York: Barnes & Noble Books. Anjum, R., Hussain, M., Zahoor, A., Irshad, H., & Farooq, U. (2004). Epidemiological analyses of foot
and mouth disease in Pakistan. Economic Survey, 8(5), 648-651. APHIS. (2013). Foot and mouth disease. USA Retrieved from
https://www.aphis.usda.gov/publications/animal_health/2013/fs_fmd_general.pdf. Badkar, M. (2012, 4-12-2012). Strikers have shut down two of the most important economic
gateways in the world - and it's costing the US billions. Business Insider Australia. Retrieved from https://www.businessinsider.com.au/economic-impact-of-la-and-long-beach-port-strikes-2012-12#z6hS2JMJqxip4EER.99
Bakshi, N., & Kleindorfer, P. (2009). Co-opetition and investment for supply-chain resilience. Production and Operations Management, 18(6), 583-603. doi:10.3401/poms.1080.01031
Balu, R. (2001). How to bounce back from setbacks. Fast Company, 45, 148-156. Barabasi, A.-L. (2002). Linked : the new science of networks. Cambridge: Perseus Pub. Barabasi, A.-L., & Albert, R. (1999). Emergence of scaling in random networks. Science, 286(5439),
509-512. Barney, J. (1991). Firm resources and sustained competitive advantage. Journal of Management,
17(1), 99-120. Barringer, B. R., & Harrison, J. S. (2000). Walking a tightrope: creating value through
interorganizational relationships. Journal of Management, 26(3), 367-403. doi:10.1016/S0149-2063(00)00046-5
BCI. (2014). Supply chain resilience 2014: an international survey to consider the origin, causes & consequences of supply chain disruption. Retrieved from http://knowledge.zurich.com/supply-chain/supply-chain-resilience-2014/
BCI. (2015). BCI supply chain resilience 2015. Retrieved from http://www.thebci.org/index.php/obtain-the-supply-chain-resilience-report
BCI. (2016). BCI supply chain resilience 2016. Retrieved from http://www.thebci.org/index.php/obtain-the-supply-chain-resilience-report
Bengtsson, M., & Kock, S. (2000). "Coopetition” in business networks - to cooperate and compete simultaneously. Industrial Marketing Management, 29(5), 411-426.

269
Benjamin, T., Mark, S., & Jerry, B. (2017). Supply chain resilience in a developing country context: a case study on the interconnectedness of threats, strategies and outcomes. Supply Chain Management: An International Journal, 22(6), 486-505. doi:doi:10.1108/SCM-02-2017-0059
Berg, B. L. (2007). Qualitative research methods for the social sciences (Vol. 6th). Boston: Pearson/Allyn & Bacon.
Bhamra, R., Dani, S., & Burnard, K. (2011). Resilience: the concept, a literature review and future directions. International Journal of Production Research, 49(18), 5375-5393. doi:10.1080/00207543.2011.563826
Bhaskar, R. (1989). Reclaiming reality: a critical introduction to contemporary philosophy. New York; London: Verso.
Birkie, S. E., Trucco, P., & Fernandez Campos, P. (2017). Effectiveness of resilience capabilities in mitigating disruptions: leveraging on supply chain structural complexity. Supply Chain Management: An International Journal, 22(6), 506-521.
Blackhurst, J., Craighead, C. W., Elkins, D., & Handfield, R. B. (2005). An empirically derived agenda of critical research issues for managing supply-chain disruptions. International Journal of Production Research, 43(19), 4067-4081.
Blackhurst, J., Dunn, K. S., & Craighead, C. W. (2011). An empirically derived framework of global supply resiliency. Journal of Business Logistics, 32(4), 374-391.
Bloomberg. (2013, 4 Aug 2013). China stops importing New Zeland milk powder, minister says. Bloomberg News. Retrieved from https://www.bloomberg.com/news/articles/2013-08-03/china-asks-importers-to-recall-contaminated-fonterra-products
Bode, C., Wagner, S. M., Petersen, K. J., & Ellram, L. M. (2011). Understanding responses to supply chain disruptions: insights from information processing and resource dependence perspectives. Academy of Management Journal, 54(4), 833-856.
Borekci, D., Rofcanin, Y., & Sahin, M. (2014). Effects of organizational culture and organizational resilience over subcontractor riskiness: a multi-method study in longitudinal time setting. European Business Review, 26(1), 2-22.
Bozarth, C. C., & Handfield, R. B. (2006). Introduction to operations and supply chain management: Prentice Hall.
Brandon‐Jones, E., Squire, B., Autry, C. W., & Petersen, K. J. (2014). A contingent resource‐based perspective of supply chain resilience and robustness. Journal of Supply Chain Management, 50(3), 55-73.
Burke, R. J., Martin, G., & Cooper, C. L. (2011). Corporate reputation: managing opportunities and threats. Farnham, England; Burlington, Vt: Gower.
Burnard, K., & Bhamra, R. (2011). Organisational resilience: development of a conceptual framework for organisational responses. International Journal of Production Research, 49(18), 5581-5599. doi:10.1080/00207543.2011.563827
Cabral, I., & Grilo, A. (2012). A decision-making model for lean, agile, resilient and green supply chain management. International Journal of Production Research, 50(17), 4830-4845. doi:10.1080/00207543.2012.657970
Canis, B. (2011). Motor vehicle supply chain: fffects of the Japanese earthquake and tsunami (1437987184). Retrieved from Washington D.C.: https://digital.library.unt.edu/ark:/67531/metadc40167/
Cao, M., Vonderembse, M. A., Zhang, Q., & Ragu-Nathan, T. (2010). Supply chain collaboration: conceptualisation and instrument development. International Journal of Production Research, 48(22), 6613-6635.
Cao, M., & Zhang, Q. (2011). Supply chain collaboration: impact on collaborative advantage and firm performance. Journal of Operations Management, 29(3), 163-180. doi:10.1016/j.jom.2010.12.008
Cao, M., & Zhang, Q. (2012). Supply chain collaboration: Roles of interorganizational systems, trust, and collaborative culture: Springer Science & Business Media.

270
Carla, R. P., Martin, C., & Andrea, L. D. S. (2014). Achieving supply chain resilience: the role of procurement. Supply Chain Management: An International Journal, 19(5/6), 626-642.
Carpenter, S., Walker, B., Anderies, J. M., & Abel, N. (2001). From metaphor to measurement: resilience of what to what? Ecosystems, 4(8), 765-781.
Carter, C. R., Rogers, D. S., & Choi, T. Y. (2015). Toward the theory of the supply chain. Journal of Supply Chain Management, 51(2), 89-97.
Carvalho, H., Azevedo, S. G., & Cruz-Machado, V. (2012). Agile and resilient approaches to supply chain management: influence on performance and competitiveness. Logistics Research, 4(1), 49-62. doi:10.1007/s12159-012-0064-2
Carvalho, H., Barroso, A. P., Machado, V. H., Azevedo, S., & Cruz-Machado, V. (2012). Supply chain redesign for resilience using simulation. Computers & Industrial Engineering, 62(1), 329-341.
Carvalho, H., Barroso, A. P., Machado, V. H., Azevedo, S. G., & Machado, V. C. (2011). Supply chain resilience: a simulation study. Paper presented at the Annals of DAAAM & Proceedings.
Cassell, C., & Symon, G. (2004). Essential guide to qualitative methods in organizational research. London: Sage.
CCNZ. (2012). Review of Fonterra’s 2012/13 milk price manual (ISBN: 978-1-869452-19-3). New Zealand Retrieved from http://www.comcom.govt.nz/regulated-industries/dairy-industry/review-of-fonterra-s-farm-gate-milk-price-and-manual/statutory-review-of-milk-price-manual/201213-season/.
Charmaz, K. (2008). Grounded theory as an emergent method. In S. N. Hesse-Biber & P. Leavy (Eds.), Handbook of Emergent Methods (pp. 155-170). New York, NY: Guilford Press.
Charmaz, K. (2014). Constructing grounded theory. London: Sage. ChinaPost. (2013a). Safety alert prompts checks of NZ baby formula. The China Post News. Retrieved
from http://www.chinapost.com.tw/taiwan/national/national-news/2013/01/27/368658/Safety-alert.htm
ChinaPost. (2013b). Taiwan wants NZ milk scare answers. The China Post News. Retrieved from http://www.chinapost.com.tw/taiwan/national/national-news/2013/01/26/368587/Taiwan-wants.htm
Choi, T. Y., Dooley, K. J., & Rungtusanatham, M. (2001). Supply networks and complex adaptive systems: control versus emergence. Journal of Operations Management, 19(3), 351-366.
Choi, T. Y., & Hong, Y. (2002). Unveiling the structure of supply networks: case studies in Honda, Acura, and DaimlerChrysler. Journal of Operations Management, 20(5), 469-493. doi:10.1016/s0272-6963(02)00025-6
Choi, T. Y., & Krause, D. R. (2006). The supply base and its complexity: Implications for transaction costs, risks, responsiveness, and innovation. Journal of Operations Management, 24(5), 637-652.
Chopra, S., & Sodhi, M. S. (2004). Managing risk to avoid supply-chain breakdown. MIT Sloan Management Review, 46(1), 53.
Chowdhury, M. M. H., & Quaddus, M. (2015). A multiple objective optimization based QFD approach for efficient resilient strategies to mitigate supply chain vulnerabilities: the case of garment industry of Bangladesh. Omega, 57, 5-21.
Chowdhury, M. M. H., & Quaddus, M. (2016). Supply chain readiness, response and recovery for resilience. Supply Chain Management: An International Journal, 21(6), 709-731. doi:10.1108/SCM-12-2015-0463
Christopher, M., & Holweg, M. (2011). “Supply Chain 2.0”: managing supply chains in the era of turbulence. International Journal of Physical Distribution & Logistics Management, 41(1), 63-82.
Christopher, M., & Peck, H. (2004). Building the resilient supply chain. The International Journal of Logistics Management, 15(2), 1-14. doi:10.1108/09574090410700275
Christopher, M., & Rutherford, C. (2004). Creating supply chain resilience through agile six sigma. Critical Eye, 7(1), 24-28.
271
Christopher, M., & Ryals, L. J. (2014). The supply chain becomes the demand chain. Journal of Business Logistics, 35(1), 29-35.
Clarinval, C., & Ahmad, A. (2015). Conceptualising phases of disasters: the drop loop model. Asian Bioethics Review, 7(1), 81-97.
Coffey, A., & Atkinson, P. (1996). Making sense of qualitative data: complementary research strategies. Thousand Oaks, CA: Sage.
Colicchia, C., Dallari, F., & Melacini, M. (2010). Increasing supply chain resilience in a global sourcing context. Production Planning and Control, 21(7), 680-694. doi:10.1080/09537280903551969
Collier, D. A., & Evans, J. R. (2017). OM 6: Cengage Learning. Coombs, W. T., & Holladay, S. J. (2002). Helping crisis managers protect reputational assets: initial
tests of the situational crisis communication theory. Management Communication Quarterly, 16(2), 165-186.
Coppola, D. P. (2006). Introduction to international disaster management. Burlington, MA: Elsevier. Cozzolino, A. (2012). Humanitarian logistics: cross-sector cooperation in disaster relief management.
Berlin, Heidelberg: Springer. Cozzolino, A., Rossi, S., & Conforti, A. (2012). Agile and lean principles in the humanitarian supply
chain: the case of the United Nations world food programme. Journal of Humanitarian Logistics and Supply Chain Management, 2(1), 16-33.
Craighead, C. W., Blackhurst, J., Rungtusanatham, M. J., & Handfield, R. B. (2007). The severity of supply chain disruptions: design characteristics and mitigation capabilities. Decision Sciences, 38(1), 131-156.
Craymer, L. (2013, 24/01/2013). Milk scare hits dairy power New Zealand. The Wall Street Journal Retrieved from http://www.wsj.com/articles/SB10001424127887323539804578261072093767746
Creswell, J. W. (2013). Research design: qualitative, quantitative, and mixed methods approaches. Los Angeles, CA: Sage.
Crotty, M. (1998). The foundations of social research: Meaning and perspective in the research process. London; Thousand Oaks, CA: Sage.
Dabhilkar, M., Birkie, S. E., & Kaulio, M. (2016). Supply-side resilience as practice bundles: a critical incident study. International Journal of Operations & Production Management, 36(8), 948-970.
DairyNZ. (2016a). About the NZ dairy industry. Retrieved from https://www.dcanz.com/about-the-nz-dairy-industry/
DairyNZ. (2016b). Milking technologies. Retrieved from https://www.dairynz.co.nz/milking/ DairyNZ. (2016c). New Zealand dairy statistics 2015-16. (DNZ30-005). New Zealand Retrieved from
https://www.dairynz.co.nz/media/5416078/nz-dairy-statistics-2015-16.pdf. DairyNZ. (2016d). Strategy for sustainable dairy farming. New Zealand Retrieved from
https://www.dairynz.co.nz/media/209786/strategy-for-sustainable-dairy-farming.pdf. Datta, P. (2017). Supply network resilience: a systematic literature review and future research. The
International Journal of Logistics Management, 28(4), 1387-1424. Daugherty, P. J., Richey, R. G., Roath, A. S., Min, S., Chen, H., Arndt, A. D., & Genchev, S. E. (2006). Is
collaboration paying off for firms? Business Horizons, 49(1), 61-70. doi:10.1016/j.bushor.2005.06.002
Davies, H., & Walters, M. (1998). Do all crises have to become disasters? Risk and risk mitigation. Property Management, 16(1), 5-9.
Denyer, D., & Tranfield, D. (2009). Producing a systematic review The Sage Handbook of Organizational Research Methods (pp. 671–689). London: Sage.
Denzin, N. K., & Lincoln, Y. S. (2011). The SAGE handbook of qualitative research. Thousand Oaks: Sage.

272
Di, H. J., & Cameron, K. C. (2007). Nitrate leaching losses and pasture yields as affected by different rates of animal urine nitrogen returns and application of a nitrification inhibitor—a lysimeter study. Nutrient Cycling in Agroecosystems, 79(3), 281-290. doi:10.1007/s10705-007-9115-5
DIA. (2014). The WPC80 incident: causes and responses - government inquiry into the whey protein concentrate contamination incident. (ISBN: 978-0-473-30935-0). Wellington, New Zealand Retrieved from https://www.dia.govt.nz/vwluResources/Government-Whey-Inquiry-Report-November-2014/$file/Government-Whey-Inquiry-Report-November-2014.PDF.
Dmitry, I., Boris, S., & Alexandre, D. (2014). The Ripple effect in supply chains: trade-off 'efficiency-flexibility-resilience' in disruption management. International Journal of Production Research, 52(7), 2154.
Dubois, A., & Gadde, L.-E. (2002). Systematic combining: an abductive approach to case research. Journal of Business Research, 55(7), 553-560.
Easton, G. (2002). Marketing: a critical realist approach. Journal of Business Research, 55(2), 103-109.
Edwards, F., Dixon, J., Friel, S., Hall, G., Larsen, K., Lockie, S., . . . Hogan, A. (2011). Climate change adaptation at the intersection of food and health. Asia Pacific Journal of Public Health, 23(2_suppl), 91S-104S.
Eisenhardt, K. M. (1989). Building theories from case study research. Academy of Management Review, 14(4), 532-550.
Eisenhardt, K. M., & Graebner, M. E. (2007). Theory building from cases: opportunities and challenges. Academy of Management Journal, 50(1), 25-32.
Endsley, M. R. (2012). Designing for situation awareness: an approach to user-centered design (2nd ed.). Boca Raton, FL: CRC Press.
Ergun, Ö., Heier Stamm, J. L., Keskinocak, P., & Swann, J. L. (2010). Waffle House restaurants hurricane response: a case study. International Journal of Production Economics, 126(1), 111-120. doi:10.1016/j.ijpe.2009.08.018
Falasca, M., Zobel, C. W., & Cook, D. (2008). A decision support framework to assess supply chain resilience. Paper presented at the Proceedings of the 5th International ISCRAM Conference.
FAO. (1998). The application of risk communication to food standards and safety matters. (92-5-104260-8). Rome: FAO & WHO Retrieved from http://www.fao.org/docrep/005/x1271e/X1271E00.htm#TOC.
FAO. (2013a). Pakistan FMD bulletin. Islamabad, Pakistan: FAO Retrieved from http://www.fao.org.pk/news/14/FMD/FMD_Bulletin.pdf.
FAO. (2013b). Pakistan FMD bulletin. Islamabad, Pakistan: FAO Retrieved from http://www.fao.org.pk/news/13/fmd/FMD_BULLETIN_JAN-MAR_2013.pdf.
FAO. (2014a). Mid-term evaluation of “development of a framework for the progressive control of foot-and-mouth disease in Pakistan. Rome, Italy: FAO Retrieved from http://www.fao.org/3/a-bd135e.pdf.
FAO. (2014b). Pakistan FMD bulletin. Islamabad, Pakistan: FAO Retrieved from http://www.fao.org/3/a-i4393e.pdf.
FAO. (2014c). Pakistan FMD bulletin. Islamabad, Pakistan: FAO Retrieved from http://www.fao.org.pk/news/14/FMD/FMD_Bulletin_Jan-March_2014.pdf.
FAO. (2015a). Pakistan FMD bulletin. Islamabad, Pakistan: FAO Retrieved from http://www.fao.org/3/a-az724e.pdf.
FAO. (2015b). Pakistan FMD bulletin. Islamabad, Pakistan: FAO Retrieved from http://www.fao.org/3/a-ax842e.pdf.
FAOSTAT. (2017). Food and agricultural data. Retrieved from http://www.fao.org/faostat/en/#home
FarmersWeekly. (2013a). DCD suspended over trade issues. Farmers Weekly. FarmersWeekly. (2013b). DCD worries ‘a trade issue’. Farmers Weekly.

273
Fiksel, J. (2003). Designing resilient, sustainable systems. Environmental Science & Technology, 37(23), 5330-5339. doi:10.1021/es0344819
Fiksel, J. (2006). Sustainability and resilience: toward a systems approach. Sustainability: Science, Practice, & Policy, 2(2), 14-21.
Fiksel, J., Polyviou, M., Croxton, K. L., & Pettit, T. J. (2015). From risk to resilience: learning to deal with disruption. MIT Sloan Management Review, 56(2), 79-86.
Fisher, M. L. (1997). What is the right supply chain for your product? Harvard Business Review, 75, 105-117.
Fletcher, D., & Sarkar, M. (2013). Psychological resilience: a review and critique of definitions, concepts, and theory. European Psychologist, 18(1), 12-23. doi:10.1027/1016-9040/a000124
Flynn, B. B., Huo, B., & Zhao, X. (2010). The impact of supply chain integration on performance: A contingency and configuration approach. Journal of Operations Management, 28(1), 58-71.
Flyvbjerg, B., & Budzier, A. (2011). Why your it project may be riskier than you think. Harvard Business Review, 89(11), 23-25. doi:10.2139/ssrn.2229735
Folke, C. (2006). Resilience: the emergence of a perspective for social–ecological systems analyses. Global Environmental Change, 16(3), 253-267.
Fonterra. (2013a). DCD suspension [Press release]. Retrieved from http://www.fonterra.com/wps/wcm/connect/Fonterra_NewZealand_en/Fonterra/Hub%20Sites/News%20and%20Media/Media%20Releases/DCD%20SUSPENSION/DCD%20SUSPENSION?pageID=Z6QReDe3ROAJO8CGHDCJM8CK9OCMMG6I1D0JM8CMHOEJM06JPD26OOCNPCAMG1743
Fonterra. (2013b). Fonterra advises of quality issue. Retrieved from http://www.fonterra.com/global/en/hub+sites/news+and+media/media+releases/nzx+statement+final/nzx+statement+final
Fonterra. (2013c). Fonterra reassures on food safety [Press release]. Retrieved from http://www.fonterra.com/wps/wcm/connect/Fonterra_NewZealand_en/Fonterra/Hub%20Sites/News%20and%20Media/Media%20Releases/FONTERRA%20REASSURES%20ON%20FOOD%20SAFETY/FONTERRA%20REASSURES%20ON%20FOOD%20SAFETY?pageID=Z6QReDeO9O46HH63RO6JMK623EAMMG623CIJM47JHPIJM8CJ9PA6J5CH9D8MRKCL1
Fonterra. (2013d). Media release - Fonterra advises of quality issue. Retrieved from https://www.fonterra.com/global/en/hub+sites/news+and+media/media+releases/media+release+-+fonterra+advises+of+quality+issue/media+release+-+fonterra+advises+of+quality+issue
Fonterra. (2013e). New Zealand dairy product safety - questions and answers. Retrieved from https://www.fonterra.com/wps/wcm/connect/8876433e-c769-4ac6-8bc6-f5ecf8d212de/New+Zealand+Dairy+Product+Safety+FAQs+FEB+2nd.pdf?MOD=AJPERES
Fox, A. (2013a). Dairy industry seeks answers over DCD scare. Stuff. Retrieved from http://www.stuff.co.nz/business/farming/dairy/8553644/Dairy-industry-seeks-answers-over-DCD-scare
Fox, A. (2013b, 05 Aug 2013). When Fonterra bruises, the country bleeds. Stuff. Retrieved from http://www.stuff.co.nz/waikato-times/business/9003279/When-Fonterra-bruises-the-country-bleeds
Gabler, C. B., Richey, R. G., & Stewart, G. T. (2017). Disaster resilience through public–private short‐term collaboration. Journal of Business Logistics, 38(2), 130-144. doi:10.1111/jbl.12152
Giannakis, M., & Croom, S. R. (2004). Toward the development of a supply chain management paradigm: a conceptual framework. Journal of Supply Chain Management, 40(1), 27-37.
Gibbert, M., Ruigrok, W., & Wicki, B. (2008). What passes as a rigorous case study? Strategic Management Journal, 29(13), 1465-1474.
Gibson, B. J., Mentzer, J. T., & Cook, R. L. (2005). Supply chain management: the pursuit of a consensus definition. Journal of Business Logistics, 26(2), 17-25.

274
Golgeci, I., & Ponomarov, S. (2013). Does firm innovativeness enable effective responses to supply chain disruptions? An empirical study. Supply Chain Management: An International Journal, 18(6), 604-617.
Grant, R. M. (1991). The resource-based theory of competitive advantage: implications for strategy formulation. California Management Review, 33(3), 114-135.
Green, D. P. (2010). Sustainable food supply chains. Journal of Aquatic Food Product Technology, 19(2), 55-56.
Guardian, T. (2013a, 05 Aug 2013). Fonterra admits baby formula milk contaminated with toxic bacteria. The Guardian. Retrieved from https://www.theguardian.com/world/2013/aug/05/fonterra-baby-formula-milk-bacteria
Guardian, T. (2013b, 08 Aug 2013). New Zealand government battles Fonterra milk crisis. The Guardian. Retrieved from https://www.theguardian.com/world/2013/aug/08/new-zealand-government-fonterra-crisis
Guba, E. G. (1990). The paradigm dialog. Newbury Park, CA: Sage. Guba, E. G., & Lincoln, Y. S. (1994). Competing paradigms in qualitative research. In N. K. Denzin & Y.
S. Lincoln (Eds.), Handbook of Qualitative Research (Vol. 2). Thousand Oaks, CA: Sage. Gulati, R. (1999). Network location and learning: The influence of network resources and firm
capabilities on alliance formation. Strategic Management Journal, 20(5), 397-420. Gunderson, L. H. (2000). Ecological resilience - in theory and application. Annual Review of Ecology
and Systematics, 31(1), 425-439. doi:10.1146/annurev.ecolsys.31.1.425 Haigh, R., & Amaratunga, D. (2010). An integrative review of the built environment discipline's role
in the development of society's resilience to disasters. International Journal of Disaster Resilience in the Built Environment, 1(1), 11-24. doi:doi:10.1108/17595901011026454
Hale, T., & Moberg, C. R. (2005). Improving supply chain disaster preparedness: a decision process for secure site location. International Journal of Physical Distribution & Logistics Management, 35(3), 195-207.
Halinen, A., & Törnroos, J.-Å. (2005). Using case methods in the study of contemporary business networks. Journal of Business Research, 58(9), 1285-1297.
Hall, P. V. (2004). “We’d have to sink the ships”: impact studies and the 2002 west coast port lockout. Economic Development Quarterly, 18(4), 354-367.
Hamel, G., & Välikangas, L. (2003). The quest for resilience. Harvard Business Review, 81, 52-52. Hearnshaw, E. J., & Wilson, M. M. (2013). A complex network approach to supply chain network
theory. International Journal of Operations & Production Management, 33(4), 442-469. Heather, B., & Rutherford, H. (2013). Botulism alert: Nutricia Karicare risk. Stuff. Retrieved from
http://www.stuff.co.nz/national/8999598/Botulism-alert-Nutricia-Karicare-risk Helferich, O. K., & Cook, R. L. (2002). Securing the supply chain: Council of logistics management. Hernantes, J., Labaka, L., Turoff, M., Hiltz, S. R., & Bañuls, V. A. (2017). Moving forward to disaster
resilience: Perspectives on increasing resilience for future disasters. Technological Forecasting & Social Change, 121, 1-6. doi:10.1016/j.techfore.2017.05.011
Ho, W., Zheng, T., Yildiz, H., & Talluri, S. (2015). Supply chain risk management: a literature review. International Journal of Production Research, 53(16), 5031-5069.
Hohenstein, N.-O., Feisel, E., Hartmann, E., & Giunipero, L. (2015). Research on the phenomenon of supply chain resilience: a systematic review and paths for further investigation. International Journal of Physical Distribution & Logistics Management, 45(1/2), 90-117.
Holbert, N. B., & Speece, M. W. (1993). Practical marketing research: an integrated global perspective. New York: Prentice-Hall International.
Holling, C. S. (1973). Resilience and stability of ecological systems. Annual Review of Ecology and Systematics, 4(1), 1-23.
Holstein, J. A., & Gubrium, J. F. (1995). The active interview (Vol. 37). Thousand Oaks, CA: Sage. Horne III, J. F. (1997). The coming age of organizational resilience. Paper presented at the Business
Forum.

275
Horne, J. F., III, & Orr, J. E. (1998). Assessing behaviors that create resilient organizations. Employment Relations Today, 24(4), 29.
Houlihan, J. B. (1988). International supply chains: a new approach. Management Decision, 26(3), 13-19.
Howard, K. (2006). Risk and reaction. Harvard International Review, 28(3), 38. Huan, S. H., Sheoran, S. K., & Wang, G. (2004). A review and analysis of supply chain operations
reference (SCOR) model. Supply Chain Management: An International Journal, 9(1), 23-29. Huang, S. H., Sheoran, S. K., & Keskar, H. (2005). Computer-assisted supply chain configuration based
on supply chain operations reference (SCOR) model. Computers & Industrial Engineering, 48(2), 377-394.
Ibrahim, M. S., Fakharu’l-razi, A., & Aini Mat, S. (2003). A review of disaster and crisis. Disaster Prevention and Management, 12(1), 24-32. doi:10.1108/09653560310463829
IFENG. (2013). 80% of Chinese imports of milk powder from New Zealand milk containing poison the country. ifeng.com. Retrieved from http://finance.ifeng.com/news/special/niunai/20130125/7605194.shtml
IFRC. (2011). World disasters report 2011 - focus on hunger and malnutrition. Retrieved from http://www.ifrc.org/en/publications-and-reports/world-disasters-report/wdr2011/
Ishfaq, R. (2012). Resilience through flexibility in transportation operations. International Journal of Logistics Research and Applications, 15(4), 215-229.
Jamal, S. M., Ahmed, S., Hussain, M., & Ali, Q. (2010). Status of foot-and-mouth disease in Pakistan. Archives of Virology, 155(9), 1487-1491.
Järvensivu, T., & Törnroos, J.-Å. (2010). Case study research with moderate constructionism: Conceptualization and practical illustration. Industrial Marketing Management, 39(1), 100-108.
Johnson, M. E. (2001). Learning from toys: lessons in managing supply chain risk from the toy industry. California Management Review, 43(3), 106-124.
Johnson, N., Elliott, D., & Drake, P. (2013). Exploring the role of social capital in facilitating supply chain resilience. Supply Chain Management: An International Journal, 18(3), 324-336.
Jüttner, U. (2005). Supply chain risk management: understanding the business requirements from a practitioner perspective. The International Journal of Logistics Management, 16(1), 120-141.
Jüttner, U., & Maklan, S. (2011). Supply chain resilience in the global financial crisis: an empirical study. Supply Chain Management: An International Journal, 16(4), 246-259.
Jüttner, U., Peck, H., & Christopher, M. (2003). Supply chain risk management: outlining an agenda for future research. International Journal of Logistics: Research and Applications, 6(4), 197-210.
Kamalahmadi, M., & Parast, M. M. (2016). A review of the literature on the principles of enterprise and supply chain resilience: major findings and directions for future research. International Journal of Production Economics, 171(1), 116-133.
Kim, Y., Chen, Y.-S., & Linderman, K. (2015). Supply network disruption and resilience: a network structural perspective. Journal of Operations Management, 33, 43-59.
Kleindorfer, P. R., & Saad, G. H. (2005). Managing disruption risks in supply chains. Production and Operations Management, 14(1), 53-68.
Klibi, W., Martel, A., & Guitouni, A. (2010). The design of robust value-creating supply chain networks: a critical review. European Journal of Operational Research, 203(2), 283-293.
Knemeyer, A. M., Zinn, W., & Eroglu, C. (2009). Proactive planning for catastrophic events in supply chains. Journal of Operations Management, 27(2), 141-153. doi:10.1016/j.jom.2008.06.002
Knudsen, D. (2003). Aligning corporate strategy, procurement strategy and e‐procurement tools. International Journal of Physical Distribution & Logistics Management, 33(8), 720-734. doi:doi:10.1108/09600030310502894
Koronis, E., & Ponis, S. T. (2012). Introducing corporate reputation continuity to support organizational resilience against crises. Journal of Applied Business Research, 28(2), 283-290.
276
Kovács, G., & Spens, K. M. (2007). Humanitarian logistics in disaster relief operations. International Journal of Physical Distribution & Logistics Management, 37(2), 99-114.
Kumar, S., Liu, J., & Scutella, J. (2015). The impact of supply chain disruptions on stockholder wealth in India. International Journal of Physical Distribution & Logistics Management, 45(9/10), 938-958. doi:10.1108/IJPDLM-09-2013-0247
Kumar, S., & Sosnoski, M. (2011). Decision framework for the analysis and selection of appropriate transfer pricing for a resilient global SME manufacturing operation–a business case. International Journal of Production Research, 49(18), 5431-5448.
Kwan, K. M., & Tsang, E. W. (2001). Realism and constructivism in strategy research: A critical realist response to Mir and Watson. Strategic Management Journal, 22(12), 1163-1168.
Leat, P., & Revoredo-Giha, C. (2013). Risk and resilience in agri‐food supply chains: the case of the ASDA PorkLink supply chain in Scotland. Supply Chain Management: An International Journal, 18(2), 219-231. doi:10.1108/13598541311318845
Lee, A. V., Vargo, J., & Seville, E. (2013). Developing a tool to measure and compare organizations’ resilience. Natural Hazards Review, 14(1), 29-41.
Lee, B., Collier, P. M., Cullen, J., & Gummesson, E. (2007). Case study research and network theory: birds of a feather. Qualitative Research in Organizations and Management: An International Journal, 2(3), 226-248.
Lee, H. L. (2004). The triple-A supply chain. Harvard Business Review, 82(10), 102-113. Lee, N., Saunders, J., & Gummesson, E. (2005). Qualitative research in marketing: road-map for a
wilderness of complexityand unpredictability. European Journal of Marketing, 39(3/4), 309-327.
Lengnick-Hall, C. A., Beck, T. E., & Lengnick-Hall, M. L. (2011). Developing a capacity for organizational resilience through strategic human resource management. Human Resource Management Review, 21(3), 243-255.
Leonard-Barton, D. (1990). A dual methodology for case studies: Synergistic use of a longitudinal single site with replicated multiple sites. Organization Science, 1(3), 248-266.
Liker, J. K., & Choi, T. Y. (2004). Building deep supplier relationships. Harvard Business Review, 82(12), 104-113.
Lincoln, Y. S., & Guba, E. G. (1985). Naturalistic inquiry (Vol. 75). Beverly Hills, CA: Sage. Lincoln, Y. S., Lynham, S. A., & Guba, E. G. (2011). Paradigmatic controversies, contradictions, and
emerging confluences. In N. K. Denzin & Y. S. Lincoln (Eds.), The Sage Handbook of Qualitative Research (Vol. 4, pp. 97-128). Thousand Oaks, CA: Sage.
Lindell, M. K., Prater, C., & Perry, R. W. (2006). Wiley pathways introduction to emergency management: John Wiley & Sons.
Lockamy III, A., & McCormack, K. (2004). Linking SCOR planning practices to supply chain performance: an exploratory study. International Journal of Operations & Production Management, 24(12), 1192-1218.
Locke, K. (2001). Grounded theory in management research. London; Thousand Oaks, CA: Sage. Locke, S. (2013). Fonterra dairy recall puts farmers into damage control. ABC Australia. Retrieved
from http://www.abc.net.au/news/2013-08-05/fonterra-recall-farmers-reax/4864810 Loh, H. S., & Van THAI, V. (2015). Cost consequences of a port-related supply chain disruption. The
Asian Journal of Shipping and Logistics, 31(3), 319-340. Luokkala, P., & Virrantaus, K. (2014). Developing information systems to support situational
awareness and interaction in time-pressuring crisis situations. Safety Science, 63, 191-203. doi:10.1016/j.ssci.2013.11.014
Malalgoda, C., Amaratunga, D., & Haigh, R. (2014). Challenges in creating a disaster resilient built environment. Procedia Economics and Finance, 18, 736-744.
Mandal, S. (2012). An empirical investigation into supply chain resilience. IUP Journal of Supply Chain Management, 9(4), 46.
277
Mandal, S. (2014). Supply chain resilience: a state-of-the-art review and research directions. International Journal of Disaster Resilience in the Built Environment, 5(4), 427-453.
Manuele, F. A. (2005). Risk assessment & hierarchies of control. Professional Safety, 50(5), 33. Manuj, I., & Mentzer, J. T. (2008). Global supply chain risk management strategies. International
Journal of Physical Distribution & Logistics Management, 38(3), 192-223. Martin, R., & Sunley, P. (2015). On the notion of regional economic resilience: conceptualization and
explanation. Journal of Economic Geography, 15(1), 1-42. doi:10.1093/jeg/lbu015 May, M. E. (2007). The elegant solution: Toyota's formula for mastering innovation. New York: Free
Press. Maykut, P. S., & Morehouse, R. E. (1994). Beginning qualitative research: a philosophic and practical
guide (Vol. 6). London; Washington, D.C: Falmer Press. MBIE. (2014). iFAB 2013 Dairy Review. Auckland, New Zealand Retrieved from
http://www.mbie.govt.nz/info-services/sectors-industries/food-beverage/documents-image-library/Dairy%20sector%20review%202013%20-PDF%201.8%20MB.pdf.
McNicholas, M. (2013). Chemical find in milk raises trade fears. Farmers Weekly. Melnyk, S. A., Closs, D. J., Griffis, S. E., Zobel, C. W., & Macdonald, J. R. (2014). Understanding supply
chain resilience. Supply Chain Management Review, 18(1), 34-41. Melnyk, S. A., Davis, E. W., Spekman, R. E., & Sandor, J. (2012). Outcome-driven supply chains. MIT
Sloan Management Review, 51(2), 33. Meshkati, N., & Khashe, Y. (2015). Operators' improvisation in complex technological systems:
successfully tackling ambiguity, enhancing resiliency and the last resort to averting disaster. Journal of Contingencies and Crisis Management, 23(2), 90-96.
Miles, M. B., Huberman, A. M., & Saldana, J. (2014). Qualitative data analysis: a methods sourcebook (Vol. 3rd). Thousand Oaks, CA: Sage.
Moazzam, M. (2015). Benchmarking agri-food supply chains: a case of Pakistan and New Zealand milk systems. (Doctor of Philosophy ), Massey University, Palmerston North, New Zealand. Retrieved from http://mro.massey.ac.nz/handle/10179/7906
MOF. (2016). Pakistan economic survey 2015-16. Islamabad, Pakistan Retrieved from http://www.finance.gov.pk/survey_1516.html.
MPI. (2013a). DCD suspension supported [Press release]. Retrieved from https://www.mpi.govt.nz/news-and-resources/media-releases/dcd-suspension-supported/
MPI. (2013b). DCD update: testing confirms expectations of dcd distribution in products [Press release]. Retrieved from https://www.mpi.govt.nz/news-and-resources/media-releases/dcd-update-testing-confirms-expectations-of-dcd-distribution-in-products/
MPI. (2013c). Ministry for Primary Industries releases WPC full diagnostic report [Press release]. Retrieved from https://www.mpi.govt.nz/news-and-resources/media-releases/ministry-for-primary-industries-releases-wpc-full-diagnostic-report/
MPI. (2013d). MPI exploring food safety issue advised by Fonterra Friday afternoon [Press release]. Retrieved from https://www.mpi.govt.nz/news-and-resources/media-releases/mpi-exploring-food-safety-issue-advised-by-fonterra-friday-afternoon/
MPI. (2013e). Negative WPC tests confirm no risk to public [Press release]. Retrieved from https://www.mpi.govt.nz/news-and-resources/media-releases/negative-wpc-tests-confirm-no-risk-to-public/
MPI. (2013f). New Zealand government assures safety of country's dairy products [Press release]. Retrieved from https://www.mpi.govt.nz/news-and-resources/media-releases/new-zealand-government-assures-safety-of-countrys-dairy-products/
MPI. (2013g). No food safety risk from Karicare products [Press release]. Retrieved from https://www.mpi.govt.nz/news-and-resources/media-releases/no-food-safety-risk-from-karicare-products-/
Munoz, A., & Dunbar, M. (2015). On the quantification of operational supply chain resilience. International Journal of Production Research, 53(22), 6736-6751.
278
Nawaz, Z., Arshad, M., & Iqbal, Z. (2014). Epidemiology of foot and mouth disease in buffaloes and cattle of Punjab using non structural proteins Elisa. Pakistan Journal of Agricultural Sciences, 51(2), 507-511.
NDMA. (2009). Disaster risk management. Islamabad, Pakistan: NDMA Retrieved from http://www.ndma.gov.pk/publications/DRM-2009.pdf.
NDMA. (2010a). Annual report. Islamabad, Pakistan: NDMA Retrieved from http://www.ndma.gov.pk/publications/AR2010.pdf.
NDMA. (2010b). Worst-ever catastrophe tests resilience of the Nation. Islamabad, Pakistan: NDMA Newsletter Retrieved from http://www.ndma.gov.pk/publications/NLMay-Dec2010.pdf.
NDMA. (2011). Pakistan floods 2010 - learning from experience. Islamabad, Pakistan: NDMA Retrieved from http://www.ndma.gov.pk/publications/SPakistanFloods-%20Flood%202010.pdf.
Newshub. (2013a). China issues Fonterra recall. Newshub. Retrieved from http://www.newshub.co.nz/business/china-issues-fonterra-recall-2013080408
Newshub. (2013b). Government downplays DCD risk. Newshub. Retrieved from http://www.newshub.co.nz/entertainment/government-downplays-dcd-risk-2013012708#axzz4DChnhBsq
Newshub. (2013c). Nutricia expands baby formula recall. Newshub. Retrieved from http://www.newshub.co.nz/nznews/nutricia-expands-baby-formula-recall-2013080606
Nilakant, V., Walker, B., Van Heugten, K., Baird, R., & De Vries, H. (2014). Research note: conceptualising adaptive resilience using grounded theory. New Zealand Journal of Employment Relations (Online), 39(1), 79.
Nishiguchi, T., & Beaudet, A. (1998). The Toyota group and the Aisin fire. MIT Sloan Management Review, 40(1), 49.
Norris, F. H., Stevens, S. P., Pfefferbaum, B., Wyche, K. F., & Pfefferbaum, R. L. (2008). Community resilience as a metaphor, theory, set of capacities, and strategy for disaster readiness. American Journal of Community Psychology, 41(1-2), 127-150.
NZHerald. (2013). Theo Spierings: testing for DCD. NZHerald. Retrieved from http://www.nzherald.co.nz/business/news/article.cfm?c_id=3&objectid=10862208
NZHerald. (2016). 1080 blackmailer Jeremy Kerr jailed for eight and a half years. NZ Herald. Retrieved from http://www.nzherald.co.nz/nz/news/article.cfm?c_id=1&objectid=11610428
OECD-FAO. (2015). OECD-FAO agricultural outlook 2015. OECD Publishing Retrieved from http://www.oecd-ilibrary.org/docserver/download/5115021e.pdf?expires=1484623733&id=id&accname=guest&checksum=F68C7E9D87DEEEA1B3BCB58A0F3E4A3A.
Oliver, R. K., & Webber, M. D. (1982). Supply-chain management: logistics catches up with strategy. Outlook, 5(1), 42-47.
Omer, H., & Alon, N. (1994). The continuity principle: a unified approach to disaster and trauma. American Journal of Community Psychology, 22(2), 273-287. doi:10.1007/BF02506866
Orchiston, C., Prayag, G., & Brown, C. (2016). Organizational resilience in the tourism sector. Annals of Tourism Research, 56, 145-148.
Osarenkhoe, A. (2010). A coopetition strategy–a study of inter-firm dynamics between competition and cooperation. Business Strategy Series, 11(6), 343-362.
Park, K. (2011). Flexible and redundant supply chain practices to build strategic supply chain resilience: contingent and resource-based perspectives. University of Toledo.
Parker, D. (1992). The mismanagement of hazards. In D. Parker & J. Handmer (Eds.), Hazard management and emergency planning: perspectives on Britain (Vol. 1). London.
Pathak, S. D., Day, J. M., Nair, A., Sawaya, W. J., & Kristal, M. M. (2007). Complexity and adaptivity in supply networks: Building supply network theory using a complex adaptive systems perspective. Decision Sciences, 38(4), 547-580.
279
Patton, M. Q. (2002). Qualitative research & evaluation methods (Vol. 3). Thousand Oaks, CA, US: Sage.
PDMA. (2010). Pakistan floods 2010 - preliminary damage and needs assessment (a joint report by ADB and WB). Islamabad, Pakistan: PDMA Retrieved from http://www.pdma.gov.pk/sites/default/files/DNA-Floods-2010.pdf.
Peck, H. (2005). Drivers of supply chain vulnerability: an integrated framework. International Journal of Physical Distribution & Logistics Management, 35(4), 210-232.
Peck, H. (2006). Reconciling supply chain vulnerability, risk and supply chain management. International Journal of Logistics: Research and Applications, 9(2), 127-142.
Pettit, S. J., & Beresford, A. K. (2005). Emergency relief logistics: an evaluation of military, non-military and composite response models. International Journal of Logistics: Research and Applications, 8(4), 313-331.
Pettit, T. J. (2008). Supply chain resilience: development of a conceptual framework, an assessment tool and an implementation process. (PhD), The Ohio State University. Retrieved from https://etd.ohiolink.edu/pg_10?0::NO:10:P10_ETD_SUBID:67527
Pettit, T. J., Croxton, K. L., & Fiksel, J. (2013). Ensuring supply chain resilience: development and implementation of an assessment tool. Journal of Business Logistics, 34(1), 46-76.
Pettit, T. J., Fiksel, J., & Croxton, K. L. (2010). Ensuring supply chain resilience: development of a conceptual framework. Journal of Business Logistics, 31(1), 1-21.
Pickett, C. B. (2003). Strategies for maximizing supply chain resilience: learning from the past to prepare for the future. Massachusetts Institute of Technology.
Pickett, S. T. A., McGrath, B., Cadenasso, M. L., & Felson, A. J. (2014). Ecological resilience and resilient cities. Building Research & Information, 42(2), 143-157. doi:10.1080/09613218.2014.850600
Ponis, S. T., & Koronis, E. (2012). Supply chain resilience: definition of concept and its formative elements. Journal of Applied Business Research, 28(5), 921-930.
Ponomarov, S. (2012). Antecedents and consequences of supply chain resilience: a dynamic capabilities perspective. University of Tennessee.
Ponomarov, S., & Holcomb, M. C. (2009). Understanding the concept of supply chain resilience. The International Journal of Logistics Management, 20(1), 124-143. doi:10.1108/09574090910954873
Priya Datta, P., Christopher, M., & Allen, P. (2007). Agent-based modelling of complex production/distribution systems to improve resilience. International Journal of Logistics Research and Applications, 10(3), 187-203.
Rabinovitch, S., & Hume, N. (2013). Fonterra dairy recall shakes China consumer confidence. Financial Times. Retrieved from https://www.ft.com/content/c6b1585e-fcef-11e2-955a-00144feabdc0
ResOrgs. (2018). What is Organisational Resilience. Retrieved from https://www.resorgs.org.nz/about-us/what-is-organisational-resilience/
Ribeiro, J. P., & Barbosa-Povoa, A. (2018). Supply chain resilience: definitions and quantitative modelling approaches – a literature review. Computers & Industrial Engineering, 115, 109-122.
Rice, J. B., & Caniato, F. (2003). Building a secure and resilient supply network. Supply Chain Management Review, 7(5), 22-30.
Richardson, L. (2008). A method of inquiry. Collecting and Interpreting Qualitative Materials, 3(4), 473.
Richey, R. G. (2009). The supply chain crisis and disaster pyramid: a theoretical framework for understanding preparedness and recovery. International Journal of Physical Distribution & Logistics Management, 39(7), 619-628. doi:doi:10.1108/09600030910996288
Ridder, H. G., Hoon, C., & McCandless Baluch, A. (2014). Entering a dialogue: positioning case study findings towards theory. British Journal of Management, 25(2), 373-387.

280
Ritter, T., Wilkinson, I. F., & Johnston, W. J. (2004). Managing in complex business networks. Industrial Marketing Management, 33(3), 175-183. doi:10.1016/j.indmarman.203.10.016
RNZ. (2013). NZ's dairy reputation under threat. RNZ. Retrieved from http://www.radionz.co.nz/news/dairy2013/216135/nz's-dairy-reputation-under-threat
Robson, C. (1993). Real world research: a resource for social scientists and practitioners-researchers. Cambridge, MA: Blackwell.
Russell, W., & Joanna, W. (2012). Nokia's supply chain management SAGE Business Cases. Rutherford, H. (2014). Fonterra fined $300k for botulism scare. Stuff. Retrieved from
http://www.stuff.co.nz/business/farming/dairy/9905709/Fonterra-fined-300k-for-botulism-scare
Rwakira, B. T. (2015). Supply chain resilience: a case study analysis of a supply network in a developing country context. (PhD), Lancaster University Management School. Retrieved from http://eprints.lancs.ac.uk/id/eprint/78228
Ryan, G. W., & Bernard, H. R. (2003). Techniques to identify themes. Field Methods, 15(1), 85-109. Saldaña, J. (2015). The coding manual for qualitative researchers. London; Thousand Oaks, CA: Sage. Salin, V. (1998). Information technology in agri-food supply chains. The International Food and
Agribusiness Management Review, 1(3), 329-334. Sarathy, R. (2006). Security and the global supply chain. Transportation Journal, 45(4), 28-51. Saunders, M., Lewis, P., & Thornhill, A. (2015). Research methods for business students (Vol.
Seventh). New York: Pearson Education. Sawik, T. (2013). Selection of resilient supply portfolio under disruption risks. Omega, 41(2), 259-269.
doi:10.1016/j.omega.2012.05.003 SCC. (2012, October 2012). Supply chain operational reference model - revision 11.0. Retrieved
from http://www.apics.org/apics-for-business/products-and-services/apics-scc-frameworks/scor
Schmitt, A. J., & Singh, M. (2012). A quantitative analysis of disruption risk in a multi-echelon supply chain. International Journal of Production Economics, 139(1), 22-32.
Scholten, K., & Schilder, S. (2015). The role of collaboration in supply chain resilience. Supply Chain Management: An International Journal, 20(4), 471-484. doi:10.1108/SCM-11-2014-0386
Scholten, K., Sharkey Scott, P., & Fynes, B. (2014). Mitigation processes–antecedents for building supply chain resilience. Supply Chain Management: An International Journal, 19(2), 211-228.
Schwandt, T. A. (2000). Three epistemological stances for qualitative inquiry: interpretitivism, hermeneutics and social constructivism. In N. K. Denzin & Y. S. Lincoln (Eds.), Handbook of Qualitative Research (pp. 189-214). Thousand Oaks, CA: Sage.
Seppänen, H., & Virrantaus, K. (2015). Shared situational awareness and information quality in disaster management. Safety Science, 77, 112-122.
Seville, E., Brunsdon, D., Dantas, A., Le Masurier, J., Wilkinson, S., & Vargo, J. (2008). Organisational resilience: researching the reality of New Zealand organisations. Journal of Business Continuity & Emergency Planning, 2(3), 258-266.
Seville, E., & Vargo, J. (2011). Crisis strategic planning for SMEs: finding the silver lining. International Journal of Production Research, 49(18), 5619-5635. doi:10.1080/00207543.2011.563902
Shashank, R., & Thomas, J. G. (2009). Supply chain risks: a review and typology. The International Journal of Logistics Management, 20(1), 97-123. doi:10.1108/09574090910954864
Sheffi, Y. (2001). Supply chain management under the threat of international terrorism. The International Journal of Logistics Management, 12(2), 1-11. doi:doi:10.1108/09574090110806262
Sheffi, Y. (2005a). Building a resilient supply chain. Harvard Business Review, 1(8), 1-4. Sheffi, Y. (2005b). Preparing for the big one. Manufacturing Engineer, 84(5), 12-15. Sheffi, Y. (2005c). The resilient enterprise: overcoming vulnerability for competitive advantage.
Cambridge, MA: MIT Press Books.

281
Sheffi, Y. (2015). The power of resilience: how the best companies manage the unexpected. Cambridge, MA: MIT Press Books.
Sheffi, Y., & Rice, J. B. (2005). A supply chain view of the resilient enterprise. MIT Sloan Management Review, 47(1), 41-48.
Shuai. (2013). New Zealand dairy products containing toxic substances Taiwan supermarkets emergency inventory. ifeng.com. Retrieved from http://finance.ifeng.com/special/niunai/20130125/7605854.shtml
Shukla, M., & Jharkharia, S. (2013). Agri-fresh produce supply chain management: a state-of-the-art literature review. International Journal of Operations & Production Management, 33(2), 114-158.
Slone, R. E., Mentzer, J. T., & Dittmann, J. P. (2007). Are you the weakest link in your company's supply chain? Harvard Business Review, 85(9), 116.
Smart, P., Bessant, J., & Gupta, A. (2007). Towards technological rules for designing innovation networks: a dynamic capabilities view. International Journal of Operations & Production Management, 27(10), 1069-1092.
Snowden, D. J., & Boone, M. E. (2007). A leader's framework for decision making. Harvard Business Review, 85(11), 68.
Soni, U., Jain, V., & Kumar, S. (2014). Measuring supply chain resilience using a deterministic modeling approach. Computers & Industrial Engineering, 74, 11-25.
Spar, D. L., & Burns, J. (2000). Hitting the wall: Nike and international labor practices. Harvard Business School.
Spiegler, V. L., Naim, M. M., & Wikner, J. (2012). A control engineering approach to the assessment of supply chain resilience. International Journal of Production Research, 50(21), 6162-6187.
Starr, R., Newfrock, J., & Delurey, M. (2003). Enterprise resilience: managing risk in the networked economy. Strategy and Business, 30, 70-79.
Statistics-NZ. (2015a). Gross domestic product (GDP) - key facts. New Zealand Retrieved from http://www.stats.govt.nz/browse_for_stats/economic_indicators/GDP/GrossDomesticProduct_HOTPDec16qtr.aspx.
Statistics-NZ. (2015b). New Zealand in profile 2015 - an overview of New Zealand's people, economy, and enviroment. New Zealand Retrieved from http://www.stats.govt.nz/browse_for_stats/snapshots-of-nz/nz-in-profile-2015.aspx.
Stephenson, A. V. (2010). Benchmarking the resilience of organisations. (PhD), University of Canterbury.
Stewart, D. M., & Grout, J. R. (2001). The human side of mistake‐proofing. Production and Operations Management, 10(4), 440-459. doi:10.1111/j.1937-5956.2001.tb00086.x
Stewart, G. (1997). Supply-chain operations reference model (SCOR): the first cross-industry framework for integrated supply-chain management. Logistics Information Management, 10(2), 62-67.
Stewart, G. T., Kolluru, R., & Smith, M. (2009). Leveraging public-private partnerships to improve community resilience in times of disaster. International Journal of Physical Distribution & Logistics Management, 39(5), 343-364.
Stewart, J., & O'Donnell, M. (2007). Implementing change in a public agency: leadership, learning and organisational resilience. International Journal of Public Sector Management, 20(3), 239-251.
Stock, J. R., & Boyer, S. L. (2009). Developing a consensus definition of supply chain management: a qualitative study. International Journal of Physical Distribution & Logistics Management, 39(8), 690-711.
Stuart, I., McCutcheon, D., Handfield, R., McLachlin, R., & Samson, D. (2002). Effective case research in operations management: a process perspective. Journal of Operations Management, 20(5), 419-433.

282
Suddaby, R. (2006). From the editors: what grounded theory is not. Academy of Management Journal, 49(4), 633-642.
Svensson, G. (2000). A conceptual framework for the analysis of vulnerability in supply chains. International Journal of Physical Distribution & Logistics Management, 30(9), 731-750.
Svensson, G. (2002). The theoretical foundation of supply chain management: a functionalist theory of marketing. International Journal of Physical Distribution & Logistics Management, 32(9), 734-754.
Talluri, S. S., Kull, T. J., Yildiz, H., & Yoon, J. (2013). Assessing the efficiency of risk mitigation strategies in supply chains. Journal of Business Logistics, 34(4), 253-269.
Tang, C. (2006a). Perspectives in supply chain risk management. International Journal of Production Economics, 103(2), 451-488. doi:10.1016/j.ijpe.2005.12.006
Tang, C. (2006b). Robust strategies for mitigating supply chain disruptions. International Journal of Logistics, 9(1), 33-45. doi:10.1080/13675560500405584
Tang, C., & Sodhi, M. S. (2012). Managing supply chain risk. Dordrecht: Springer. Teece, D. J., Pisano, G., & Shuen, A. (1997). Dynamic capabilities and strategic management.
Strategic Management Journal, 18(7), 509-533. Thompson, D., Muriel, P., Russell, D., Osborne, P., Bromley, A., Rowland, M., . . . Brown, C. (2002).
Economic costs of the foot and mouth disease outbreak in the United Kingdom in 2001. OIE Revue Scientifique et Technique, 21(3), 675-687.
Tomasini, R., & Van Wassenhove, L. (2009). Humanitarian logistics. UK: Palgrave Macmillan. Tomlin, B. (2006). On the value of mitigation and contingency strategies for managing supply chain
disruption risks. Management Science, 52(5), 639-657. doi:10.1287/mnsc.11060.0515 Torabi, S., Baghersad, M., & Mansouri, S. (2015). Resilient supplier selection and order allocation
under operational and disruption risks. Transportation Research Part E: Logistics and Transportation Review, 79, 22-48.
Tukamuhabwa, B. R., Stevenson, M., Busby, J., & Zorzini, M. (2015). Supply chain resilience: definition, review and theoretical foundations for further study. International Journal of Production Research, 53(18), 5592-5623.
Tummala, R., & Schoenherr, T. (2011). Assessing and managing risks using the supply chain risk management process (SCRMP). Supply Chain Management: An International Journal, 16(6), 474-483.
Urquhart, C. (2012). Grounded theory for qualitative research: a practical guide. London: Sage. USDA-FAS. (2016). Pakistan increases tariff on milk powder import. (PK1619). Islamabad, Pakistan
Retrieved from https://gain.fas.usda.gov/Recent%20GAIN%20Publications/Pakistan%20Increases%20Tariff%20on%20Milk%20Powder%20Import_Islamabad_Pakistan_9-2-2016.pdf.
Uta, J., & Stan, M. (2011). Supply chain resilience in the global financial crisis: an empirical study. Supply Chain Management: An International Journal, 16(4), 246-259. doi:10.1108/13598541111139062
Van der Vorst, J. G., & Beulens, A. J. (2002). Identifying sources of uncertainty to generate supply chain redesign strategies. International Journal of Physical Distribution & Logistics Management, 32(6), 409-430.
Van Wassenhove, L. N. (2006). Humanitarian aid logistics: supply chain management in high gear. Journal of the Operational Research Society, 57(5), 475-489.
VanVactor, J. D. (2011). Cognizant healthcare logistics management: ensuring resilience during crisis. International Journal of Disaster Resilience in the Built Environment, 2(3), 245-255. doi:doi:10.1108/17595901111167114
Vissak, T. (2010). Recommendations for using the case study method in international business research. The Qualitative Report, 15(2), 370-388.
283
Vogus, T. J., & Sutcliffe, K. M. (2007). Organizational resilience: towards a theory and research agenda. Paper presented at the 2007 IEEE International Conference on Systems, Man and Cybernetics, QC, Canada.
Voss, C., Tsikriktsis, N., & Frohlich, M. (2002). Case research in operations management. International Journal of Operations & Production Management, 22(2), 195-219. doi:10.1108/01443570210414329
Voss, M. D., Whipple, J. M., & Closs, D. J. (2009). The role of strategic security: internal and external security measures with security performance implications. Transportation Journal, 48(2), 5-23.
Wade, A. (2013). Worried parents take their babies to GPs. NZHerald. Retrieved from http://m.nzherald.co.nz/nz/news/article.cfm?c_id=1&objectid=10908655
Wahyuni, D. (2012). The research design maze: understanding paradigms, cases, methods and methodologies. Journal of Applied Management Accounting Research, 10(1), 69-80.
Wainwright, D. (1997). Can sociological research be qualitative, critical and valid? The Qualitative Report, 3(2), 1-17.
WEF. (2013). Building resilience in supply chains. Retrieved from http://www3.weforum.org/docs/WEF_RRN_MO_BuildingResilienceSupplyChains_Report_2013.pdf
WEF. (2018). The inclusive development index 2018 - summary and data highlights. Retrieved from Switzerland: http://www3.weforum.org/docs/WEF_Forum_IncGrwth_2018.pdf
Weick, K. E., Sutcliffe, K. M., & Obstfeld, D. (2008). Organizing for high reliability: processes of collective mindfulness. Crisis Management, 3(1), 81-123.
Whitman, Z. R., Kachali, H., Roger, D., Vargo, J., & Seville, E. (2013). Short-form version of the Benchmark Resilience Tool (BRT-53). Measuring Business Excellence, 17(3), 3-14.
Wiegmann, D. A., & Shappell, S. A. (2003). A human error approach to aviation accident analysis: the human factors analysis and classification system. Burlington, VT: Ashgate.
Wieland, A. (2013). Selecting the right supply chain based on risks. Journal of Manufacturing Technology Management, 24(5), 652-668.
Wieland, A., & Wallenburg, C. M. (2013). The influence of relational competencies on supply chain resilience: a relational view. International Journal of Physical Distribution & Logistics Management, 43(4), 300-320.
Williams, Z., Ponder, N., & Autry, C. W. (2009). Supply chain security culture: measure development and validation. The International Journal of Logistics Management, 20(2), 243-260.
Wilson, T. (2001). Supply chain debacle - Nike faces yearlong inventory problem after i2 implementation fails. InternetWeek(851).
Witmer, H., & Mellinger, M. S. (2016). Organizational resilience: nonprofit organizations’ response to change. Work, 54(2), 255-265.
Wu, T. F., Huang, S., Blackhurst, J., Zhang, X., & Wang, S. (2013). Supply chain risk management: an agent-based simulation to study the impact of retail stockouts. Engineering Management, IEEE Transactions on, 60(4), 676-686.
Xiao, R., Yu, T., & Gong, X. (2012). Modeling and simulation of ant colony's labor division with constraints for task allocation of resilient supply chains. International Journal on Artificial Intelligence Tools, 21(03), 1240014.
Xiaodong, W. (2013). Chemical residue in NZ milk raises concerns. China Daily Newzpaper. Retrieved from http://www.chinadaily.com.cn/cndy/2013-01/26/content_16176240.htm
Yanes-Estévez, V., Oreja-Rodríguez, J. R., & García-Pérez, A. M. (2010). Perceived environmental uncertainty in the agrifood supply chain. British Food Journal, 112(7), 688-709.
Yao, Y., & Meurier, B. (2012). Understanding the supply chain resilience: a Dynamic Capabilities approach.
284
Yi, C. Y., Ngai, E., & Moon, K. (2011). Supply chain flexibility in an uncertain environment: exploratory findings from five case studies. Supply Chain Management: An International Journal, 16(4), 271-283.
Yilmaz-Börekçi, D., Say, A. İ., & Rofcanin, Y. (2014). Measuring supplier resilience in supply networks. Journal of Change Management, 15(1), 1-19. doi:10.1080/14697017.2014.889737
Yilmaz Borekci, D., Rofcanin, Y., & Gürbüz, H. (2015). Organisational resilience and relational dynamics in triadic networks: a multiple case analysis. International Journal of Production Research, 53(22), 6839-6867.
Yin, R. K. (2014). Case study research: design and methods. Los Angeles: Sage. Zia, U. (2006). Analysis of milk marketing chain. Islamabad: Food and Agriculture Organization of the
United Nations (FAO). Zia, U. (2007). Analysis of milk marketing chain – Pakistan. Italian Journal of Animal Science, 6(2),
1384-1386. Zia, U., Mahmood, T., & Ali, M. R. (2011). Dairy development in Pakistan. Rome: FAO Retrieved from
http://www.fao.org/docrep/014/al750e/al750e00.pdf. Zsidisin, G. A., Panelli, A., & Upton, R. (2000). Purchasing organization involvement in risk
assessments, contingency plans, and risk management: an exploratory study. Supply Chain Management: An International Journal, 5(4), 187-198.
Zsidisin, G. A., & Wagner, S. M. (2010). Do perceptions become reality? The moderating role of supply chain resiliency on disruption occurrence. Journal of Business Logistics, 31(2), 1-20.

285
Appendix A. Research Protocol (English & Urdu Versions)
Semi-Structured Interview Guide – Focal Organisation
Company: Participant:
Department: Contact information:
SECTION 1 – Understanding the supply chain structure
Can you briefly describe your supply chain structure? Major buyers and suppliers? Major
players in the industry?
How does your organisation make sure that you and your supply chain members effectively
deal with small fluctuations in supply/demand? What about long-term or major changes?
How does your organisation foresee these changes?
How do you collaborate with your supply chain partners (supply management, supplier
development)? How does organisational structure (leadership, culture, communication
channel, and empowerment) support these activities?
How does your organisation make sure there is a continuous flow of information across your
supply chain?
SECTION 2 – Disruptive event and responding to the event
Can you please share some examples of major supply chain disruptions that your
organisation experienced during the last 5 years?
In your opinion, which of these disruptive events have high or low impact? And which of
these have been dealt with well? Which of these could have been dealt with better?
Responded (dealt) well Could have responded better
Overall high impact
Overall medium impact
Overall low impact
Can you provide more details of two of these events (one high impact/dealt well and one
high impact/not dealt well)? How did it happen?
286
What was the impact of the crisis to your company? To your buyers/end consumers? To
your suppliers? To your international buyers and suppliers?
How did you respond to the situation? What operational and strategic changes needed to
be made? Who were involved in responding to this situation? How did you deal with
affected suppliers and buyers? What about international suppliers and buyers?
In what ways did your organisational leadership, culture, and structure influence the
response to the event? What factors did facilitate or hinder the response? What about
dealing with international suppliers and buyers?
What did you learn from this crisis? Is there anything your company could have done
differently? How was learning from the crisis shared within the organisation and how was it
shared with your buyers and suppliers?
Is there any similarity in dealing with high scale crisis and low scale (operational) issues?
So far, we have discussed supply chain disruptions that impacted negatively to your
organisation. Can you think of any positive influence of these disruptions to your company
and supply chain?
What does a resilient supply chain mean to you? What are some traits of a resilient supply
chain?
287
Semi-Structured Interview Guide – Supply Chain Members
Company: Participant:
Department: Contact information:
SECTION 1 – Understanding the supply chain structure
Can you briefly describe your supply chain structure? Major buyers and suppliers? Major
players in the industry?
How does your organisation make sure that you and your supply chain members effectively
deal with small fluctuations in supply/demand? What about long-term or major changes?
How does your organisation foresee these changes?
How do you collaborate with your supply chain partners (supply management, supplier
development)? How does organisational structure (leadership, culture, communication
channel, and empowerment) support these activities?
How does your organisation make sure there is a continuous flow of information across your
supply chain?
SECTION 2 – Disruptive event and responding to the event
“We have recently approached [focal company] and the company has identified
[disruption(s)] as a major crisis to their supply chain in previous years. [Brief description
about the disruption(s)] Now, I would like to know your point of view about how the crisis
happened and how it impacted your organisation. So can you please describe:”
How did it happen?
What was the impact of the crisis to your company? To your buyers/end consumers other
than [focal organisation]? To your suppliers? To your international buyers and suppliers?
How did you respond to the situation? How did [focal organisation] involve you to resolve
this crisis? What operational and strategic changes needed to be made? Who was involved
in responding to this situation? How did you deal with affected suppliers and buyers? What
about international suppliers and buyers?
In what ways did your organisational leadership, culture, and structure influence the
response to the event? What factors did facilitate or hinder the response? What about
dealing with international suppliers and buyers?

288
What did you learn from this crisis? Is there anything your company could have done
differently? How was learning from the crisis shared within the organisation and how was it
shared with your buyers and suppliers?
Now, Can you please share some more examples of major supply chain disruptions that your
organisation experienced during the last 5 years, which involve competitors or players other
than the [focal organisation]?
In your opinion, which of these disruptive events have high or low impact? And which of
these have been dealt with well? Which of these could have been dealt with better?
Responded (dealt) well Could have responded better
Overall high impact
Overall medium impact
Overall low impact
Can you provide more details of [particular event(s)]? How did it happen? How did you and
your supply chain members respond to the event? How would you compare both events?
What were the distinguishing factors that make this event successful/unsuccessful
compared to the previous event? What was the learning from this event?
Is there any similarity in dealing with high scale crisis and low scale (operational) issues?
So far, we have discussed supply chain disruptions that impacted negatively to your
organisation. Can you think of any positive influence of these disruptions to your company
and supply chain?
What does a resilient supply chain mean to you? What are some traits of a resilient supply
chain?
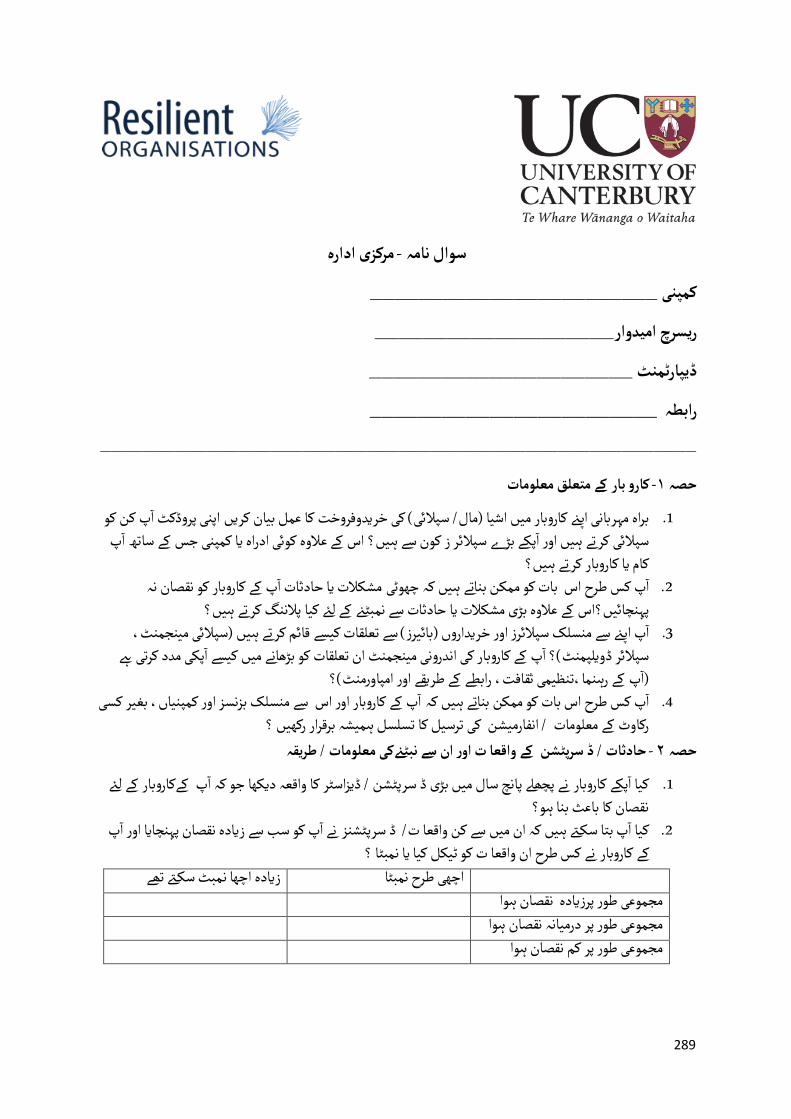
289
مرکزی ادارہ -سوال نامہ
________________________ یکمپن
____________________دواریام سرچ یر
______________________ پارٹمنٹیڈ
________________________ رابطہ
________________________________________________________
کارو بار کے متعلق معلومات -١حصہ
پ ک یاپن کا عمل بیان کریں دوفروختیخر ی( کیاشیا )مال/ سپلائ ںیبراہ مہربانی اپنے کاروبار م .1 ن کو پروڈکٹ ا
تے ہ یسپلائ پکے بڑے سپلائر ز کون سے ہ ںیکر کے علاوہ کوئ ں؟یاور ا پ یکمپن ایادراہ یاس
جس کے ساتھ ا
ں؟یکاروبار کرتے ہ ایکام پ کس .2
کے کاروبار کو نقصان نہ ایمشکلات ہیں کہ چھوٹیطرح اس بات کو ممکن بناتے ا پ
حادثات ا
تے ہ ایحادثات سے نمبٹنے کے لئے ک ای کے علاوہ بڑی مشکلات ں؟اسیپہنچائ ں؟یپلاننگ کرپ اپنے سے منسلک سپلائرز اور خر .3
)سپلائی مینجمنٹ، ںیقائم کرتے ہ سےی( سے تعلقات کرز ی)بائ داروںیا
کے کاروبار کی اندرون پ پکی مدد کرتی ہے ںیان تعلقات کو بڑھانے م نجمنٹیم یسپلائر ڈویلپمنٹ(؟ ا
کیسے ا
کے طریقے اور امپاورمنٹ(؟ کے رہنما،تنظیمی ثقافت، رابطے پ )ا
پ کس .4 کے کاروبار اور اس سے منسلک بزنسز اور کمپ طرح اس بات کو ممکن بناتے ہیں کہ ا پ
یکس ریبغ اں،ینا
؟ ںیبرقرار رکھ شہیکی ترسیل کا تسلسل ہم شنیانفارم / رکاوٹ کے معلومات قہیمعلومات / طر یحادثات / ڈ سرپٹشن کے واقعا ت اور ان سے نبٹنےک - ٢حصہ
نے پچھلے پانچ سال میں بڑ .1 پکے کاروبار کےکاروبار کھایکا واقعہ د زاسٹریڈ سرپٹشن / ڈ ی کیا ا پ
کے لئے جو کہ ا
نقصان کا باعث بنا ہو؟پ بتا سک تے ہ ایک .2
پ کو سب سے ز زسے کن واقعا ت/ ڈ سرپٹشن ںیکہ ان م ںیا
پ اینقصان پہنچا ادہینے ا
اور ا
نے کس طرح ان واقعا ت کو ٹ نمبٹا ؟ ای ایک کلیکے کاروبار زیادہ اچھا نمبٹ سک تے تھے اچھی طرح نمبٹا
مجموعی طور پرزیادہ نقصان ہوا مجموعی طور پر درمیانہ نقصان ہوا
مجموعی طور پر کم نقصان ہوا

290
پکے کاروبار براہ مہربانی کوئی سے دو واقعات کی تفصیل بتایں .ایک جس میں .3 ور ابزنس کا زیادہ نقصان ہوا /ا
کے خ پ اچھے طریقےسے نمبٹا جا سک تا تھا . ادہیز ںیم الیاس سے اچھے طریقے سے نمبٹا اور دوسرا جسکوا
پکے سپلائرز اور خر .4 پکے کاروبار پر کیا اثر ہوا ؟ا
پک (رز ی)بائ داروںیاس واقعہ کا ا
ے اگر کوئی پر کیا اثر ہوا ؟ا
؟ ان پر کیا اثر ہوا ؟ںیہ (رز ی)بائ داریملک سپلائرز اور خر بیرونینے اس واقعہ .5 پ
نے اس سے نمبٹنے ک ڈ سرپٹشن سے کیسے نمبٹا؟ /ا پ
اںیلیتبلد ایک ایک ںیاپنے کاروبار م لئےیا
نے متاثرہ سپلائرز اور خر ؟یک پ کے ساتھ (رز ی)بائ داروںیاور کون سے دوسرے بزنس پارٹنرز شامل ہوے؟ ا
نے بیرونی ملک سپلائرز اور خر کیسےتعاون کیا؟ پ ا؟کے ساتھ کیسے تعاون کی (رز ی)بائ داریاس کے علاوہ ا
پکے کاروبار .6 لئےینے اس واقعہ سے نمبٹنے ک نجمنٹیم ایکلچر ی ا
نے ا پکے ساتھ کیسے تعاون کیا؟ کونسے عوامل
کے بیرونی ملک سپلائرز اور خر کاروبار پکےکاروبار نے رز ی)بائ داریکو سہولت دی اور کونسے عوامل رکاوٹ بنے؟ا )
کے ساتھ کیسے تعاون کیا؟ پ ا
پ .7 پ سمجھتے ہ ایک ڈ سرپٹشن سے کیا سیکھا؟ /نے اس واقعہ ا
یاچھ ادہیک اس واقعہ/ ڈ سرپٹشن کوز ںیا
طرح نمبٹا جا سک تا تھا ؟اس سے حاصل کردہ سبق کو کیسے پورے کاروبار میں شامل کیا؟اور اس بحران سے ( کو سکھایا ؟رز ی)بائ داروںیسیکھے تریقے کیسے اپنے سے منسلک سپلائرز اور خر
کے خ .8 پ کے حادثات کو نمبٹنے ک ای زاسٹریبڑے ڈ ںیم الیا کون سے عوامل مشترک لئےیحادثات اور روز مرہ ں؟یہ
نےان واقعات .9 پ کے برے اثرات کو جانچا ابھی تک ہم ئدہ کو ان واقعات سے اپنے کاروبار میں کوئی فا ہے.کیا ا
بھی ملا ؟کے خ .10 پ
پ کے کارو بار م ںیوہ کون سے عوامل ہ ںیم الیا
بناتے ینیقیفروخت کے عمل کو دویخر ںیجو ا
پ کن عوامل کو بہت اہم ںی. ان مریرکاوٹ کے بغ یبھ یں؟کسیہ ں؟یہ تےید تیسے ا

291
نیاراک کے کے سپلائی چین مرکزی ادارہ -سوال نامہ
________________________ یکمپن
____________________دواریام سرچ یر
______________________ پارٹمنٹیڈ
________________________ رابطہ
________________________________________________________
کارو بار کے متعلق معلومات -١حصہ
پ یاپن.کا عمل بیان کریں دوفروختیخر ی( کیاشیا )مال/ سپلائ ںیم یکمپن یبراہ مہربانی اپن .1 پروڈکٹ ا
تے ہ یکن کو سپلائ پکے بڑے سپلائر ز کون سے ہ ںیکر جس کے یکمپن ایادراہ یاس کے علاوہ کوئ ں؟یاور ا
پ کام ں؟یکاروبار کرتے ہ ایساتھ ا
پ کس .2 پک ایطرح اس بات کو ممکن بناتے ہیں کہ چھوٹی مشکلات ا
کو نقصان نہ یکمپن یحادثات ا
تے ہ ایحادثات سے نمبٹنے کے لئے ک ای کے علاوہ بڑی مشکلات ں؟اسیپہنچائ ں؟یپلاننگ کرپ اپن .3
)سپلائی ںیقائم کرتے ہ سےی( سے تعلقات کرز ی)بائ داروںیسے منسلک سپلائرز اور خر یکمپن یا
پک پکی ںیان تعلقات کو بڑھانے م نجمنٹیم یکی اندرون یکمپن یمینجمنٹ، سپلائر ڈویلپمنٹ(؟ ا
کیسے ا
پ کے رہنما،تن ظیمی ثقافت، رابطے کے طریقے اور امپاورمنٹ(؟ مدد کرتی ہے )ا
پ کس .4 پک ا
یکس ریبغ اں،یاور اس سے منسلک بزنسز اور کمپن یکمپن یطرح اس بات کو ممکن بناتے ہیں ا
؟ ںیبرقرار رکھ شہیکی ترسیل کا تسلسل ہم شنیانفارم / رکاوٹ کے معلومات قہیمعلومات / طر ینبٹنےکحادثات / ڈ سرپٹشن کے واقعا ت اور ان سے - ٢حصہ
پک .1 پک کھایکا واقعہ د زاسٹریڈ سرپٹشن / ڈ ی نے پچھلے پانچ سال میں بڑ یکمپن یکیا ا
ے لئے ک یکمپن یجو کہ ا
نقصان کا باعث بنا ہو؟پ بتا سک تے ہ ایک .2
پک زسے کن واقعا ت/ ڈ سرپٹشن ںیکہ ان م ںیا
ا نقصان ادہیکو سب سے ز یکمپن ینے ا
پک ایپہنچا نمبٹا ؟ ای ایک کلینے کس طرح ان واقعا ت کو ٹ یکمپن یاور ا
زیادہ اچھا نمبٹ سک تے تھے اچھی طرح نمبٹا مجموعی طور پرزیادہ نقصان ہوا
مجموعی طور پر درمیانہ نقصان ہوا مجموعی طور پر کم نقصان ہوا

292
ے کا زیادہ نقصان ہوا اور اس س یکمپن براہ مہربانی کوئی سے دو واقعات کی تفصیل بتایں .ایک جس میں .3کے خ پ
اچھے طریقےسے نمبٹا جا سک تا تھا . ادہیز ںیم الیاچھے طریقے سے نمبٹا اور دوسرا جسکوا
پک یاس واقعہ کا کمپن .4 پکے اگر پر کیا اثر ہ (رز ی)بائ داروںیکے سپلائرز اور خر یکمپن یپر کیا اثر ہوا ؟ ا
وا ؟ا
؟ ان پر کیا اثر ہوا ؟ںیہ (رز ی)بائ داریور خرملک سپلائرز ا کوئی بیرونینے اس واقعہ .5 پ
نے اس سے نمبٹنے ک ڈ سرپٹشن سے کیسے نمبٹا؟ /ا پ
اںیلیدتبل ایک ایک ںیاپنے کاروبار م لئےیا
پک ؟یک (رز ی)بائ داروںینے متاثرہ سپلائرز اور خر یکمپن یاور کون سے دوسرے بزنس پارٹنرز شامل ہوے؟ ا
نے بیرونی ملک سپلائرز اور خر کے ساتھ کیسےتعاون کیا؟ پ سے کے ساتھ کی (رز ی)بائ داریاس کے علاوہ ا
تعاون کیا؟پک .6
سے ساتھ کیسے تعاون کیا؟ کون لئےینے اس واقعہ سے نمبٹنے ک نجمنٹیم ایکلچر ی کے کاروبار یکمپن یا
پکے کاروبار نے ا پککو سہولت دی اور کونسے عوامل عوامل
رز کے بیرونی ملک سپلائ یکمپن یرکاوٹ بنے؟ ا
کے ساتھ کیسے تعاون کیا؟رز ی)بائ داریاور خر پ نے ا )
پک .7 پ سمجھتے ہ ایک ڈ سرپٹشن سے کیا سیکھا؟ /نے اس واقعہ یکمپن یا
ک اس واقعہ/ ڈ سرپٹشن ںیا
طرح نمبٹا جا سک تا تھا ؟اس سے حاصل کردہ سبق کو کیسے پورے کاروبار میں شامل یاچھ ادہیکوز ( کو سکھایا ؟رز ی)بائ داروںیکیا؟اور اس بحران سے سیکھے تریقے کیسے اپنے سے منسلک سپلائرز اور خر
کے خ .8 پ کے حادثات کو نمبٹنے ک ای زاسٹریبڑے ڈ ںیم الیا ک مشتر کون سے عوامل لئےیحادثات اور روز مرہ ں؟یہ
نےان واقعات .9 پ کے برے اثرات کو جانچا ابھی تک ہم میں کوئی فائدہ یکو ان واقعات سے کمپن ہے.کیا ا
بھی ملا؟کے خ .10 پ
پک ںیوہ کون سے عوامل ہ ںیم الیا
کے عمل کو دویخر ںیم یکمپن یجو ا بناتے ینیقیفروخت
پ کن عوامل کو بہت اہم ںی. ان مریرکاوٹ کے بغ یبھ یں؟کسیہ ں؟یہ تےید تیسے ا
293
Appendix B. Ethics Approval Letter, Information Sheet,
Participant Consent Form (English & Urdu Versions)
294
Department of Management, Marketing and Entrepreneurship
University of Canterbury
Telephone: +64 21 085 99369
Email: [email protected]
26 May 2015
Supply Chain Resilience: A Network Perspective of Agriculture Supply Chain
Information Sheet for participants
I am a doctoral student in the Department of Management, Marketing and Entrepreneurship and
associated with the Resilient Organisations research group. Resilient Organisations (ResOrgs) is a
public-good research programme based in New Zealand. The group has been researching what
makes organisations resilient to crises since 2004. Further information about the group can be found
at www.resorgs.org.nz.
This research project seeks to understand the factors that enable organisations to become resilient,
sustained and thriving, in a disruptive event or during day-to-day operational issues. Particularly, this
research attempts to understand;
What are the sources of supply chain disruptions?
What are their impacts?
How do organisations in a supply chain prepare for and prevent disruptions?
How do they recover in the event of disruptions?
What are the building blocks of supply chain resilience?
From a practical perspective, the outcomes of this research will provide assistance to managers to
access and improve their processes (both technical and non-technical) to sustain and thrive in
uncertain environments.
Your involvement in this project entails participation in a semi-structured interview to be arranged
at a time of your convenience. The interview questions are related to recent supply chain disruptions
faced by your organisation and, particularly, how your organisation and your supply chain members
dealt with these issues. Based on your experience, my research will try to understand the factors
that worked or did not work in these situations. The expected duration of interview will be about 60
minutes.
The interview will be recorded using an audio recording device. An interview transcript will be
provided to you before the information is used. You will have the opportunity to make any changes

295
to the interview data at that time. In case of no reply, original transcripts will be used for further
analysis.
There are no known risks involved in participating in this study.
You may receive a copy of the project results by contacting the researcher at the conclusion of the
project.
Participation in this study is voluntary and you have the right to withdraw at any stage without
penalty. If you withdraw, I will remove information provided by you provided this request is made
prior to compilation of the project output.
The results of the project will be published, but you may be assured of the complete confidentiality
of data gathered in this investigation: your identity will not be made public without your prior
consent. To ensure anonymity and confidentiality, data will be placed in secure facilities and/or in
encrypted electronic form. The data will be accessible only by the research team listed in the
consent form. Raw data (such as consent forms, audio recording and transcripts) will be destroyed
after 10 years. In addition to PhD thesis, the output of this project may also include conference
papers and journal articles. A PhD thesis is a public document and will be available through the
University of Canterbury Library.
The project is being carried out as a requirement of Doctor of Philosophy (PhD) by Rizwan Ahmad
under the supervision of Dr. John Vargo, Dr. Venkateswarlu Pulakanam and Dr. Mesbahuddin
Chowdhury, who can be contacted at [email protected],
[email protected] and [email protected]. They will be
pleased to discuss any concerns you may have about participation in the project.
This project has been reviewed and approved by the University of Canterbury Human Ethics
Committee, and participants should address any complaints to The Chair, Human Ethics Committee,
University of Canterbury, Private Bag 4800, Christchurch ([email protected]).
If you agree to participate in the study, please complete the consent form and return by email to
Yours sincerely
Rizwan Ahmad

296
Department of Management, Marketing and Entrepreneurship
University of Canterbury
Telephone: +64 21 085 99369
Email: [email protected]
26 May 2015
Supply Chain Resilience: A Network Perspective of Agriculture Supply Chain
Consent Form
I have been given a full explanation of this project and have had the opportunity to ask questions.
I understand what is required of me if I agree to take part in the research.
I understand that participation is voluntary and I may withdraw at any time without penalty.
Withdrawal of participation will also include the withdrawal of any information I have provided
should this remain practically achievable.
I understand that any information or opinions I provide will be kept confidential to the research
team (listed below) and that any published or reported results will not identify the participants or
the organisations they represent, without prior consent. I understand that the output of this
research project is a public document and will be available through the UC Library.
I understand that all data collected for the study will be kept in locked and secure facilities and/or in
password protected electronic form and will be destroyed after ten years.
I understand the risks associated with taking part and how they will be managed.
I understand that I am able to receive a report on the findings of the study by contacting the
researcher at the conclusion of the project.
I understand that I can contact the researcher or the supervisory team (contact details given below)
for further information.
Research Team
Name Position Email Phone
Rizwan Ahmad PhD student [email protected] +64 21 085 99369
Dr. Venkateswarlu Pulakanam
Senior Supervisor [email protected] +64 3 364 2638 Ext. 6638
Dr. John Vargo Co-supervisor [email protected] +64 3 364 2987 Ext. 6627
Dr. Mesbahuddin Chowdhury
Associate Supervisor
[email protected] +64 3 364 2674 Ext. 6674

297
If I have any complaints, I can contact the Chair of the University of Canterbury Human Ethics
Committee, Private Bag 4800, Christchurch (human- [email protected]).
By signing below, I agree to participate in this research project.
Name (Participant): .............................................................. Signature (Participant): ......................................................... Date .................................
Please return this completed consent form by email to [email protected] or in
printed form at the time of interview.
Regards
Rizwan Ahmad
298
ف مینجمنٹ، مارکیٹنگ اینڈ انٹر پرینور شپ ڈیپارٹمنٹ ا
ف کینٹربر ی یونیورسٹی ا
/ 642108599369+ ٦٤٢١٠٨٥٩٩٣٦٩ٹیلی فون نمبر : +
[email protected]ای میل:
/ April 2015 30 ٢٠١٥ اپریل ٣٠
ف ایگریکلچر سپلائی چینسپلائی چین ریسیلینس : نیٹ ورک پرسپک ٹو ا
رضامندی نامہ
کی مکمل تفصیل فراہم کر دی گ ئی ہے اور مجھے سوالات پوچھنے کا مو قع بھی دیا گیا ہے. سرچ یمجھے اس ر
نے کی رضامندی کا مطلب ہے کہ مجھے کچھ سولات کا جواب سرچ یمجھے اس کا علم ہے کہ اس ر میں شامل ہو دینا ہو گا.
کے بغیر ہے اور میں کسی بھی وقت، کسی بھی جرمانے اس کا علم ہے کہ مجھے میری رضامندی کسی بھی دباؤ نے جتنی بھی معلومات دی ہیں سرچ یکے بغیر اس ر سے دستبدار ہو سک تا ہوں.دستبداری کا مطلب ہے کہ میں
. یمیں استعمال نہیں ہو سکے گ سرچ یوہ اس ر
ئے اور معلومات رس بات کا بھی علم ہے کہ میری فراہم کی گ ئی ر مجھے یرا ٹیم تک محدود رھے گی اور م سرچ یا کے پہلے سے اجازت نہ شنیکیپبل / کسی بھی اشاعت ادارے کا نام رے یم اینام میں ظاہر نہیں ہو گا جب تک
لے لی گ ئی ہو.
نے والی رپورٹ ایک عوامی اشاعت سرچ یمیرے علم میں ہے کہ یہ ر کے نیتیجے میں ا ہے اور شنیکیپبل /اور اس
یہ یونیورسٹی کی لائبریری میں عام دستیاب ہو گی.
یز اور اس بات کا بھی علم ہے کہ تمام انفارمیشن اور ڈیٹا محفوظ مقام پر رکھا جائے گا. اس کی ہارڈ کوپ مجھےکے بعد ضایع کر دی جائیں گی. ١٠سوفٹ کوپیز سال
کے تمام خطرات اور کی سرچ یاس ر مجھے نے سے ان کو کم کیا گیا ہے، اس کا بھی علم ہے .میں شامل ہو
لے سک تا ہوں. سرچ یر شنیکیپبل /کی رپورٹ سرچ یمیں اس ر ٹیم سے رابطہ کر کے
ٹیم سے کسی بھی وقت رابطہ کر سک تا ہوں. سرچ یمجھے اس بات کا بھی علم ہے کہ میں ر

299
ریسرچ ٹیم رابطہ ای میل پوزیشن نام
رضوان احمد Rizwan Ahmad
پ ی ایچ ڈی سٹوڈنٹPhD student
[email protected] +64 21 085 99369
.dr ونک تسوارلو پولکنم Dr. Venkateswarlu Pulakanam
سینئر سپروائزر Senior supervisor
[email protected] +64 3 364 2638 Ext. 6638
.dr جوہن وارگو Dr. John Vargo
کو سپروائزر Co-supervisor
[email protected] 2987 364 3 64+ ext. 6627
.dr چوہدری نیالد مصباح Dr. Mesbahuddin Chowdhury
اسوسئیٹ سپروائزر Co-supervisor
[email protected] 2987 364 3 64+ ext. 93711
کے ایتھکس اگر مجھے کے چیئرپرسن سے رابطہ کر سک تا ہوں یٹیکم وئی بھی شکایات ہوئی، میں یونیورسٹی جن کی تفصیل نیچے دی گ ئی ہے.
Chair of the University of Canterbury Human Ethics Committee, Private Bag 4800, Christchurch (human- [email protected]).
تے ہیں کہ میں اس ر رہا ہوں. میں شامل ہو سرچ یمیرے دستخط اسس بات کی تصدیق کر ________________ دستخط ________________ نام
_______________ تاریخ:
.ںید جیپر بھ لیم یاس ا ای کو واپس کر دیں رسرچیمہربانی اس رضامندی نامے کو ر براہ[email protected]
,شکریہ
رضوان احمد

300
ف مینجمنٹ، مارکیٹنگ اینڈ انٹر پرینور شپ ڈیپارٹمنٹ ا
ف کینٹربر ی یونیورسٹی ا
/ 642108599369+ ٦٤٢١٠٨٥٩٩٣٦٩ٹیلی فون نمبر : +
[email protected]ای میل:
/ April 2015 30 ٢٠١٥ اپریل ٣٠
ف ایگریکلچر سپلائی چینسپلائی چین ریسیلینس : نیٹ ورک پرسپک ٹو ا
کے لیے انفارمیشن کا دستاو/دواریام زیشرکا
ف مینجمنٹ، مارکیٹنگ اینڈ انٹر پرینور میں پ ی.ایچ.ڈی کا ایک طالب علم ہوں. میں اپنی یونیورسٹی میں ڈیپارٹمنٹ ا
رگنائزیشن)رسیرچ گروپ شپ اور ایک ایک ریسرچ کا ادارہ ہے. جو کہ سے وابستہ ہوں. یہ نیو زی لینڈ کا (ریسیلینٹ ا
رگنائزیشنز پر رسیرچ کر رہا ہے. مزید (2004) ٢٠٠٤ کے لئے اس ویب سائٹ پر جائیں سے، ریسیلینٹ ا معلومات
: www.resorgs.org.nz
ہلے سےپہنگامی صورت میں ایک کاروبار کے نظام کو برقرار اور یاس ریسرچ کا مقصد ان عوامل کا پتا لگانا ہے جو کسی بھ خاص طور پر یہ رسیرچ مندرجہ ذیل نکات کو سمجھے گی؛ .بہتر بناتے ہیں
کو متاثر کرتے ہیں؟ یوہ کون سی عوامل ہیں جو ایک کاروبار میں اشیاہ کی سپلائ
مشکلات اور نقصان کا سامنا کرنا پڑتا ہے؟ یان کی وجہ سے کاروبار کو کس طرح ک
کرتا ہے؟ پلاننگ ای ایک کاروبار ان ہنگامی صورت سے بچنے کی کیسے تیاری
جا سک تا ہے؟ ایکسی بھی ہنگامی صورت میں اپنے کاروبار کو کس طرح واپس لا
سپلائی چین ریسیلینس کن سے مل کر بنتی ہے؟ کے نیکینتائج مینیجرز کو مشکل حالت سمجھنے اور اپنے کاروبار کو )تکنیکی اور غیر تکعملی نک تہ نگاہ سے، اس رسیرچ
.طور پر( بہتر کرنے میں رہنمائی فراہم کرے گیں
کے پ ایک پہلے سے تیار شدہ سوالنامے کے جواب دیں گے. ان سوالوں پکی اس رسیرچ میں شمولیت کا مطلب ہے کہ ا
ا
پعلاوہ بھی کچھ پوچھا جا سک تا ہے. پکی سہولت پر منحصر ہے. یہ سوالات ا
و ککے بزنس کی سپلائی چین ملنے کا وقت ا
کے ادارےاور سپلائی چین سی جڑے ہر شخص پ نے /درپیش مشکلات کے بارے میں ہیں. خاص طور پرکیسے ا کاروبار
بے کی بنیاد پر یہ رسیرچ ان عناصر کو سمجھنے میں مدد ان مشکلات کا سامنا کیا پ کے تجر پکے کاروبا
ار دے جو کہ ا
پ سے سوالات تقر لئےیک لے سک تے ہیں با یمدد گار ثابت ہوئے. ا .ایک گھنٹہ یا اس سے بھی زیادہ کا وقت

301
پ کی مہیا کی گ ئی انفارمیشن کو استعمال کرنے سے پہلے، اس انٹر ی ر یاس انٹروویو کو تحر ویو کیریکارڈ کیا جائے گا. ا
پکو بھیجی جائے گ ی ر یتحر پکا جواب نا موصشکل ا
پ اس میں تبدیلی کر سکیں. اگر ا
کے پاس یہ موقع ہو گا کہ ا پ
ول ی.ا
پکی فراہم کردہ معلومات اپنی اصل حالت میں استعمال ہو گی .ہوا تو ا
پکو کوئی خطرہ نہیں ہے .اس رسیرچ میں شمولیت سی ا
کے نتائج رسیرچر سےرابطے پر فراہم کیے جا سک تے ہیں پکو اس رسیرچ .ا
پکو یہ بھی حق ہے کہ اپ کسی بھی وقت اس رسیرچ سے نکل اس پکی اپنی رضامندی سے ہے اور ا
رسیرچ میں شمولیت ا
پ یہ درخواست رپورٹ شایع ہونے سے پہلے کریں .سک تے ہیں.یہ اسی وقت ممکن ہے جب ا
ے گا. اس و اس رسیرچ پکا نام سامنے نہیں ا
پ قتکی رپورٹ شایع ہوں گی لیکن کسی بھی صورت میں ا
تک جب کہ ا
پکے نام کو محفوظ رکھنے کے لئے، ہر قسم کا ڈیٹا محفوظ جگہوں پر رکھا جائے گا. اور اس سے پہلے سے پوچھ لیا گیا ہو. ا
کی الیک ٹرانک قسم کمپیوٹر پاس ورڈ سے محفوظ کی جائے گی.اس انفارمیشن تک صرف رضامندی نامے میں موجود افرادکے عرسے میں ضائع کر دیا جائے گا. اس تحقیق کے نتائج ١٠. تمام ڈیٹا ہی رسائی حاصل کر سک تے ہیں تھیسس، سال
رٹیکل کی صورت میں بھی ہو سک تے ہیں. پ ی.ایچ.ڈی تھیسس ایک عوامی دستا ویز ہے اور یہ کانفرنس پپرز اور جرنل ا
.یونیورسٹی لائبریری میں عام حاصل کیا جا سک تا ہے
ف فلا کے مطابق رضوان احمد انجام دے رہے ہیں. ان کے سپروائزر سفیہ پروجیکٹ ڈاک ٹر ا کے مطالبات ی )پ ی.ایچ.ڈی(
;کے نام ہیں
dr. پولکنمونک تسوارلو ) (Dr. Venkateswarlu Pulakanam)[email protected]( ،
dr.جوہن وارگو ) (Dr. John Vargo) [email protected]( ،
dr. مصباح چوہدری)Dr. Mesbahuddin Chowdhury( ([email protected]) .
کے متعلق رابطہ کر سک تے ہیں پ ان سے ای میل پرکسی بھی سوال .ا
پکوگر ا پکوئی بھی شکایات ہوئی، ا
کے ایتھکس کم ا جن کی ںیکے چیئرپرسن سے رابطہ کر سک تے ہ یٹییونیورسٹی
.تفصیل نیچے دی گ ئی ہے
Chair of the University of Canterbury Human Ethics Committee, Private Bag 4800, Christchurch (human- [email protected]).
پ اس ریسرچ میں شامل ہونا چاھتے ہیں تو کے اس پتے پر بھ براہاگر ا .دیں جیمہربانی رضامندی نامے پردستخط کر
,شکریہ
رضوان احمد

302
Appendix C. Detailed Case Description - DCD Issue (D1)
Case Description
1. Background Information
Dicyandiamide (DCD), also known as 2-cyanoguanadine, was commercially used in the
fertilisers eco-n and DCn produced by two large fertiliser companies, Ravensdown and
Ballance. It had been used directly on farmland since 2004 with the good intention to
protect the environment. The use of DCD fertilisers at farm level prevents nitrate leaching
into waterways, which otherwise could contaminate the rivers (Di & Cameron, 2007). It also
reduces the emission of greenhouse gases but with the additional benefit of healthy, rapid
pasture growth. Since 2004, dairy farmers in New Zealand had been using these products on
their farms, mostly twice a year in spring and autumn.
Before its introduction in 2003, Landcare Research19 performed product testing to make
sure that the new product did not present any food safety concerns. Additionally, to cater
for any potential issues, the dairy companies and MPI performed product testing for any
contamination. For example, in 2010, a random test carried out by MPI on a sample of 48
products of raw milk did not show any traces of DCD residue (McNicholas, 2013).
1.1. Countdown to Disruption
In September 2012, routine testing by Fonterra, a major dairy processing company in the
country, revealed minute traces of DCD residues in some of its dairy products. It is uncertain
what led to the detection of DCD residues in this test compared with previous tests. Based
on a review of news reports, one can speculate that it was the result of:
The testing method of the September 2012 test being different from the previous
tests. A report in the NZHerald (2013) indicated that the “US Food and Drug
Administration” (FDA), in 2011-12, introduced a new testing method for
investigating various foreign matters in the dairy products, including DCD. This test
introduced more detailed testing for foreign matter such as DCD than the previous
testing method (NZHerald, 2013).
The growing demand for high-quality dairy products from international markets led
to a greater focus on any foreign substances or contamination. For example, one
year before this issue, international authorities such as US FDA, included DCD
residues in the list of materials to be tested for in food products (FarmersWeekly,
2013a; MPI, 2013a).
19 Landcare Research’s core purpose is to drive innovation in the management of terrestrial biodiversity and land resources. http://www.landcareresearch.co.nz/about (information retrieved on 28-06-16)
303
From these reasons, one can assume that the new testing method for various residues gave
a positive result for DCD residues. Although the residue level was minimal and did not raise
any food safety concerns, in November 2012 Fonterra advised MPI regarding the issue, after
a detailed in-house investigation. This was done to avoid any resulting international trade
risks (FarmersWeekly, 2013b). Immediately, MPI formed a working group consisting of
representatives from MPI, Fonterra, the fertiliser companies (Ravensdown and Ballance)
and Dairy Companies Association of New Zealand (DCANZ20) (FarmersWeekly, 2013a).
From November 2012 to January 2013, this group worked with AsureQuality, an
independent testing laboratory, to validate the initial test results performed by Fonterra. At
that point, most testing was done only on Fonterra’s products and samples. The results
confirmed low levels of DCD residue in certain dairy products, such as whole milk powder,
skim milk powder and buttermilk powder (McNicholas, 2013). All the results indicated a
significantly low value of the residues; compared with the European Food Safety limits, the
level was 100 times lower than the level that could be considered alarming (NZHerald,
2013).
Based on these test results, the group advised as a precautionary measure to withdraw the
fertiliser from the market until further investigations. Additionally, the group agreed to
disclose the information to the media.
1.2. Press Release and Market Response
On 24 January 2013, both fertiliser companies, Ravensdown and Ballance, voluntarily
withdrew the DCD fertiliser products eco-n and DCn from the market (FarmersWeekly,
2013a). This withdrawal was supported and followed by MPI’s and Fonterra’s press releases
on the same day (Fonterra, 2013a; MPI, 2013a).
“The Ministry for Primary Industries (MPI) supports today’s announcement by
Ravensdown and Ballance AgriNutrients that they have voluntarily suspended sales
and use of Dicyandiamide (DCD) treatment on farm land until further notice.” (MPI,
2013a)
All the press releases endorsed that the action taken as a “precautionary measure” since
there was no food safety issue with the tested products. The press release by MPI also
highlighted the lack of pre-defined international standards and outlined the precautionary
steps that had been taken to further investigate the matter.
“The crux of this is that there is no internationally set standard for DCD residues in
food. This is because DCD has not been considered to have any impact on food safety.”
(MPI, 2013a)
20 DCANZ comprises an executive body including four representatives, whereas members of DCANZ includes representatives from all dairy companies.
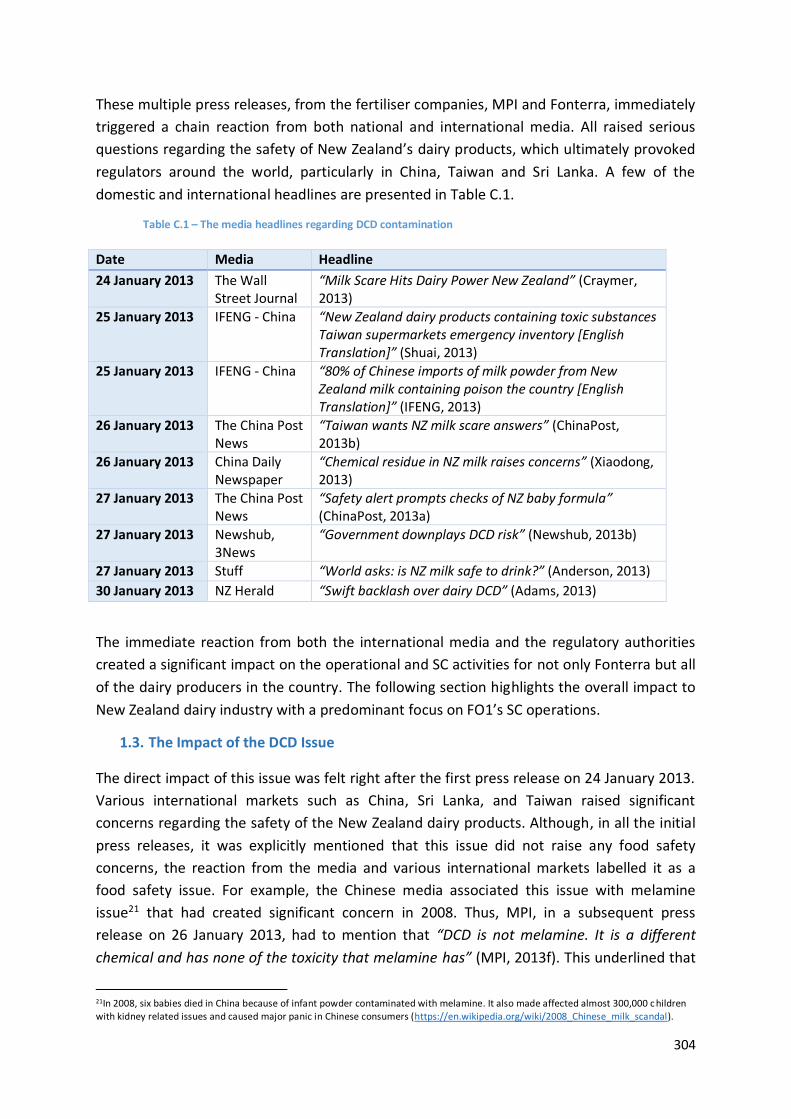
304
These multiple press releases, from the fertiliser companies, MPI and Fonterra, immediately
triggered a chain reaction from both national and international media. All raised serious
questions regarding the safety of New Zealand’s dairy products, which ultimately provoked
regulators around the world, particularly in China, Taiwan and Sri Lanka. A few of the
domestic and international headlines are presented in Table C.1.
Table C.1 – The media headlines regarding DCD contamination
Date Media Headline
24 January 2013 The Wall Street Journal
“Milk Scare Hits Dairy Power New Zealand” (Craymer, 2013)
25 January 2013 IFENG - China “New Zealand dairy products containing toxic substances Taiwan supermarkets emergency inventory [English Translation]” (Shuai, 2013)
25 January 2013 IFENG - China “80% of Chinese imports of milk powder from New Zealand milk containing poison the country [English Translation]” (IFENG, 2013)
26 January 2013 The China Post News
“Taiwan wants NZ milk scare answers” (ChinaPost, 2013b)
26 January 2013 China Daily Newspaper
“Chemical residue in NZ milk raises concerns” (Xiaodong, 2013)
27 January 2013 The China Post News
“Safety alert prompts checks of NZ baby formula” (ChinaPost, 2013a)
27 January 2013 Newshub, 3News
“Government downplays DCD risk” (Newshub, 2013b)
27 January 2013 Stuff “World asks: is NZ milk safe to drink?” (Anderson, 2013)
30 January 2013 NZ Herald “Swift backlash over dairy DCD” (Adams, 2013)
The immediate reaction from both the international media and the regulatory authorities
created a significant impact on the operational and SC activities for not only Fonterra but all
of the dairy producers in the country. The following section highlights the overall impact to
New Zealand dairy industry with a predominant focus on FO1’s SC operations.
1.3. The Impact of the DCD Issue
The direct impact of this issue was felt right after the first press release on 24 January 2013.
Various international markets such as China, Sri Lanka, and Taiwan raised significant
concerns regarding the safety of the New Zealand dairy products. Although, in all the initial
press releases, it was explicitly mentioned that this issue did not raise any food safety
concerns, the reaction from the media and various international markets labelled it as a
food safety issue. For example, the Chinese media associated this issue with melamine
issue21 that had created significant concern in 2008. Thus, MPI, in a subsequent press
release on 26 January 2013, had to mention that “DCD is not melamine. It is a different
chemical and has none of the toxicity that melamine has” (MPI, 2013f). This underlined that
21In 2008, six babies died in China because of infant powder contaminated with melamine. It also made affected almost 300,000 c hildren with kidney related issues and caused major panic in Chinese consumers (https://en.wikipedia.org/wiki/2008_Chinese_milk_scandal).
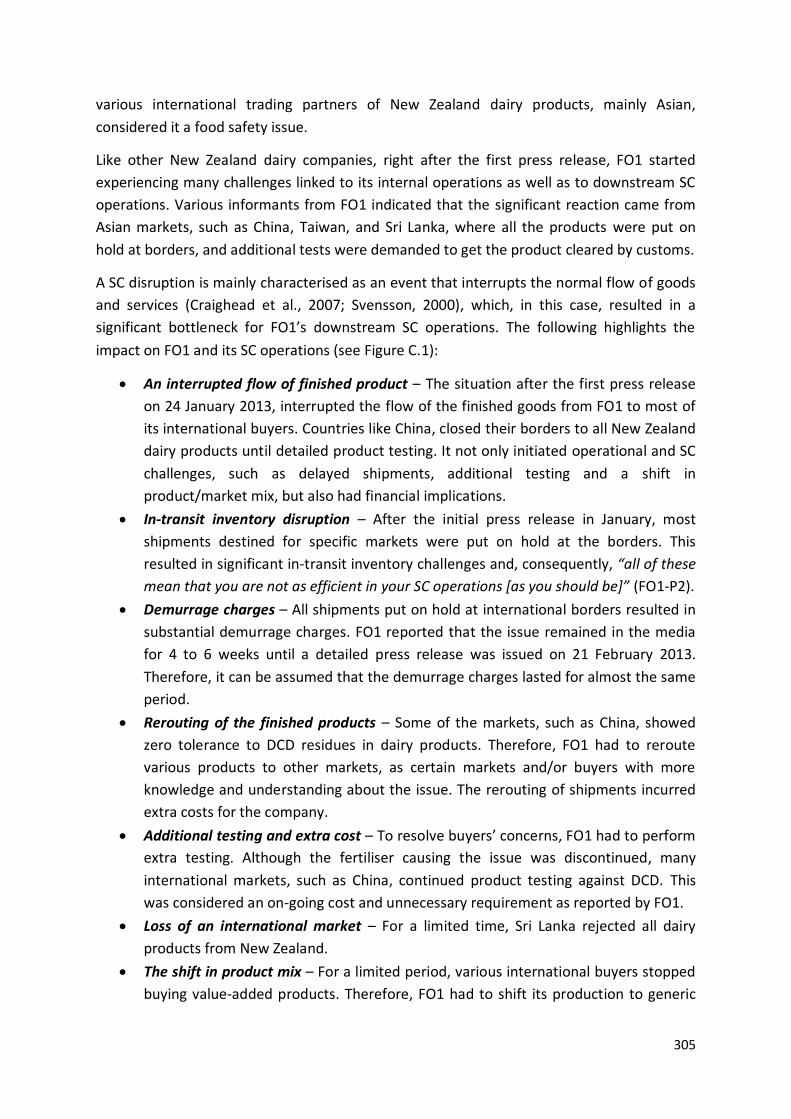
305
various international trading partners of New Zealand dairy products, mainly Asian,
considered it a food safety issue.
Like other New Zealand dairy companies, right after the first press release, FO1 started
experiencing many challenges linked to its internal operations as well as to downstream SC
operations. Various informants from FO1 indicated that the significant reaction came from
Asian markets, such as China, Taiwan, and Sri Lanka, where all the products were put on
hold at borders, and additional tests were demanded to get the product cleared by customs.
A SC disruption is mainly characterised as an event that interrupts the normal flow of goods
and services (Craighead et al., 2007; Svensson, 2000), which, in this case, resulted in a
significant bottleneck for FO1’s downstream SC operations. The following highlights the
impact on FO1 and its SC operations (see Figure C.1):
An interrupted flow of finished product – The situation after the first press release
on 24 January 2013, interrupted the flow of the finished goods from FO1 to most of
its international buyers. Countries like China, closed their borders to all New Zealand
dairy products until detailed product testing. It not only initiated operational and SC
challenges, such as delayed shipments, additional testing and a shift in
product/market mix, but also had financial implications.
In-transit inventory disruption – After the initial press release in January, most
shipments destined for specific markets were put on hold at the borders. This
resulted in significant in-transit inventory challenges and, consequently, “all of these
mean that you are not as efficient in your SC operations [as you should be]” (FO1-P2).
Demurrage charges – All shipments put on hold at international borders resulted in
substantial demurrage charges. FO1 reported that the issue remained in the media
for 4 to 6 weeks until a detailed press release was issued on 21 February 2013.
Therefore, it can be assumed that the demurrage charges lasted for almost the same
period.
Rerouting of the finished products – Some of the markets, such as China, showed
zero tolerance to DCD residues in dairy products. Therefore, FO1 had to reroute
various products to other markets, as certain markets and/or buyers with more
knowledge and understanding about the issue. The rerouting of shipments incurred
extra costs for the company.
Additional testing and extra cost – To resolve buyers’ concerns, FO1 had to perform
extra testing. Although the fertiliser causing the issue was discontinued, many
international markets, such as China, continued product testing against DCD. This
was considered an on-going cost and unnecessary requirement as reported by FO1.
Loss of an international market – For a limited time, Sri Lanka rejected all dairy
products from New Zealand.
The shift in product mix – For a limited period, various international buyers stopped
buying value-added products. Therefore, FO1 had to shift its production to generic
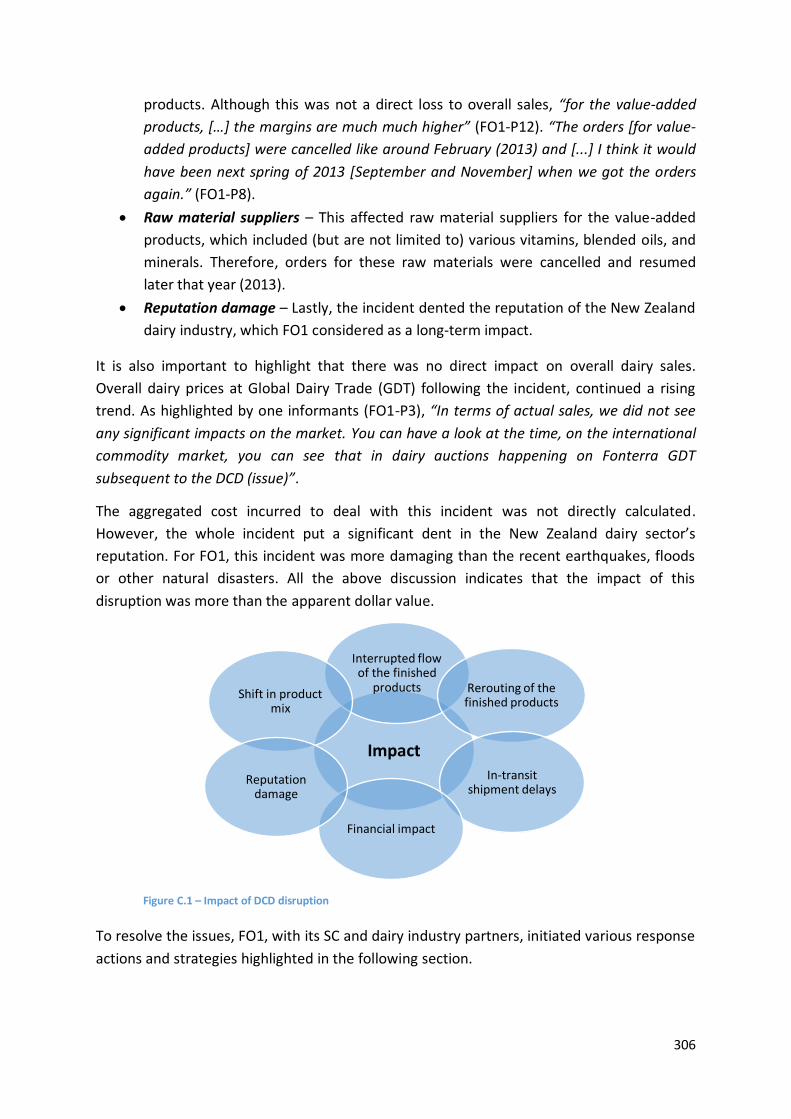
306
products. Although this was not a direct loss to overall sales, “for the value-added
products, […] the margins are much much higher” (FO1-P12). “The orders [for value-
added products] were cancelled like around February (2013) and [...] I think it would
have been next spring of 2013 [September and November] when we got the orders
again.” (FO1-P8).
Raw material suppliers – This affected raw material suppliers for the value-added
products, which included (but are not limited to) various vitamins, blended oils, and
minerals. Therefore, orders for these raw materials were cancelled and resumed
later that year (2013).
Reputation damage – Lastly, the incident dented the reputation of the New Zealand
dairy industry, which FO1 considered as a long-term impact.
It is also important to highlight that there was no direct impact on overall dairy sales.
Overall dairy prices at Global Dairy Trade (GDT) following the incident, continued a rising
trend. As highlighted by one informants (FO1-P3), “In terms of actual sales, we did not see
any significant impacts on the market. You can have a look at the time, on the international
commodity market, you can see that in dairy auctions happening on Fonterra GDT
subsequent to the DCD (issue)”.
The aggregated cost incurred to deal with this incident was not directly calculated.
However, the whole incident put a significant dent in the New Zealand dairy sector’s
reputation. For FO1, this incident was more damaging than the recent earthquakes, floods
or other natural disasters. All the above discussion indicates that the impact of this
disruption was more than the apparent dollar value.
Figure C.1 – Impact of DCD disruption
To resolve the issues, FO1, with its SC and dairy industry partners, initiated various response
actions and strategies highlighted in the following section.
Impact
Interrupted flow of the finished
products Rerouting of the finished products
In-transit shipment delays
Financial impact
Shift in product mix
Reputation damage

307
2. FO1’s Response
As highlighted earlier, DCANZ was informed about the DCD issue before the first press
release in November 2012, which meant that the message should have been brought to
FO1’s attention, since DCANZ involves members from almost all dairy companies in New
Zealand, including FO1. However, many informants from FO1 highlighted that before the
first press release “there was no involvement of our company with MPI and Fonterra [and]
most of the working [planning and product testing] during this time period [prior to the first
press release] was done by them” (FO1-P2).
Therefore, it is believed that FO1 got involved in this issue at the same time it was unfolded
in the media. Therefore, FO1 had a little chance to prepare, in advance, for this incident
before the first press release, apart from its generic preparedness regarding food safety
issues.
After the first press release, FO1’s top management formed a “crisis management team”
which “followed the pre-established procedures” (FO1-P11). The team quickly analysed that
various countries and buyers wrongly perceived this as a food security issue. The crisis
management team involved representation from all the relevant departments, such as Sales
& Marketing, Procurement (milk supply), SC, and Quality. In parallel to the crisis
management team, functional teams or sub-teams were involved to undertake various tasks
within each department. The individual tasks from each sub-team were coordinated by the
crisis management team, which enabled communication with top management and with
other key stakeholders, such as buyers, DCANZ and MPI. The team had regular interaction in
daily meetings within the organisation and also with industry partners.
The major manifesto of the crisis management team was to gather information, especially
regarding the responses from the various international markets, to develop a response plan
and ultimately reduce the impact of the crisis. The activities identified by various informants
were grouped into five tasks:
Task 1 – Detection of potentially affected products or batches
Task 2 – Product traceability in FO1’s SC
Task 3 – Development and execution of a testing regime
Task 4 – Communication with the key stakeholders
Task 5 – Development and execution of operational/SC adjustments
It is important to note that these tasks are not mutually exclusive and many tasks occurred
simultaneously.
Task 1: Detection of the potentially affected products or batches – Right after the first
press release, FO1’s first task was to establish a list of the affected products or batches. It
was quickly determined that application of fertiliser containing DCD during the previous
season (August-September 2012) led to the detection of DCD residues in dairy products.
308
Therefore, the milk supply team worked on determining the farms that had used the
fertiliser the previous year. This information was retrieved from the fertiliser companies.
Although the milk supply team received the required information immediately, it was
revised multiple times which including an increased and revised number of farms linked to
fertiliser application (highlight by FO1-P8).
The milk supply team promptly passed the information to other relevant departments to
determine the particular batches produced during that season. FO1’s information system
supported the quick transformation of raw data into concrete information regarding
potentially affected batches, which enabled FO1 to schedule product testing.
Task 2: Product traceability in FO1’s SC – The task for the sales and marketing team was
divided in two. First, the team worked with its downstream SC partners to track the finished
products, especially for markets that showed significant concern. This led FO1 to determine
which international markets or buyers were demanding test results and the exact location
of the products in the SC.
Secondly, the team linked potentially affected batches and their location in the downstream
SC. This was also supported by the information system that stored all the required
information regarding batch numbers produced during a specific season, the corresponding
raw materials information, various tests and producers performed during production and,
lastly, buyers’ information. The information reconciliation by the milk supply team and sales
department narrowed down the exact batches that needed to be tested for DCD and their
location in the SC.
Task 3: Development and execution of the testing regime – Though the information
regarding the potentially affected batches was readily available, testing the potentially
affected products was a challenge. The industry-wide issue led all dairy producers to use the
same laboratory to ensure consistency in the test results. This created a significant
bottleneck in getting test results for each dairy producer. The development of a testing
regime was quick because, before the first press release, MPI and Fonterra worked on the
regime.
To deal with the bottleneck, the quality team quickly worked with the sales team to
determine and prioritise batches that required urgent attention. The teams prioritised
product samples based on their location in the SC, e.g., products that were at customers’
borders were prioritised first before those that were in-transit. Similarly, products were
prioritised based on their destination to markets such as China.
It took 3 to 4 weeks to clear the backlog of product testing by the testing laboratory. The
results were then communicated to the sales team and to the crisis management team for
their further action.
Task 4: Communication with the key stakeholders – The sales team started communication
with the buyers even before the buyers got the news from media. For example, exclusively
309
to deal with this disruption, FO1 structured a dedicated communication channel to receive
all the concerns from buyers and provide them with accurate, transparent information.
Throughout this issue, the sales team ensured continuous and transparent information
sharing with all of its buyers.
In parallel, a connection was established with industry partners to develop a centralised
response regarding the issue. As it was an industry-wide issue, MPI played a centralised role
in representing the whole New Zealand dairy industry. From FO1’s perspective, a dedicated
person in top management was appointed to represent FO1 and to establish
communication with relevant authorities such as DCANZ and MPI. This connection was
maintained throughout the disruption in the form of regular meetings. For the initial phase,
communication was on a daily basis.
The connections with the industry and the regulatory authority provided FO1 with the key
insights and developments in international markets. During the daily meetings of the crisis
management team, these key insights from key stakeholders were shared within the
organisation, such as with key personnel or departments.
Task 5: Development and execution of operational/SC adjustments – Based on the
response from the international markets, it was determined that countries such as China
showed zero tolerance for the products containing any amount of DCD residue. Though, all
of the products determined safe for consumption, however, even after all the test results,
China decided not to allow any product with a minute level of the residue. Therefore, FO1
then decided to reroute all of its products to markets or countries, which had more
understanding regarding the issue.
In addition to the short-term adjustments, FO1 also engaged in long-term assessment,
which helped the company to adjust its market focus in the long-run. After this disruption,
the company decided to spread its market share more evenly across several markets. In
addition, FO1 reviewed various shortcomings in dealing with this disruption. Based on this
review, the company improved various avenues such as the company strengthened its
relationship with industry partners (DCANZ), diversified its international markets and
improved its product traceability systems.
3. Industry Response
As highlighted above, the nature of this incident required a comprehensive response from
the New Zealand dairy industry because this issue was not just limited to one particular
dairy company. Therefore, the response from international markets was handled by MPI,
the New Zealand regulatory authority. MPI led a detailed response and formed a larger
working group involving all dairy industry players, DCANZ and other relevant authorities.
For a month after the first press release, the testing regime was laid out. All dairy players
were required to test their products for DCD and the results were communicated to MPI to

310
compile a central response. All the testing results confirmed the previous findings (MPI,
2013b):
The DCD residue level was very low and did not indicate any food safety concerns.
The residue was because of the application of DCD fertiliser between 1 June and 28
September 2012.
Only limited number of farmers, less than 5 percent across the country, actually used
DCD fertiliser.
The residue disappeared from the soil quickly and did not appear in products
produced after mid-November 2012.
Although the final press release was released on 21 February 2013, MPI and Fonterra issued
several press releases between 24 January and 21 February 2013 (see Table C.2). The
comprehensive press release by MPI on 21 February 2013 confirmed that all necessary
actions had been taken. The situation then started to normalise in the situation.
Table C.2 – A summary of the follow-up press releases concerning DCD contamination
Date Authority Press Release
26 January 2013 MPI “New Zealand Government assures safety of country's dairy products.” (MPI, 2013f) The press release also included a Chinese translation.
27 January 2013 Fonterra “Fonterra reassures on food safety” (Fonterra, 2013c)
2 February 2013 Fonterra FAQs regarding DCD were published on Fonterra’s website. (Fonterra, 2013e)
21 February 2013 MPI “DCD Update: Testing confirms expectations of DCD distribution in products” (MPI, 2013b) A Chinese translation of the press release was also released.
The climax of the incident was all dairy processors had their products tested for DCD
residues and provided the results required by the different markets around the world. The
issue lasted for 4 to 6 weeks. Once the test results were shared, FO1 reported that all dairy
products eventually went through its SC to the consumers.
4. Analysis of the DCD Disruption
The data collected from all the organisations, including FO1, its SC partners, and other
stakeholders, were analysed to explore how FO1 and its network partners dealt with the
issue. Briefly, FO1 responded relatively well during this issue. The various actions and
strategies adopted by FO1 and its network partners led to a fast response and recovery,
whereas some actions were labelled as counterproductive. These successful actions are
labelled as the key SC resilience elements emerged from the data analysis and these are
discussed in this section.

311
4.1. Crisis Management Team
In response to the aggressive reaction from various international markets, FO1 immediately
realised the depth of the issue and the top management instantly invoked its risk
management plan, which involved deployment of the crisis management team. Various
interviewees from FO1 mentioned the risk management plan, which describes the structure
of the crisis management team, its key roles and responsibilities. The pre-defined risk
management plans led to the quick formation of the crisis management team.
"Right after the (first) press release, a crisis management team was formed, and it
just followed the procedures that we had." (FO1-P11)
In terms of composition, the crisis management team involved representation from top
management and key personnel from the departments concerned. In addition to this crisis
management team, various sub-teams or departments were involved in dealing with the
disruption. Primarily, the crisis management team focused on establishing collaboration
with the key stakeholders and making strategic decisions. The sub-teams aimed at more
technical and operational responses in close coordination with the crisis management team.
The role of FO1’s crisis management team was:
To analyse the post-disruption environment
To collaborate and closely work with internal teams and external stakeholders
(including MPI, DCANZ, Fonterra, and customers)
To develop and execute response strategies to deal with the disruption
To develop a communication strategy and act as a hub for communication
To provide input for a collective industry response
From FO1’s perspective, it was noted that the crisis team played a hub role, primarily
responsible for processing and analysing the information from various stakeholders. This
enabled FO1 to develop response strategies to deal with the disruption. Analysis of the data
suggested that for FO1’s SC, information was managed, analysed and transferred by the
FO1’s crisis management team. This information sharing and coordination with the key
stakeholders led FO1 to make timely and informed decisions.
“We have a crisis management team that would quickly get together and do all the
analysis and research we need to understand the risks and whether it a real or
perceived issue.” (FO1-P4)
Many of the decisions and activities initiated and managed by FO1’s crisis management
team are further discussed in Sections 4.2, 4.3 and 4.4.
In addition to FO1’s crisis management team, a team at the dairy industry level, involving
MPI and DCANZ (including FO1, FO1-C1 and FO1-C2), managed and executed an industry
level response. It was observed that the industry level team was fundamental to deal with
312
the issue more holistically. For example, this team collaborated on the testing regime and
results from all dairy players and communicated with concerned stakeholders.
In conclusion, it was found that effective management of a disruption primarily depends on
a crisis management team with cross-functional representation; it is vital to analyse and
assess the post-disruption environment. Secondly, a pre-defined risk management plan
enables the quick deployment of the crisis management team after a disruption. Lastly,
teams at various levels, such as industry, SC or functional level, complement each other in
developing and executing various response strategies.
4.2. Collaboration with the key stakeholders
The response to this disruption represented collaboration at two levels – horizontal
(industry) level and intra-organisational level. The horizontal or industry level collaboration
was observed among FO1, MPI and all dairy producers in the country. The second type of
collaboration was intra-organisational collaboration, which included collaboration among
various departments or teams within an organisation.
4.2.1. Horizontal (Industry) collaboration
Collaboration is considered the glue that binds all stakeholders together to deal collectively
with an adverse event (Richey, 2009). In the context of the DCD issue, collaboration played a
vital role in binding all key stakeholders to respond collectively to the issue. Horizontal
collaboration was especially identified as a critical aspect, which FO1 and other participating
dairy players (FO1-C1 & FO1-C2) stressed most during both the pre- and post-disruption
stages.
As highlighted above, before the first press release a working group, including
representation from Fonterra, MPI, AsureQuality and DCANZ, was formed to work on the
issue. This meant that the issue should have been brought to FO1’s attention, since DCANZ
involves members from almost all dairy companies in New Zealand, including FO1. However,
FO1 claimed that, before the first press release, there was no collaboration or information
sharing; this compromised the initial response.
“So what happened, prior to the [first] press release, was that [Fonterra] only worked
with MPI, so no other dairy company was involved.” (FO1-P3)
“Independent processors, along with the public, were not told about the chemical
residue discovery in Fonterra testing of some of its dairy products until four months
later, when it was announced in late January by MPI. [….] MPI said DCANZ was "part
of a working group" on DCD. But non-Fonterra DCANZ members said they did not
know about the DCD issue much before the public.” (Source: News Article by Fox
(2013a))

313
Here, two critical questions arise. First, how would early collaboration, before the first press
release, between all the dairy producers have helped in the effective management of this
disruption? Secondly, why was there no pre-disruption collaboration?
FO1 emphasised that pre-disruption collaboration would have led to a better approach to
deal with the disruption. For example, prior collaboration between all dairy producers,
including FO1, would have led to product testing for all dairy players rather than limiting it
to only one dairy company (i.e., Fonterra). One can assume that this would have led to a
detailed first media communication on 24 January giving more clarity on the situation to all
key stakeholders. Additionally, early information sharing would have allowed each dairy
company to better prepare communication strategies for its SC partners, such as suppliers
and buyers. All of this would have enabled a better response and quicker recovery not only
for individual dairy companies but also for the whole New Zealand dairy industry.
“I think the better understanding and collective working at that time [prior to the first
press release] could have led to better knowledge about the whole problem, but that
would have only been possible if they had involved all the dairy players. So after the
[first] press release, we needed to catch up fast.” (FO1-P2)
Considering these benefits, another major question arises. Why was there an absence of
pre-disruption collaboration? Data analysis suggests that a major reason was the absence of
an effective industry consortium (i.e., DCANZ) before this disruption. As described by one
interviewee, “if my recollection is right […] executives in DCANZ were informed, but they
never informed the members [dairy companies] of the DCANZ” (FO1-P11). It was noted that
the New Zealand dairy industry as a whole had not experienced such an industry-wide issue
before this disruption, which indicates “lack of experience” as another reason. It can be
inferred that an ineffective industry consortium or cross-organisational team and lack of
experience were the primary culprits of limited collaboration before the first press release.
“I guess at that time the DCANZ was not really the effective body, but I am not sure
about the real reason. It was not used for these kinds of planning and response prior
to this incident.” (FO1-P11)
Subsequent to the first press release, horizontal (i.e., industry) collaboration was noted as a
pivotal feature to deal with this issue. It was learnt that MPI with all the other dairy
producers, including FO1, FO1-C1 & FO1-C2, quickly understood the implications of the
disruption for the whole New Zealand dairy industry, which enabled industry-wide
collaboration. Collaboration among the dairy companies was facilitated by the industry
consortium (i.e., DCANZ) led by MPI.
“In the midst of that all we had daily calls with MPI in Wellington and with a lot of
other industry participants. I was actually managing the daily calls from the company
[FO1] at that time. So I used to spend an hour a day just keeping track with what was
going on.” (FO1-P11)

314
Data analysis also suggests that this cross organisational team was formed to serve two
critical purposes. First, it was to deal with the post-disruption situation holistically by
involving representatives from each dairy company. Secondly, this collaboration allowed the
dairy companies, individually and collectively, to prepare and manage the disruption. The
main activities of this cross-organisational collaboration were:
To share information regarding reactions from international markets and regulators
To work collectively on the testing regime
To develop a crisis communication strategy
To share and centrally communicate the test results to relevant stakeholders. For
example, MPI centrally communicated all test results to the media and international
regulators (MPI, 2013b)
Here, it can be inferred that the understanding of key stakeholders (also referred as SC
understanding by Christopher and Peck (2004)), an effective industrial platform (such as
DCNAZ), structured teams and regular meetings are key facets to enable effective
collaboration. The key activities observed during this collaboration were information or
knowledge sharing, collaborative or centralised communication, and joint problem solving
(also highlighted by Scholten and Schilder (2015)), which ultimately enabled FO1 and other
dairy players to deal effectively with this issue. Lastly, collaboration among dairy producers
(competitors), also referred as “coopetition” (Bengtsson & Kock, 2000; Osarenkhoe, 2010),
was the key feature of this horizontal collaboration.
4.2.2. Intra-Organisational collaboration
The second level of collaboration was intra-organisational collaboration among various
functional teams within FO1. For example, the quality team worked with the sales team to
determine and prioritise the product testing schedule. Similarly, the milk supply team
determined the number of farms that used the fertiliser and then passed this information to
other relevant departments to investigate the particular batches produced during that
period. This kind of cross-departmental collaboration within FO1 remained throughout this
disruption and was noted as a key feature of FO1’s effective response and recovery.
Like the horizontal collaboration, intra-organisational collaboration within FO1 was led and
facilitated by the central or hub entity, i.e. FO1’s crisis management team. At a micro scale
within FO1, understanding the functional impact of the disruption was a pivotal driver to
decide which function or team within the company needed to be involved during the
disruption. Further, the supportive organisational culture was identified as a key contributor
to effective collaboration within FO1 and also with key SC partners (discussed in Section
4.7).
In summary, collaboration is the glue that binds key stakeholders (Richey, 2009), both at the
network and organisational level. It enables sharing of critical information, collaborative

315
communication and joint problem-solving. Analysis suggests that these collaborative
activities led to effective management of this disruption.
4.3. Crisis Communication
Crisis communication during the disruption, especially the first few press releases by MPI
and Fonterra to the media (Fonterra, 2013a; MPI, 2013a), were highly criticised by many
informants. Most informants argued that the first few press releases presented vague
information, which prompted speculation so the issue was presented out of proportion by
the media.
“In case of DCD, the major planning and work were only limited to Fonterra and MPI,
and that’s the criticism that we have on this issue. Other than that how the issue was
communicated, was another setback.” (FO1-C1)
“But I think, the whole thing was badly managed and communicated to the media.”
(FO1-P8)
According to the data analysis, the issue escalated after the first public press release on 24
January 2013. It presented relatively vague or unclear information to the various
stakeholders, such as the general public, media and international regulators. As this
communication was related to food safety, the Food and Agriculture Organization of the
United Nation (FAO) guidelines were used to analyse the first press release content (DIA,
2014; FAO, 1998). According to FAO, a crisis communication should show:
full knowledge of the problem (i.e., a food safety issue),
the risks involved and knowledge of the potentially affected products,
consumer advice, and
measures taken to control and avoid the issue.
Overall, an effective crisis communication should answer all or most queries of the
stakeholders, i.e., should not lead to confusion or misunderstanding. Grounded on these
FAO principles, it is clear that the first press release had a number of shortcomings including
a vague statement regarding the issue and a lack of scientific evidence. For example, it did
not show details of the tested products. Many respondents believed that lack of proper
crisis communication created confusion among the media players (both domestic and
international) and regulatory authorities. Table C.3 compares the FAO’s guidelines as cited
in DIA (2014) with the first press release.

316
Table C.3 – Effective communication versus the first press release by MPI
Guidelines for Crisis Communication – Food Safety Issue (DIA, 2014; FAO, 1998)
DCD Issue – First Press Release by MPI (MPI, 2013a)
Analysis
Comments Comply with the FAO guidelines (√) or Missing (X)
What is known about the food safety issue
“The crux of this is that there is no internationally set standard for DCD residues in food. This is because DCD has not been considered to have any impact on food safety […] Because no standard exists, the detectable presence of DCD residues in milk could be unacceptable to consumers and our international markets, even in the small amounts found in recent testing.”
Generic statement, The issue considered as a non-food safety issue
Risk involved with the contaminated products
“This is because DCD has not been considered to have any impact on food safety.”
Not clearly identified
X
Contaminated or affected products
- No detail was provided
X
Measures taken to control the crisis
“Voluntarily suspended sales and use of Dicyandiamide (DCD) treatment on farm land until further notice.”
No measures were identified for potentially affected products.
X
The source of contaminated food
“DCD has been used in New Zealand farming in a unique and innovative way.”
Identified
What to do with any suspected product for consumers – Health advice
No direction Considered as a non-food safety issue.
X
Preventive measures taken to eliminate further spread
“Voluntarily suspended sales and use of Dicyandiamide (DCD) treatment on farm land until further notice.”
Identified and executed
Information or contact details for further information
No particular directions General Helpline
In contrast to the first press release, the final media communication presented all the
critical information regarding the issue, such as the number of samples tested from all major
dairy companies and the test results. Similarly, in one earlier communication, the scientific
evidence was presented to demonstrate how this issue was not related to food safety. It is
noted that both of these later press releases presented ample information to resolve
confusion created by the first few press releases.
317
Here, two critical questions regarding the crisis communication were further analysed:
First, why did the authorities release the first press release with such a vague or
limited information?
Secondly, what can be learnt regarding the crisis communication?
From the data collected from the various stakeholders, many respondents mentioned that
not all dairy companies were involved, and not all the samples from other dairy companies
were tested. This indicates that the working group, before the first press release, did not
anticipate the potential impact on other dairy players. Considering that the working group,
before the first press release, would have analysed and anticipated the situation more
holistically, then there should have been comprehensive preparation, such as product
testing by all other dairy players and proper media communication. One can assume that
this would have eliminated the confusion or misunderstandings. It can be concluded that
situational awareness, e.g., anticipation of possible reactions, is a pre-requisite in preparing
for a potential disruption and crisis communication.
“Well, other dairy players should have been involved from the start. […] So if they
have different people up here with a different way of thinking, it might have been
handled differently. […] and it would have led to quick and better communication
with the buyers [FO1’s buyers], we would have worked on product traceability and
testing regime in advance, and avoid overwhelming response from different
markets.” (FO1-P2)
Secondly, this disruption highlighted the importance of the content or information provided
during a crisis, especially with a sensitive product such as dairy products. Many informants
highlighted that although it was not a food safety issue, the way it was presented to the
media meant it eventually was perceived as a food safety issue. Therefore, in terms of
content, a crisis communication must present more scientific information, e.g., in this case,
one aspect could have been detailed scientific facts about it not being a food safety issue.
In conclusion, a better understanding of potential outcomes and possible impacts on key
stakeholders, which came through post-disruption situational awareness, can lead to
effective crisis communication. Secondly, crisis communication, in case of a sensitive
product such as dairy products, should be driven based more on scientific evidence and
must follow general guidelines regarding food safety issues, such as FAO’s guidelines (FAO,
1998).
4.4. Situational Awareness – Post Disruption
A SC disruption results in an interruption in the flow of goods and materials within a SC
network (Craighead et al., 2007), and displays a chaotic environment with a high degree of
uncertainty. For example, after the first press release, the stable business environment for
New Zealand dairy companies suddenly became immensely chaotic and uncertain. As

318
described by one respondent (FO1-P1), just after the first press release, “It was uncertain for
first few days that what is going to play”. In order to make relevant decisions and establish
effective crisis communication, organisations in a SC need to make sense of the rapidly
changing situation in the face of a disruption.
First, it was found that the process of situational awareness entails gathering data or
information from both within the organisation and from the key stakeholders, referred to as
the “business intelligence process” (Pettit et al., 2010). FO1’s connection with the relevant
stakeholders such as MPI, DCANZ and other dairy players provided key developments and
insights regarding the issue.
Secondly, it was also learnt that FO1’s information systems provided critical information
during this disruption. For example, information regarding product traceability was readily
available from FO1’s information systems. Similarly, data analysis showed that other dairy
companies (FO1-C1 & FO1-C2) were also involved in gathering and sharing critical
information with the key stakeholders. It can be inferred that adequate information systems
facilitate organisations in gathering relevant information and understanding the situation
during a disruption. Luokkala and Virrantaus (2014) highlight a similar finding.
After information gathering, it was learnt that organisations analyse and comprehend the
data or information. In this case, immediately after the first press release, FO1 started to
envision possible failure points through scenario planning. For example, the logistics team
(FO1-P9) started early planning (i.e., scenario planning) for an additional warehouse in case
of excess finished goods inventory. Similarly, possible ways were analysed to reduce the
time and cost of the disruption. For example, the sales and quality teams worked together
on prioritising product testing based on multiple criteria, such as product information and
position in the SC.
“Within the sales area, we also prioritised our response initially to the markets where
there was a definite requirement to have a testing mechanism. […] [For that] We
gathered information from the buyers and also gathered from the system that we
had here at that time.” (FO1-P3)
“So right after that, we did our analysis regarding which farms were affected by it, as
this was an on-farm issue.” (FO1-P2)
The situational awareness analysed from this case is profoundly aligned with the process
explained by Endsley (2012) and highlighted by other researchers (Luokkala & Virrantaus,
2014; Seppänen & Virrantaus, 2015). According to these authors, situational awareness
starts with gathering relevant information and involves data comprehension and projection
of possible future outcomes. This process enables an organisation to make quick, relevant
decisions. This, in turn, enables an organisation or SC to respond rapidly and recover from a
disruption, hence achieve SC resilience.

319
Additionally, it was inferred from the data analysis that different individuals or teams were
involved in making sense of the situation during this disruption, for example:
Functional teams were involved in analysing the situation concerning the operational
activities. For instance, the quality team was responsible for the understanding the
complexity involved in setting up the testing regime and results.
FO1’s crisis management team was responsible for analysing the situation and
making decisions for both the company and its SC.
The inter-organisation team at the New Zealand dairy industry level, including MPI,
dairy companies and DCANZ, was responsible for making decisions on behalf of the
whole dairy industry.
4.5. Product Traceability and SC Visibility
An essential step highlighted in FO1’s response section (Section 2) was the company’s
actions to locate its finished products in the SC, which was linked to FO1’s product
traceability capability. This section highlights the findings from this disruption on how an
organisation with its SC partners achieves this ability, which can become very critical for a
dairy product.
Data analysis showed that the first facet in achieving this ability is to ensure that a company
has pre-defined procedures and systems regarding product traceability in place before a
disruption occurs. For example, as discussed in Chapter 4, FO1 had systems and processes in
place to identify how information from its upstream SC partners such as raw material
suppliers and downstream SC partners are stored and integrated into the IT system. FO1
had this IT capability and procedure before this disruption, which enabled it to quickly
recover the information when it was required during the disruption.
“We do have quite a bit of visibility throughout, [and] we do have systems to track
[our product].” (FO1-P1)
Secondly, FO1 had made sure that these systems were integrated with its SC partners,
which enabled it to build visibility across its SC. For example, FO1 regularly conducts various
mock recall exercises with its SC partners to test and improve its systems and procedures.
“We have done a mock recall recently, [in which we] identified [a] product and then
we had gone to, like to our customers, that we are doing a mock recall and you tell us
this is the lot number. Can you tell us where that product is? Where it has gone?
Because they need to do that in their systems as well.” (FO1-P1)
In conclusion, the findings show that predefined systems and procedures and integrated IT
systems enabled FO1 to increase its visibility throughout its SC and helped in tracing its
products during this disruption. In an earlier Section 4.4, it was highlighted that this
information was a critical for situational awareness.

320
4.6. Operational/SC Re-Engineering
A significant part of dealing with this disruption involved changing or adjusting various SC
processes and operations during or after the disruption. For example, several buyers
required FO1 and other New Zealand dairy companies to test for DCD to resolve the
problem. The extra testing was a change in existing requirements for which FO1 had to
adjust various processes. Similarly, during this disruption FO1 was required to modify,
improve or change several SC processes and operations, which is referred as operational or
SC re-engineering.
Data analysis showed that four pre-existing SC/operational strategies helped FO1 and other
organisations change or quickly adjust their SC operations during this disruption:
serving the product to multiple markets/buyers;
having flexible contracts with the suppliers;
offering diverse product mix; and
having redundant capacity.
During this disruption, FO1 was required to reallocate its specific products. FO1’s strategy to
serve multiple buyers in multiple countries enabled it to shift products quickly from one
market to another. Previous researchers have referred this phenomenon as flexibility (Pettit
et al., 2010; Sheffi & Rice, 2005). In this case, it was diversity in the customer base at
multiple geographic locations. Similarly, FO1 had a relatively diverse product mix which
enabled it to shift from one product category to the other since, after this disruption, orders
for particular products were cancelled for a limited time.
“We had to reallocate and move the products from certain markets to other markets
where it was not a real issue.” (FO1-P3)
“The majority of our products are not just for one customer or market, some of them
may for one customer, but we can still shift to different parts of the market if we
need to.” (FO1-P3)
Similarly, it was observed that FO1 had a flexible contract with its third-party logistics (3PL)
provider to acquire additional warehouse space during such situations since, for a limited
time, the company had to stock more than usual amount of finished products. Both FO1’s
flexible contract and its 3PL excess capacity were pivotal in quickly adjusting SC operations.
In addition to the pre-existing strategies, FO1 had to adopt an additional product testing
requirement, which meant developing a new testing regime and upgrading associated
processes. For this, the company trained and educated its staff to adhere to these new
requirements. Additionally, to fulfil these requirements, FO1 established linkages and
collaborated with partners outside its typical SC. All of this was categorised as operational or
SC re-engineering during this disruption.

321
Christopher and Peck (2004) describe SC re-engineering as a process to design SC operations
with the aim of reducing potential risk. SC understanding, supply base strategy and SC
design principles are key sub-factors that enables an organisation to design SC operations to
deal effectively with an uncertain event. Mainly, the supply base strategy and SC design
principles involve building in flexibility to operations (such as multiple sourcing and
postponement) or redundancy (such as slack capacity and buffer stock) (Christopher & Peck,
2004; Pettit et al., 2010; Sheffi & Rice, 2005).
Though these researchers emphasise designing these principles into the SC before a
disruption, the data analysis from this disruption highlighted that, in addition to developing
these processes before this disruption, FO1 was required to adjust or adapt new processes
during the disruption. For example, FO1 had to initiate new testing requirement in its
operations, which required the company to update various associated activities (such as
export documentation). From the data analysis, it can be concluded that a combination of
both pre-existing SC strategies and the introduction of new processes enabled FO1 to deal
with the disruption adequately. It was learnt that SC/Network understanding and situational
awareness allowed the company to understand the distinct dynamics and requirements of
the issue and adjust accordingly.
In conclusion, operational/SC re-engineering refers to designing internal operations and SC
processes either in advance of or during a disruption to reduce the risk (pre-disruption) or
impact (post-disruption) of a disruption.
4.7. Supportive Organisational Culture
During this disruption, the early days presented a plethora of uncertain information, which
required all key individuals, teams and stakeholders to apply collective wisdom to make
quick, relevant decisions as highlighted in the situational awareness section (Section 4.4).
During this process, the supportive organisational culture of FO1 was a key driver that
facilitated all other SC resilience elements, such as ease of information sharing within FO1.
“The senior leadership” showed “a huge commitment” immediately after seeing an
aggressive response from the international market, which led to the formation and
deployment of the crisis management team (FO1-P11). The other notable element of the
observed supportive culture was the empowerment that allowed the functional teams to
work autonomously and make quick decisions.
One additional aspect noted during this disruption was FO1’s culture of learning. FO1 learnt
from this disruption and improved various SC operations. For example, FO1 diversified its
customer base by spanning its customer base more evenly to different countries, which
reduced the risk of serving only one big customer in a single market. Further, FO1 improved
and strengthened its traceability operations. Similar learning was also noted at the dairy
industry level, where the whole dairy industry got closer after this disruption. This led to
future collaboration among the key dairy players at the industry consortium (DCANZ) to deal
with this kind of industry-wide issue.
322
As discussed by various authors (Christopher & Peck, 2004; Pettit et al., 2013; Sheffi & Rice,
2005) top management support is a crucial facet to cultivate a supportive culture in an
organisation, which is essential to achieve SC resilience. Similarly, Meshkati and Khashe
(2015, p. 90) highlight that “Without understanding the vital role of human and
organizational factors” in an unexpected event, “recovery will be a sweet dream and
resiliency will only be an unattainable mirage”. It was found that FO1, during this disruption,
showed an adequate level of top management support and provided its staff an appropriate
environment, such as empowerment, to make relevant, quick decisions.
In conclusion, the right organisational culture involves top management support and
empowerment, which leads to appropriate situational awareness and quick decision
making. Furthermore, a learning attitude is essential to achieve SC resilience by improving
organisational and SC operations both in the short- and long-run.
5. DCD Disruption – Conclusion
Overall, the analysis of this disruption presented various SC resilience elements that are
summarised in the following points:
A Crisis Management Team
Risk management
Collaboration
Crisis communication
Situational awareness and quick decision making
Product traceability and SC visibility
Operational/SC strategy (pre-existing)
Operational/SC re-engineering
Supportive organisational culture
Learning attitude
323
Appendix D. Detailed Case Description - Botulism Scare (D2)
Case Description
1. Background Information
The root cause of this incident originated from Fonterra, where numerous personnel took
some extraordinary steps between February 2012 and August 2013 that led to an industry-
wide disruption. The chain of events, highlighted in this section (background information),
are summarised from an inquiry report published after the disruption (DIA, 2014).
It all started at Fonterra’s Hautapu plant during the processing of whey protein concentrate,
also referred as “WPC80”. On 1 February 2012, during a usual inspection by one staff
member, a torch hit the edge of the pipe and the pieces of glass entered the pipe.
Immediately, the broken pieces were recovered by the staff and normal production
resumed. Later, on 2 February, it was established that one missing piece remained in the
pipe and that could lead to contamination. Therefore, the plant manager initiated a “critical
exception report” for further investigation. During one day’s production between 1 and 2
February 2012, a total of 42 tonnes of WPC80 was produced and affected by the incident.
The critical exception report required the company to involve an independent verifier and
auditor, AsureQuality, to investigate and recommend possible corrective actions.
After several discussions, on 11 April AsureQuality issued approval for rework on the
affected WPC80. The rework was initiated in May 2012 and, on 18 May, the rework was
completed. The final products were inspected by various quality tests. Until this point,
Fonterra believed that all necessary actions had been taken. However, the inquiry report
concluded that non-standard practices were used during the rework process (DIA, 2014).
Lastly, although the company communicated with AsureQuality regarding the rework
process, the documents and communications did not specify the details regarding the
rework.
From July 2012 to February 2013, all of the reworked WPC80 was shipped to various plants
and buyers including Fonterra’s plant in Darnum, Australia. In March 2013, the Darnum
plant processed nutritional powder for Danone, one major buyer, using the reworked
WPC80. Subsequently, the samples were tested for sulphite-reducing clostridia (SRC), as
required by Danone; this revealed the presence of high SCR suggesting a possible hygiene or
spoilage issue. Twelve batches revealed high or over-specification level SCR. Immediately,
the Darnum plant launched an investigation to determine the source of the issue in
consultation with the “food assurance team” at “Fonterra Research & Development Centre
(FRDC)”.
The investigation revealed the presence of Clostridium sporogenes, a naturally occurring
bacterium unable to produce a potential toxin. Danone was kept informed about the
324
investigation. On 7 May, Fonterra finally decided to downgrade all affected batches to stock
feed. However, the inquiry report (DIA, 2014) revealed that, at this point, confusion
remained between Fonterra and Danone. Danone believed that the action taken by
Fonterra meant all batches produced using the reworked WPC80 were downgraded.
However, Fonterra degraded only the 12 out-of-specification batches.
Despite the decision to downgrade, further investigations continued on the reworked
WPC80. On 20 May, FRDC considered a significantly low possibility of C. botulinum and
recommended a mouse bioassay involving AgResearch. However, the Darnum plant advised
that the affected batches had already been downgraded as stock feed.
In June 2013, another team, called the review team, initiated a review of the whole incident.
The team decided to examine in-depth the WPC80 contamination at Haitapu and the
actions taken by the Darnum plant in collaboration with FRDC. Along with other
developments, the team learned about the earlier communication by FRDC regarding the
possibility of C. botulinum. The team also learned about the use of the reworked WPC80 in
other plants such as at Waitoa, therefore, recommended further product testing. On 21
June, a manager authorised testing for any possible toxin, without realising that it could
mean authorisation for C. botulinum testing. Until this point, the inquiry report (DIA, 2014)
revealed that senior management at Fonterra was unaware of the development, similarly
MPI and AsureQuality.
Later, on 20 July 2013, the review team manager learned about the C. botulinum testing and
informed his/her manager. Consequently, another “critical event” team was formed by
NZMP22. In line with earlier developments, the team endorsed the decision for C. botulinum
test. In parallel, the team initiated a trace of the reworked WPC80 and its use in various
plants.
1.1. Countdown to Disruption
Further investigation was performed between 29 and 31 July 2013; it revealed a positive
indication for C. botulinum. AgResearch notified FRDC regarding the results that day and,
subsequently, senior executives at NZMP were notified, which led to the formation of a
“Crisis Management Team”. The team organised an immediate meeting on 31 July and 1
August to determine the scale of the problem and decided to communicate the problem to
affected buyers and to MPI.
At this point, all senior management, such as the CEO, were involved with the crisis
management team and the team also informed Darnum plant to trace all the output
produced from the reworked WPC80. Here, it is important to highlight that AgResearch
communicated only with FRDC about “Likely … C. botulinum …. Although we cannot rule out
22 NZMP is Fonterra’s brand dealing exclusively in ingredients. The company delivers a wide range of generic ingredients across the world. (For more detail: https://www.nzmp.com/about-nzmp.html)
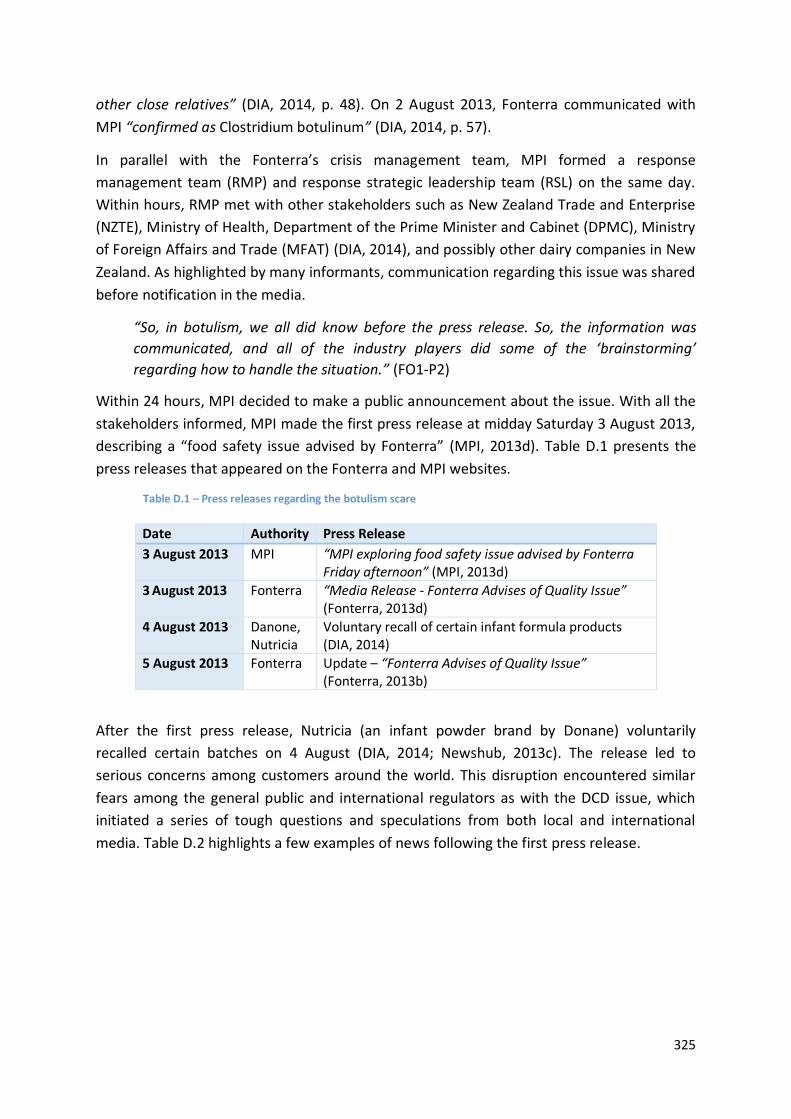
325
other close relatives” (DIA, 2014, p. 48). On 2 August 2013, Fonterra communicated with
MPI “confirmed as Clostridium botulinum” (DIA, 2014, p. 57).
In parallel with the Fonterra’s crisis management team, MPI formed a response
management team (RMP) and response strategic leadership team (RSL) on the same day.
Within hours, RMP met with other stakeholders such as New Zealand Trade and Enterprise
(NZTE), Ministry of Health, Department of the Prime Minister and Cabinet (DPMC), Ministry
of Foreign Affairs and Trade (MFAT) (DIA, 2014), and possibly other dairy companies in New
Zealand. As highlighted by many informants, communication regarding this issue was shared
before notification in the media.
“So, in botulism, we all did know before the press release. So, the information was
communicated, and all of the industry players did some of the ‘brainstorming’
regarding how to handle the situation.” (FO1-P2)
Within 24 hours, MPI decided to make a public announcement about the issue. With all the
stakeholders informed, MPI made the first press release at midday Saturday 3 August 2013,
describing a “food safety issue advised by Fonterra” (MPI, 2013d). Table D.1 presents the
press releases that appeared on the Fonterra and MPI websites.
Table D.1 – Press releases regarding the botulism scare
Date Authority Press Release
3 August 2013 MPI “MPI exploring food safety issue advised by Fonterra Friday afternoon” (MPI, 2013d)
3 August 2013 Fonterra “Media Release - Fonterra Advises of Quality Issue” (Fonterra, 2013d)
4 August 2013 Danone, Nutricia
Voluntary recall of certain infant formula products (DIA, 2014)
5 August 2013 Fonterra Update – “Fonterra Advises of Quality Issue” (Fonterra, 2013b)
After the first press release, Nutricia (an infant powder brand by Donane) voluntarily
recalled certain batches on 4 August (DIA, 2014; Newshub, 2013c). The release led to
serious concerns among customers around the world. This disruption encountered similar
fears among the general public and international regulators as with the DCD issue, which
initiated a series of tough questions and speculations from both local and international
media. Table D.2 highlights a few examples of news following the first press release.

326
Table D.2 – News headlines regarding the botulism scare
Date Media Channel
Headlines
3 August 2013 Stuff.co.nz “Botulism alert: Nutricia Karicare risk” (Heather & Rutherford, 2013)
3 August 2013 Newshub “China issues Fonterra recall” (Newshub, 2013a)
4 August 2013 Financial Times (International)
“Fonterra dairy recall shakes China consumer confidence” (Rabinovitch & Hume, 2013)
4 August 2013 Bloomberg News (International)
“China Stops Importing New Zealand Milk Powder, Minister Says” (Bloomberg, 2013)
5 August 2013 ABC Australia “Fonterra dairy recall puts farmers into damage control” (Locke, 2013)
5 August 2013 Stuff.co.nz “When Fonterra bruises, the country bleeds” (Fox, 2013b)
5 August 2013 The Guardian (International)
“Fonterra admits baby formula milk contaminated with toxic bacteria” (Guardian, 2013a)
5 August 2013 RNZ “NZ's dairy reputation under threat” (RNZ, 2013)
6 August 2013 NZHerald “Worried parents take their babies to GPs” (Wade, 2013)
8 August 2013 The Guardian (International)
“New Zealand government battles Fonterra milk crisis” (Guardian, 2013b)
All of these headlines created panic not only for foreign regulators, but also the general
public became highly concerned about the unfolding issue. Though the issues were limited
to Fonterra, particularly to the individual batches produced with the affected WPC80
batches, a few of the international markets, such as China, perceived it as a New Zealand
wide issue concerning the whole dairy industry (Bloomberg, 2013).
1.2. Impact of the Botulism Issue (FO1’s SC)
Although the epicentre of this disruption was Fonterra, just like in an earthquake, ripple
effects flowed through other dairy companies, which produced an international trade
nightmare (DIA, 2014). For FO1, “It became a perception that there could be a problem with
all New Zealand dairy products, for which we had to do testing although it was not our
problem” (FO1-P2). Many of FO1’s buyers demanded testing for C. botulinum. Figure D.1
shows the impact of this disruption on FO1’s SC.
An interrupted flow of finished product – Like the DCD incident, the situation
interrupted the normal follow of the FO1’s dairy products, particularly for its
downstream SC.
Extra testing – Despite the fact that FO1 did not source any WPC80 from Fonterra,
the company had to engage in additional testing, which was an extra cost for FO1.
Secondly, as a non-standard test, the quality team had to decide on the exact
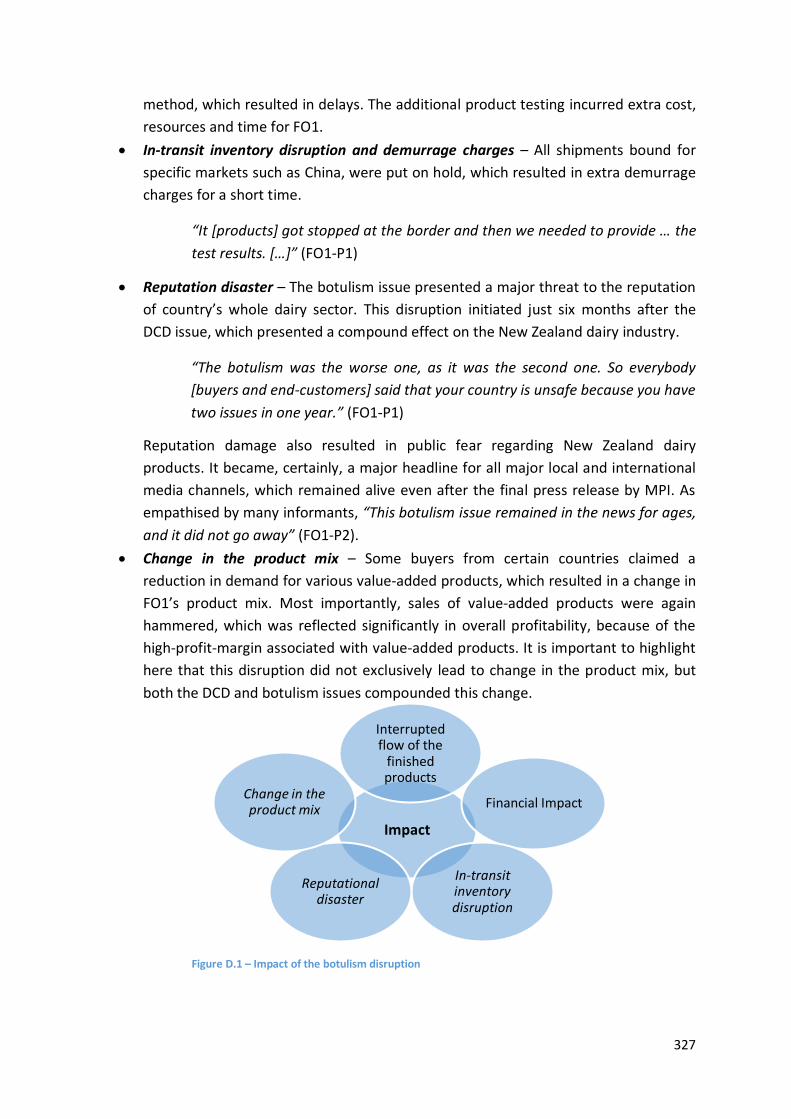
327
method, which resulted in delays. The additional product testing incurred extra cost,
resources and time for FO1.
In-transit inventory disruption and demurrage charges – All shipments bound for
specific markets such as China, were put on hold, which resulted in extra demurrage
charges for a short time.
“It [products] got stopped at the border and then we needed to provide … the
test results. […]” (FO1-P1)
Reputation disaster – The botulism issue presented a major threat to the reputation
of country’s whole dairy sector. This disruption initiated just six months after the
DCD issue, which presented a compound effect on the New Zealand dairy industry.
“The botulism was the worse one, as it was the second one. So everybody
[buyers and end-customers] said that your country is unsafe because you have
two issues in one year.” (FO1-P1)
Reputation damage also resulted in public fear regarding New Zealand dairy
products. It became, certainly, a major headline for all major local and international
media channels, which remained alive even after the final press release by MPI. As
empathised by many informants, “This botulism issue remained in the news for ages,
and it did not go away” (FO1-P2).
Change in the product mix – Some buyers from certain countries claimed a
reduction in demand for various value-added products, which resulted in a change in
FO1’s product mix. Most importantly, sales of value-added products were again
hammered, which was reflected significantly in overall profitability, because of the
high-profit-margin associated with value-added products. It is important to highlight
here that this disruption did not exclusively lead to change in the product mix, but
both the DCD and botulism issues compounded this change.
Figure D.1 – Impact of the botulism disruption
Impact
Interrupted flow of the
finished products
Financial Impact
In-transit inventory disruption
Reputational disaster
Change in the product mix
328
To resolve the issue, FO1, with its SC and dairy industry partners, initiated various response
actions and strategies, highlighted in the following section. As the focus of this research
mainly involves FO1’s perspective, therefore, first FO1’s response is discussed, followed by a
discussion of the industry response that includes few highlights of Fonterra’s response (as
learnt from DIA (2014)).
2. FO1’s Response
FO1 was informed before the first press release. However, the lead time between the initial
communication and the first press release on 3 August 2013 was small, which provided only
a few hours to FO1 and other dairy companies to engage in any preparatory measures.
Though the timeline was short, FO1 regarded this early communication as a productive
measure enabling the company to foresee possible impacts on its SC operations.
FO1’s top management anticipated the possible aggressive reaction from the international
markets, like what was seen in the DCD issue. Therefore, immediately after the initial
communication, FO1 formed its “crisis management team”, involving people from top
management and representation from all the relevant departments, which followed pre-
defined procedures. The crisis team played a pivotal role in decision-making,
communication and information sharing within the organisation and, more significantly,
with other key stakeholders.
Like the DCD issue, the nature of this incident demanded the involvement of some critical
functions, therefore, functional teams or sub-teams were formed and allocated specific
responsibilities. The departments involved in this disruption were Sales and Customer
Services, Quality and SC. Additionally, other personnel involved in operations such as
sampling, grading, product release and export documentation were intimately involved with
the Quality Team to deal with the operational aspect of this disruption.
From 2 August 2013, FO1 initiated various actions and strategies, which can be broadly
grouped into six tasks:
Task 1: Understanding the scale and impact of the issue
Task 2: Product traceability in FO1’s SC
Task 3: Development and execution of a testing regime
Task 4: Communication with the buyers
Task 5: Communication with the key stakeholders
Task 6: Development and execution of operational/SC adjustments
Task 1: Understanding the scale and impact of the issue – Unlike DCD issue, the botulism
issue was related to Fonterra, and the root cause was limited to the few batches produced
from the reworked WPC80. From FO1’s perspective, at first, it was hard to determine the
exact scale of impact on its SC operations. Once FO1 was informed regarding the possible

329
press release and the issue, the top management quickly set up the crisis management
team. As highlighted by the FO1 informants, this decision was based on two reasons:
Fonterra holds the dominant share of New Zealand’s dairy production, and it was
believed that international markets might consider Fonterra’s issue as whole New
Zealand issue.
Secondly, the DCD issue highlighted the interconnected New Zealand dairy industry,
in which one press release from MPI and Fonterra created an industry-wide issue.
Therefore, from the previous experience, FO1 quickly anticipated possible disruptions in its
downstream SC. The crisis management team immediately developed links with other
industry partners through DCANZ and MPI, to learn key insights and on-going developments
with the international regulators. A similar structure was applied as observed during the
DCD issue, in which FO1’s representative had daily meetings with industry partners to learn
and share experiences.
“So just before the announcement and then probably for the three weeks after, there
were daily conference calls. And then we had some face to face meeting talking about
like this is our latest bit of data, this is how we are going to announce it. And there was
quite a bit of debate on whether it is good or is it bad.” (FO1-P2)
It was quickly established from these meetings that specific markets such as China had
taken this issue as a New Zealand wide issue and that the few other Asian markets followed
the Chinese market’s response. As anticipated, immediately after the first press release,
various markets demanded quality assurance particularly against this issue from various
New Zealand dairy producers including FO1.
Task 2: Product traceability in FO1’s SC – To establish the list of products for testing, the
sales and customer representative team analysed which buyers and markets were
demanding product testing. This was established with the help of industry collaboration and
communication with buyers.
Based on this information, the sales and quality teams collaboratively worked on the list of
products destined for those buyers and countries. Like the DCD issue, this information was
readily available, “[FO1] have and had systems that maintain information, that provide
support not only within our organisation but also integrate the information with our key SC
partners” (FO1-P3). The potential samples were then prioritised based on their location in
the SC, e.g., product that was already at buyers’ warehouse or borders was ranked urgent
compared with product that was in-transit or FO1’s warehouse.
Task 3: Development and execution of the testing regime – Although information regarding
exact samples to test was quickly analysed, the main bottleneck was a decision regarding
the exact testing method to use. According to the quality manager (FO1-P1), testing for C.
botulinum is not an exact science and requires proxy or indicative testing to determine
330
whether the product is affected or not. Therefore, it took the quality team a few days to
decide on a particular type of test technique.
This decision initiated after the first press release, as before the first media communication
on 3 August, only the top management of the FO1 was informed. The quick decision on the
press release by MPI and Fonterra did not let FO1’s quality team prepare any response. As
emphasised by the quality manager, “No there was no communication or indication, not a
one. […] They [Fonterra] were doing all the work on the background, sorting out the testing,
and then we got informed about it” (FO1-P1). Consequently, the decision on the testing
regime followed various discussions within the organisation, and learning was shared
among the industry partners, MPI and with the FO1’s independent testing laboratory. Once
the testing regime was set up, it was then just a simple process of testing the samples by a
testing laboratory and communication with the sales and customer service teams for further
action.
Task 4: Communication with the buyers – Two issues within six months brought significant
pressure on the whole New Zealand dairy industry. Though this problem was related to
Fonterra, “botulism issue […] compounded the potential concerns and accelerated in-terms
of any product from New Zealand” (FO1-P3). Like the DCD issue, “[FO1] had an immediate
response on the same day [of press release] and that was very quickly followed up with a
testing regime and communication about when they [the buyers] would expect to receive the
status of the product and the test result” (FO1-P3). To establish such communication, FO1
formed a separate communication channel to receive and resolve the concerns of its various
international buyers.
Once the test reports were compiled, one-to-one communication was established by FO1
with its buyers. As highlighted by the quality manager, since it was not a standard test,
interpretation of the test results required high insight and understanding. To resolve this
concern, the quality and sales teams worked together with the buyers to educate and
explain the test results. Additionally, part of the response on the issue was centrally handled
by MPI and Fonterra.
Task 5: Communication with the key stakeholders – Various informants highlighted that the
New Zealand dairy industry had learnt from the previous DCD issue. Therefore, prior
communication was established with all stakeholders regarding the press release. During
this prior discussion, all industry members were involved. However, the central role was
played by MPI and Fonterra. The communication of Fonterra with MPI confirmed the
presence of C. botulinum in some of its products. Therefore, a product recall and press
release were considered immediate actions.
Right after the press release, central communication was handled by MPI to establish and
convey a comprehensive response with international regulators regarding the issue. The
involvement of all dairy producers became prominent at this stage. Like the DCD issue, FO1
was involved in daily meetings at industry level to gather information and to discuss insights

331
regarding the responses from various international markets. During these discussions, FO1
learnt from other dairy producers regarding their experiences with international buyers and
regulators, which helped FO1 to modify its response.
The key insights from the industry were regularly shared within FO1 and functional teams,
during the daily meetings of the FO1’s crisis management team. This communication
enabled each function or team to tailor its response according to changing requirements.
Task 6: Development and execution of operational/SC adjustments – Based on responses
from international markets, various operational adjustments were adopted to deal with the
issue. For example, development of the testing regime led to changes in various other
operations and departments. As highlighted by the quality manager (FO1-P1), these changes
affected the sampling, grading, and product release and export teams in their operational
activities. Therefore, all teams were involved, communicated and trained in all the
necessary changes in their operational requirements.
It is also important to appreciate that during the botulism case, FO1’s products were halted
at borders or customs and further tests were demanded. Subsequently, FO1 was able to
provide all the necessary test documents and all products smoothly went through FO1’s SC.
Therefore, unlike DCD disruption, FO1 did not require rerouting of shipments to other
markets.
Both disruptions, DCD and botulism, led to long-term changes such as, for a period, orders
of value-added products were cancelled. Although, the overall sales were not affected, the
value-added products have higher profitability than generic products which were indirect
impacts of this disruption. Apart from this, FO1 also recognised its vulnerabilities associated
with serving one major market, which led to FO1’s long-term decision to spread its market
share to multiple markets and buyers. Other operational changes included strengthening
the traceability systems, mock exercises of a product recall and strengthening relationships
within the dairy industry through DCANZ.
For FO1, the impact of disruption started to dilute once MPI and Fonterra made to the final
press release and declared the whole incident as a “False Alarm” on 31 August 2013.
3. Industry Response
The initial industry response started once Fonterra communicated the news of C. botulinum
in certain batches to MPI. Subsequently, MPI and Fonterra advised the product recall news
in the media, which was followed by the recall press release by Nutricia. Before the press
release, all the decisions taken were considered necessary by all stakeholders, such as
Fonterra and MPI. However, the enquiry report (DIA, 2014) reflected various shortcomings
on the decisions made preceding the first press release (3 August 2013). For example, the
laboratory test report indicated “likely to be C. botulinum”, which Fonterra communicated
to MPI as “confirmed C. botulinum” (DIA, 2014). According to FO1’s quality manager, this led

332
to confusion, and “when they [Fonterra] advised MPI, they [MPI] were blinded by the
information, and they had to act fast as they [MPI] thought it was a real food safety issue. So
they [MPI] had no choice but to recall the products” (FO1-P1). Likewise, other
communication gaps were noted in the enquiry report.
On 3 August 2013, Fonterra and MPI issued a press release on the quality issue and
subsequently recalled certain batches. The press release by MPI presented only brief
content explaining Fonterra’s food safety issue which indicated that “a range of products
including infant formula, grown-up milk powder and sports drinks [...] appear to contain C.
botulinum”. This press release was followed by other communications such as the ‘Director-
General’s statement’ on 3 August, which highlighted certain batches of affected products.
This press release also contained statements such as “as best it could tell” that none of the
affected batches was on sale in New Zealand, “but it was seeking to verify that” (DIA, 2014).
In parallel, Fonterra launched its product tracking system. However, the information relating
to the potentially affected batches was significantly changed over time, and the whole task
became complex. For example, on 2 August, Nutricia (Danone) was informed that 590.5
tonnes of production were affected, which was increased to 1,631 tonnes three days later
and finally on 18 August the figure jumped to 1,759 tonnes (DIA, 2014).
Between 3 and 6 August, multiple media communications, including Director-General
statements, were released. In parallel, Nutricia also issued a press release on a voluntary
recall. These media communications presented varying information regarding the
potentially affected batches. To avoid further conflicting information, from 7 August, MPI,
Fonterra and Nutricia worked together to trace and verify information regarding affected
product. On 12 August, this led to a detailed media communication by MPI in the fourth
Director-General statement and by Nutricia on its product recall press release. The
statement by MPI highlighted the detailed documentation and procedures followed to
establish the facts (DIA, 2014).
Apart from these efforts, MPI also decided to make further investigations on the preliminary
test performed by AgResearch. MPI obtained the preliminary test reports on 4 August,
almost two days after the first press release (DIA, 2014). Within a week, MPI sent samples to
a laboratory in the U.S. for further testing. MPI received initial results from both
laboratories, a negative result for C. botulinum. As the results were preliminary, MPI waited
for confirmatory results. Once the confirmed results were received, MPI produced the final
press release on 28 August and declared the whole incident a false-positive. Table D.3
presents the press releases by MPI after 28 August 2013. Table D.3 – Follow-up press releases by MPI
Date Authority Press Release
28 August 2013 MPI “Negative WPC tests confirm no risk to public” (MPI, 2013e)
29 August 2013 MPI “No food safety risk from Karicare products” (MPI, 2013g)
31 August 2013 MPI “Ministry for Primary Industries releases WPC full diagnostic report” (MPI, 2013c)
333
After the final press release, the issue diluted in the media. However, this issue imposed a
significant impact, more significant than DCD issue for the New Zealand dairy sector.
Inevitably, the most affected player was Fonterra, but all informants’ associated botulism as
a big “game-changer” for the New Zealand dairy industry that led to significant changes in
the industry. The following points highlight the major offsets after this issue:
A government committee of inquiry was established to review the incident. Based on
the investigation, numerous recommendations were made that enabled
improvement in practices and systems by the parties involved in this incident (DIA,
2014). Apart from the concerned players, FO1 performed a gap analysis on their
operations and subsequently strengthened its operations.
Primary causes that led to this disruption were general risk practices and the risk
culture, for which the report recommended various actions.
The dairy industry established a working group to recommend ‘best practice’ to
enhance product traceability for the dairy industry. This working group involved
representation from various dairy industry players, including FO1. The group called
“Dairy Traceability Working Group” worked to propose various best practices and
finally published a report called the “New Zealand Dairy Industry Best-Practice Guide
to Proposed Regulatory Requirements for Traceability”.
Many informants reported tightening regulations from both the national regulator,
MPI, and international regulators. Many of these regulations increased expectations
of quality and traceability standards, particularly for sensitive products.
Based on the actions of the various stakeholders to deal with this disruption, the next
section analyses the key findings on SC resilience.
4. Analysis of the Botulism Disruption
In this disruption, the data collected from all stakeholders such as FO1 and other
stakeholders (SC partners and competitors) were analysed, and coupled with secondary
data such as news archives, website data and the independent inquiry report (DIA, 2014).
The analysis revealed various strategies and actions by FO1 and other key stakeholders to
deal with the aftermath of this disruption. All these actions were analysed and grouped into
the various elements of SC resilience.
Here, it is essential to appreciate that analysis of this disruption was conducted separately
from the previous disruption. However, to avoid redundancy in listing the elements that
appear similar to D1, they are discussed in conjunction with the previous disruption. For
example, the formation of a crisis management team followed like the approach in the
previous discussion (Appendix C), since FO1 had a similar process. To avoid repetition,
references are drawn from the previous disruption (D1).

334
4.1. Crisis Management Team
To effectively manage the disruption, once the issue was communicated to FO1, the top
management quickly convened the crisis management team, which followed a pre-defined
procedure and communication. Like the DCD issue, the team had the same characteristics
such as being cross-functional and involved in similar activities, such as situational
awareness, collaboration and decision making.
“Right after that [the first press release], we worked in teams like sales, quality and
various other teams.” (FO1-P1)
“We have a crisis management and risk management plan that gives us general
guidelines to handle these kinds of incidents.” (FO1-P5)
Like FO1’s crisis management team, MPI and Fonterra also formed crisis management teams
within their organisations (DIA, 2014). The crisis management team was a critical feature in
dealing with this disruption, because it was a guiding hub for the organisation, the SC and at
the industry level. For example, in FO1, “all of that [industry insides] was communicated
through the top management [the crisis management team] and then we regularly had
meetings with the top management, from where we were getting the information and then
deciding about what we needed to do” (FO1-P1). During this disruption, FO1’s crisis
management team gathered, analysed and disseminated critical information and resources
to various stakeholders.
Here, it can be inferred that effective management of a disruption involves the formation of
a crisis management team, which features cross-functional representation and leads to a
centralised, coherent response.
4.2. Collaboration
Analysis showed that collaboration among dairy players, including FO1, enabled synergies.
During this disruption, collaborative activities involved sharing critical information and joint
problem-solving. The collaboration was noted as essential in effectively dealing with the
challenges during this disruption.
As highlighted above, before the first press release, FO1 and other dairy players were
informed regarding a potential industry-wide impact, which “gave [FO1] a little bit of time to
prepare for the issue” (FO1-P3). The early communication (information sharing) enabled FO1
to plan a communication strategy for its buyers. FO1 and other dairy participants positively
regarded this pre-disruption collaboration and mentioned that “after DCD the [dairy]
industry came more closer”, which enabled such collaboration.
After the first press release, FO1 and other dairy players attributed collaboration at the
industry level as productive in dealing with the issue. During this disruption, MPI led the
industry level response and had a better understanding of the issue with regard to how it
335
could impact other industry players, which led to pre- and post-disruption collaboration
with all dairy players. All developments with international regulators and critical updates
were regularly communicated to the dairy producers, including FO1. This information
sharing among dairy competitors (at DCANZ level) enabled FO1 to learn from other
experiences, e.g., one interviewee highlighted that FO1 learnt from other dairy producers
regarding challenges in specific markets because of this issue, which enabled the company
to tailor its response accordingly for those markets.
“While talking to some of our other colleagues in the industry [we got these insights],
there were some [FO1’s competitors], other than Fonterra that did have products
that were stopped at the border” (FO1-P4)
The enquiry report (DIA, 2014) emphasised the importance of cross-organisational
collaboration in the preparation and execution of the disruption response. For example,
multiple contradictory media press releases (from 3 to 6 August) by MPI and Danone
(Fonterra’s main buyer affected by this incident) led to confusion among the stakeholders.
To resolve this issue, all key stakeholders such as Fonterra, MPI, Danone and AsureQuality
collaboratively worked to develop a synchronised response, which later led to better
management of the disruption (DIA, 2014).
From the above discussion, it can be concluded that:
Previous experience with DCD issue, better network/SC understanding by MPI and
an active industry consortium (DCNAZ) were the key drivers to initiate both pre- and
post-disruption collaboration.
The industry-wide collaboration featured information or knowledge sharing between
competitors, centralised communication by MPI, joint problem solving and
synchronised decision making, which led to a fast efficient response. Previous
authors (Ergun et al., 2010; Jüttner & Maklan, 2011; Pettit et al., 2010; Scholten &
Schilder, 2015) attributed such collaboration as a key feature to enhance SC
resilience.
Lastly, the previous researchers in the field stressed more focus on collaboration
among immediate SC partners (such as buyers and suppliers), however, this
disruption emphasised high-level collaboration among broader industry level
partners (such as MPI and dairy competitors). Here it can be inferred that
collaboration during a disruption depends on the context (post-disruption) and
network/SC understanding, which could mean collaborating with new network
partners.
4.3. Crisis Communication
Like the discussion regarding crisis communication in Appendix C, analysis of this disruption
is divided into two clusters:
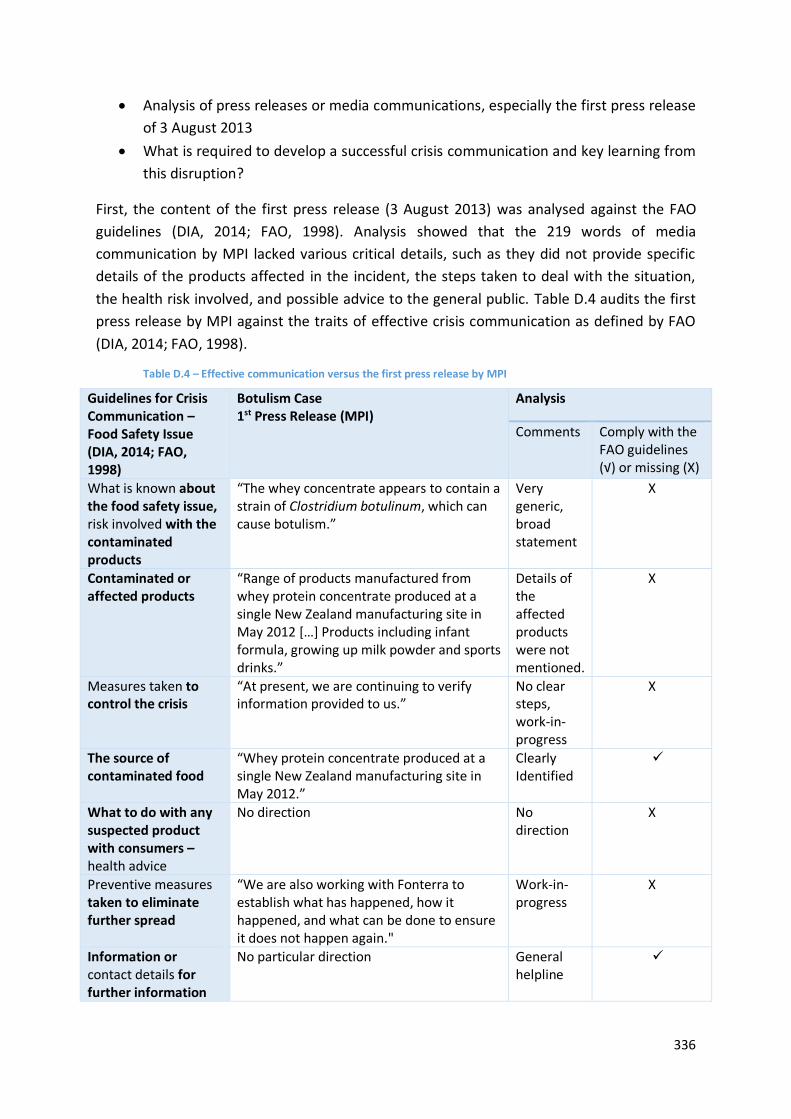
336
Analysis of press releases or media communications, especially the first press release
of 3 August 2013
What is required to develop a successful crisis communication and key learning from
this disruption?
First, the content of the first press release (3 August 2013) was analysed against the FAO
guidelines (DIA, 2014; FAO, 1998). Analysis showed that the 219 words of media
communication by MPI lacked various critical details, such as they did not provide specific
details of the products affected in the incident, the steps taken to deal with the situation,
the health risk involved, and possible advice to the general public. Table D.4 audits the first
press release by MPI against the traits of effective crisis communication as defined by FAO
(DIA, 2014; FAO, 1998).
Table D.4 – Effective communication versus the first press release by MPI
Guidelines for Crisis Communication – Food Safety Issue (DIA, 2014; FAO, 1998)
Botulism Case 1st Press Release (MPI)
Analysis
Comments Comply with the FAO guidelines (√) or missing (X)
What is known about the food safety issue, risk involved with the contaminated products
“The whey concentrate appears to contain a strain of Clostridium botulinum, which can cause botulism.”
Very generic, broad statement
X
Contaminated or affected products
“Range of products manufactured from whey protein concentrate produced at a single New Zealand manufacturing site in May 2012 […] Products including infant formula, growing up milk powder and sports drinks.”
Details of the affected products were not mentioned.
X
Measures taken to control the crisis
“At present, we are continuing to verify information provided to us.”
No clear steps, work-in-progress
X
The source of contaminated food
“Whey protein concentrate produced at a single New Zealand manufacturing site in May 2012.”
Clearly Identified
What to do with any suspected product with consumers – health advice
No direction No direction
X
Preventive measures taken to eliminate further spread
“We are also working with Fonterra to establish what has happened, how it happened, and what can be done to ensure it does not happen again."
Work-in-progress
X
Information or contact details for further information
No particular direction General helpline

337
The above comparison highlights that much critical, concrete information regarding the
issue was missing in the first press release. This lack then triggered a plethora of questions
and confusion from both local and international media, as indicated in the news reports
(Bloomberg, 2013; Fox, 2013b; Guardian, 2013a; Locke, 2013; Newshub, 2013a). Similarly,
many informants argued that the first press release led to a “PR Disaster”, and vague
information was mainly noted as the key culprit.
“Then the crazy thing was when they did choose to announce, after all that time they
still did not have the data that how much product was affected, where it go and has
it been used or not.” (FO1-P2)
It can be argued here that effective crisis media communication should include all necessary
information, such as affected products or batches, health risks and steps taken to avoid any
confusion among the general public. Major questions here are what leads to developing
better crisis communication, and what can be learnt from this disruption?
First, as highlighted by the inquiry report (DIA, 2014), a proper risk assessment and decision-
making process, based on scientific evidence, should have been adopted by MPI and
Fonterra before the first press release. For example, the first laboratory report of the C.
botulinum test stated it as “likely to be C. botulinum”, and “other close relatives cannot be
ruled out”. Furthermore, the test was done only for the research purposes (DIA, 2014).
However, without any second opinion or detailed testing, Fonterra considered it a positive
indication and informed MPI about the test as “confirmed C. botulinum”. It can be argued
that Fonterra should have analysed the issue in more detail by considering the limitations of
the test results. Secondly, once the news was communicated to MPI, it could be argued that
it also should have looked the issue in more detail by studying the laboratory results and by
getting the second opinion. It can be concluded that a detailed risk assessment and a proper
decision-making process should have brought in more detail regarding the issue.
Secondly, had this been a real food safety issue, crisis communication was inevitable. The
information missing from the first press release and conflicting information in the following
press releases, was caused by the unavailability of the affected products and batches.
During the early days of the disruption, Fonterra was unable to locate exact information
regarding the affected batches produced from the reworked WPC80. This lack was
associated with the traceability operations of Fonterra. Quickly available information
regarding affected products should have provided MPI, Fonterra and Danone with a clearer
picture of what was needed for effective media communication. Further analysis of the
product traceability system is presented in Section 4.5.
In conclusion, having a scientific decision-making process and proper risk assessment (part
of situational awareness) lead to a better understanding of the issue, which enables
stakeholders involved to better prepare and present appropriate crisis communications. A
proper crisis communication should have the following characteristics (as highlighted by
FAO (DIA, 2014; FAO, 1998)):

338
Knowledge of the problem
Health risks involved
Contaminated or affected products
Preventive measures taken to control to issue
Source of the contamination
Health advice for the public
Contact details for further information
4.4. Situational Awareness and Quick Decision Making
Both the botulism and DCD issues present almost the same challenges for the New Zealand
dairy industry. For example, there was a lot of uncertainty regarding reaction from
international markets or countries, because, in both cases, various international market
took it as New Zealand wide issue. Therefore, situational awareness was a fundamental
element in understanding the post-disruption environment. Like the discussion in Appendix
C, many characteristics of situational awareness are alike. For example, various teams at
different levels, including functional teams (within FO1), FO1’s crisis management team and
the industry level team (DCANZ), were involved in gathering, analysing and disseminating
relevant information during this disruption.
Secondly, the process of situational awareness was similar, where FO1 first engaged in
gathering information from relevant stakeholders (such as other dairy players and MPI), and
then was involved in comprehension and projection of the information by incorporating
scenario planning.
“When it came out, I remember it was on the weekend. […] Then we just started to
prepare ourselves because we knew that the markets like China and also some other
Asian markets would likely to react quickly. So from that weekend, then straight on
the Monday, we were looking at what products we are about to ship, or what
products are actually about to get to the markets or likely to get to the borders. We
were assessing this information, as we have retention samples, we can start testing
those” (FO1-P1)
Apart from FO1’s situational awareness, data analysis of this disruption presents distinct
findings regarding the decision-making by other relevant stakeholders. The following
discussion presents critical elements that influence decision-making in a highly uncertain
environment and recommends how an organisation improve its decision-making during
such uncertain situations.
The inquiry report (DIA, 2014) analysed and suggested various operational improvements
that would have led Fonterra to manage the issue better. For example, the report
highlighted various instances where Fonterra's staff did not follow standard procedures

339
either for rework processes or communication protocols. In other words, they made
decisions that were contrary to what was in the procedures or guidelines. Therefore, in
various instances, the chances of early detection and dealing with the problem were
inevitably lost. One apparent reason highlighted by the inquiry report concerned Fonterra's
organisational culture, or more precisely, the embeddedness of pre-defined standards and
procedure in staff behaviour. It can be inferred that having pre-defined processes or best
practices is one thing, but the primary aspect is its application or embeddedness in the
culture or the staff behaviour.
Further root cause analysis highlights a key question: Why do people not follow pre-set
procedures to make decisions during an uncertain event? It was noted that organisations
need to analyse pre-defined procedures or decision criteria to understand their applicability.
For example, are these decision criteria easy to comprehend and follow, especially during an
uncertain situation? This learning is based on examples from other uncertain scenarios. For
example, the aviation industry has seen many cases of air crashes where the root cause of
the accident relates to pilots not following pre-defined procedures in the event of an
emergency (Wiegmann & Shappell, 2003), which results in poor decision-making. In multiple
cases, the air crash investigations revealed that the primary cause relates to the complexity
of documentation or procedures rather than pilot error. Based on this learning the aviation
industry has improved quick reference guides for pilots, which are easy to follow with clear
steps to be taken in an emergency. This analogy can be applied to other situations where
people do not follow the procedures in a complicated situation. Therefore, a possible
explanation for staff members not following pre-defined procedures could be related to
complicated procedures or key decision criteria.
The second aspect is understanding human behaviour, since it is well-known that humans
make mistakes. Therefore systems should be designed to ensure that errors are identified
early in the process. For example23, in the aviation industry, a pilot during a flight is required
to communicate all procedural decisions to the fellow pilot so that both pilots make
informed decisions and, secondly, the actions are judged by a second person. This process
could be seen as a way to reduce human errors or, in operations management, it is mistake
proofing (Stewart & Grout, 2001). From Fonterra’s case, chances of early detection of the
problem were missed in several instances, which led to a complicated issue. Therefore, it
can be concluded that it is necessary to understand the human factor in a complex
environment and decision-making, which can lead to pre-defined procedures or decision-
making processes that can avoid human error.
Lastly, the inquiry report (DIA, 2014) highlighted that role ambiguity was another culprit in
poor decision-making. It was found that pre-defined roles and staff knowledge about their
roles and responsibilities, which can be enhanced through simulation exercises and staff
training, are essential contributors to effective decision making.
23 The examples and learning from the aviation industry are from Wiegmann and Shappell (2003).

340
4.5. Product Traceability
An important operational aspect of this disruption was related to product traceability. This
was critical for Fonterra, because it was Fonterra’s product. However, for other dairy
companies, including FO1, product traceability became essential in responding to this
disruption, because it became a perception that it was an industry-wide issue. Therefore,
FO1, in the end, was required to conduct extra testing, for which the company needed to
trace the finished products in its SC.
“It became a perception that there could be a problem with all New Zealand dairy
products, for which we had to do testing although it was not our problem.” (FO1-P2)
In this section, first Fonterra’s response regarding product traceability is discussed, followed
by FO1’s response. Finally, the essential elements that enable product traceability smoothly
are highlighted based on the findings from this disruption.
It was observed that Fonterra found it difficult to trace the affected products in its SC,
especially during the initial stages of the issue. As highlighted by the inquiry report (DIA,
2014), multiple revisions were made between 2 and 27 August regarding the exact amount
of product affected by this issue. This ultimately compromised the crisis communication, as
highlighted in the above section. Fonterra’s inability to trace products can be attributed to
the following reasons:
During the time of this issue, Fonterra’s plants associated with the disruption were
changing their systems from manual to fully computerised SAP systems (DIA, 2014).
As highlighted in the report (DIA, 2014), for Fonterra the switchover time was when
the company was processing orders of dairy products affected by the reworked
WPC80.
More importantly, during an IT switchover, staff members usually need to
understand how these changes affect their day-to-day operations. However, during
Fonterra’s switchover (DIA, 2014), staff inability to input correct details into the new
system led to misrepresentation of product details. It can be inferred that proper
training for the IT changeover would have helped the staff concerned to input the
required, accurate information into the system.
Based on this discussion, one can only conclude that the system switchover played a
critical part in Fonterra’s inability to quickly and accurately trace the affected
product in its SC. Had this incident happened during the previous system or after full
implementation of the new system, Fonterra’s ability to track the required product
information would have been different and possibly better. The literature on IT
system switchovers presents similar operational and SC challenges. For example, the
Nike IT implementation (1999-2001) and the Levi Strauss IT revamp (2003-2008)
highlight that the switchover period is the most critical point during such IT
implementation (Flyvbjerg & Budzier, 2011; Wilson, 2001).

341
On the other hand, FO1 was also required to track its finished products in its downstream
SC, especially products destined to specific markets such as China. The company also
needed information regarding all inputs or raw materials used during production. This
information was critical to show the customers that none of its raw materials related to
Fonterra’s affected WPC80. FO1 was able to quickly track the required product information
in its SC, which many informants associated with reliable systems and procedures
implemented before this incident.
“For us, it was quite easy to get that information as we have all the information in
our systems to track down that and then essentially have samples of all of these
products here.” (FO1’s quality manager – FO1-P1)
Additionally, it was found that FO1’s regular staff training and simulation (mock) exercises of
product recall played a definite role in embedding the practices in the organisation. These
training sessions would have led staff to understand their roles and responsibilities during a
highly complex and uncertain situation, such as a product recall.
Finally, it can be inferred that quick product traceability during a disruption encompasses
the following attributes:
Pre-defined procedures and robust IT systems
Staff training and institutionalisation of the practices
4.6. Operational/SC Re-Engineering
Like the DCD issue, various operational changes were incorporated by FO1 and other
stakeholders to deal with the issue both in the short- and long-run. For example, the quality
department was required to develop and execute a testing regime for C. botulinum. As a
non-standard test, FO1 had to work with other stakeholders to determine the exact nature
of a testing regime.
It is important to mention that analysis of this disruption brought mostly similar sub-
elements of operational/SC re-engineering as discussed in the DCD case. The following
discussion provides the distinct findings from this disruption.
First, for FO1, the compound impact of DCD and botulism resulted in a long-term shift in its
buyers’ base and product mix. FO1’s diversity in its product mix enabled it to adjust its
product mix strategy as per the changing requirements of customers, since, for a time,
orders for certain products were cancelled (this was a compound impact of both the DCD
and botulism issues).
Secondly, during this disruption, it was noted that FO1 prioritised its recovery operations.
For example, the major bottleneck identified during this disruption was product testing.
Therefore, to develop a quick response and recovery, FO1 expedited product testing, in
which the company determined a list of products that required urgent testing. FO1’s quick
342
situational awareness regarding this enabled it to prioritise response and recovery efforts,
which significantly reduced the total time of recovery. It can be inferred that a disruption
can present various bottlenecks, an organisation that learns quickly about these
bottlenecks, and adjusts accordingly, expedites or prioritises the processes that can achieve
a fast recovery.
Furthermore, it was noted that implementation of such operational adjustments during a
disruption reflects changes in various day-to-day operations. FO1 managed this by first
understanding the impact of the changes on various functions or operations, such as
grading, sampling and exporting. This enabled collaboration and training of the teams or
operators concerned.
From the above discussion, the following key learnings can be inferred:
A disruption can result in various bottlenecks; an organisation that learns quickly and
then adjusts, expedites or prioritises the processes or requirements can achieve a
fast recovery.
Understanding the critical nodes or functions and training staff or operators is key to
executing response and recovery activities.
4.7. Supportive Organisation Culture
Like the DCD issue, the supportive culture of FO1 during this disruption enabled appropriate
situational awareness, collaboration with key stakeholders and operational/SC re-
engineering. On the other hand, the inquiry report (DIA, 2014) highlighted several
reservations over the risk culture of Fonterra and particularly criticised the escalated
process that lacked quick communication of the issue from the staff member concerned to
managers or top management.
Again like the DCD issue, analysis of this disruption highlighted that FO1 had the right
cultural support involving top management support and empowerment to the sub-teams to
make quick decisions. This also led to effective situational awareness and collaboration
within the organisation and with other stakeholders. It was noted from the interview data
and observation during the interviews that:
The FO1’s HR department regularly engages in the training exercises to develop an
effective leadership and team-oriented culture. These training sessions involved
people from lower staff to top management.
Specific policies and facilities for managerial and production staff highlighted the
intent of the top management to develop cohesive culture from top to bottom.
Lastly, it was learnt that supportive culture is a product of long-term intent of FO1’s
top management. Various activities, such as team building exercises, showed FO1’s
determination to cultivate supportive culture, both prior and after this disruption.
343
5. Botulism Disruption – Conclusion
Overall, this issue was a more significant impact than the DCD issue, to the whole New
Zealand dairy sector. Inevitability, the most affected player was Fonterra, but all informants
associated botulism as a big “game-changer” for the New Zealand dairy industry. It led to
many changes in the industry both short- and long-term. It can be concluded that FO1’s
actions enabled it to quickly and efficiently deal with this issue.
Overall, analysis of this disruption presented various SC resilience elements:
A crisis management team
Risk management
Collaboration
Crisis communication
Situational awareness and quick decision making
Product traceability
Operational/SC strategy (pre-existing)
Operational/SC re-engineering
Supportive organisational culture
Learning attitude

344
Appendix E. Detailed Case Description - Lactose Supply Issue
(D3)
Case Description
1. Background Information
Among many dairy ingredients, lactose is the main dairy ingredient used to standardise raw
milk. The application of lactose into dairy production varies the level of protein as it varies
seasonally. For example, in New Zealand “Every year March and April [are the months],
when the protein levels are at the low level, [and that is] when [we] need to add more
lactose to standardise” (FO1-P6).
FO1 uses a multiple-sourcing strategy for procuring lactose and holds buffer stock to cover
lead-time and to protect against unforeseen events; it is the same for other ingredients. In
2014, before this disruption, the company had rationalised its inventory policy by reducing
the holding inventory of lactose from 6 to 4 weeks. The decision was made solely to reduce
the capital invested.
Before this issue, the company had two primary sources of lactose from the US, with some
backup from European suppliers. “At that time, [FO1] was buying around 80 percent from
the US and only about 20 percent from Europe […] We have more than two approved
suppliers, but for the simplicity in the plant we decided that we will focus on two really good
suppliers for lactose as their supplies run really well in the plant and we had a small 3rd
supplier from Europe which was just filling the gaps” (FO1-P6).
Until 2014, the company had not faced any issue in sourcing from its US suppliers. However,
in early 2014, during regular risk analysis, the procurement team identified the risk of
procuring the majority of lactose supply from one country. To mitigate this risk, the team
decided to diversify the risk by exploring more sources from Europe. The team started a
supplier selection process to mitigate this risk.
The process of identifying new sources was started in 2014, possibly mid-year. The selection
process was in progress when, in late November, FO1 began observing delays in the US
sourced lactose.
1.1. Countdown to Disruption
The first sign of a possible disruption came in late November and December 2014, when the
procurement team started to observe delays in lactose shipments. These delays were the
result of on-going negotiation of a new contract for port workers at the US West Port, which
started in mid-May 2014. In early December, the negotiations started affecting port
operations, which, for FO1, ultimately started affecting lactose shipments coming from the

345
US. Before Christmas, the delays were only up to 2 weeks. Therefore, the procurement team
was not too concerned as the buffer stock, up to four weeks, was able to cover such short-
term delays. Until this point, “all the information that we [FO1] were getting [from US
suppliers and the shipping company] was just indicating that it just a matter of few days that
the dispute would be settled” (FO1-P6).
After Christmas, the situation at the US West Port eventually got worse. The procurement
team started to see delays of 3 to 4 weeks and, subsequently, gap analysis showed a likely
stock-out in the case of persistent delays. The shortage got worse in mid-January and
February 2015, when the delays stretched to 5 to 6 weeks. This led the procurement team
to analyse and look for alternatives, since gap analysis highlighted possibility of being out of
lactose.
By mid-February 2015, the US port operations were temporarily shut down for a couple of
days and all inbound and outbound shipments were halted at the port, which confirmed
FO1’s fear of a lactose ‘stock-out’. From a SC disruption viewpoint, mid-February 2015 was
taken as the reference point for this disruption.
1.2. Overall Impact
A port disruption could become a significant SC disruption if not handled properly. For
example, a similar port shutdown of the US West Coast port in 2002 resulted in an economic
loss of around US$ 1 billion per day of the lockout (Badkar, 2012). These kinds of strikes can
become a major SC disruption for companies, if not handled properly (Loh & Van THAI,
2015). However, as reported by FO1, the company dealt with this disruption successfully,
where success was measured as no impact on the production schedule.
“[FO1] came very close to running out [of lactose] but we [FO1] never did, so it did not
affect production at all. […] We came very close, but we avoided the crisis” (FO1-P6).
Though no impact on production was reported, this situation did result in various
operational challenges.
Expedition of processes – The Company has a usual quality control process to check
every incoming raw material against the specifications that normally takes several
days. However, in this case, FO1 expedited this process as for a short time during this
issue; lactose supply almost became ‘Just-in-Time’. The quality team had to use more
than usual resources to inspect the raw material as soon as possible.
“Just meant that we had to get our quality teams to put urgency on releasing
products.” (FO1-P6).
Warehouse space congestion – The major operational challenges occurred when all
the delayed shipments came at once after the US port became operational after the
strike. Notably, this was in addition to extra stock that was purchased from the local
sources to avoid a possible stock out. To resolve the enormous incoming inventory,

346
the procurement and warehousing teams had to make few operational changes and
allocate extra resources.
As reported by FO1, this disruption did not impact FO1, therefore, this disruption was
studied to understand the various strategies opted to avoid disruption. The following
section highlights FO1’s response to this disruption.
2. FO1’s Response
FO1’s response is grouped into three tasks, based on the issue’s timeline:
FO1’s response before the US port lockdown
FO1’s response after the US port lockdown
FO1’s response once the US port became fully-functional
FO1’s response before the US port lockdown – The first sign of trouble came in December
2014, when the procurement team observed delays in incoming shipments of 1 to 2 weeks.
As FO1 was running on 4 weeks of buffer stock, it was determined that these short delays
would not affect overall stock levels.
After the Christmas break, the procurement team started seeing further delays in shipments
and gap analysis showed that they could become worse. Seeing the major operational issue,
the team quickly analysed three options:
The current status of buffer stock, as the delays started in December 2014 which
meant some of the buffer stock had already been used in production.
The number of shipments in-transit and the number of shipments blocked at the US
port.
The impact of up to 6 weeks of delays on the remaining stock level and,
consequently, the possible number of days without the lactose.
All of this mapping and gap analysis was done on a draft Excel spreadsheet, to decide on the
possible days without lactose. For the first time, the procurement team recognised the
potential impact on production schedules. Immediately, the procurement manager notified
the senior management regarding the possible stock out and also worked on possible
solutions.
Immediately after realising the potential impact, the procurement manager, with his/her
previous dealings, was able to approach a competitor and was able to secure a certain
amount of lactose to get through a possible shortage.
“We caught on this very early in the process. […] So I had links within [one of our
competitors] from previous dealing with them. […] I heard from one of the US
producers that actually [our competitor] had quite a bit of stock sitting in their

347
warehouse. [..] So I got, and I believed to be the first with them to secure the volume.”
(FO1-P6)
FO1 managed to borrow a certain amount of lactose, with the intention to return the same
amount of stock not later than April 2015. During mid-February 2015, the situation at the US
west port got highly volatile and the port operation almost halted for a couple of days. This
was the starting point of the disruption.
FO1’s response after the US port lockdown – News of the port showdown did not surprise
FO1, because the procurement team started to anticipate a possible shutdown in late
January and early February. However, the news alerted the procurement team to a possible
stock out scenario for the following reasons:
After the port shut down for a couple of days, it was hard for FO1 to analyse the
exact number of days without any in-coming shipment of lactose from the US. The
massive backlog of containers created the highest level of uncertainty.
Although the procurement team was able to secure a certain amount of lactose from
a competitor, the gap analysis showed possible stock out if delays persisted.
Lastly, FO1 was approaching the particular season, March and April, in which the use
of lactose to standardise the raw milk would be at the highest level.
The procurement team quickly worked on three possibilities to resolve the issue. Though
these options are discussed separately, the procurement team analysed these options in
parallel.
Option 1: Immediately after the port lockdown, the team explored alternative
shipping options, such as airfreight or using an alternative port. However, this option
was ruled out as impractical.
“We looked at shipping from Houston, and we also looked at going up to
Canada and shipping out of Canada. But none of them was actually going to
help us out immediately. […] We also talked about airfreighting lactose, of
course, they [the suppliers] were reluctant. […] So we did not end up having
airfreight.” (FO1-P6).
Option 2: Concurrently, the team also worked on rationalising the use of lactose,
which meant limited application of lactose in production. These options were
discussed with top management; the information was also communicated to
relevant departments, such as production, quality and sales. It was quickly
determined that the possible impact of this option on other operations would have
possible implications for buyers’ specifications. Because of its high level of
implications, this option was retained as a last resort, with further analysis in
consultation with relevant functions and stakeholders. The option was reserved for

348
later discussion, but it was not further analysed because the procurement team was
able to avoid the situation.
Option 3: The procurement team immediately worked on the possibility of procuring
lactose from other sources. Two alternatives were available. First, to procure from
the European suppliers, which was considered impractical because it was not
promising to resolve the situation quickly because of the shipment and ordering
lead-time. Secondly, the company had a backup supplier in the US. However, this
supplier was in the same region as the normal supplier, which ended this option.
Based on the backup options, the procurement team quickly settled on the same option
used before the port shutdown, almost one week before. Therefore, right after the
lockdown, the procurement manager again informed top management regarding the
possible stock-out and about procuring from its competitors. The procurement manager
quickly contacted few competitors to see if anyone had some extra lactose stocks; which
revealed that one was facing the same problem. The competitor from whom FO1 procured
stock before the lockdown had no more extra stock. However, another competitor had
some extra stock of the same lactose brand FO1 was using, which the procurement manager
was quickly able to secure.
During this time the procurement team continuously monitored the current stock levels and
shipments arriving every day from its competitor. This meant daily looking in the warehouse
and production site to get the most updated information.
For almost 4 weeks, mid-February till mid-March, FO1 did not have any shipments from the
US supplier, because of the high backlog level at the port. During that time, FO1 ran on the
daily stocks with no buffer to cover any further delays. During this period, the procurement
team again got to the point when the gap analysis revealed a possible stock out. To avoid
any delays, the procurement manager once again called the competitor from whom the
company had procured stock the second time, and luckily managed to source lactose. This
time the lactose brand was different, but the procurement team quickly learnt that it had
used the same brand in the past, which enabled the procurement team to get fast approvals
from the relevant departments. This time the procurement team purchased quite a few
tonnes of lactose compared with the small amount previously, which meant that FO1 would
easily get through the situation.
It is important to note that the first deal was based on a lending agreement. However, the
latter two deals were purchase agreements that were significantly higher than the lending
deal. The shortage situation remained for 4 to 6 weeks; FO1 started to receive shipments
from the US in late March and early April 2015.
FO1’s response once the US port became fully-functional – Though the US port issue was
resolved in February and March and FO1 started to get shipments from the US, the whole
scenario ended in an operational challenge. Once shipments started to come in early April,
349
FO1 ended up with a significant amount of lactose. Seeing the inventory implications, the
procurement team planned three options:
First, it returned the borrowed stock to the first competitor. However, this was just a
limited amount of the total surplus stock.
Secondly, in the previous attempt to look for stock, the procurement manager
identified a competitor who was facing a similar shortage. Therefore, FO1 was able
to sell a significant amount of surplus stock to that competitor.
Lastly, the remaining surplus was used later by the procurement team adjusting the
next order with its suppliers.
It is important to highlight that during all these three phases, the procurement team was
actively communicating with the relevant departments, such as the quality, warehouse and
logistics teams. First, during the storage period, FO1 was locally getting daily supplies for all
its daily purchases. This was reflected in operational challenges for the warehousing and
logistics teams. They had to expedite various processes such as accelerating the devanning
process. Secondly, all the incoming raw material goes through a quality check by the quality
team, which was also expedited by allocating extra resources. As mentioned by FO1, there
was a lot of manual work that enabled the company to avoid any interruption.
As the disruption did not affect production, there were no direct cost implications of this
disruption to FO1. It was also noted, had it been unable to foresee and quickly manage to
secure extra stock from its competitors, it would have resulted in both operational and
financial implications.
This disruption ended with few changes in the procurement strategies. First, based on
further risk analysis and the procurement manager’s recommendations, the company
increased lactose stock levels to six weeks. Secondly, FO1 started to spread the risk in
procuring from one country or region by increasing the percentage of business with its
European suppliers and, most importantly, the procurement team also approved multiple
suppliers in Europe.
3. Analysis of the Lactose Shortage Issue
A similar approach, as in the previous two disruptions, was taken to analyse this disruption.
It is important to note that, like other SC disruptions, this disruption was analysed
separately and independently. Analysis of this disruption identified various actions by FO1
that enabled it to entirely avoid the challenges presented because of the US port lockdown.
These actions were grouped into various SC resilience elements.
It is vital to highlight here that FO1’s participants were the main focal point for data
collection in this disruption; some secondary sources, such as news archives and website
data were used. During data collection, the option of interviewing SC partners, such as the
US suppliers, especially those directly involved in this disruption, was considered. However,
350
because of the impracticality, such as the logistics issue, of approaching these international
SC players, this option was ruled out. Though data collection for this disruption was only
from FO1’s participants with some comments from its 3PL provider and two competitors,
due consideration was given to take SC views during the interviews.
3.1. Situational Awareness and Quick Decision Making
This disruption encompasses a lot of uncertainty, which was observed as a key challenge. As
highlighted by the procurement manager (FO1-P6), during the initial stages of the issue “It
was like anything can happen, and it was also leading into the time of the season when our
lactose consumption was at the highest”. This section highlights who were involved in
understanding this dynamic situation and in making decisions and, secondly, the analysis
highlighted various tools applied to engage in situational awareness.
Data analysis showed that a central role in dealing with this disruption was attributed to the
procurement team, which collaborated with various support teams such as quality,
warehousing and logistics teams. The procurement team/department acted as the “hub
entity” for gathering information, analysing it and making decisions. It was noted that an
operational disruption might present only operational challenges and require situational
awareness and decision making limited to specific operations. Therefore, it required only
the relevant teams, such as the functional teams to provide leadership.
The procurement team opted for various strategies and applied various tools to analyse the
uncertain environment during this disruption. First, the procurement team used various
early indicators, such as short-term delays of shipments, as a primary tool to plan and
execute various anticipatory measures to avoid any negative impact of these delays on
production. For example, FO1 used gap analysis to understand the possible impact of the
delays on various operations.
“My first response was to draft a table of our lactose [inventory] and then map up
daily consumption and then also map up the shipments to see when it is coming in
and to see what our stock position was and where the pinch point was” (FO1-P6)
During December 2014, this analysis enabled FO1 to conclude that the buffer stock would
be enough to cover short-term delays. This gap analysis or short-term forecasting continued
in January-February, when the company analysed that persistent delays would likely result
in a shortage of lactose. Based on the gap analysis the procurement team engaged in
scenario planning and evaluated various options to avoid the disruption (see also Sections
3.2 and 3.3).
In addition, a similar process, as described in the previous disruptions, was observed during
this disruption, where the procurement team was involved in first gathering information
from stakeholders, such as raw material suppliers, competitors, logistics companies and

351
from the other stakeholders, which enabled it to analyse the situation and implement the
best possible solution.
3.2. Quick Decision-Making and Anticipatory Measures
The two outputs, anticipatory measures and quick decision-making, of situational
awareness, were analysed as the critical aspects of this disruption. Therefore, they are
discussed separately from the situational awareness.
Based on the gap analysis and scenario planning, FO1 took some anticipatory measures,
such as contacting its competitors to procure an additional lactose supplies, before the
actual US port lockdown. It was recognised that any delays in taking these anticipatory
actions would result in a significant impact on FO1’s operations.
Consider the example of Nokia and Ericsson in response to a fire in its critical supplier’s
plant (Russell & Joanna, 2012), Nokia’s ability to make quick decisions was a critical factor in
its successful response. In Nokia’s response, top leadership contributed a decisive role in
exploring new ways to resolve the problem by quickly contacting new suppliers. Conversely,
Ericsson’s response was slow to recognise the problem and in contacting new suppliers,
which ended up with lower sales and, consequently, eroded its market share.
A similar observation was seen from this disruption in that the procurement manager’s
quick decision making and anticipatory measures enabled FO1 to quickly secure additional
lactose from New Zealand compared with its competitors, since a few competitors were
experiencing a similar problem. Though it can be concluded here that quick decision making
and anticipatory measures led FO1 to mitigate a potential issue, the major question during
the analysis was what factors enable some managers to make quick decisions, e.g., the
procurement manager, compare with others.
First, it was noted that the procurement manager had the correct, updated information
from the US suppliers, such as the status of the shipment delays and even information
regarding competitors getting the same brand of lactose that FO1 was using. Therefore, the
first aspect of quick decision making was FO1’s ability to gather relevant, updated
information. The second aspect of quick decision making was recognised as the supportive
organisational culture from the top management, which is further discussed in Section 3.5.
In conclusion, anticipatory measures and quick decision making were the fundamental
enablers to avoid this disruption. They were facilitated by situational awareness, the ability
to get correct, updated information and having essential cultural support from top
management.
3.3. Collaboration with Competitors – Coopetition
A possible shortage of lactose was avoided because FO1 was able to procure the required
supplies from its competitors. Later, once the company got enough/extra lactose, it supplied
352
its additional inventory to another competitor was facing a similar problem. A key question
here was “What enabled such collaboration among the dairy competitors also known as
coopetition?”
The analysis showed that the New Zealand dairy industry collaborates on a regular basis,
which not only involves collaboration during a major SC disruption, such as DCD or botulism,
but also in smaller operational issues, for example:
The dairy industry joined hands to develop best practice around dairy traceability
systems, after the DCD and botulism issues. The industry came up with a joint
working group called the “Dairy Traceability Working Group”, involving participation
from all dairy companies, including FO1.
Secondly, after the DCD and botulism issues, the DCANZ became an effective
industry consortium to discuss industry-wide issues.
Lastly, at the operational/tactical level, if one dairy company experiences any
problem that threatens milk processing, then the various dairy producers in the
country have an agreement to take raw milk supply to avoid any milk spill over in the
country.
It was understood that these types of ongoing collaboration among dairy companies, at
both top management and operational level, would have developed linkages that became
useful to the procurement manager to quickly establish links with his/her counterparts in
other dairy companies during this incident. It can be argued that had prior experience of
collaboration and connection not been present among dairy competitors; it would have
been impossible to establish such links quickly with a competitor.
“I had links within [our competitor] from previous dealing with them, and so I straight
away approached them for [lactose supply], because I heard from one of the US
producers [lactose supplier] that actually [our competitor] had quite a bit of stock
sitting in their warehouse.” (FO1-P6)
Two lessons emerged from the data analysis, first a SC disruption may require adding a new
player into the SC who could be beyond a company’s typical SC, such as a competitor.
During this case, FO1 added a few additional players (three competitors), which led the
company to avoid the issue. Secondly, these linkages with competitors can be achieved only
through prior working experience, collaborative problem-solving (D1 and D2), personal
linkages and openness to share information and resources.
“It is a norm in dairy industry [and] I think that it is part of New Zealand culture to do
it. For example, by holding lactose to us does not give our competitors a competitive
advantage. So there is nothing to gain for [them] in saying, NO we are not going to
sell you, we got heaps of it, but we are not going to give you any. If they do so, there
is a short-term loss to us, [but] they gain nothing.” (FO1-P11)

353
3.4. Operational/SC Re-engineering
A central part of this disruption involved quick changes or adjustments in various processes
to mitigate or avoid any potential impact on FO1’s production. For example, FO1 had to
change its sourcing strategy by quickly adding new suppliers to fill the gap caused by the
port shutdown. The produced changes in other operations, such as raw material approval
and warehousing and logistics operations. This section discusses the understanding of how
and what enabled FO1 to adjust or change its operations quickly.
Analysis showed that the company identified and analysed various processes through
situational awareness that there could be a bottleneck and, therefore, expedited processes
to facilitate a fast response and recovery. For example, the company, at one point, was
running on the daily stock of lactose, like a just-in-time process. FO1 expedited raw material
approval and release, which in normal circumstance took several days. FO1 also expedited
processes related to warehousing and logistics operations, such as material handling and
storage options. Here the primary lesson was that a SC disruption could cause time
pressure, where a company needs to understand various bottleneck processes (through
situational awareness) that could be reduced to keep the desired service level that, in this
case, was maintaining the desired production schedule. Mainly, FO1 utilised extra resources
and staff to expedite passing through bottlenecks.
“We had to get our quality teams to put urgency on releasing products. So normally
that could take anywhere up to a week, so we just had to make sure operationally
that when these products come in and [then] release it on the same day or the next
day" (FO1-P6)
In additions, various pre-existing SC strategies, such as buffer stock, emerged from the data
analysis as productive during this disruption. This strategy enabled FO1 to adjust its
processes to quickly mitigate the whole issue.
First, a buffer stock of four weeks protected FO1 from the immediate impact of delayed
shipments and provided an opportunity to evaluate various alternatives. In the literature, it
is referred as redundancy (Christopher & Peck, 2004; Sheffi & Rice, 2005; Zsidisin & Wagner,
2010). It was found that the buffer stock or redundancy provided time during the SC
disruption (Zsidisin & Wagner, 2010). Though it provided additional time, the major task was
to explore alternative options. For this, FO1’s approach to quickly adjust its sourcing
strategy by adding new sources of lactose enabled the company to entirely avoid the
disruption, also known as flexibility in sourcing (Pettit et al., 2010; Sheffi & Rice, 2005).
Toyota’s example (Nishiguchi & Beaudet, 1998), in response to a fire at its supplier’s plant,
showed the similar approach. Toyota quickly adjusted its sourcing strategy by including new
suppliers enabled it to recover within a few days after the disruption (Sheffi & Rice, 2005).
Furthermore, after this disruption, the procurement team worked on a more permanent
solution, which was referred to as permanent re-engineering. Based on risk analysis, the
354
company readjusted its procurement strategy from four to six weeks. Secondly, FO1 also
dispersed its suppliers’ base by adding more sourcing options in multiple geographical
locations by increasing business with European suppliers, referred to as flexibility in sourcing
(Bode, Wagner, Petersen, & Ellram, 2011; Pettit, 2008; Sheffi & Rice, 2005).
In conclusion, following points can be learnt from the above discussion:
Buffer stock or redundancy provides additional time (Zsidisin & Wagner, 2010) to
evaluate and execute alternative options,
Flexibility enables quick response and recovery from a disruption.
3.5. Supportive Organisational Culture
The analysis suggested that one underlining element that enabled all other SC resilience
elements discussed above was FO1’s supportive culture. The analysis showed that FO1
provided appropriate top management support to its staff to bring in new ideas and make
innovative decisions autonomously and quickly to resolve the issues created by this
disruption (also known as empowering employees).
“It was more of informing my manager what I was going to do rather than asking for
permission to do it” (FO1-P6)
Furthermore, the informal communication channel was observed to be very strong in FO1,
which helped the company to communicate information across different functions, e.g.,
from the procurement team to the quality team, smoothly and quickly. Lastly, though FO1
managed to deal with this issue successfully, the company learnt from the situation and
brought in various changes in its sourcing strategy, which reflects FO1’s learning attitude.
It can be concluded that organisational culture provides essential support to relevant
personnel to engage in innovative problem solving, which also provides them autonomy and
the empowerment to make quick decisions. This then leads to appropriate situational
awareness, quick decision making and collaboration.
4. Critical Raw Material (Lactose) Shortage – Conclusion
In the end, the actions opted for by FO1 during this disruption resulted in full avoidance of
this disruption. Analysis of this disruption presents various SC resilience elements
summarised in the following points.
Situational awareness and quick decision making
Crisis management team (functional level)
Collaboration
Operational/SC strategy (pre-existing)
Operational/SC re-engineering
Supportive organisational culture
A learning attitude

355
Appendix F. Detailed Case Description - Operational Issue:
Product hold (D4)
Case Description
This disruption relates to an internal operational issue24 that led FO1 to hold a significant
amount of finished product and resulted in an operational disruption for various
downstream SC partners. During data collection, this disruption was an ongoing issue. This
section highlights the events and actions in this disruption.
1. Background Information
All New Zealand dairy companies operate under specific regulations and code of practices
set by regulatory authorities locally and internationally. To comply with these regulations,
every dairy company sets its own parameters covering good manufacturing practice, a
predefined risk management plan (RMP), and numerous in-process control systems. To
ratify effective implementation, regulatory authorities, such as MPI, perform various direct
and indirect checks and audits, which often require the involvement of various third parties,
such as auditors.
1.1. Countdown to the Disruption
From its inception, FO1 has used predefined procedures, RMP, and various regulatory
requirements to ensure industry-wide best practice. To comply and satisfy the national
regulatory body (MPI) and international regulators, FO1 has to go through various review
processes performed by independent authorities. Until the first quarter of 2015, all review
processes resulted in confirmation of best practice and implementation of company-wide
RMP and other regulations.
In the first quarter of 2015, a usual change of staff in the third-party service provider, an
auditor, brought a significant challenge to the understanding and endorsement of these
regulations. However, FO1 did not change any of its documents, procedures or processes. It
was reported that though the regulations and policies remained same, the change in staff
brought a different perspective in interpreting the same regulations and policies. This led to
significant operational challenges that resulted in extra administrative work and additional
processes, which meant delays in the release of finished products.
It started in May 2015. In the beginning, it was perceived as a one-off incident. Therefore,
the situation was mainly handled at the tactical level. As it was considered an ordinary
operational issue, FO1 did not initiate any formal response at the top management level.
During the first few weeks, the additional administrative work did not affect any other
24 A few of the essential elements of this disruption are not disclosed to protect the confidentiality. The purpose of this section is to provide the scope of and impact on FO1’s operations.
356
operation, such as customers’ delivery deadlines, since it was covered by the usual lead-
time promised to the buyers.
“I think it was probably like two months after first batches were put on hold that the impact starts to filter up in the organisation. […] so, we did not find that issue until after 6 to 8 weeks because then the deliveries were meant to go” (FO1-P11)
The situation changed significantly after June 2015. The company realised that situation had
become an ongoing operational issue; it was almost 6 to 8 weeks after the first review when
it started to affect the product delivery deadlines. Initially anticipated as an ordinary issue,
the scenario started to cause significant delivery delays, order backlogs and unsatisfied
buyers. As a reference point, this disruption began in June-July 2015, when FO1 started to
face a significant bottleneck that led to the sales team experiencing substantial challenges in
meeting buyers’ orders on promised delivery times.
1.2. Overall Impact
Operational challenges – Unlike the previous disruption, lactose shortage issue, this
disruption resulted in substantial operational challenges and financial resources. The
scenario required various departments within the company to perform additional
processes before the release of finished products. As described by one informant,
“We have required to hold the products for no good reason, which is not good and
even counter-productive. So that means that a lot of people are doing extra [work]
[...] and spending more money” (FO1-P2).
The process resulted in “delays of 2 to 3 weeks” and, after the first review, it became
a recurring issue (FO1-P4). As the process was ongoing, every time the company had
to spend more time and resources on additional processes.
Downstream SC – The in-house operational challenges resulted in significant
pressure for the sales team to meet delivery deadlines. Consequently, various buyers
of FO1 products faced a significant challenge to meet the market demand, leading to
stock-outs and sales losses. One of FO1’s buyers was significantly affected by this
issue.
“They [buyers felt] a significant amount of pain, because when we produce a
product, we produce it to a promised delivery date, in this case, [it] was
pushed up to 2 to 3 weeks. Because of that, they [buyers] started having
issues from the market. [….] So they were quite frustrated with this issue.”
(FO1-P4)
Warehouse and shipping challenges – In addition to the operational and delivery
challenges, FO1 had to arrange additional warehouse facilities because these delays
resulted in higher levels of in-house inventory for certain products.

357
“It put pressure on the warehouse space that we have, and we needed to hold
onto additional third-party warehouse that traditionally we had dropped
down earlier. So there [was] cost associated with that.” (FO1-P9)
Additionally, FO1 had to arrange alternative shipping options for its major overseas
buyers. On multiple occasions, FO1 used airfreight to reduce the shipping and
delivery time, which was reflected in high shipment costs.
“We actually had to airfreight a lot of products to [our overseas customer],
and that came with a huge cost.” (FO1-P9)
2. FO1’s Response
The response by FO1 can be grouped into four steps. Like the previous disruptions, the steps
are grouped to provide a clear understanding of the response. Hence, each step is not
mutually exclusive, a lot of the activities were initiated in parallel.
Step 1: Operational/tactical level response
Step 2: Collaboration at the industry level
Step 3: Communication with the affected buyers
Step 4: Process improvement
Step 1: Operational/tactical level response – The situation required the quality team to
produce various additional documentation and perform processes to release products. The
first part of the tactical response was to find all the batches involved in the review, which
was relatively easy for FO1 because of its IT systems and information (refer to D1 and D2 for
more detail). The quality team, then needed to produce extra documentation and perform
other associated tasks. That stage was then followed by involvement of the relevant parties
to release the products.
To expedite the process, FO1 sometimes had to use fast shipping options to compensate for
delays of 2 to 3 weeks. Airfreight was used on various occasions to facilitate individual
buyers’ needs. Shipping by airfreight required various other operational changes that were
regularly coordinated by the warehousing and logistics team. Secondly, pre-established
backup plans and contacts with airfreight companies allowed FO1 to switch from sea-freight
to airfreight without any significant problems.
Lastly, on many occasions during this issue, FO1 had to hold a significant amount of finished
goods at its warehouse, which put direct pressure on available warehousing space. The
company had to retain additional warehouse space, offered by company’s logistics
company, which resulted in a financial cost. During this issue, FO1 hired an additional
warehouse from one of its competitors through its 3PL company. All of these operational
challenges were handled by the warehousing and logistics team with its 3PL provider.
Step 2: Collaboration at the industry level – The functional teams handled this situation at
the operational level, while the top management and concerned personnel started to take
serious actions with the relevant authorities to deal with the issue. Discussion with the
358
relevant stakeholders started to establish mutual understanding regarding regulations and
processes.
In parallel, FO1 initiated discussion with other dairy producers at the DCANZ level. As
highlighted by one informant (FO1-P2), “we tried to initiate a debate at DCANZ, and we have
found out that the others are also facing the same kind of problem. So dairy companies are
more like on the same level of understanding.” Based on a similar understanding, the dairy
companies started to communicate with the relevant stakeholders to establish mutual
understanding.
Step 3: Communication with the affected buyers – A part of the response concerned the
particular buyers affected by the late deliveries. Here, FO1 focused on two tasks, especially
with one of the most affected buyers. First, on seeing persistent delays, FO1 decided to
share the reasons for these delays with its most affected buyers. Mainly, the sales and
marketing team was involved, “we had a face-to-face meeting with them (the affected
buyers) to explain and to make sure they have good understanding of why the issue
happened [and] what we have done to make sure that it does not happen in future, so face-
to-face meeting with customers that were most affected. And that’s the way to restore their
confidence. […] But it is still a disruption, so I guess maintaining a good communication loop
would erode some of the anxiety” (FO1-P4).
Other informants mentioned that FO1 maintained continuous communication with its
buyers by providing all relevant information regarding the issue. Here, top management
involvement, face-to-face communication and conference calls were the key matters. It is
believed that this open, transparent communication would eliminate a certain level of
frustration. Secondly, seeing the persistence of the issue, the sales manager stressed making
the extra time as a part of the regular lead-time. Though FO1 eventually started to consider
this option, the sales team showed its concern that the problem should have been solved
more proactively by providing a realistic timeline.
Step 4: Process Improvement – As discussed above, a part of this issue was related to the
difference in interpretation of the same regulations, but another part of the issue was
related to improving the processes concerned, such as incorporating more detailed
documentation. This was highlighted by the quality team (FO1-P4), “The other learning
around this was if we have a procedure that says like we have to do A, B, C, D and E. So the
lesson for us to better do A, B, C, D, and E otherwise you are putting yourself up for criticism,
which was exactly what happened” (FO1-P4). To improve further, FO1 engaged in following
activities:
Review teams – A dedicated working group was established and allocated the task to
suggest various improvements in existing processes and further work on the
implementation of pre-existing practices. One part of this was to do with appropriate
root-cause analysis, for which FO1 engaged a dedicated root-cause analysis team.
One basic lesson from this incident, as highlighted by the quality team, that better
root-cause analysis is one pre-requisite of process improvement. Based on this
lesson, the company further strengthened its processes.

359
Training and implementation of procedures – It was determined that the training of
lower levels of the organisation, such as the operators, was essential to ensure all
the pre-defined procedures are being practised. It was learnt from the analysis that
FO1 had shown such a commitment right from its inception and, after this issue, it
had started to place more stress on these training sessions.
Though, at the conclusion of data collection, this issue was still alive, it is believed that such
actions would have resolved the issue.
3. Analysis of the Operational Issue (Product Hold)
Like the third disruption (D3), data collection mainly involved FO1’s respondents. As the
issue was active during data collection, FO1 considered it highly risky to engage in any data
collection from associated stakeholders, such as the relevant buyers. With these constraints,
the data collection includes only FO1’s response. However, due consideration was given
during the data collection that it was the SC view regarding this disruption.
Like the previous disruptions (D1, D2 & D3), FO1’s actions and strategies are grouped into
various SC resilience elements that emerged from the analysis.
3.1. Situational Awareness
The analysis showed that there was delayed understanding regarding the issue that
compromised the response. The major questions explored during the analysis were: “Why
there was a delay in recognising the issue?” and “What can be learnt from this situation?”
“I think there is learning around this that we did not address the issue on day one, as
we just thought that it is a one-off event and it would eventually resolve […]” (FO1-
P11)
For this disruption, there were two early indicators. The first early indicator appeared a few
months before the actual disruption. It was noted that missing the first indicator was the
major loophole in the delayed response. Here the staff “thought that it is a one-off event”.
The second sign of a disruption appeared when the issue actually started to affect other
functions, such as the sales department in meeting customers’ deadlines. Sheffi (2015)
categorises the detection of a disruption into three-time zones: Positive, Zero and Negative
Detection Lead-time. Considering this concept, it was noted that this disruption actually was
a positive lead-time disruption, as an early indication appeared a few months before the
disruption. However, in reality, it was dealt with at zero lead-time, when the disruption
started to affect other operations. Here, a major question arises: How can an organisation
can make sense of these early indicators?
Analysis showed that it was more an intuitional decision. By interviewing and analysing
information from various relevant informants, two primary lessons emerged, which would
have given FO1 early detection of a potential disruption. Proper scenario planning and a

360
better understanding of how this could impact on other functions would have led to an
earlier response. For example, as one informants (FO1-P12) highlighted "I guess that it’s
openness or judgement [regarding this issue] that we do lack." With the first indication, a
lack of judgement of possible consequences or impact on other functions were the major
hindrances reported during this disruption.
In conclusion, what can be learnt from the above discussion is that if FO1 had recognised
and analysed early indicators of this disruption, it would have initiated an early response.
Secondly, scenario planning and a better understanding of possible consequences would
have enabled the relevant staff to make sense of the early indicators.
3.2. Top Management Involvement
The major drawback of a delayed situational awareness led to delayed communication to
FO1’s top management. Though there was a delay in recognising the issue, it was found that
the problem was promptly escalated to the top management once the issue was recognised
by the relevant staff, indicating an adequate escalation process within FO1. As indicated by
Sheffi and Rice (2005), awareness by front-line employees and having a right culture are
fundamental factors in escalating bad news to the right people in the organisation. After
this, the analysis showed that top management provided an appropriate level of leadership
that led to effective management of the disruption.
FO1 initiated two levels of response to resolve this issue. First, the operational response
(discussed in Section 3.4) was managed by functional teams and, secondly, the strategic
response was handled by top management. As soon as the issue was communicated to top
management, FO1 started planning to resolve this issue more holistically and established
collaboration with industry partners.
In summary, ensuring the involvement of the right people, in this case, the top
management, is key to resolving the issue more holistically. Secondly, better situational
awareness of relevant staff, adequate escalation processes and a supportive culture are key
factors to ensure that right people are involved during a disruption.
3.3. Collaboration with the Key Stakeholders
The findings highlight two levels of collaboration: Horizontal and Vertical level.
3.3.1. Horizontal level Collaboration
This disruption highlighted the importance of collaboration with competitors, also known as
coopetition, which encompasses joint problem-solving and information sharing.
Collaboration was targeted at holistically resolving the issue.
In terms of primary activities, FO1’s top management initiated a debate with other dairy
partners. This collaboration, or information sharing, enabled FO1 to discover that various

361
other players were facing similar issues. The discussions, at DCANZ level, led to joint
problem solving and synchronised communication with the other key stakeholders involved
in this disruption. In conclusion, joint problem solving, information sharing and synchronised
communication were observed as the main features of such collaboration (also reported by
Scholten and Schilder (2015)) with competitors.
“So what we did was we tried to initiate a debate at DCANZ, and we have found out
that the others [dairy companies] are also facing the same kind of problem” (FO1-P2)
Secondly, the main question arises: What enabled such collaboration between the
competitors? The underlying reasons emerging from the analysis were: previous working
experience, effective industrial consortium (DCANZ), openness to share information and a
mutual goal. It was learnt that previous experience in collective problem solving, such as
during DCD and botulism scares, enabled a fast, efficient communication channel during this
disruption. Secondly, openness to share information and explore a silver lining to resolve a
mutual problem collectively was observed as an integral part of New Zealand’s business
culture.
“I think it is more related to the openness and helping out each other during those
difficult situations rather than gaining any financial benefit out of it" (FO1-P9)
3.3.2. Vertical level Collaboration
As a consequence of this disruption, a few of FO1’s buyers were affected by the delayed
shipments. The analysis suggested that FO1 initiated and maintained continuous
communication with its affected buyers by providing relevant, updated information. It is
assumed that this open, transparent communication would have eliminated a certain level
of the buyers’ frustration.
Overall, the findings show that maintaining collaboration with all relevant stakeholders,
such as competitors, industry partners, and buyers, is pivotal to deal with a disruption
effectively. Previous experience, openness and transparent communication, an industry
consortium and a mutual goal are the key enablers to develop such collaboration among
competitors.
3.4. Operational Re-Engineering
In addition to collaboration with competitors, FO1 initiated various activities or programmes
within the company to deal with the issue at the operational level. The analysis showed that
these activities were aimed at both short-term and long-term operational re-engineering.
To resolve the issue in the short run, FO1 identified various processes that could be
expedited to reduce delivery lead-time. For example, in multiple instances, the sales team
had to use airfreight to facilitate its most affected buyers. The major lesson here is that an

362
organisation needs to identify the bottlenecks or time-consuming processes during a
disruption that can be expedited to achieve the desired service level or outcome.
Further analysis showed that FO1’s various pre-existing strategies led to the fast expedition
of these processes during the disruption. For example, pre-established contacts with the
airfreight companies enabled quick execution of this strategy during the disruption. Many
authors call this strategy a flexible contract with suppliers and consider it as a factor to
achieve flexibility and, therefore, SC resilience (Pettit et al., 2010; Sheffi & Rice, 2005;
Tomlin, 2006). Similarly, FO1 had flexible contracts with its 3PL provider to utilise extra
warehouse space that was required to meet the short-term requirements of holding high
inventory during this disruption.
FO1 identified various processes that needed improvement to deal with this disruption
more holistically. These involved various quality assurance practices. For example, dedicated
teams (e.g., a working group or a root-cause analysis team) were formed to review and
suggest improvements for various processes related to the disruption. As highlighted by the
quality manager, “We have a working group, […] we have quality involved, we have
maintenance involved, [and] everyone who has an impact on it. That is where we look our
policies and procedures, and we also look at the trend. So we meet every couple of weeks”
(FO1-P1).
With regard to what enabled the company to introduce such initiatives was its learning
attitude towards continuous improvement and further strengthening quality assurance
practices in the company. The findings suggest that a gap analysis on what can be improved
and learnt from a disruption as the key features of such lessons. In conclusion, re-
engineering involves both short-term and long-term initiatives to deal with immediate
challenges and to improve SC resilience in the long-run.
3.5. Supportive Organisational Culture
As discussed in Section 3.2, a supportive organisational culture, adequate escalation
processes and top management involvement are critical aspects of an adequate response. In
this case, the relevant staff did not recognise the problem in advance but, once the problem
became apparent, FO1 showed supportive leadership to resolve the problem more
holistically.
In addition to top management support, a vital part of dealing with this disruption was to
cultivate a risk awareness culture in the organisation. As highlighted by the quality manager:
“One part is developing the procedures [or systems], and another is then to execute
and implement that in the factory. So that’s where we are struggling too” (FO1-P1)
As highlighted above, FO1 introduced various initiatives to develop quality assurance
practices and procedures as part of its operational re-engineering. For this, FO1 initiated
363
various programmes to institutionalise the practices at lower levels such as operators. For
example:
It was analysed that continuous training sessions are key factors to bring all
members of an organisation to the same level of understanding and it
institutionalises the practices in staff behaviour. As highlighted by the quality
manager (FO1-P1), “We are also working on the training and knowledge of the
operators, and it is also important. We are about to introduce a [new process to
improve our reporting and documentation] […] so we are training our operators for
that.”
Secondly, the analysis showed that FO1 also encourages innovative ideas from
lower-level staff. For example, if a team comes up with a new idea, it is encouraged
to discuss with the middle management (i.e., the quality team). Secondly, top
management also encourages each team to share its learning with other teams.
In conclusion, a supportive organisational culture enables an organisation to deal quickly
with an issue by escalating a problem to the right people. Secondly, a risk awareness culture
is a product of the institutionalisation of best practice, continuous training, and
encouragement of innovative problem-solving. All these elements lead an organisation to
deal with a disruption effectively, in the long-run learn from a disruption, and improve
existing processes.
4. Operational Issue – Conclusion
Overall, analysis of this disruption presented various SC resilience elements that are
summarised in following points:
Situational awareness
Top management involvement
Collaboration
Operational/SC strategy (pre-existing)
Quality management practices
Operational/SC re-engineering
A learning attitude
A supportive organisational culture
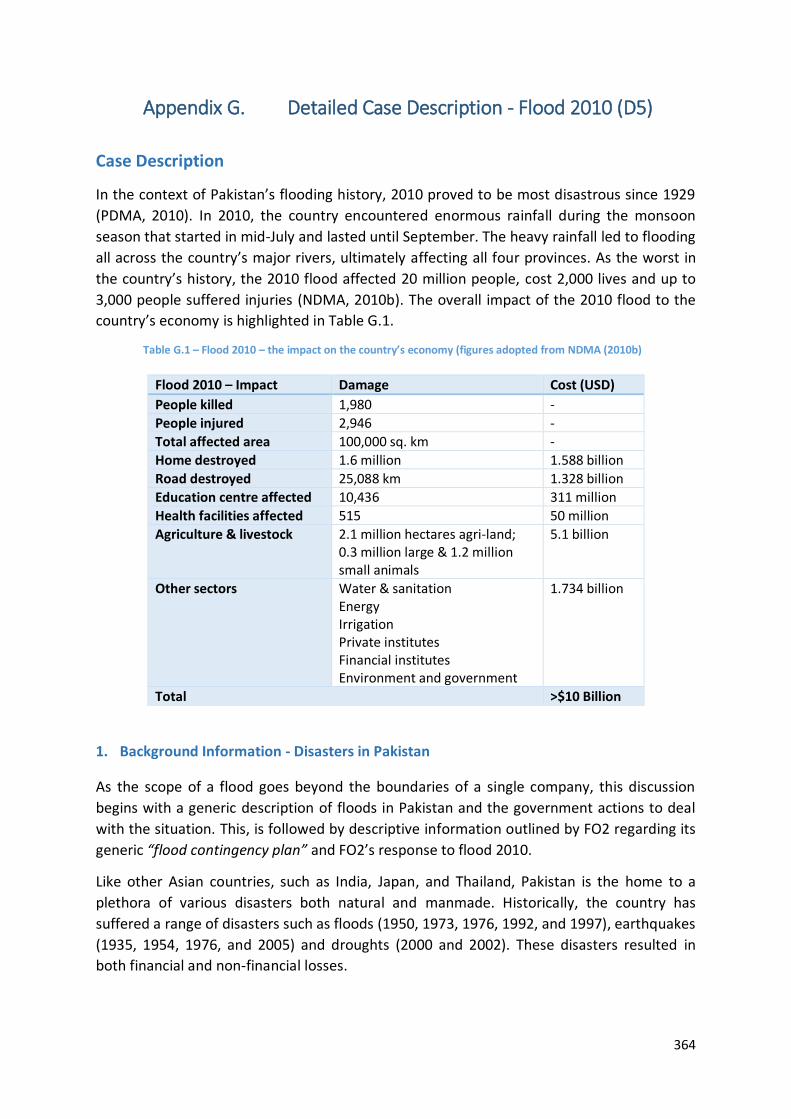
364
Appendix G. Detailed Case Description - Flood 2010 (D5)
Case Description
In the context of Pakistan’s flooding history, 2010 proved to be most disastrous since 1929
(PDMA, 2010). In 2010, the country encountered enormous rainfall during the monsoon
season that started in mid-July and lasted until September. The heavy rainfall led to flooding
all across the country’s major rivers, ultimately affecting all four provinces. As the worst in
the country’s history, the 2010 flood affected 20 million people, cost 2,000 lives and up to
3,000 people suffered injuries (NDMA, 2010b). The overall impact of the 2010 flood to the
country’s economy is highlighted in Table G.1.
Table G.1 – Flood 2010 – the impact on the country’s economy (figures adopted from NDMA (2010b)
Flood 2010 – Impact Damage Cost (USD)
People killed 1,980 -
People injured 2,946 -
Total affected area 100,000 sq. km -
Home destroyed 1.6 million 1.588 billion
Road destroyed 25,088 km 1.328 billion
Education centre affected 10,436 311 million
Health facilities affected 515 50 million
Agriculture & livestock 2.1 million hectares agri-land; 0.3 million large & 1.2 million small animals
5.1 billion
Other sectors Water & sanitation Energy Irrigation Private institutes Financial institutes Environment and government
1.734 billion
Total >$10 Billion
1. Background Information - Disasters in Pakistan
As the scope of a flood goes beyond the boundaries of a single company, this discussion
begins with a generic description of floods in Pakistan and the government actions to deal
with the situation. This, is followed by descriptive information outlined by FO2 regarding its
generic “flood contingency plan” and FO2’s response to flood 2010.
Like other Asian countries, such as India, Japan, and Thailand, Pakistan is the home to a
plethora of various disasters both natural and manmade. Historically, the country has
suffered a range of disasters such as floods (1950, 1973, 1976, 1992, and 1997), earthquakes
(1935, 1954, 1976, and 2005) and droughts (2000 and 2002). These disasters resulted in
both financial and non-financial losses.

365
Until 2005, officially, disaster management was limited to immediate response and rescue
operations. The government formally established a federal flood commission in 1977.
However, the commission suffered from a lack of resources, funds, capabilities and had a
restricted autonomy to develop a comprehensive disaster plan (NDMA, 2010a).
After the massive 2005 earthquake and with global influence by “United Nations
International Strategy for Disaster Reduction” (UNISDR), finally, the government took
serious steps to establish a formal disaster management commission. This decision came
immediately after the October 2005 earthquake in the northern part of the country, which
resulted in 142,812 casualties and over 4 million people were affected. To date, it is one of
the worst earthquakes in the country’s history (NDMA, 2010a).
The government established the National Disaster Management Authority (NDMA) and,
consequently, the National Disaster Management System Ordinance (NDMO) was passed in
2006. It followed the establishment of Provincial Disaster Management Commissions
(PDMA) for each province and District Disaster Management Authorities (DDMA) for each
district. The principal task of these authorities was to lay down a wide range of activities for
pre-, during- and post-disaster planning (NDMA, 2010a).
Until June 2010, NDMA, with the help of PDMA, DDMA, NGOs and United Nations
departments engaged in many activities in planning, mitigating and reducing of a range of
disruptions (NDMA, 2009). These activities included training, education and awareness,
promotion of disaster risk management planning, community and local level risk reduction
programmes, and the development of multi-hazard early warning systems. For example,
particularly for flooding, multiple flood-warning systems were introduced consisting of:
meteorological forecasts,
flood routing methods (upstream flow measurements), and
antecedent precipitation indices.
1.1. Flood – A Natural Catastrophe
Geographically, Pakistan occupies up to 56 percent of the Indus River. The largest belt of the
Indus joins other rivers such as Jhelum, Chenab, Ravi and Satluj as it branches at the central
part of the country (Figure G.1). Despite many benefits from this vast network of these
rivers, Pakistan has the highest number, among Asian countries, of the population directly
prone to the river floods (NDMA, 2010a). In Pakistan, thousands of people, especially
farmers, live around riverbeds. Notably, the government has been unsuccessful in moving
these people to planned, developed areas away from the riverbeds (NDMA, 2009).
In Pakistan, flooding results directly from the major storm cycles that initiate in the Bay of
Bengal, typically from July to September, which is also referred as the “monsoon season”.
Every year, during this season, the country usually experiences intense rainfall and flash
flooding that originates either from the Bay of Bengal (most northern part of the country) or
Arabian Sea (NDMA, 2009).

366
In addition, the country’s northern areas occupy a wide range of high mountains such as the
Karakoram and Himalayas, which initiate a high-water flow into the rivers that pass through
the whole country and ends in the Arabian Sea (Figure G.1). As for the snow-covered
mountains, the water follow becomes more aggressive during summer (June to August).
Figure G.1 – Flood affected regions 25
Both these factors, the monsoon season and water flows from northern areas, cause
significant flooding across the Indus River, which has happened many times in the country’s
history. For example, since independence in 1947, floods have affected millions of people
and recorded damage of over USD 8.9 billion (excluding the 2010 flood). In 2010, the
country experienced the worst floods in history, which outweighed the combined losses of
all previous floods. Table G.2 presents the major flood data for the country compared with
the 2010 flood (ADB, 2013).
Table G.2 – Major floods in Pakistan 1950 - 2010
Disruption Year Total Deaths People Affected Financial Loss ($USD Billion)
Floods 1950 2,910 - 0.23
1973 474 - 2.39
1976 425 5.5 Million 1.62
1978 393 2.2 Million 1.04
1992 1,008 12 Million 1.40
2010 1,980 20 Million 10.05
25 https://commons.wikimedia.org/w/index.php?curid=11321167
367
1.2. Countdown to Disruption – The 2010 Flood
During the 2010 flood, disaster management authorities at all levels – national, provincial
and district - were evolving and strengthening their policies and planning to combat nation-
wide natural disruptions. A few steps taken before the actual flooding in July 2010 are
highlighted here.
The first item was a pre-monsoon conference held on 28 June 2010. The primary aim was to
collaborate with all stakeholders such as NDMA and other bodies to review preparatory
measures for the upcoming monsoon season (NDMA, 2010a). At this time, the Pakistan
Meteorological Department (PMD)26 had just been able to forecast a high level of rain
during late July that year. Then, on 20 July 2010, PMD provided the first official warning of
excessive rain, specifically flash floods in the northern parts of the Indus River. On the same
day, NDMA announced the first flood advisory and directed provincial and district disaster
management bodies to take necessary actions (NDMA, 2010a). The first wave of floods
actually originated from Baluchistan on 22 July and surged to other provinces, Khyber
Pakhtunkhwa, Punjab and Sindh (IFRC, 2011).
PMD again issued flood warnings on 27 and 28 July 2010 highlighting high rainfall and
flooding in various districts around the country. Consequently, NDMA issued further flood
advisories to the relevant authorities and departments on 26 and 29 July 2010 to take
necessary actions. These flood advisories predicted a high flooding level from 03 to 07
August in different parts of the country (NDMA, 2011).
Before the actual flood, all relevant departments such as NDMA, PDMA and DDMA initiated
collaborative work with all stakeholders to execute an evacuation plan, which ultimately
saved millions of lives (IFRC, 2011). Interestingly, as stated in the official documents (NDMA,
2009, 2010a, 2011; PDMA, 2010) during this period the focus was to mobilise the
government machinery such as Response Task Force teams and police to help local
communities, including farmers, to evacuate areas prone to immediate danger.
In terms of FO2, the communication of pre-flood warnings was also communicated to the
relevant department in FO2. This enabled various pre-emptive actions, which are
highlighted later in this section (FO2’s Response).
1.3. Impact of Flood 2010
Beyond FO2’s SC boundary, the 2010 flood seriously affected the overall economy. The “UN
Secretary-General” termed the 2010 flood as a “Slow Evolving Tsunami”, which resulted in
country-wide devastation. Beginning in the third week of July and lasting for almost one and
half months, the flood spread its devastation to almost 80 districts of 141 districts in the
country. The total number of the population affected by this flood exceeded the total
26 Pakistan Meteorological Department (PMD) provides weather related early warnings and forecast in order to protect the country against any unforeseen event. (http://www.pmd.gov.pk/)

368
devastation of Pakistan’s 2005 earthquake and is considered one of the major global
disasters, like the 2004 Indian Ocean tsunami (NDMA, 2010a).
This thesis concerns only the agriculture and dairy sectors of the country, which were
among the most affected sectors. Of the total estimated damage of USD 10 billion, almost
50 percent (USD 5.1 billion) was associated with the agriculture and livestock sectors
(NDMA, 2011). This reflects the damage to 2.1 million hectares of agricultural land and
directly affected 1.5 million animals.
Within the dairy sector, different kinds of impact were recorded in various parts of a typical
dairy SC, such as FO2’s SC. The flood severely affected farmers, especially those who were
closer to a riverbed. The farmers encountered animal health issues, unavailability of
medicines, and fodder shortages. To counter these challenges, farmers started migrating to
other places and faced the biggest challenge as they (farmers) “were unable to find dry land
and [….] most of the animals’ remained in the water like for first few days” (FO2-C1-P1).
Additionally, infrastructure damage such as to roads, bridges and canal systems severely
affected the early response.
The enormous impact resulted in massive disruption to FO2’s operations. As highlighted by
one informant – “It [flood] was in lower and central Punjab side, closer to Multan side, […]
we have 70 percent of our farmers from this region” (FO2-P3). Figure G.1 highlights the full
scale of the disaster; the red circle shows the areas mostly affecting the operations of FO2.
Upstream SC disruption – FO2 had to relocate some of its collection centres (chilling
centres) that were close to the flood-affected area. This resulted in various
operational challenges in procuring raw milk from farmers. For example, “we [FO2]
used other sources […] like a small boat to transfer the [raw] milk” (FO2-P4). Despite
these activities, the supply of raw milk and the production schedule were severally
affected and eventually became a significant bottleneck for the downstream SC
partners.
“We [FO2] were mostly affected by the flood in 2010. [….] We define loss to
[FO2] in which we suffered a huge loss in [raw] milk supply and also a high
number of livestock fatality. So the 2010 one was the major in terms of both
aspects.” (FO2-P4)
o Transport – The flood severely affected the physical infrastructure, such as roads
that affected FO2’s transport operations, both inbound and outbound. For
example, one informant explained that, during the first few days, the evacuation
process was affected by the infrastructure damage – “We then tried to evacuate
and help our farmers, but due to road closer and infrastructure damage, we were
unable to move many of the farmers” (FO2-C1-P1).
o Low Quality (raw milk) – The whole situation resulted in low productivity from
the farmers and affected the quality of the raw milk. This was directly related to
the unhygienic environment, mainly because of extreme floods and rainwater,
which remained for many weeks after the flooding season was over.
369
“During 2010 flood, we faced a major issue in procuring high-quality milk, and
we had to reject many supplies just because of the low quality.” (FO2-P3)
Downstream SC disruption – The low production volume adversely influenced the
operations of downstream SC partners. As stated by one participant “It [flood]
actually hampered the production of [FO2’s product] and created a major shortage of
our products in the market” (FO2-P3). Furthermore, it resulted in stock-outs, which
adversely affected the sales targets of FO2 for a short time.
“I guess it was 15 to 20 days that we experienced huge stock-outs in the
market. It was not like that we stopped producing, but the milk supply was
low, and it resulted in low production level at the factory, and then it trickled
down to the distribution network.” (FO2-P3)
o High demand – During such natural catastrophes, essential food items become
staple especially during the initial response and recovery stage. Coupled with the
usual surge in the summer season, the 2010 flood presented a high demand for
milk products especially UHT and powdered milk with longer shelf life, which
created extra pressure on FO2.
“During these situations [floods], people actually switch to UHT milk as it lasts
longer. […] [As] during floods, people usually do not get supply [of fresh milk
from traditional milkmen] [….]” (FO2-C2)
2. FO2’s Response
FO2’s actions to deal with the 2010 flood can be categorised into three groups:
FO2’s internal response
FO2’s supply-side response
FO2’s buyer-side response
2.1. FO2’s Internal Response
FO2 got the first signs of unusual rainfall and flash flooding around mid-July 2010, which was
before the start of the monsoon season. This communication came from relevant functions
or personnel dedicated to monitoring weather on a daily basis. FO2 also had pre-established
linkages with the relevant department, PMD, for such updates. As highlighted by the Dairy
Supply Manager (FO2-P1), based on the forecast, FO2 ran various analyses to determine the
actual impact on its SC operations. For example, FO2 analysed which areas were likely to be
affected by the severe weather conditions, which could then impact its suppliers’ and
distributors’ networks. This information was then communicated to the relevant
departments such as the milk supply, SC department, and planning teams.
The relevant department then quickly analysed the impact on its operations, e.g., the milk
supply department determined the possible impact on the company’s chilling centres and
the farming community. Similarly, the planning team determined the possible impact on the
downstream SC. Based on the possible impacts to FO2’s SC operations, various anticipatory
370
measures were taken, such as early execution of the flood contingency plan and early
evacuation and relocation of the company’s chilling centres. These measures are discussed
further later in this section.
Though the heavy rainfall across the country was forecast before the season, the actual
scale of rainfall and flash floods superseded all the early anticipation. In the last week of July
and in August 2010, the country received its highest amount of rainfall, resulting in major
flooding in almost every part of the country. In a holistic picture, FO2’s response can be
grouped into immediate, medium and long-term responses.
Immediate response (first few days to a couple of weeks) – The immediate response
from head office to all regional offices was to ensure the safety of the people. The
priority for the first few days was to ensure the safety of the field teams and staff at
regional offices and chilling centres, since they were closer to or in flood-affected
areas. Some chilling centres were evacuated. However, the scale of the flood
exceeded early forecasts. Therefore, during the flood period, the company also had
to relocate a few of its other regional offices. During the first few days, FO2 regularly
communicated with the PMD for the latest weather updates, which enabled it to
continuously determine the potential impact on its SC. Based on the analysis, all
relevant teams were regularly kept informed. Secondly, the planning team started to
determine the possible effect on raw milk supply and, consequently, the impact on
the production cycle. During the early stages, FO2 anticipated that the shortage was
going to be high. Therefore, the team started to look at backup plans, such as
procuring milk from other locations and using the buffer stock of powder milk (a
postponement strategy as highlighted in Chapter 4). In addition, the team analysed
the market situation, which indicated significantly higher consumer demand. Based
on this demand analysis, the procurement team was informed to initiate contacts
with the international suppliers to procure additional powdered milk. As highlighted
earlier (Chapter 4), FO2 had backup plans with multiple international suppliers,
especially with those suppliers who had additional capacity to meet a sudden spike
in demand. All these activities were part of the immediate response that lasted for a
couple of weeks.
Medium-term response (weeks to months) – The team initiated backup plans for the
majority of its bottleneck operations in the initial stages. However, the scale of the
floods increased significantly in the following weeks. The significant impact of the
floods remained in the upstream SC, where losses of the farmland, livestock deaths
and displacement of the company’s farmers caused a major bottleneck. Additionally,
the flood-affected road infrastructure resulted in transport challenges for both FO2’s
upstream and downstream SC operations. All this ultimately resulted in a shortage of
FO2’s dairy products in the market. To resolve the situation, FO2 started various
short-term operational changes to meet the challenges. For example, the company
started prioritising the flow of finished products to its downstream SC partners. The
planning team determined, based on historical analysis, various SC partners that

371
were critical for FO2’s sales and profitability. Based on this analysis, the company
decided which channel(s) to prioritise more than others. On the other hand, the
procurement team worked with its international suppliers to expedite shipping.
Various fast transport methods were used to ship raw materials from the port to
FO2’s factory. Though, FO2 experienced immediate shortages, ultimately the
situation started to ease two months (estimated) after the flooding.
Long-term response – FO2 improved various operations in response to this disaster.
First, various teams from each department worked on the shortcomings and the
lessons from the situation. For example, the dairy supply team worked with its
farming network in areas less prone to flooding and started to work with farmers
who had extra capacity. After the 2010 flood, the team started to run simulation or
mock exercises to test the flood contingency plans, which were not rigorously tested
before the 2010 flood. For example, the team created a deliberate shortage of raw
milk supply in one region to test its suppliers (farmers) from the backup region on
their readiness and quick response.
2.2. Supply-side Response
A vital part of FO2’s upstream SC is its farming community. Notably, during this kind of
natural disaster, the farming community is one of the most vulnerable parts of FO2’s SC.
FO2 initiated various actions, both pre- and post-disruption, to assist its farmers. For
example, before the floods, the company issued pre-warning of excessive rain and flash
floods to its regional offices. Subsequently, the field team communicated the warning
message to the farmers.
In response to the pre-warnings, two main activities were initiated. Staff at chilling centres
(regional offices) were informed to move the critical resources to alternative locations. As
highlighted by the dairy supply manager (FO2-P1), the reallocation of chilling centres was a
relatively easy process because of pre-defined procedures. Therefore, many of the
company’s chilling centres were evacuated and relocated to pre-determined alternative
locations.
Similarly, the field team in various rural areas, communicated with the farming community
regarding a possible flood. Various methods of communication were used to convince the
farmers to relocate to a safer location. For example, the field team used conventional ways
to communicate with the farmers, such as announcing the flood news in mosques, which is
considered an authentic, quick way to reach a large population. At this stage, field managers
worked with local authorities, such as police and local officials, to help farmers to move
their livestock and families to safe locations.
Though the early evacuation saved many lives (NDMA, 2010a), the scale of the flood was
never anticipated to be as extremely devastating. Therefore, it started to affect much of the
population, livestock, crops and infrastructure. In response to this, FO2 increased the scale
of its initial response and flood contingency actions.

372
FO2 activated its flood contingency plan and took immediate action during the first few days
of flooding in collaboration with various upstream SC players. The following points highlight
the initial response:
Various teams were formed for various functions, out of which the field team was
responsible for all the response activities at the upstream SC.
The field team worked with its farming community to temporarily reallocate to a
safer location.
During the relocation, FO2 helped its farmers arrange transport and provided them
with temporary shelter. FO2 used its farming community that was safe to provide
transport and temporary shelter to those who were affected by the flood. As
reported by the Dairy Supply Manager (FO2-P1), “We actually have connections with
the local landlords and other farmers, [those] who actually own tractors [and were at
a safe location away from the riverbed]. So we requested [them] to move the farmers
affected by the flood to the safe areas.” This collaboration helped the farmers share
shelter for their livestock and enabled them to provide milk continuously to the
company.
During the first few days, farmers faced problems of animal diseases, lack of shelter
and fodder for their livestock. FO2 helped its farmers with the supply of free
medicines and vaccinations and assisted them in procuring fodder.
All these activities were performed with the help of NDMA, PDMA and DDMA’s larger
response team. FO2’s rescue and initial response continued during the heavy rain and the
flood season. Once the flood waters started to normalise and the land started to dry, FO2
initiated rehabilitation processes at its chilling centres and with its farmers. FO2 again
helped its farming community to return to its pre-disruption location. In addition to the
critical support highlighted above, during the rehabilitation stage, the company helped its
farmers in various avenues such as:
The badly flood-affected farming land resulted in significant financial losses for
farmers. To assist its farmers in their financial difficulties, FO2 contacted various
suppliers to purchase seeds and fertilisers (bulk buying) and provided its farmers
with a subsidised rate compared with the market rate.
Additionally, flood damaged the critical infrastructure of various farmers. FO2 helped
them with all necessary support to rebuild their infrastructure. This help involved
financial support and construction-related activities.
During the flood, many farmers lost their livestock. The company provided financial
support, such as loans and advance payments, to their farmers to enable them to
survive and return to normal operations.
These rehabilitation or recovery efforts remained with the farming community for many
months. In addition, FO2 analysed the various vulnerabilities of its regional offices and milk
collection centres. Based on the analysis and lessons from the flood, FO2 permanently
373
relocated various regional offices or chilling centres from flood-prone areas to a safe
location. FO2 also shared its lessons with its farmers and suggested they relocate to areas
away from the river bed. As shared by the milk supply manager, farmers who opted for this
offer to relocate were the ones who benefited most, since the country has seen various
flood events since 2010.
2.3. Buyer-side Response
As highlighted in Chapter 4, FO2’s downstream SC consists of distributors, wholesalers and
retailers. In a natural catastrophe, distributors are the ones facing the first impact in FO2’s
downstream SC. During this disruption, the sudden surge in demand and lower supply for a
short period created significant pressure on FO2’s distribution network. This demand surge
originated from two channels. First, the usual customers’ demands during summer (June-
August) and the various relief agencies started to demand dairy products (especially milk
powder). This high demand was not limited to FO2; it impacted all other dairy companies in
the country.
“The scale of the flood that happened in 2010 was unimaginable. [FO2] was not the
only one who was affected by this disruption, but everyone else got affected by that.”
(FO2-P3)
The company initiated various response strategies to combat these challenges. They were:
Like the upstream SC, for the downstream SC the company initiated its flood
contingency plan. A dedicated team of field managers (key account managers) were
responsible for handling the response activity of the distribution network.
During the pre-warning stage, FO2 tried to despatch the maximum possible finished
goods to its distributor centres, which enabled them to have few days extra cushion.
Similarly, distributors tried to transfer the maximum amount of inventory to its
buyers (wholesalers & retailers).
In addition, distributors usually hold a certain amount of buffer stock, pre-defined by
FO2. On average, every distributor is required to hold seven days of buffer stock.
During the first few days, the delayed shipments did not affect their operations.
FO2 rationalised its delivery operations. Distributors who were more critical to FO2’s
business were given priority compared with others. Secondly, FO2 made sure that it
covered all distribution channels rather than focusing only on one channel. The same
strategy trickled down to the retailers. All these rationalised allocations were quickly
planned, because of the historical information provided by the company’s IT system.
Secondly, during delayed shipments and stock outs, FO2 continuously analysed the
stock level at each distributor, which enabled it to reallocate stock between
distributors.
Compared with the farming community, FO2’s distributors have relatively decent
financial muscle, which enabled them to go through these difficult situations easily.
As highlighted by the key account manager (FO2-P3), “they [distributors] have the

374
financial muscle to cover that up”. Secondly, a typical distributor deals not only with
FO2’s dairy operations, but also offers services for other products from FO2 and from
other companies. This enables distributors to focus on other products during a
shortage in one product. So, product diversity and financial strength enabled
distributors to absorb the challenges caused by this disruption.
In conclusion, FO2 faced challenges at both the upstream and downstream levels of its SC.
However, various actions by the company helped it and its SC partners deal with this
disruption.
3. Analysis of D5 – The 2010 Flood
The previous section summarised the 2010 flood and its impact on FO2’s SC. In addition to
FO2, data was collected from various FO2 SC partners such as farmers, FO2’s chilling
centres, distributors, retailers and other dairy producers (FO2-C1 & FO2-C2). News feeds
and government reports were used as secondary sources.
This section analyses the data collected from all the stakeholders and secondary sources.
The analysis presents various themes that enabled various participating organisations to
deal effectively with the disruption. In the analysis various actions presented
counterproductive responses and hindered the adequate response. What and how some
strategies led to a quick response and recovery and others were counterproductive are
analysed in this section. The analysis of this case led to the following SC resilience elements.
3.1. Risk Management (a Flood Contingency Plan)
This case shows the importance of having an effective risk management plan. It defines the
activities and actions to be engaged in a potential risk or vulnerability. The analysis
highlighted that various organisations (FO2, FO2-C1, FO2-C2, FO2-R1 and FO2-R2) put a
strong emphasis on having pre-defined risk management plans.
From FO2’s perspective, the company immediately activated its flood contingency plan,
which outlined a pre-defined approach to deal with such an emergency. For example, “if a
flood strikes and affects the areas in which we have chillers, then we have already identified
in the plan that in which areas we would be shifting our chillers” (FO2-P1). For other
operations, such as manufacturing, distribution and milk collection, the company has similar
pre-defined procedures and protocols in case of an emergency such as a flood.
The risk management plan also defines various risk anticipations or early warning tools such
as weather forecast analysis that provides the company advance warning of an upcoming
event. In the 2010 flood, the flood contingency plan helped FO2 to implement various risk
reduction activities. For example, the early warning system allowed the company to engage
in an early evaluation of its most vulnerable operations (i.e., FO2’s chilling centres).
Secondly, once the scale of the flood indicated a real catastrophe, the pre-defined risk plan
enabled FO2 to quickly activate various functional/department teams to engage in response
375
activities and provide adequate management and leadership during the disruption. Like
FO2, other organisations (FO2-C1, FO2-C2, FO2-R1, & FO2-R2) indicated a similar emphasis
on pre-defined risk plans, which enabled quick anticipation and response in this disruption.
Two points can be inferred, first a risk management plan includes pre-defined procedures
and protocols, team structures and early warnings systems, which comply with the typical
risk management process (also suggested by various authors such as Ho et al. (2015),
Manuele (2005) and Tummala and Schoenherr (2011)). Most importantly, this case
highlights that risk management tools positively influence an organisation’s ability to quickly
respond to a risk, hence enhance SC resilience; also identified as a factor of SC resilience by
Pettit et al. (2010).
In addition, various SC partners, such as farmers, distributors and retailers, mostly showed
limited understanding of formal risk management. However, many took anticipatory
measures and quickly responded and survived the 2010 flood. Further analysis highlighted
that though these SC partners had very limited knowledge of risk management, FO2
established centralised risk planning for their less developed SC partners. For example, on
behalf of FO2’s farmers, “we [FO2] have identified the ways and procedures to shift the
animals of the farmers" (FO2-P1). FO2 engaged in various other risk management exercises
with its SC partners. This indicates that all of those who quickly anticipated, and responded
relatively well to this disruption relied on pre-defined risk management practices, either by
in-house risk management or endorsed by the hub-firm, such as FO2 or FO2-C1. This
supports earlier assertions that risk management tools positively influence an organisation’s
ability to respond to a disruption quickly. Further discussion on the role of a hub-firm in
developing and promoting risk management practices is elaborated in Section 3.4.
3.2. Situational Awareness and Quick Decision Making
This disruption presented a high degree of uncertainty for all stakeholders, especially during
the first few weeks of the flood. For everyone, the environment began chaotic, as no one
expected such country-wide devastation. Therefore, all stakeholders, including FO2, needed
to understand the situation and tailor the response accordingly. This section highlights who
were involved in understanding the situation, and presents the various requirements of
adequate situational awareness. Additionally, the analysis also showed various hurdles that
intrude on an adequate situational awareness.
This disruption was not limited to FO2; it was a country level catastrophe. Therefore various
stakeholders were involved in information gathering, analysis, decision making and
communication of critical information. From the dairy industry perspective, the broader
level situational awareness was performed by the relevant departments, such as NDMA,
PDMA and DDMA. For example, the pre-monsoon conference was held on 28 June. It
involved all the relevant government departments in reviewing weather forecasts and
preparatory measures for the upcoming monsoon season (NDMA, 2010a). Similarly, based
on the early forecasts, NDMA, PDMA and DDMA engaged in early precautionary measures,

376
such as early evacuation and flood communication to relevant stakeholders. From FO2’s SC
perspective, most information gathering, processing and communication to relevant SC
partners were handled by FO2. Therefore, FO2 was considered a hub firm for FO2’s SC. A
similar approach was observed with the other dairy players interviewed (FO2-C1, FO2-C2).
At the lower or functional level, situational awareness was noted at the functional team
level, which was formed as a result of the flood contingency plan. It was noted that these
teams were essential to provide leadership and direction in effectively managing this
disruption.
Additionally, analysis showed that FO2’s situational awareness involved gathering
information from relevant stakeholders, such as PMD, for the weather forecasts. This was
followed by comprehension and projection of information, which involved scenario planning.
The situational awareness was similar as discussed in previous disruptions and complies
with the process defined by Endsley (2012). This analysis helped FO2 to take quick decisions,
such as the company communicated with its regional offices and farming community for an
early evacuation from potentially vulnerable areas.
“We get regular updates from Pakistan Meteorological Department. […] Based on
the information we receive, they [concerned department] then run various analysis to
understand how the weather would going to impact us. […], we prepare for the
worst-case scenario" (FO2-P1)
Analysis of this disruption showed another essential aspect of situational awareness, which
describes why some organisations do not engage in situational awareness, especially in
comprehending and projecting information. The analysis showed that SC partners who
ignored the early information or pre-warnings of the flood were the ones who suffered the
most. This trend was most noted in less knowledgeable SC partners such as farmers and
small retailers; these players especially lacked formal risk planning. Most of the SC partners
who ignored the early warnings or did not act promptly tended to show a state of denial
regarding the oncoming crisis or believed that it would not impact them. This is referred to
as normalcy bias (Omer & Alon, 1994), a mental state that leads an individual or
organisation to be under the illusion that the previous normal situation will continue, which
results in undervaluing a probable disruption. FO2 highlighted that many of its farming
community who were adversely affected by the flood were the ones who held such a
mental state that it would not affect us, because it did not affect us in the past. Therefore,
those farmers did not act during the early evacuation. The findings showed that a lack of
previous experience and local cultural beliefs were the major reasons behind this mental
state. For example, according to FO2, many farmers believed that it was an act of God and
no one can do anything about it.
"We did not have any idea [about these situations], it is just a GOD's act that we
cannot envision and plan for. We just thought that it would all be fine." (FO2-S2)

377
"Actually, all the warnings of rainy season and flood was announced in the news, but
we thought that it would not affect us." (FO2-R3)
"You know we used to listen every year that there might be flooding, but there were
none in recent years. So, we thought that it would also be same. But we were wrong
[this time], and then we got the biggest flood in our history." (FO1-C2-D1)
This mental state blinds an individual or organisation to acting fast in the face of a
disruption. To reduce this mental state, FO2 engaged in various simulation exercises and
training with its SC partners after the disruption. It can be seen that previous experience,
continuous training and simulation/mock exercises can avoid an individual or organisation
being in a false mental state about a potential disruption.
In conclusion, this disruption highlighted various levels of situational awareness such as at
national, SC and functional levels. Secondly, situational awareness involves gathering of
relevant information, comprehending it and projecting future outcomes. Finally, this leads
to quick decision making. Lastly, normalcy bias can be a major hurdle in envisioning a
possible disruption and, therefore, people may underestimate the scale of a disruption.
3.3. Anticipatory Measures
Before the 2010 monsoon season, the authorities communicated a flood advisory to various
stakeholders to take early measures, such as the mobilisation of resources and early
evacuation in highly hazardous areas (NDMA, 2010a). Based on the early situational
awareness, FO2 and various other organisations took anticipatory measures. It was noted
that organisations that took anticipatory measures were the ones who benefited most when
flooding started. For example, FO2 directed its regional offices that were more vulnerable to
relocate in advance. Similarly, the company helped its farmers with early evacuation. For
downstream SC partners, the company transferred additional inventory to its distribution
channels.
Similarly, FO2’s competitors were analysed; they were a bit delayed in some of anticipatory
measures. For example, downstream SC partners (FO2-R1 & FO2-R2) who were connected
with FO2’s competitor (FO2-C1), explained a delayed response from the company compared
with FO2. Limited anticipatory measures by FO2-C1 led to quick stock-outs for its products
in the market compared with FO2’s products. Therefore, it can be concluded that
anticipatory measure before a disruption provide a company with a quick response and
extra time during a disruption to engage in alternative actions.
Lastly, a major question here is: What makes an organisation to engage in these anticipatory
measures? It was determined that quick situational awareness lead to appropriate actions,
such as early evacuation and other anticipatory measures. Therefore, it can be inferred that
situational awareness leads to quick decision making, which includes various anticipatory
378
measures; these anticipatory measures enable an organisation or SC to reduce the impact of
a disruption.
3.4. Collaboration with the Key Stakeholders
Collaboration among key stakeholders was noted as a keystone during this disruption. From
FO2’s perspective, it involved understanding its role in the broader network and then
establishing collaboration with key stakeholders. From FO2’s SC perspective, FO2 glued
together all the SC partners and played a guiding role both pre- and post-disruption. This
section analyses what enabled FO2 to establish such effective collaboration, especially
during a disruption. Secondly, the analysis highlights various collaborative activities that
enabled FO2’s SC to respond and recover from this disruption.
The analysis suggested that FO2 had a good understanding of its SC network, especially the
constraints of its SC partners, such as farming community, distributors and small retailers. It
was noted that these constraints were linked to contextual factors, such as operating in
Pakistan where the dairy industry is a relatively underdeveloped sector. SC partners such as
farmers, distributors and small retailers have less knowledge or understanding of risk and
crisis management, which undermines their ability to respond to a disruption. It was noted
that FO2 had a good understanding of these constraints and factored them into its planning.
For example, various SC and risk management strategies, such as the level of buffer stock
for its downstream SC partners, were centrally directed from FO2’s head office. These
collaborative activities also included involvement with other key stakeholders, such as local
authorities and NGOs.
Secondly, from FO2’s SC perspective, various farmers and other SC partners (FO2-S1, FO2-
S2, FO2-S3, FO2-S5, FO2-D1, & FO2-R3) highlighted the significant role played by FO2 in the
flood response and recovery. Various farmers and distributors showed the highest degree of
reliance on FO2’s directions during the normal business environment as well as during such
natural disasters. Therefore, it can be inferred that FO2’s network understanding enabled its
SC to better prepare and respond to this disruption. Secondly, FO2 played the role of a hub
firm and handled all communication and decision making for all the key disruption related
decisions for its SC partners, which led to better management of the disruption.
Apart from this, major collaborations during this disruption were highlighted by various
informants. The findings suggested that information sharing, especially crisis
communication, led to early management of the disruption, such as early evacuation. Crisis
communication involved sharing the pre-warnings, as well as valuable information after the
disruption. The company used a local mode of communication, announcements in a
mosque, which enabled fast communication to the vast network of farmers.
In addition, joint problem solving was noted as a key collaborative activity. Many farmers
worked together and shared resources, especially during the initial phase of the disruption.
For example, farmers faced a significant issue in the transport of livestock and faced

379
difficulty in finding dry land. In initial response phase, many farmers, who were at safe
locations, accommodated those who were in affected areas. This enabled a number of FO2’s
farmers to survive the initial impact and return to normal operations after the disruption.
It was also analysed that the collaborative efforts between farmers and distributors were
moderated by FO2. For example, the field teams connected its farmer communities with
each other and attributed their role to “connecting the dots” (FO2-P1). The key account
manager (FO2-P3) highlighted that during a disruption like this, the company rationalises
the product stock across its distribution network, which means sharing additional buffer
stock between distributors. Therefore, it can be inferred that mutual dependency of SC
partners on its hub firm (FO2) enables collective problem solving between competitors (SC
partners).
Lastly, the analysis showed the importance of various supplier development programmes.
For example, FO2 provided financial support, such as loans and advance payments, to its
farming community, which enabled the farmers to survive and quickly return to their normal
operations after this disruption.
In conclusion, network/SC understanding and understanding local constraints enabled FO2
to establish effective collaboration during this disruption. Secondly, various activities such as
crisis communication, information sharing, joint problem solving, resources sharing, mutual
dependency and supplier development programmes enabled the SC to respond effectively
and recover from a disruption.
3.5. Operational/SC Re-engineering
The analysis indicated that FO2 modified various operational and SC processes, which led it
to recover and achieve normal business operations quickly. This was referred to as
operational/SC re-engineering also highlighted in the previous disruptions (D1, D2, D3 and
D4).
First, the company quickly reallocated various operations (such as chilling centres) to the
alternative locations. It was determined that pre-defined processes and systems, a risk
management plan and updated IT systems enabled FO2 to adjust its operations quickly. For
example, FO2 quickly transported maximum finished products to its distribution network
and relocated its finished products between distributors. The updated IT system enabled
FO2 to quickly determine stock levels and optimal requirements at each distributor. As the
flood affected production for a short period, the company rationalised its business with its
distributors based on historical data. FO2 also engaged in various adjustments for its
upstream SC operations, which were supported by pre-defined processes and systems in its
flood contingency plan.
Additionally, it was noted that buffer stock or redundant resources bought extra time for
FO2 to plan and execute alternative strategies. Based on this extra time, the company used
380
an alternative production process, also referred as a postponement strategy, to increase its
production. This strategy helped FO2 to meet the additional demand during the recovery
stage.
In the long-run, the company analysed its performance during this disruption. Based on gap
analysis, the company improved many of its operations to better deal with future
disruptions. For example, the company introduced various in-house improvements such as
increasing its supplier network to areas less prone to flooding and relocated its chilling
centres permanently to safe locations. Similarly, after this disruption, the company
increased the number of its backup suppliers especially those who can quickly supply raw or
powdered milk during such disruptions. These improvements also indicate FO2’s learning
attitude.
It can be concluded that pre-defined processes and systems and updated IT systems enable
an organisation to quickly adjust its operations during a disruption. Secondly, both
redundancy in resources (such as buffer stock) and flexibility in operations (such as
postponement) enable a company to quickly and effectively deal with a disruption, thus
achieve SC resilience, which has been highlighted by various scholars (Craighead et al., 2007;
Pettit et al., 2010; Sheffi & Rice, 2005; Zsidisin & Wagner, 2010). Lastly, gap analysis and
learning from experience enables an organisation to invest in more resilient SC operations.
3.6. Supportive Organisational Culture
The analysis indicated that the supportive culture of FO2 was a key facilitator for the other
SC resilience elements discussed above. For example, the caring culture of FO2 enabled
relevant staff to work closely and openly with its SC partners, such as farmers and
distributors. It was also found that FO2’s culture was an outcome of a business-as-usual
relationship with its SC partners. Key activities involved in developing such a productive
culture are:
To develop a cohesive culture within the organisation, top management in the
recent years engaged in various cross-functional training sessions. Primarily, this
cross-training allowed various teams to understand the impact of decision making on
other departments during a disruption. The FO2 informants (FO2-P1 & FO2-P2)
highlighted that top management support and cross-functional training enabled
them to be more open and to make informed decisions during disruptions.
Secondly, to embed these practices in the culture, FO2 regularly engages in
simulation exercises. For example, the company tests its risk management plans,
such as its flood contingency planning, in these exercises.
The relevant teams were appropriately empowered and had top management
support to make quick decisions at runtime and to adjust the response as per the
situation.

381
Lastly, the 2010 flood enabled FO2 and its SC partners to analyse and improve their
operations. This showed learning and continuous improvement behaviour, which led
FO2 to develop and improve various in-house and SC operations to deal with the
future disruptions.
4. The 2010 Flood – Conclusions
In conclusion, analysis of this disruption presented various SC resilience elements that
summarised as follows:
A risk management plan
A crisis management team
Situational awareness and quick decision making
Collaboration
Operational/SC strategy (pre-existing)
Operational/SC re-engineering
A supportive organisational culture
A learning attitude

382
Appendix H. Detailed Case Description - FMD (D6)
D6 – Case Description
Foot and mouth disease (FMD) is a viral, dreadful and acute infection (Alexandersen &
Mowat, 2005) that results in severe illness in cloven-hoofed animals such as buffalos, goats,
sheep, pigs, deer and cows (Nawaz, Arshad, & Iqbal, 2014). FMD is a globally recognised
issue that often results in epidemics. If not contained, it could cost significant losses to both
individual farmers as well as the whole country’s economy. In recent years, an outbreak of
FMD was recorded in the UK in 2001, which costed UK’s agriculture and food industry
around £3.1 billion (Thompson et al., 2002).
In Pakistan, though no countrywide or region-wide outbreak has been reported recently,
every year it posts a challenge by affecting small pockets of the country. With its regular
nature and lower impact, from FO2’s perspective, it was considered an operational
disruption.
1. Background Information – FMD
FMD, a viral and highly contagious disease, is caused by an RNA virus belonging to the
Aphthovirus genus (Jamal et al., 2010). FMD affects animals’ health resulting in high fever
and blisters around mouth and hooves. The disease results in severe aches, depression and
abnormal salivation, which makes affected animals hesitant to stand or walk. Although FMD
is not directly a life-threatening disease, it affects the milk production significantly.
Once infected by FMD, the symptoms start to appear within a few days (usually 2-15 days).
The disease survives in affected animals’ saliva, breath, urine and in other defecations,
which makes it highly contagious. Additionally, the virus can sustain in the surrounding
environment and contaminate facilities for many months provided there are suitable
conditions. Therefore, the disease can be transferred from affected animals to other
animals in various ways (APHIS, 2013).
Although the disease is a global concern, a few countries such as Australia, New Zealand,
North America, Chile and some European countries either do not have it, have eradicated
entirely or controlled to a large degree. Whereas various regions, such as Asia (including
Pakistan), Africa and South America, are more prone to outbreaks of FMD (APHIS, 2013).
Most countries vulnerable to a breakout of FMD are either developing or under-developed
countries, which makes it challenging to eradicate the disease. Full elimination requires
enormous resources, educated and skilled personnel, tightly control livestock movement
and, most importantly, region-wide efforts (Anjum et al., 2004). In Pakistan, various efforts
have been made to educate and train farmers control this disease. However, in the last 10
years, numerous FMD cases have been recorded throughout the country. Table H.1 presents
the number of FMD cases recorded from 2013-15 (FAO, 2013a, 2013b, 2014b, 2014c, 2015a,
2015b).

383
Table H.1 – The number of FMD cases recorded in Pakistan between 2013 and 2015
Year Period No. of FMD Cases
2013 January-March 595
July-September 468
2014 January-March 1588
July-September 205
2015 January-March 364
April-June 152
To combat FMD, many local and international agencies operating in Pakistan, such as Food
and Agriculture Organization (FAO) from the United Nations, have allocated substantial
resources and funds to control widespread occurrence of the disease. In line with these
efforts, FAO, with the collaboration of Ministry of Food, Agriculture and Livestock of
Pakistan, has initiated various projects such as the “Progressive control of FMD in Pakistan”
and “Support for Emergency Prevention and Control of Main Trans-boundary Diseases in
Pakistan” (Anjum et al., 2004; FAO, 2014a). These projects initiated formal disease reporting
systems and up-graded old information systems to better track the disease across the
country. Introduced 15 years ago, this project produced data tracking the spread of FMD in
various provinces, regions and towns. Figure H.1 shows the number of FMD cases in various
regions throughout the country in January-March 2014 (FAO, 2014c). This project provided
the authorities such as government, dairy companies and NGOs, a better understanding of
FMD. This ultimately led to the development of training programmes and warning systems
to control and eradicate the disease (Anjum et al., 2004).
Figure H.1 – Reported FMD outbreaks in Pakistan January-March 2014, Source FAO (2014c)

384
These projects initiated a positive momentum to deal with FMD effectively. Regions and
farmers involved in these programmes showed great progression in adopting best farm
practices, which directly reduced milk production losses resulting from FMD. Most
importantly, efforts were made to enhance food security in the dairy sector (FAO, 2014a).
1.1. Countdown to Disruption
Despite various efforts by the government and various agencies, FMD is a major disease,
significantly affecting the livelihoods of the country’s farming community. As shown in Table
H.1, many cases of FMD throughout the country have been recorded; luckily there has been
no countrywide outbreak recorded recently. From the interview data, it was established
that FMD substantially affects the farming community. However, the impact on individual
dairy processing companies remains minimal. Therefore, this study considers FMD an
operational disruption as highlighted by FO2’s informant:
“This is not like a flood, […] we have these challenges every year […] it is not like
countrywide or region-wide breakout.” (FO2-P4)
As there was no particular reference point, a general timeline was used to understand the
impact and FO2’s response to FMD. As described by all informants, an outbreak of FMD
closely relates to various environmental factors, such as temperature, humidity level and
farm conditions. Therefore there is more chance that it will spread at specific times of the
year, such as during the flood season.
“Actually, the major plan that we have is that during a certain time of the year this
disease has more chances to outbreak” (FO2-C1-P1)
Usually, the dairy companies (FO2 & FO2-C1) and other local authorities engage in various
precautionary actions before particular seasons to prevent the issue. For example, this
might involve training farmers and vaccinating the animals before the start of a particular
season. FO2’s field teams, with the help of local authorities, use various techniques, such as
radio, announcements in local mosques and face-to-face communication, to communicate
early warnings to farmers.
FO2’s “disease contingency plan” provides guidelines on preventive measures and, for FMD,
vaccination is the only preventive measure. As highlighted by one informant, “Every year we
do the vaccination [of FMD] to all the farms prone to flooding, and that is usually before two
months of the flooding season” (FO2-P4). FO2 and other dairy companies have their own
field teams of veterinary doctors who provide free vaccination to their farming community.
However, informants from the participating dairy companies (FO2, FO2-C1 & FO2-C2)
reported that most of the time farmers show a non-serious attitude and delay vaccinating
their livestock before the season. Either because of the negligence of an individual farmer or
because of a highly contagious disease, the dairy industry has seen many FMD cases in
recent years.

385
1.2. Overall Impact of FMD
Usually, FMD results in operational challenges for both the farmer community and dairy
companies. These challenges put significant pressure on the community compared with the
individual dairy companies. The following points are the various challenges because of this
issue.
Operational Constraints
For FO2, FMD affects only day-to-day operational activities. As reported by one informant,
“For us [FO2] it is a usual thing that happens now every year especially during February and
March, and in our planning, we have done contingency planning to deal with these
situations, [however], for an individual farmer it could be a serious situation” (FO2-P4).
Its impact is a decrease in raw milk from the affected farmers or region. Usually, there are
minor changes in production schedules but, most importantly, it does not result in any
challenges for the company’s downstream SC, i.e., the distribution and retail network.
Resource commitment
Since, in recent years, FO2 has faced various FMD cases, therefore, to help the farming
community, the company budgets a significant amount of resources to prevent FMD and
assist its farmers. Both these efforts result in substantial investment of personnel,
vaccination of animals, and educating and training farmers.
Upstream SC
The data revealed that this disruption mostly impacts farmers. For example, it affects milk
production, which directly influences the profitability of an individual farm. Because of its
viral nature, one case of FMD at a farm threatens all other healthy animals. Additionally, in
the long-run, the productivity of an affected animal remains less than usual level (APHIS,
2013), which forces farmers to buy new animals in exchange for the affected animal.
“The major challenge what we face is that our milk output goes down significantly.
Which means that the company [the dairy company] would not pay for any of the
lost production output. That actually creates a lot of stress on the operational
expensive […]” (FO2-C1-S1)
2. FO2’s Response
From FO2’s perspective, FMD is one of many diseases that could affect its milk supply.
Therefore, like other disruptions, FO2 has a disease contingency plan that pre-defines
various protocols to carry out in case of this disease. FO2’s response can be grouped into
pre- and post-disruption responses.
Pre-disruption response – For FO2, the disease contingency plan mainly describes
various preventive measures required to avoid a disease outbreak. Based on various
input variables, such as weather conditions and season, the procurement and field
386
team communicate early warning signs to the farming community and encourages
farmers to opt for the preventive measures, such as free vaccination. FO2 also
collaborates with relevant local authorities, such as the government’s veterinary
staff and NGOs, on early communication and execution of preventive measures.
Post-disruption response – As highlighted above, if, despite FO2’s preventive
measures, various farmers experience FMD, it results in a few operational challenges
for FO2. Mainly, the disruption results in a slight decrease in raw milk supply. FO2
has an alternative production or sourcing strategy (backup suppliers and a
postponement strategy) that enables it to avoid a sudden shift in the raw milk
supply. Buffer stock in various points of the downstream SC also prevent a slight shift
in production.
3. Analysis of D6 – FMD
The actions and strategies that emerged from the analysis were labelled as SC resilience
elements.
3.1. Risk Management Plan (Disease Contingency Plan)
Like the previous disruption (D5), FO2 and FO2-C1 show the critical importance of risk
management plans. In this case, it is FO2’s disease contingency plan. The analysis indicated
that these pre-prepared contingency plans helped FO2 and its farming community to either
avoid or quickly deal with this situation.
In the disease contingency plan, pre-defined protocols and processes enable the relevant
staff to engage in precautionary measures, such as monitoring for early signs and
prevention measures before the disruption. Secondly, in an outbreak, the plan provides
guidance to relevant teams, such as the milk procurement or field teams, regarding the
various steps to take during these situations. A similar approach was found in the other
dairy companies that participated in the study (FO2-C1 & FO2-C2).
“We have around 40 diseases for which we have proper protocol and guidelines
regarding how to deal in case of a break-out and also on how to monitor like alerts”
(FO2-P1)
“Actually, there is a full guideline that we have here like this booklet that you can see.
[...] It details down all the procedures that we need to do in case of a disease spread
out” (FO2-C1-P1)
On the other hand, the farming community showed limited understanding of a predefined
and formal risk management plan. As described in the previous disruption, FO2 and other
dairy companies regularly share various risk management practices with their SC partners in
formal training sessions. Likewise, in a disease outbreak, FO2’s field team regularly meets
with farmers to advise them how to deal with the affected animals.

387
3.2. Situational Awareness and Anticipatory Measures
With FMD, situational awareness is similar to that of the previous disruption, in which FO2
and individual farmers first gather relevant information from their key partners. For
example, the farming community gathers information from the dairy companies (FO2 &
FO2-C1) and the government. The next process, comprehension and projection, during this
disruption was observed as relatively simple. For example, weather forecasts, seasonality
and historical disease data enable FO2 to take various anticipatory measures.
“In this case, we know, and we have historical data that certain disease breaks out in
certain season or time of the year. Based on the data we send alerts to the farmers”
(FO2-P1)
Based on the situational awareness, the major part of quick action includes anticipatory or
preventive measures. It was found that any lack or delay in executing preventive measures
leads to an outbreak of the disease. The major question is: Why do people not take
preventive measures? The analysis suggested several reasons including ignorance and lack
of knowledge or experience. For example, many farmers used to believe that this disease is
because of a random phenomenon and that one cannot do anything about it.
“We used to believe that it is just because of Allah’s (GOD) will and we cannot do
anything about. Most of us like 10-12 years back actually did not care about the
vaccination, and we used to just pray that it would not happens” (FO2-S1)
This indicates the mental state where an individual (such as a farmer) thinks that it would
not affect him, because it did not affect him in the past. This is the normalcy bias of an
individual or organisation (Omer & Alon, 1994) and it results in undervaluing a probable
disruption, as described for D5.
A key question here is: What one can one do to avoid normalcy bias? With experience and
FO2's supplier development programmes, the farming community has learnt about
precautionary actions.
In conclusion, it can be inferred that situational awareness leads to various decisions
including anticipatory measures that are essential to reduce the likelihood of this disruption.
Secondly, the normalcy bias is a major hurdle in the execution of anticipatory measures.
Finally, experience, training and supplier development programmes were noted as key
strategies to avoid normalcy bias.
3.3. Collaboration with the Key Stakeholders
FO2’s ability to establish a collaborative relationship with its farming community and with
other stakeholders was recognised as a key element to deal with this disruption. Like the
previous disruption, this section discusses what enabled FO2 to quickly engage in

388
collaborative activities, which follows the discussion on various collaborative activities
during these kinds of disruption.
The farming community in Pakistan, at large, is farmers with a marginal and limited
understanding of adequate farm practices. Since their inception, the major dairy companies
(including FO2 and FO2-C1) started a collaborative relationship with their farming network
and, over the year, this collaborative relationship led to an enhancement of farming
practices in the country. FO2’s ability to understand local constraints led to the
development of the collaborative relationship with its farming community. The farming
community (FO2-S1, FO2-S2, FO2-S3 and FO2-S5) highlighted the noteworthy role of the
dairy companies, especially FO2, in developing best farming practice in the country. The
collaborative activities mainly include supplier development programmes, which help FO2
educate farmers on various risk management practices.
Secondly, in case of a disease outbreak (such as FMD), FO2 communicates critical
information to its farming community to prevent the spread of the disease. Various farmers
highlighted that FO2’s early communication and preventive actions enable them to avoid
the spread of this disease. In addition to collaboration with FO2, various farmers also
collaborate with each other, especially during a disruption. It was noted that these collective
activities include resource sharing and joint problem solving, which enables farmers to
respond to the situation quickly.
In conclusion, understanding the SC network and local constraints led an organisation to
establish effective collaboration during both pre- and post-disruption. Secondly, early crisis
communication, resource sharing and joint problem solving enabled a SC to collectively
respond and recover from a disruption.
3.4. Operational/SC Re-engineering
Form FO2’s perspective, a disease outbreak (like FMD) leads to slight operational changes.
However, for an individual farmer it could represent major operational changes. For
example, this kind of disease outbreak results in a slight shift in raw milk supply. At the
upstream SC level, the company has some backups or multiple suppliers to manage a
sudden shift in supply. Secondly, to avoid any disruption, the company maintains buffer
stocks at various locations in the downstream SC. Lastly, a postponement strategy also helps
the company to manage a slight shortage of milk supply by using an alternative production
process.
From the farmers’ perspective, these situations lead to significant operational challenges.
For example, a disease outbreak requires a farmer to alter and adjust his normal operations
on the farm. Farmers (FO2-S1, FO2-S4 & FO2-C1-S1) who knew about adequate practices
were able to effectively deal with such a situation. The dairy companies (FO2 & FO2-C1)
have designed various supplier development programmes to educate and embed such
practices on first how to prevent the situations and how to deal with an outbreak.
389
“During these kinds of situation, our teams actually go to the individual farm to guide
them regarding all the safety procedures. So, we guide them and train them how to
handle the livestock" (FO2-P1)
Here, it can be concluded that multiple or backup suppliers, a postponement strategy and
buffer stocks enable an organisation to manage any shift in supply. Additionally, pre-defined
processes, institutionalisation of practices and training enable an organisation to quickly
adjust processes to the situation.
3.5. Supportive Organisational Culture
In this issue, a key aspect noted regarding the organisational culture was the learning
attitude and institutionalisation of practices among the operators and staff. It was
highlighted by FO2 and FO2-C1 that, over the years, the farming community has learnt from
experience and its mistakes. Therefore, many farmers have adopted practices to avoid
outbreaks of a disease in the first place and, in the case of FMD, farmers over the years have
learned adequate practices to deal with the situation adequately. The analysis suggested
that farmers who have shown a positive attitude to learn from experience were most
benefited in preventing this disease compared with those who lacked a learning attitude.
"We have also learned that in which season animals are more prone to these kinds of
diseases and then we do our vaccination accordingly." (FO2-S3)
Farmers who showed a learning attitude have significantly improved various aspects of their
operations, such as:
Implementation of preventive measures (pre-season FMD vaccinations)
Training staff to deal with affected animals
Investment in purpose-built facilities
Furthermore, these training sessions and learning experiences led to embedding these
practices in staff’s behaviour. During the interviews, it was observed that many farmers and
staff had implemented various best practices at their farms, which resulted in them avoiding
animal diseases, including FMD. It can be inferred that a learning attitude, staff training and
embedding practices in the culture lead an organisation to either avoid or manage a
disruption efficiently.
4. FMD – Conclusion
Overall, analysis of this disruption presented various SC resilience elements:
Risk management
Situational awareness
Preventive measures
Collaboration

390
Operational/SC strategy (pre-existing)
Operational/SC re-engineering
A supportive organisational culture
A learning attitude