Supplementary tables (posted as supplied by authors) · Assessment of trans fat measures . To...
73
Appendix 2: Supplementary tables (posted as supplied by authors)
Transcript of Supplementary tables (posted as supplied by authors) · Assessment of trans fat measures . To...

Appendix 2:
Supplementary tables
(posted as supplied by authors)
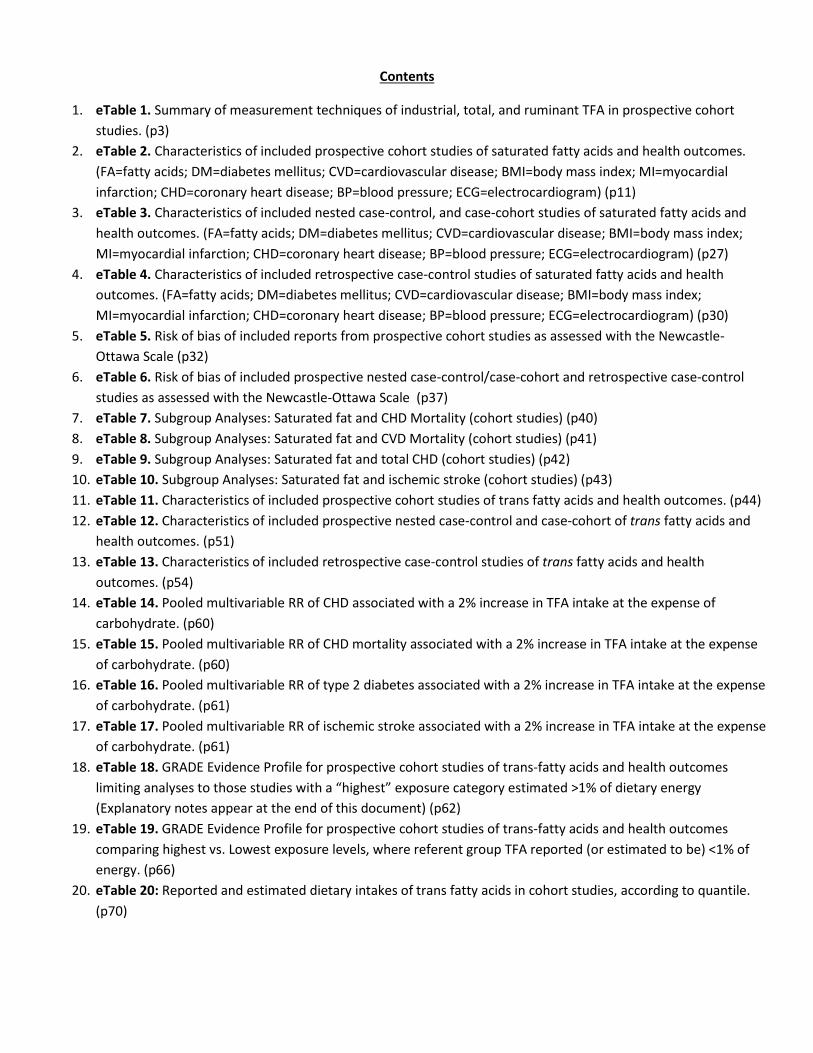
Contents
1. eTable 1. Summary of measurement techniques of industrial, total, and ruminant TFA in prospective cohort studies. (p3)
2. eTable 2. Characteristics of included prospective cohort studies of saturated fatty acids and health outcomes. (FA=fatty acids; DM=diabetes mellitus; CVD=cardiovascular disease; BMI=body mass index; MI=myocardial infarction; CHD=coronary heart disease; BP=blood pressure; ECG=electrocardiogram) (p11)
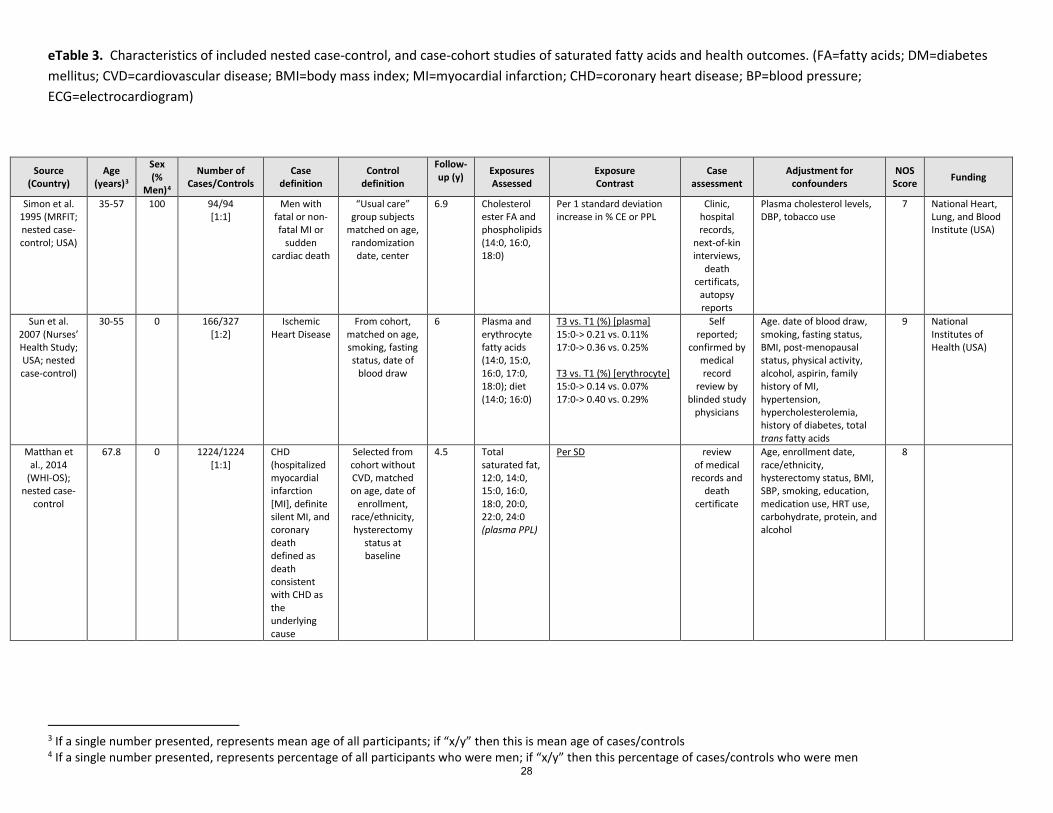
3. eTable 3. Characteristics of included nested case-control, and case-cohort studies of saturated fatty acids and health outcomes. (FA=fatty acids; DM=diabetes mellitus; CVD=cardiovascular disease; BMI=body mass index; MI=myocardial infarction; CHD=coronary heart disease; BP=blood pressure; ECG=electrocardiogram) (p27)
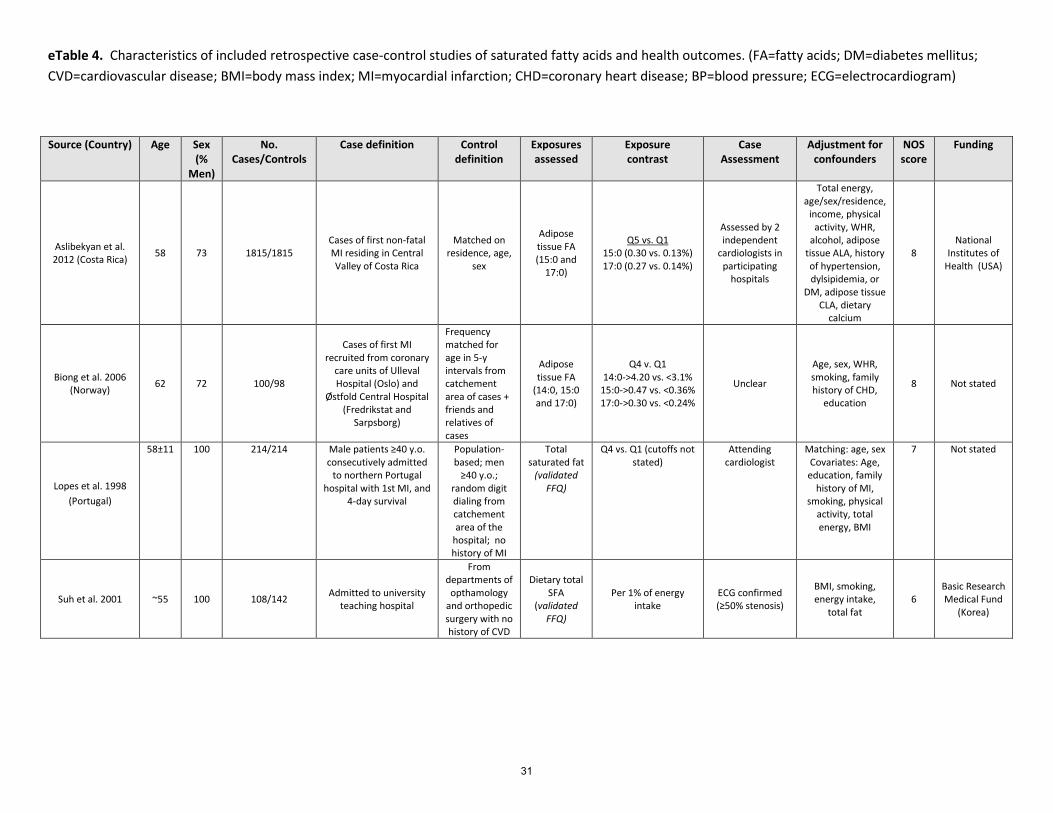
4. eTable 4. Characteristics of included retrospective case-control studies of saturated fatty acids and health outcomes. (FA=fatty acids; DM=diabetes mellitus; CVD=cardiovascular disease; BMI=body mass index; MI=myocardial infarction; CHD=coronary heart disease; BP=blood pressure; ECG=electrocardiogram) (p30)
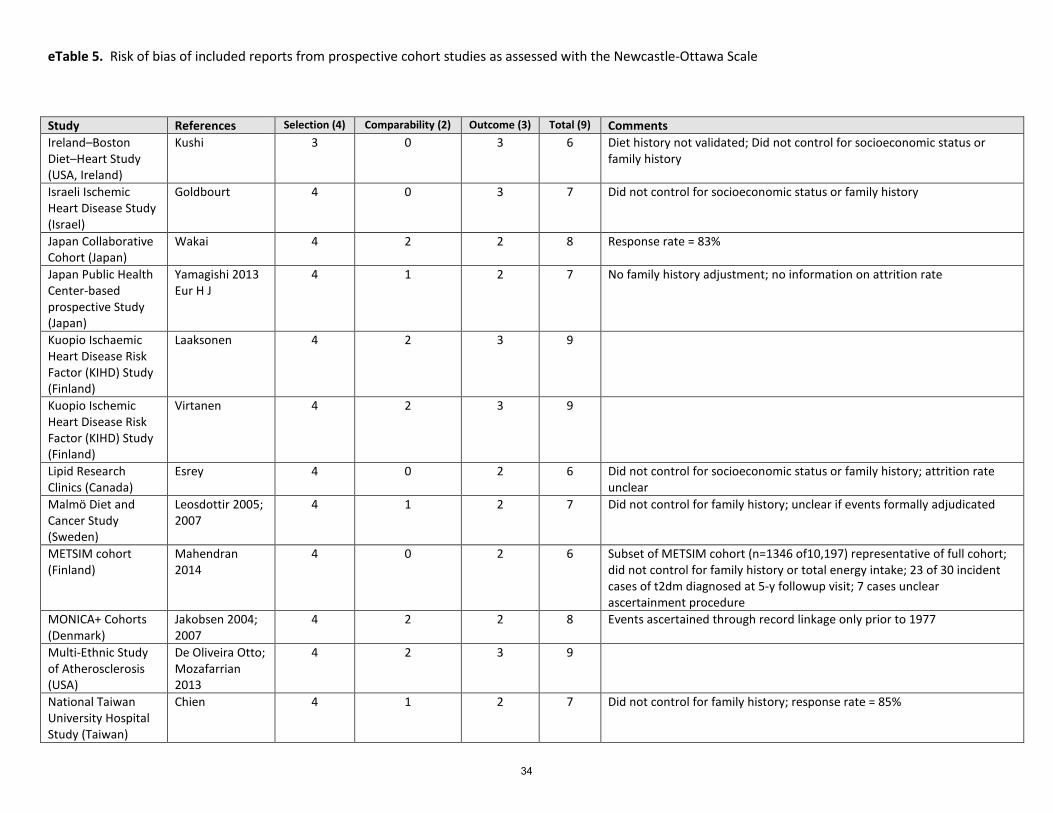
5. eTable 5. Risk of bias of included reports from prospective cohort studies as assessed with the Newcastle-Ottawa Scale (p32)
6. eTable 6. Risk of bias of included prospective nested case-control/case-cohort and retrospective case-control studies as assessed with the Newcastle-Ottawa Scale (p37)
7. eTable 7. Subgroup Analyses: Saturated fat and CHD Mortality (cohort studies) (p40) 8. eTable 8. Subgroup Analyses: Saturated fat and CVD Mortality (cohort studies) (p41) 9. eTable 9. Subgroup Analyses: Saturated fat and total CHD (cohort studies) (p42) 10. eTable 10. Subgroup Analyses: Saturated fat and ischemic stroke (cohort studies) (p43) 11. eTable 11. Characteristics of included prospective cohort studies of trans fatty acids and health outcomes. (p44) 12. eTable 12. Characteristics of included prospective nested case-control and case-cohort of trans fatty acids and
health outcomes. (p51) 13. eTable 13. Characteristics of included retrospective case-control studies of trans fatty acids and health
outcomes. (p54) 14. eTable 14. Pooled multivariable RR of CHD associated with a 2% increase in TFA intake at the expense of
carbohydrate. (p60) 15. eTable 15. Pooled multivariable RR of CHD mortality associated with a 2% increase in TFA intake at the expense
of carbohydrate. (p60) 16. eTable 16. Pooled multivariable RR of type 2 diabetes associated with a 2% increase in TFA intake at the expense
of carbohydrate. (p61) 17. eTable 17. Pooled multivariable RR of ischemic stroke associated with a 2% increase in TFA intake at the expense
of carbohydrate. (p61) 18. eTable 18. GRADE Evidence Profile for prospective cohort studies of trans-fatty acids and health outcomes
limiting analyses to those studies with a “highest” exposure category estimated >1% of dietary energy (Explanatory notes appear at the end of this document) (p62)
19. eTable 19. GRADE Evidence Profile for prospective cohort studies of trans-fatty acids and health outcomes comparing highest vs. Lowest exposure levels, where referent group TFA reported (or estimated to be) <1% of energy. (p66)
20. eTable 20: Reported and estimated dietary intakes of trans fatty acids in cohort studies, according to quantile. (p70)

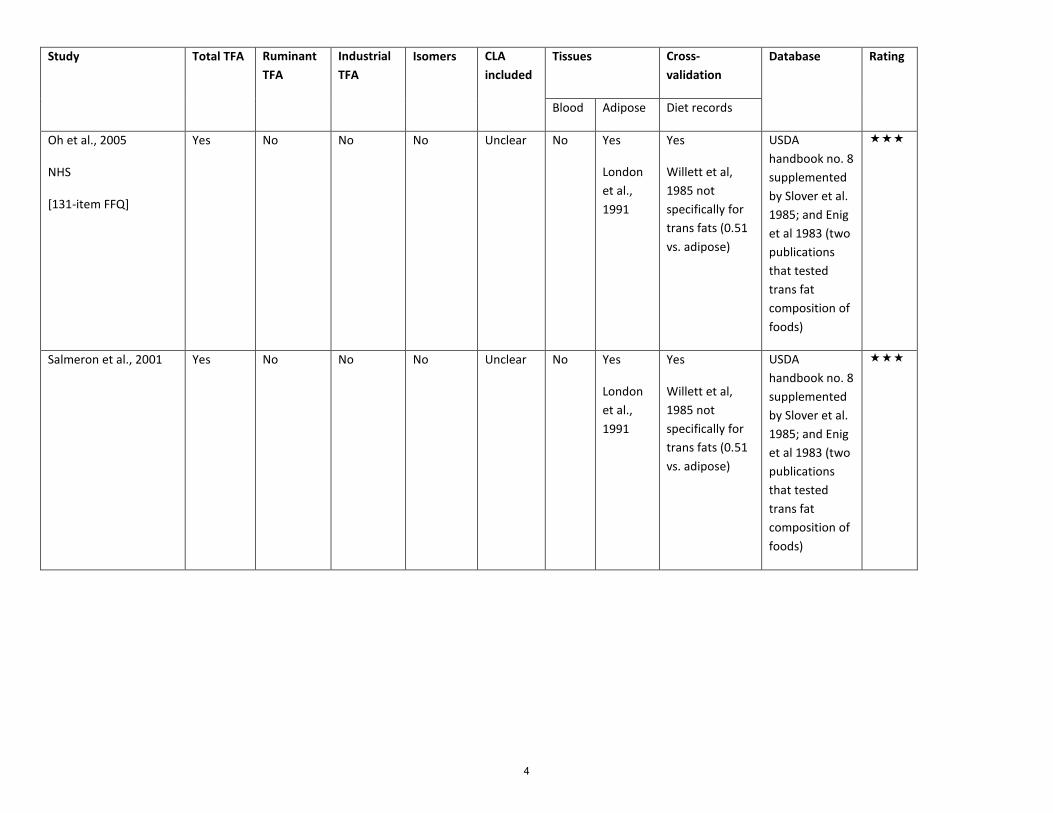
eTable 1. Summary of measurement techniques of industrial, total, and ruminant TFA in prospective cohort studies.
3-Star Prospective Cohorts
Study Total TFA Ruminant TFA
Industrial TFA
Isomers CLA included
Tissues Cross-validation
Database Rating
Blood Adipose Diet records
Ascherio et al., 1996
[131-item FFQ]
Yes and validated against adipose
Not measured
Not measured
Not reported
Unclear No Yes
Hunter et al., 1992
Yes Harvard University Food Composition Database (updated over time using USDA) supplemented by Slover et al. 1985; and Enig et al 1983 (two publications that tested trans fat composition of foods)
3
Study Total TFA Ruminant TFA
Industrial TFA
Isomers CLA included
Tissues Cross-validation
Database Rating
Blood Adipose Diet records
Oh et al., 2005
NHS
[131-item FFQ]
Yes No No No Unclear No Yes
London et al., 1991
Yes
Willett et al, 1985 not specifically for trans fats (0.51 vs. adipose)
USDA handbook no. 8 supplemented by Slover et al. 1985; and Enig et al 1983 (two publications that tested trans fat composition of foods)
Salmeron et al., 2001
Yes No No No Unclear No Yes
London et al., 1991
Yes
Willett et al, 1985 not specifically for trans fats (0.51 vs. adipose)
USDA handbook no. 8 supplemented by Slover et al. 1985; and Enig et al 1983 (two publications that tested trans fat composition of foods)
4

Study Total TFA Ruminant TFA
Industrial TFA
Isomers CLA included
Tissues Cross-validation
Database Rating
Blood Adipose Diet records
He et al., 2003
HPFS
Yes No No No Unclear No Yes
Hunter et al., 1992
Yes Harvard University Food Composition Database (updated over time using USDA) supplemented by Slover et al. 1985; and Enig et al 1983 (two publications that tested trans fat composition of foods)
Van Dam et al, 2002
HPFS
Yes and validated against adipose
Not measured
Not measured
Not reported
Unclear No Yes
Hunter et al., 1992
Yes Harvard University Food Composition Database (updated over time using USDA) supplemented by Slover et al. 1985; and Enig et al 1983 (two publications that tested trans fat composition of foods)
5

Study Total TFA Ruminant TFA
Industrial TFA
Isomers CLA included
Tissues Cross-validation
Database Rating
Blood Adipose Diet records Song, 2004
WHS
Yes Not measured
Not measured
Not reported
Unclear No Yes
Hunter et al., 1992
Yes Harvard University Food Composition Database (updated over time using USDA) supplemented by Slover et al. 1985; and Enig et al 1983 (two publications that tested trans fat composition of foods)
Willett et al., 1993
NHS
Yes Yes Yes No Unsure No Yes
London et al., 1991
Yes
Willett et al, 1985 not specifically for trans fats
USDA handbook no. 8 supplemented by Slover et al. 1985; and Enig et al 1983 (two publications that tested trans fat composition of foods)
Wang et al., 2015
CHS
Yes Yes Yes Yes Unsure Yes No Yes Kumanyika et al. 1997; Feskanich et al., 1993
Harvard University Food Composition Database (updated over time using USDA)
6
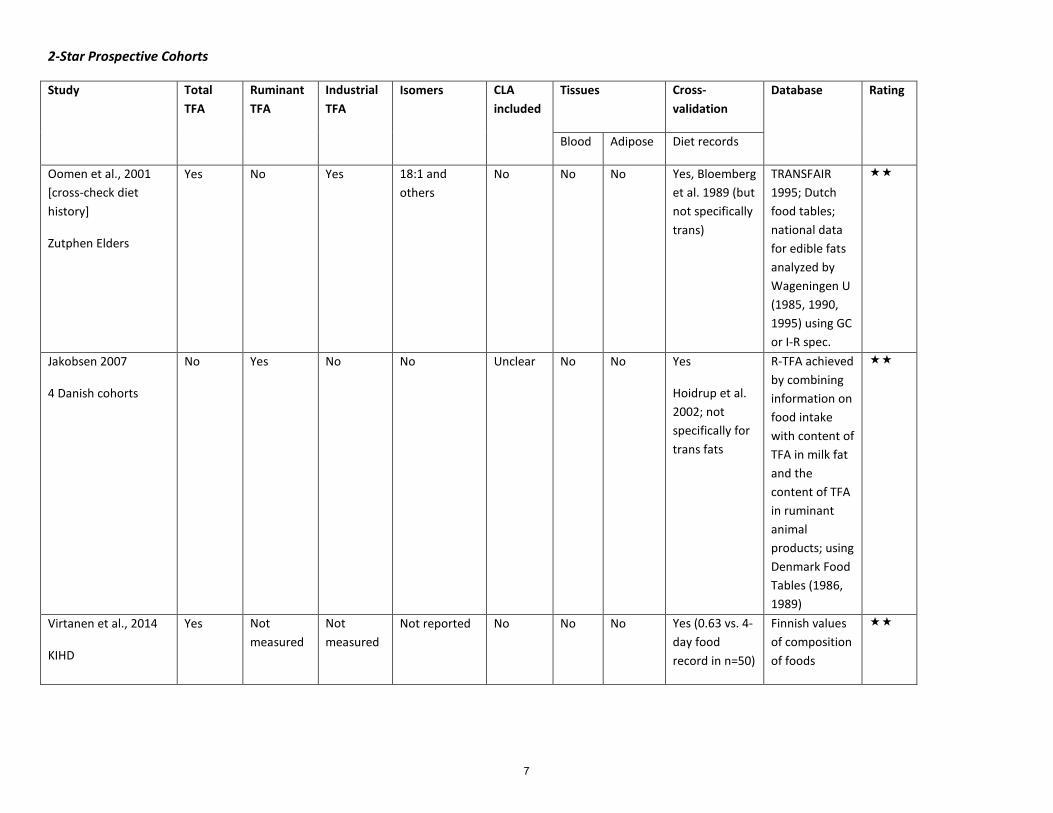
2-Star Prospective Cohorts
Study Total TFA
Ruminant TFA
Industrial TFA
Isomers CLA included
Tissues Cross-validation
Database Rating
Blood Adipose Diet records
Oomen et al., 2001 [cross-check diet history]
Zutphen Elders
Yes No Yes 18:1 and others
No No No Yes, Bloemberg et al. 1989 (but not specifically trans)
TRANSFAIR 1995; Dutch food tables; national data for edible fats analyzed by Wageningen U (1985, 1990, 1995) using GC or I-R spec.
Jakobsen 2007
4 Danish cohorts
No Yes No No Unclear No No Yes
Hoidrup et al. 2002; not specifically for trans fats
R-TFA achieved by combining information on food intake with content of TFA in milk fat and the content of TFA in ruminant animal products; using Denmark Food Tables (1986, 1989)
Virtanen et al., 2014
KIHD
Yes Not measured
Not measured
Not reported No No No Yes (0.63 vs. 4-day food record in n=50)
Finnish values of composition of foods
7

1-Star Prospective Cohorts
Study Total TFA Ruminant TFA
Industrial TFA
Isomers CLA included
Tissues Cross-validation
Database Rating
Blood Adipose Diet records
Pietinen et al., 1997
[276-item FFQ]
(ATBC)
Yes and validated against DR
Yes and validated against DR
Yes and validated against DR
Elaidic
Validated against DR
Unclear No No Yes
Pietinen et al., 1988 (but not specifically trans) but r-value for trans given in 1997 paper
Not stated
Meyer et al., 2001
IWHS
Yes No No No Unclear No No Yes
Munger et al., 1992 (with 5x24h recalls) but not specifically for trans fats
Not stated
Robien et al., 2011
IWHS
Yes No No No Unclear No No Yes
Vs. 5 x 24-h dietary recall surveys; not specifically trans
Not stated
Howard et al., 2006
WHI
Yes No No No Unclear No No Yes, Patterson et al., 1999 vs. 24h-recalls (x4) and food records (4 d) but not specifically for trans fats
U Minnesota Nutrition coding center
8
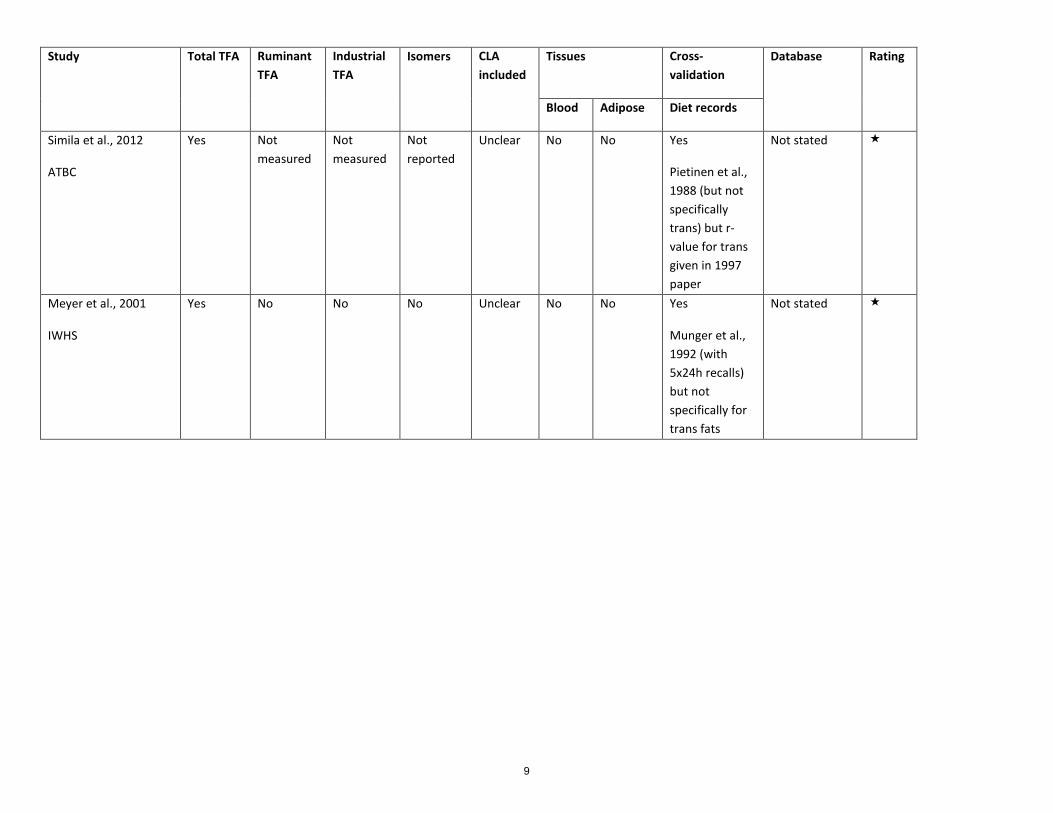
Study Total TFA Ruminant TFA
Industrial TFA
Isomers CLA included
Tissues Cross-validation
Database Rating
Blood Adipose Diet records
Simila et al., 2012
ATBC
Yes Not measured
Not measured
Not reported
Unclear No No Yes
Pietinen et al., 1988 (but not specifically trans) but r-value for trans given in 1997 paper
Not stated
Meyer et al., 2001
IWHS
Yes No No No Unclear No No Yes
Munger et al., 1992 (with 5x24h recalls) but not specifically for trans fats
Not stated
9

0-Star Prospective Cohorts
Study Total TFA
Ruminant TFA
Industrial TFA
Isomers CLA included
Tissues Cross-validation
Database Rating
Blood Adipose Diet records
Xu et al., 2006 [24h recall]
Strong Heart Study
Yes No No No Unclear No No No; only single 24-h recall
NCC Nutrient Database Version 36 (NDS-R 2005)
-
Knekt et al., 2013
FMHC
Yes No No No Unclear No No Short and long-term reproducibility
Unclear -
Guide to star Rating
Validated, Reproducible FFQ (cross-validated) + Measures in adipose tissue or blood + Updated nutrient database
2 of the above
1 of the above
- None of the above
Assessment of trans fat measures To assess the accuracy of trans fats measures in studies which did not directly measure concentrations in blood or adipose tissues, we assessed the potential for misclassification. The lowest risk of misclassification was for those studies which 1) used a food-frequency questionnaire validated against multiple-day prospective diet records or 24-hour recalls; and 2) directly measured adipose tissue trans-fatty acids in a subset of the population; and 3) analyzed dietary intake using an updated database of foods. A study which accomplished all 3 was rated *** (low risk of misclassification); 2 of 3 ** (moderate risk of misclassification); 1 of 3 * (at risk of misclassification); or 0 of 3 – (high risk of misclassification). For assessment of ruminant trans fats, the most common approach was to use the known nutrient composition from food tables for dairy and meat products to estimate ruminant trans fats, and possibly supplemented by direct measurement using gas chromatography.
10
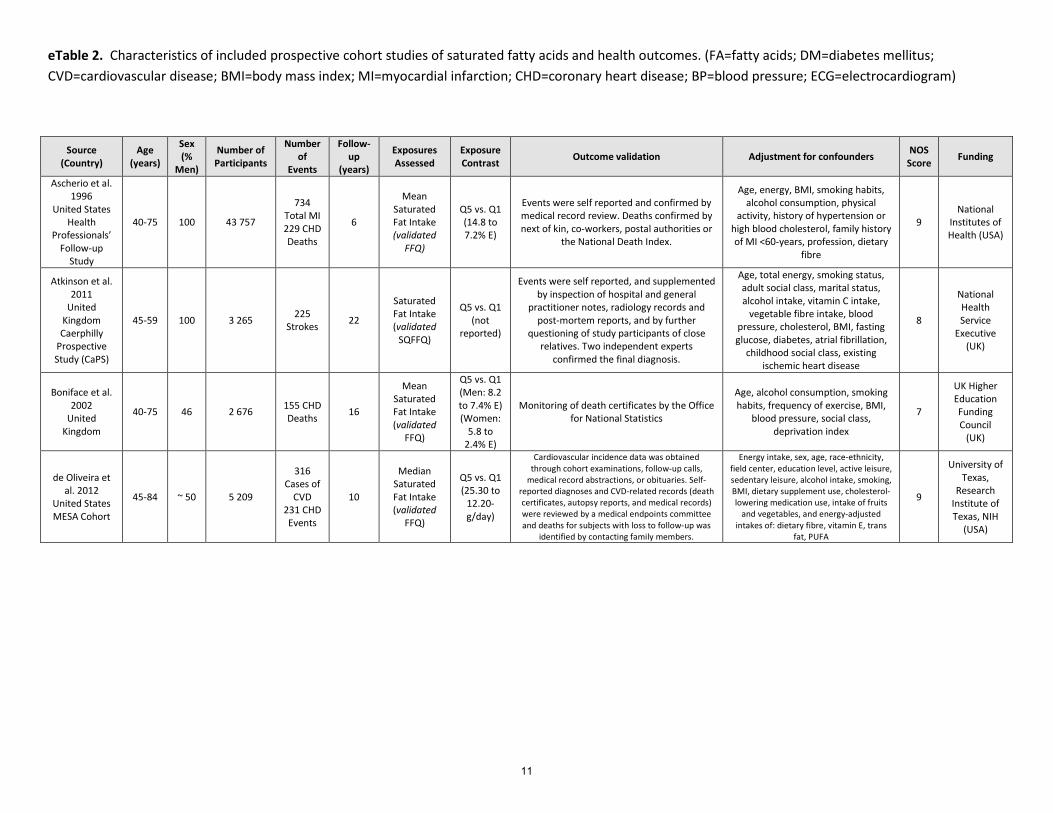
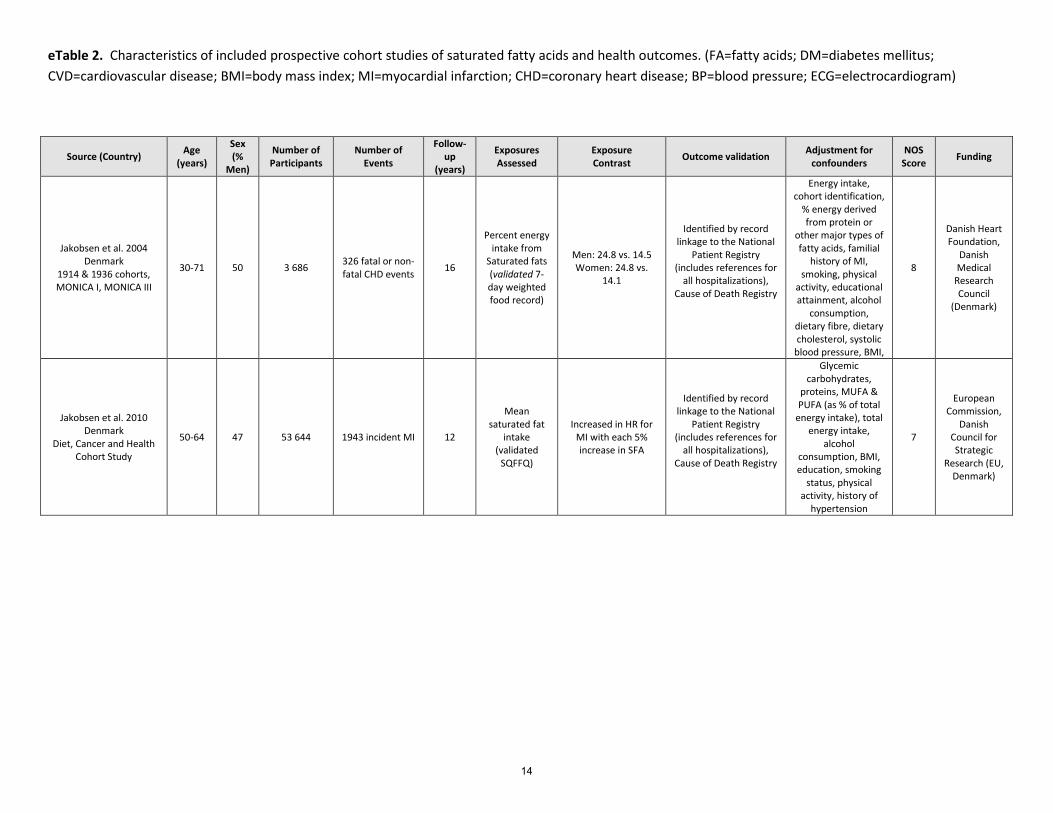
eTable 2. Characteristics of included prospective cohort studies of saturated fatty acids and health outcomes. (FA=fatty acids; DM=diabetes mellitus; CVD=cardiovascular disease; BMI=body mass index; MI=myocardial infarction; CHD=coronary heart disease; BP=blood pressure; ECG=electrocardiogram)
Source (Country)
Age (years)
Sex (%
Men)
Number of Participants
Number of
Events
Follow-up
(years)
Exposures Assessed
Exposure Contrast Outcome validation Adjustment for confounders NOS
Score Funding
Ascherio et al. 1996
United States Health
Professionals’ Follow-up
Study
40-75 100 43 757
734 Total MI 229 CHD Deaths
6
Mean Saturated Fat Intake (validated
FFQ)
Q5 vs. Q1 (14.8 to 7.2% E)
Events were self reported and confirmed by medical record review. Deaths confirmed by next of kin, co-workers, postal authorities or
the National Death Index.
Age, energy, BMI, smoking habits, alcohol consumption, physical
activity, history of hypertension or high blood cholesterol, family history of MI <60-years, profession, dietary
fibre
9 National
Institutes of Health (USA)
Atkinson et al. 2011
United Kingdom Caerphilly
Prospective Study (CaPS)
45-59 100 3 265 225 Strokes 22
Saturated Fat Intake (validated
SQFFQ)
Q5 vs. Q1 (not
reported)
Events were self reported, and supplemented by inspection of hospital and general
practitioner notes, radiology records and post-mortem reports, and by further
questioning of study participants of close relatives. Two independent experts
confirmed the final diagnosis.
Age, total energy, smoking status, adult social class, marital status, alcohol intake, vitamin C intake,
vegetable fibre intake, blood pressure, cholesterol, BMI, fasting glucose, diabetes, atrial fibrillation,
childhood social class, existing ischemic heart disease
8
National Health Service
Executive (UK)
Boniface et al. 2002
United Kingdom
40-75 46 2 676 155 CHD Deaths 16
Mean Saturated Fat Intake (validated
FFQ)
Q5 vs. Q1 (Men: 8.2 to 7.4% E) (Women:
5.8 to 2.4% E)
Monitoring of death certificates by the Office for National Statistics
Age, alcohol consumption, smoking habits, frequency of exercise, BMI,
blood pressure, social class, deprivation index
7
UK Higher Education Funding Council
(UK)
de Oliveira et al. 2012
United States MESA Cohort
45-84 ~ 50 5 209
316 Cases of
CVD 231 CHD Events
10
Median Saturated Fat Intake (validated
FFQ)
Q5 vs. Q1 (25.30 to
12.20-g/day)
Cardiovascular incidence data was obtained through cohort examinations, follow-up calls,
medical record abstractions, or obituaries. Self-reported diagnoses and CVD-related records (death certificates, autopsy reports, and medical records) were reviewed by a medical endpoints committee and deaths for subjects with loss to follow-up was
identified by contacting family members.
Energy intake, sex, age, race-ethnicity, field center, education level, active leisure, sedentary leisure, alcohol intake, smoking, BMI, dietary supplement use, cholesterol-lowering medication use, intake of fruits
and vegetables, and energy-adjusted intakes of: dietary fibre, vitamin E, trans
fat, PUFA
9
University of Texas,
Research Institute of Texas, NIH
(USA)
11
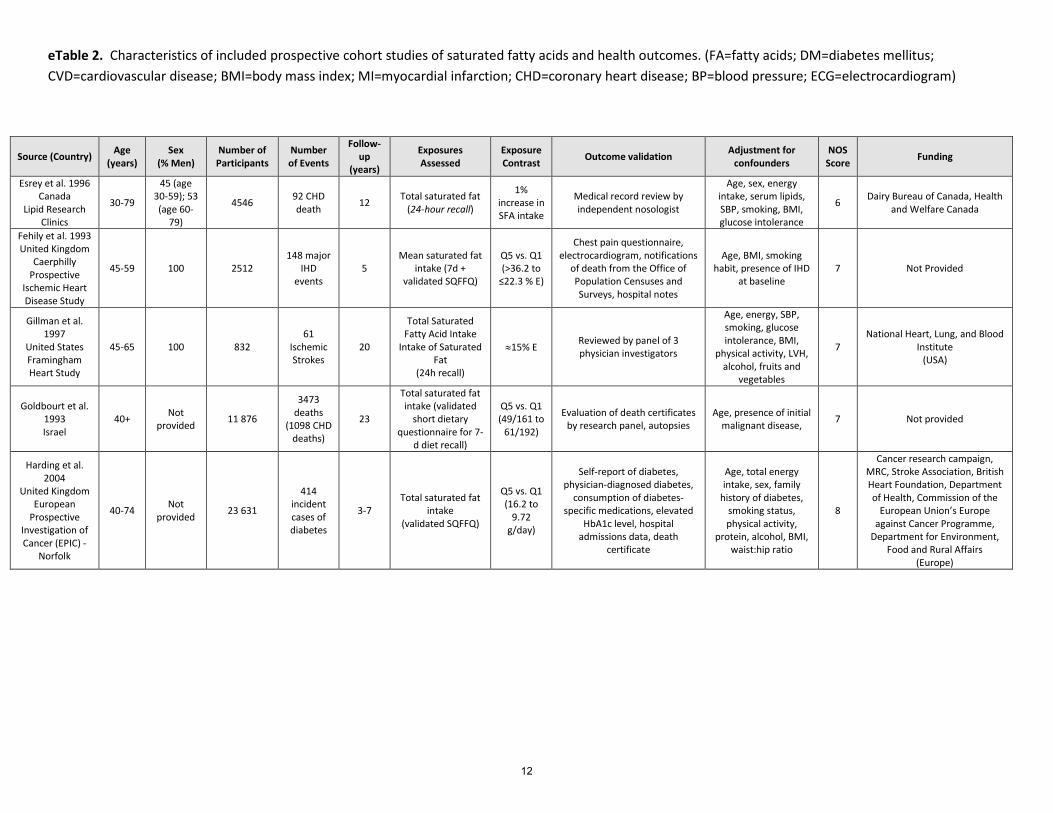
eTable 2. Characteristics of included prospective cohort studies of saturated fatty acids and health outcomes. (FA=fatty acids; DM=diabetes mellitus; CVD=cardiovascular disease; BMI=body mass index; MI=myocardial infarction; CHD=coronary heart disease; BP=blood pressure; ECG=electrocardiogram)
Source (Country) Age (years)
Sex (% Men)
Number of Participants
Number of Events
Follow-up
(years)
Exposures Assessed
Exposure Contrast Outcome validation Adjustment for
confounders NOS
Score Funding
Esrey et al. 1996 Canada
Lipid Research Clinics
30-79
45 (age 30-59); 53 (age 60-
79)
4546 92 CHD death 12 Total saturated fat
(24-hour recall)
1% increase in SFA intake
Medical record review by independent nosologist
Age, sex, energy intake, serum lipids, SBP, smoking, BMI, glucose intolerance
6 Dairy Bureau of Canada, Health and Welfare Canada
Fehily et al. 1993 United Kingdom
Caerphilly Prospective
Ischemic Heart Disease Study
45-59 100 2512 148 major
IHD events
5 Mean saturated fat
intake (7d + validated SQFFQ)
Q5 vs. Q1 (>36.2 to
≤22.3 % E)
Chest pain questionnaire, electrocardiogram, notifications
of death from the Office of Population Censuses and Surveys, hospital notes
Age, BMI, smoking habit, presence of IHD
at baseline 7 Not Provided
Gillman et al. 1997
United States Framingham Heart Study
45-65 100 832 61
Ischemic Strokes
20
Total Saturated Fatty Acid Intake
Intake of Saturated Fat
(24h recall)
≈15% E Reviewed by panel of 3 physician investigators
Age, energy, SBP, smoking, glucose intolerance, BMI,
physical activity, LVH, alcohol, fruits and
vegetables
7 National Heart, Lung, and Blood
Institute (USA)
Goldbourt et al. 1993 Israel
40+ Not provided 11 876
3473 deaths
(1098 CHD deaths)
23
Total saturated fat intake (validated
short dietary questionnaire for 7-
d diet recall)
Q5 vs. Q1 (49/161 to
61/192)
Evaluation of death certificates by research panel, autopsies
Age, presence of initial malignant disease, 7 Not provided
Harding et al. 2004
United Kingdom European
Prospective Investigation of Cancer (EPIC) -
Norfolk
40-74 Not provided 23 631
414 incident cases of diabetes
3-7 Total saturated fat
intake (validated SQFFQ)
Q5 vs. Q1 (16.2 to
9.72 g/day)
Self-report of diabetes, physician-diagnosed diabetes,
consumption of diabetes-specific medications, elevated
HbA1c level, hospital admissions data, death
certificate
Age, total energy intake, sex, family
history of diabetes, smoking status, physical activity,
protein, alcohol, BMI, waist:hip ratio
8
Cancer research campaign, MRC, Stroke Association, British Heart Foundation, Department of Health, Commission of the
European Union’s Europe against Cancer Programme,
Department for Environment, Food and Rural Affairs
(Europe)
12

eTable 2. Characteristics of included prospective cohort studies of saturated fatty acids and health outcomes. (FA=fatty acids; DM=diabetes mellitus; CVD=cardiovascular disease; BMI=body mass index; MI=myocardial infarction; CHD=coronary heart disease; BP=blood pressure; ECG=electrocardiogram)
Source (Country) Age (years)
Sex (%
Men)
Number of Participants
Number of Events
Follow-up
(years)
Exposures Assessed
Exposure Contrast Outcome validation Adjustment for confounders NOS
Score Funding
He et al. 2003 United States
Health Professionals’
Follow-up Study
40-75 100 43 732
725 total stroke; 455 ischemic stroke, 125
haemorrhagic stroke
14
Median intake of
saturated fat (validate SQFFQ)
Q5 vs. Q1 (31 to 17
g/day)
Blind record review by MD; fatal stroke reported by next of kin corroborated against
national death index
BMI, physical activity, history of hypertension, smoking status, aspirin use, alcohol, dietary potassium, dietary fiber,
dietary vitamin E, fruits and vegetables, total energy intake, hypercholesterolemia at
baseline, polyunsaturated, monounsaturated, and saturated fat
7
National Institutes of
Health (USA)
Howard et al. 2006 United States
Womens’ Health Initiative
Randomized Controlled Dietary Modification Trial
50-79 0 31 258 146 major CHD events 1
Total saturated fat
intake (validated
FFQ)
Intervention vs. Control (8.1 to 11.8
% E)
Medical update questionnaire, analysis of
medical records of all overnight hospitalisations,
analyzed by physicians
Age, baseline CHD, HRT, randomization, BMI, hypertension, dyslipidemia, smoking,
diabetes, physical activity, energy expenditure, ethnicity, education, income,
psychological stress
8
National Heart, Lung and Blood Institute
(USA)
Hu et al. 1997 United States
Nurses’ Health Study
34-59 0 80 082 939 events (658
non-fatal MI, 281 deaths)
14
Total intake of saturated
fats (validated
SQFFQ)
Q5 vs. Q1 (18.8 to 10.7
% E)
Review of medical records by study physicians, interviews and letters for confirmation
of hospitalization. Death confirmed by National Death
Index, next of kin or postal system
Age, time period, BMI, smoking, menopausal status, parental history of MI before 65
years, multivitamin use, vitamin E supplementation, alcohol consumption,
history of hypertension, aspirin use, vigorous exercise, percent energy from protein, total
energy intake, dietary cholesterol
9
National Institute of
Health (USA)
Hu et al. 1999 United States
Nurses’ Health Study
34-59 0 80 082 939 incidence cases of major
CHD 14
Median saturated fat
intake (validated
FFQ)
Q5 vs. Q1 (17.2 to 9.5
% E)
Review of medical records by study physicians, interviews and letters for confirmation
of hospitalization. Death confirmed by National Death
Index, next of kin or postal system
Age, time period, BMI, smoking, menopausal status, parental history of MI before 60
years, vitamin E supplement use, alcohol consumption, history of hypertension,
aspirin use, vigorous exercise, monounsaturated fats, polyunsaturated fats, trans fats, protein, dietary cholesterol, total
energy
9
National Institute of
Health (USA)
13
eTable 2. Characteristics of included prospective cohort studies of saturated fatty acids and health outcomes. (FA=fatty acids; DM=diabetes mellitus; CVD=cardiovascular disease; BMI=body mass index; MI=myocardial infarction; CHD=coronary heart disease; BP=blood pressure; ECG=electrocardiogram)
Source (Country) Age (years)
Sex (%
Men)
Number of Participants
Number of Events
Follow-up
(years)
Exposures Assessed
Exposure Contrast Outcome validation Adjustment for
confounders NOS
Score Funding
Jakobsen et al. 2004 Denmark
1914 & 1936 cohorts, MONICA I, MONICA III
30-71 50 3 686 326 fatal or non-fatal CHD events 16
Percent energy intake from
Saturated fats (validated 7-day weighted food record)
Men: 24.8 vs. 14.5 Women: 24.8 vs.
14.1
Identified by record linkage to the National
Patient Registry (includes references for
all hospitalizations), Cause of Death Registry
Energy intake, cohort identification,
% energy derived from protein or
other major types of fatty acids, familial
history of MI, smoking, physical
activity, educational attainment, alcohol
consumption, dietary fibre, dietary cholesterol, systolic
blood pressure, BMI,
8
Danish Heart Foundation,
Danish Medical
Research Council
(Denmark)
Jakobsen et al. 2010 Denmark
Diet, Cancer and Health Cohort Study
50-64 47 53 644 1943 incident MI 12
Mean saturated fat
intake (validated
SQFFQ)
Increased in HR for MI with each 5% increase in SFA
Identified by record linkage to the National
Patient Registry (includes references for
all hospitalizations), Cause of Death Registry
Glycemic carbohydrates,
proteins, MUFA & PUFA (as % of total
energy intake), total energy intake,
alcohol consumption, BMI, education, smoking
status, physical activity, history of
hypertension
7
European Commission,
Danish Council for Strategic
Research (EU, Denmark)
14
eTable 2. Characteristics of included prospective cohort studies of saturated fatty acids and health outcomes. (FA=fatty acids; DM=diabetes mellitus; CVD=cardiovascular disease; BMI=body mass index; MI=myocardial infarction; CHD=coronary heart disease; BP=blood pressure; ECG=electrocardiogram)
Source (Country) Age (years)
Sex (%
Men)
Number of Participants Number of Events
Follow-up
(years)
Exposures Assessed
Exposure Contrast Outcome validation Adjustment for
confounders NOS
Score Funding
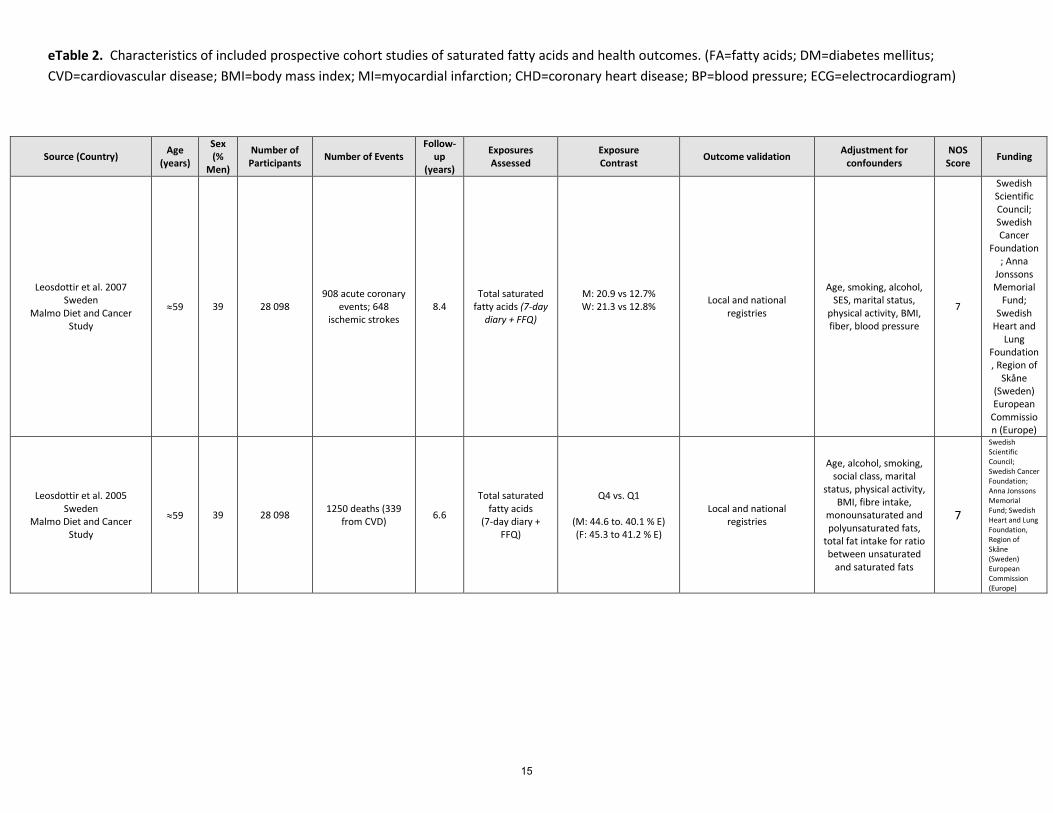
Leosdottir et al. 2007 Sweden
Malmo Diet and Cancer Study
≈59 39 28 098 908 acute coronary
events; 648 ischemic strokes
8.4 Total saturated
fatty acids (7-day diary + FFQ)
M: 20.9 vs 12.7% W: 21.3 vs 12.8%
Local and national registries
Age, smoking, alcohol, SES, marital status,
physical activity, BMI, fiber, blood pressure
7
Swedish Scientific Council; Swedish Cancer
Foundation; Anna
Jonssons Memorial
Fund; Swedish
Heart and Lung
Foundation, Region of
Skåne (Sweden) European
Commission (Europe)
Leosdottir et al. 2005 Sweden
Malmo Diet and Cancer Study
≈59 39 28 098 1250 deaths (339 from CVD) 6.6
Total saturated fatty acids
(7-day diary + FFQ)
Q4 vs. Q1
(M: 44.6 to. 40.1 % E) (F: 45.3 to 41.2 % E)
Local and national registries
Age, alcohol, smoking, social class, marital
status, physical activity, BMI, fibre intake,
monounsaturated and polyunsaturated fats,
total fat intake for ratio between unsaturated
and saturated fats
7
Swedish Scientific Council; Swedish Cancer Foundation; Anna Jonssons Memorial Fund; Swedish Heart and Lung Foundation, Region of Skåne (Sweden) European Commission (Europe)
15

eTable 2. Characteristics of included prospective cohort studies of saturated fatty acids and health outcomes. (FA=fatty acids; DM=diabetes mellitus; CVD=cardiovascular disease; BMI=body mass index; MI=myocardial infarction; CHD=coronary heart disease; BP=blood pressure; ECG=electrocardiogram)
Source (Country) Age (years)
Sex (%
Men)
Number of Participants Number of Events
Follow-up
(years)
Exposures Assessed
Exposure Contrast Outcome validation Adjustment for
confounders NOS
Score Funding
Lindstrom et al. 2006 Finland
Diabetes Prevention Study 55 33 522
Incident cases of diabetes (75 in
intervention, 110 in control)
7 Reductions in
saturated fats to <10% energy
Intervention: 13% E Control: 15% E,
proportion of saturated fat
Diagnosis with diabetes based on a second oral glucose tolerance test
Adjustment for baseline level, levels at last visit, treatment group, study
centre, sex, age, and baseline 2-h post-challenge plasma
glucose concentration
5
Academy of Finland, Joho Vainio Foundation, Ministry
of Education,
Novo Nordisk
Foundation, Yrjo
Jahnsson Foundation
, Finnish Diabetes Research
Foundation, Kuopio and Oulu Hospitals (Finland)
Mann et al. 1997 United Kingdom 16-79 38 10 802
456 deaths (64 IHD, 392 all cause
mortality) 13.3 Total saturated
fat intake (SQFFQ)
Q3 vs. Q1 (M: 41 to 14.6 g/day) (F: 38.1 to 13.7 g/day
Review of death certificates
Age, sex, smoking habit, social class 6 Not stated
McGee et al. 1985 United States
Honolulu Heart Program 45-60+ 100 7 088
542 total deaths; 61 stroke deaths; 99
CHD deaths 10
Total saturated fat (24-hour
recall)
≥50 g vs. <10 g, but also continuous Physician panel review
Age, SBP, BMI, physical activity, cigarettes
smoked 6 Not stated
Meyer et al. 2001 United States
Iowa Women’s Health Study 55-69 0 35 988 1890 incident cases
of diabetes 11
Median intake of saturated fatty
acids (validated FFQ)
Q5 vs. Q1 (86.6 to 55.7 g/day)
Survey asking if participant had been diagnosed with
diabetes by a physician, for the first time
Age, total energy, waist-to-hip ratio, BMI, physical activity,
smoking, alcohol consumption, education, marital status, residential area, hormone replacement, fat subtypes,
dietary protein, dietary magnesium, cereal fibre,
vitamin E, vegetable fat, dietary cholesterol
6 National Cancer
Institute (USA)
16

eTable 2. Characteristics of included prospective cohort studies of saturated fatty acids and health outcomes. (FA=fatty acids; DM=diabetes mellitus; CVD=cardiovascular disease; BMI=body mass index; MI=myocardial infarction; CHD=coronary heart disease; BP=blood pressure; ECG=electrocardiogram)
Source (Country)
Age (years)
Sex (%
Men)
Number of Participants
Number of Events
Follow-up
(years)
Exposures Assessed
Exposure Contrast Outcome validation Adjustment for confounders NOS
Score Funding
Oh et al. 2005 United States
Nurses’ Health Study
30-55 0 78 778
1766 incident
cases of CHD (1241 non-
fatal MI, 525 CHD deaths)
20
Total saturated fatty acids (validated
FFQ)
Q5 vs. Q1 (17.6 to 10.1
median % energy)
Self-reported non-fatal MI, confirmed with review of
medical records. Fatal CHD was confirmed by hospital records or autopsy or if CHD was listed as
cause of death on the death certificate.
Age, BMI, smoking, alcohol intake, parental history of MI, history of
hypertension, menopausal status, hormone use, aspirin use, multivitamin use, vitamin E supplement use, physical
activity, energy, protein, cholesterol, intakes of monounsaturated,
polyunsaturated, trans-fat, α-linoleic acid, marine n-3 fatty acids, cereal fibre, fruits
and vegetables.
9
National Institutes of
Health (US)
Pietinen et al. 1997
Finland Finish Alpha-Tocopherol,
Beta-Carotene Cancer
Prevention Study
50-69 100 21 930
1399 major coronary
events (first non-fatal MI), 635 coronary deaths
6
Median saturated fatty acid
intake (validated
FFQ)
Q5 vs Q1 (67.5 to
34.7-g/day)
National hospital discharge registered diagnosis and
obtained hospital and pathology reports; deaths confirmed
through national population register
Age, treatment group, smoking, BMI, blood pressure, energy, alcohol, fibre,
education, physical activity 8
National Cancer
Institute (USA),
Academy of Finland
Posner et al. 1991
United States Framingham
Study
45-65 100 813 213 CHD 16
Total saturated fatty acid
intake (24h recall)
15.2 vs. 10% SFA (age 45-55), 14.8 vs.
10% SFA (age 56-65)
Reviewed by a panel of three investigators. Clinical
examinations were used to diagnose MI
Total energy intake, heart rate, systolic blood pressure, serum total cholesterol
level, glucose intolerance, number of cigarettes smoked per day, left ventricular
hypertrophy, physical activity, Metropolitan relative weight
8
National Heart, Lung, and Blood Institute
(USA)
Salmeron et al. 2001
United States Nurses’ Health
Study
34-59 0 84 204
2507 incident cases of T2DM
14
Median intake of saturated fatty acids (validated
SQFFQ)
Q5 vs. Q1 (18.8 to 10.7
%E)
Follow-up questionnaire asking for incident cases of diabetes,
supplementary questionnaire for new cases and confirmed by review of medical records.
Deaths identified from state vital records, National Death Index, or
were reported by next of kin, and postal system
Age, BMI, time period, smoking, parental history of diabetes, alcohol consumption,
physical activity, percentage of energy from protein, total energy intake, dietary
cholesterol
9
National Institutes of
Health (USA)
17

eTable 2. Characteristics of included prospective cohort studies of saturated fatty acids and health outcomes. (FA=fatty acids; DM=diabetes mellitus; CVD=cardiovascular disease; BMI=body mass index; MI=myocardial infarction; CHD=coronary heart disease; BP=blood pressure; ECG=electrocardiogram)
Source (Country) Age (years)
Sex (%
Men)
Number of Participants Number of Events
Follow-up
(years)
Exposures Assessed
Exposure Contrast Outcome validation Adjustment for
confounders NOS
Score Funding
Sauvaget et al. 2004 Japan
Adult Health Study (subcohort of the Life Span
Study)
35-89 38 3731 90 stroke deaths (60
from cerebral infarction)
14
Mean saturated fatty acid intake
(24h dietary recall)
Q3 vs Q1 (21 to 7 g/day)
Events were determined by analysis of nationwide
family registration system of Japan and by obtaining
copies of death certificates
Radiation dose, city of exposure, smoking and
drinking status, BMI, history of hypertension and diabetes, fruit and
vegetable intake, markers of nutritional
status, lymphocyte count, blood cholesterol
level, total energy intake, weight
5
Radiation Effects
Research Foundation , Japanese Ministry of
Heath, Labour and
Welfare (Japan)
US Department of Energy
(USA)
Simila et al. 2012 Finland
Finish Alpha-Tocopherol, Beta-Carotene Cancer
Prevention Study
50-69 100 25 943 1098 incident diabetes cases 12
Median saturated fat intake
(validated FFQ)
Q1 vs. Q5 (44.8 to 36.1 % E)
Incident cases of diabetes were identified from the
drug reimbursement register
Age, energy, intervention group,
BMI, smoking, physical activity, coffee
consumption, alcohol, protein (replacement of
fat) and vice versa, other macronutrient
subgroups (TFA, MUFA, PUFA)
8
US Public Health Service
contracts, National Cancer
Institute (USA)
Academy of Finland
Song et al. 2004 United States
Women’s Health Study ≥45 0 37 309 1558 incident cases
of T2DM 8.8 Median saturated
fat intake (validated SQFFQ)
Q5 vs. Q1 (25.8 to 13.8 g/day)
Annual follow-up to determine new diagnoses
of T2DM, supplemental questionnaire, contact with
primary care physician.
Age, BMI, total energy intake, smoking,
exercise, alcohol use, family history of
diabetes, fibre intake, glycemic load,
magnesium, total fat
7
National Institutes of Health, National
Institute of Diabetes
and Digestive
and Kidney Diseases
(USA)
18

eTable 2. Characteristics of included prospective cohort studies of saturated fatty acids and health outcomes. (FA=fatty acids; DM=diabetes mellitus; CVD=cardiovascular disease; BMI=body mass index; MI=myocardial infarction; CHD=coronary heart disease; BP=blood pressure; ECG=electrocardiogram)
Source (Country) Age (years)
Sex (%
Men)
Number of Participants Number of Events
Follow-up
(years)
Exposures Assessed
Exposure Contrast Outcome validation Adjustment for
confounders NOS
Score Funding
Tanasescu et al. 2004 United States
Nurses’ Health Study 50-75 0 5 672
619 cases of CVD (268 non-fatal MI, 183 fatal MI, 168
strokes)
~10 Median saturated
fat intake (validated FFQ)
Q5 vs. Q1 (19.1 to 10.8 % E)
Self-reported MI confirmed by physician review of
medical records. Deaths were reported by next of
kin, work associates, postal authorities, or National
Death Index
Age, smoking, postmenopausal
hormone use, parental history of MI before 60y, alcohol intake,
physical activity, BMI, total caloric intake, protein intake, fibre intake, multivitamin
use, vitamin E supplement use, medication use
8 NIH (USA)
Tucker et al. 2005 United States
Baltimore Longitudinal Study of Aging
34-80 100 501 71 deaths from CHD 18
Mean saturated fat intake, as
percent of total dietary intake
(7-d diet record)
Survivors: 12.3% CHD Deaths: 13.8%
Non-CHD Deaths: 14.0%
Consensus of three physicians using death
certificates, hospital records, and/or autopsy
data.
Age at first visit, total energy intake, BMI,
smoking, alcohol use, dietary supplements,
physical activity
8
US Departmen
t of Agriculture Agricultural
Research Service,
NIH National
Institute on Aging
Intramural Program
(USA)
van Dam et al. 2002 United States
Health Professionals’ Follow-up Study
40-75 100 42 504 1321 incident cases of T2DM 12
Median saturated fat intake
(validated FFQ)
Q5 vs. Q1 (14 to 7.6 % E)
Supplementary questionnaire provided to
any new diagnoses of diabetes, validated by
blinded physician
Age, total energy intake, time period,
physical activity, smoking, alcohol
consumption, hypercholesterolemia, hypertension, family
history of type 2 diabetes, cereal fibre,
magnesium, BMI
8
National Institute of
Health (USA)
19

eTable 2. Characteristics of included prospective cohort studies of saturated fatty acids and health outcomes. (FA=fatty acids; DM=diabetes mellitus; CVD=cardiovascular disease; BMI=body mass index; MI=myocardial infarction; CHD=coronary heart disease; BP=blood pressure; ECG=electrocardiogram)
Source (Country) Age (years)
Sex (%
Men)
Number of Participants Number of Events
Follow-up
(years)
Exposures Assessed
Exposure Contrast Outcome validation Adjustment for
confounders NOS
Score Funding
Wu et al. 2011 United Sates
Cardiovascular Health tudy ≥65 37 2 890
631 CHD events, 61 sudden cardiac arrest events
7
Mean saturated fatty acid intake
(particularly palmitic)
(validated SQFFQ)
~ 25.3 (23.5-27.5) Determined by a
centralized morbidity and mortality committee
Total energy, age, sex, race, education,
income, smoking status, prevalent diabetes,
hypertension, stroke, transient ischemic
attack, BMI, physical activity, alcohol use,
total fat intake, phospholipid
concentrations of long-chain n-3 fatty acids and
trans FAs, systolic BP, fasting HDL cholesterol,
LDL cholesterol, triglycerides, C-reactive
protein, fibrinogen, incident angina,
phospholipid concentration of 14:0
9
National Heart, Lung and Blood Institute,
NIH Office of Dietary
Supplements National Institute of Neurologic
al Disorders and Stoke
(USA)
Xu et al. 2006 United States
Strong Heart Study 45-74 36 2 938
436 incident CHD (298 non-fatal CHD,
138 fatal CHD) 7
Total saturated fatty acid intake (24-hour recall)
47-59 y: 12.2 vs. 1.7% E 60-79 y: 11.7 vs. 11.1% E
CHD events during the follow-up period were
ascertained from annual mortality and morbidity
surveillance or at the third examination. Fatal CHD
events were confirmed by medical records.
Sex, age, study, center, diabetes, BMI, HDL-C, LDL-C, triacylglycerol,
smoking, alcohol, hypertension, dietary protein, total energy
7
National Heart, Lung and Blood Institute
(US)
Yaemsiri et al. 2012 United States
Womens’ Health Initiative 50-79 0 87 025
1,049 ischemic stroke, 101
atherosclerotic stroke, 269 lacunar
stroke, 244 cardioembolic
stroke
7.6
Median intake of saturated fatty
acids (validated FFQ)
Q5 vs. Q1 (26.1 to 12.9 g/day)
Self report; adjudicated by local physicians and centrally by trained
neurologists
Age, race, education, income, smoking, HRT use, physical activity,
alcohol, history of CHD, history of A. Fib, history of diabetes, aspirin use,
use of antihypertensives, use of cholesterol-lowering medication, BMI, SBP,
total energy, vitamin E, fruits and vegetables
intake, fiber
8
National Heart,
Lung, and Blood
Institute (USA)
20

eTable 2. Characteristics of included prospective cohort studies of saturated fatty acids and health outcomes. (FA=fatty acids; DM=diabetes mellitus; CVD=cardiovascular disease; BMI=body mass index; MI=myocardial infarction; CHD=coronary heart disease; BP=blood pressure; ECG=electrocardiogram)
Source (Country) Age (years)
Sex (%
Men)
Number of Participants Number of Events
Follow-up
(years)
Exposures Assessed
Exposure Contrast Outcome validation Adjustment for
confounders NOS
Score Funding
Yaemsiri et al. 2012 United States
Womens’ Health Initiative 50-79 0 87 025
1,049 ischemic stroke, 101
atherosclerotic stroke, 269 lacunar
stroke, 244 cardioembolic
stroke
7.6
Median intake of saturated fatty
acids (validated FFQ)
Q5 vs. Q1 (26.1 to 12.9 g/day)
Self report; adjudicated by local physicians and centrally by trained
neurologists
Age, race, education, income, smoking, HRT use, physical activity,
alcohol, history of CHD, history of A. Fib, history of diabetes, aspirin use,
use of antihypertensives, use of cholesterol-lowering medication, BMI, SBP,
total energy, vitamin E, fruits and vegetables
intake, fiber
8
National Heart,
Lung, and Blood
Institute (USA)
Yamagishi et al. 2013 Japan
Japan Public Health Center-based (JPHC) Prospective
Study
45-74 46 81,931
3192 incident strokes (610 MI, 116
sudden cardiac deaths)
11.1 Median saturated fatty acid intake (validated FFQ)
Q5 vs. Q1 (24.9 to 9.6 g/day)
Physicians in hospitals, or study investigators
reviewed the medical records of participants that
required hospitalisation
Total energy intake, age, sex, cohort,
baseline BMI, smoking, alcohol intake, sports in
leisure time, walking and standing time,
perceived mental stress, employment status,
energy-adjusted intakes of carbohydrate,
cholesterol, vegetables, fruit, calcium
7
Ministry of Health, Labour,
and Welfare of
Japan, Ministry of Education,
Culture, Sports, Science,
and Technology
Japan
Yamagishi et al. 2013; U.S.A.; Atherosclerosis Risk in
Communities (ARIC) Study 45-64 48 3,870 168 ischemic
strokes 20 Total saturated fat, isomers (CE
and PPL) Q4 vs. Q1
Calls to participants, review of hospital discharge lists,
death certificates; physician-adjucated using National Survey of Stroke
criteria
Age, sex, smoking, alcohol [also considered BMI, education, sports index, HRT use, energy
intake, fish oil use
7
National Heart,
Lung, and Blood
Institute (USA),
National Institutes of Health
(USA)
21

eTable 2. Characteristics of included prospective cohort studies of saturated fatty acids and health outcomes. (FA=fatty acids; DM=diabetes mellitus; CVD=cardiovascular disease; BMI=body mass index; MI=myocardial infarction; CHD=coronary heart disease; BP=blood pressure; ECG=electrocardiogram)
Source (Country) Age (years)
Sex (%
Men)
Number of Participants Number of Events
Follow-up
(years)
Exposures Assessed
Exposure Contrast Outcome validation Adjustment for
confounders NOS
Score Funding
Wang et al. 2003 United States
Atherosclerosis Risk in Communities (ARIC) Study
45-64 47 2 909 252 incident cases of diabetes 9
Plasma fatty acid concentration (for
palmitic and stearic acid)
Incident diabetes: 12% E No diabetes: 11.6% E
Incident diabetes was identified during follow-up
visits, or diagnosed by physician after baseline
Age, sex, baseline BMI, waist-to-hip ratio,
alcohol intake, smoking, physical activity,
education, parental history of diabetes
7
National Heart,
Lung, and Blood
Institute
Wiberg et al. 2006 Sweden
Uppsala Longitudinal Study of Adult Men
≥50 100 2313 421 stroke or
transient ischemic attack
32
Measured with fatty acid principle
component (FPAC) for mean
SFAs
Myrstic Acid: 1.2 (ICH) vs. 1.1 (no count)
Palmitic Acid: 11.8 (ICH) vs. 11.7 (no count) % E
Swedish hospital discharge record and cause-of death
registries
hypertension, diabetes, metabolic syndrome,
serum cholesterol, atrial fibrillation,
cardiovascular disease, smoking, physical
activity, treatment with cardiovascular drugs at
baseline, treatment with antihypertensive
or antidiabetic medications or lipid-
lowering drugs,
5
Medical Faculty at Uppsala
University, the
Uppsala Geriatric
Fund, Swedish
Heart Lung Foundation
Wu et al. 2011 United Sates
Cardiovascular Health Study ≥65 37 2 890
631 CHD events, 61 sudden cardiac arrest events
7
Mean saturated fatty acid intake
(stearic acid) (validated SQFFQ)
~ 13.4 (1.1) Determined by a
centralized morbidity and mortality committee
Total energy, age, sex, race, education, income,
smoking status, prevalent diabetes, hypertension,
stroke, transient ischemic attack, BMI, physical
activity, alcohol use, total fat intake, phospholipid concentrations of long-chain n-3 fatty acids and
trans FAs, systolic BP, fasting HDL cholesterol, LDL cholesterol, triglycerides, C-
reactive protein, fibrinogen, incident angina, phospholipid concentration
of 14:0
9
National Heart, Lung and Blood Institute,
NIH Office of Dietary
Supplements National Institute of Neurologic
al Disorders and Stoke
(USA)
22
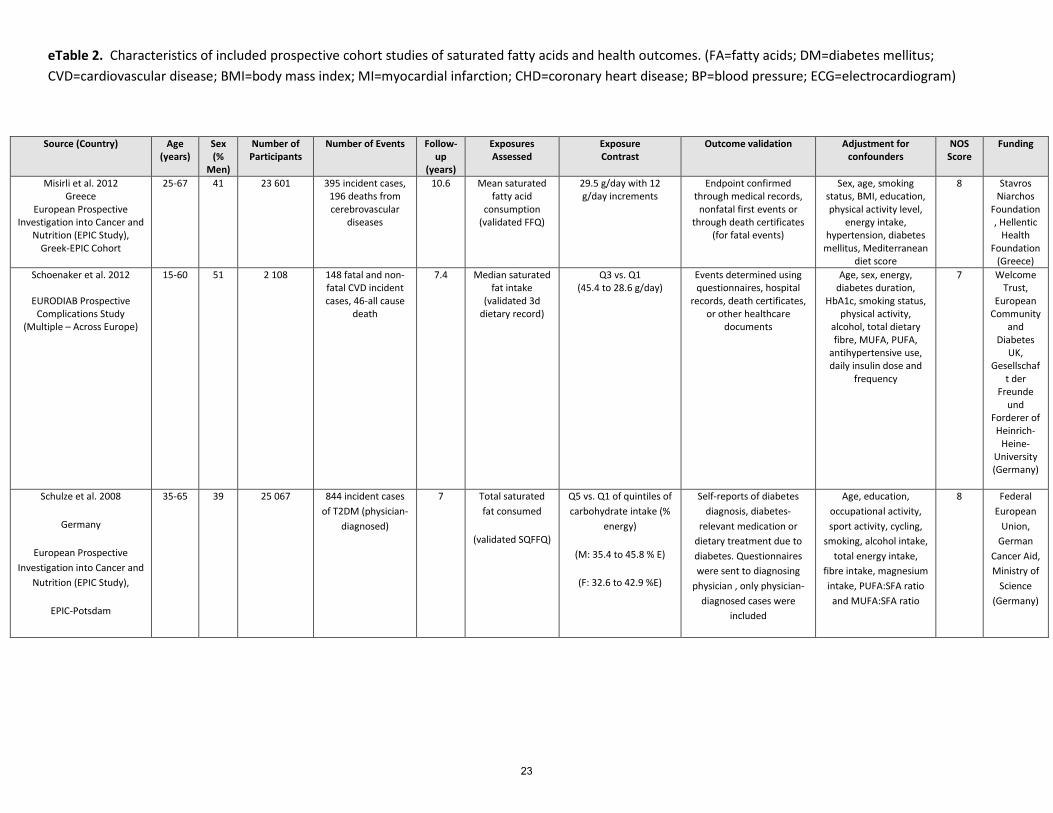
eTable 2. Characteristics of included prospective cohort studies of saturated fatty acids and health outcomes. (FA=fatty acids; DM=diabetes mellitus; CVD=cardiovascular disease; BMI=body mass index; MI=myocardial infarction; CHD=coronary heart disease; BP=blood pressure; ECG=electrocardiogram)
Source (Country) Age (years)
Sex (%
Men)
Number of Participants
Number of Events Follow-up
(years)
Exposures Assessed
Exposure Contrast
Outcome validation Adjustment for confounders
NOS Score
Funding
Misirli et al. 2012 Greece
European Prospective Investigation into Cancer and
Nutrition (EPIC Study), Greek-EPIC Cohort
25-67 41 23 601 395 incident cases, 196 deaths from cerebrovascular
diseases
10.6 Mean saturated fatty acid
consumption (validated FFQ)
29.5 g/day with 12 g/day increments
Endpoint confirmed through medical records,
nonfatal first events or through death certificates
(for fatal events)
Sex, age, smoking status, BMI, education, physical activity level,
energy intake, hypertension, diabetes
mellitus, Mediterranean diet score
8 Stavros Niarchos
Foundation, Hellentic
Health Foundation
(Greece) Schoenaker et al. 2012
EURODIAB Prospective
Complications Study (Multiple – Across Europe)
15-60 51 2 108 148 fatal and non-fatal CVD incident cases, 46-all cause
death
7.4 Median saturated fat intake
(validated 3d dietary record)
Q3 vs. Q1 (45.4 to 28.6 g/day)
Events determined using questionnaires, hospital
records, death certificates, or other healthcare
documents
Age, sex, energy, diabetes duration,
HbA1c, smoking status, physical activity,
alcohol, total dietary fibre, MUFA, PUFA,
antihypertensive use, daily insulin dose and
frequency
7 Welcome Trust,
European Community
and Diabetes
UK, Gesellschaf
t der Freunde
und Forderer of Heinrich-
Heine-University (Germany)
Schulze et al. 2008
Germany
European Prospective Investigation into Cancer and
Nutrition (EPIC Study),
EPIC-Potsdam
35-65 39 25 067 844 incident cases of T2DM (physician-
diagnosed)
7 Total saturated fat consumed
(validated SQFFQ)
Q5 vs. Q1 of quintiles of carbohydrate intake (%
energy)
(M: 35.4 to 45.8 % E)
(F: 32.6 to 42.9 %E)
Self-reports of diabetes diagnosis, diabetes-
relevant medication or dietary treatment due to diabetes. Questionnaires were sent to diagnosing
physician , only physician-diagnosed cases were
included
Age, education, occupational activity, sport activity, cycling,
smoking, alcohol intake, total energy intake,
fibre intake, magnesium intake, PUFA:SFA ratio and MUFA:SFA ratio
8 Federal European
Union, German
Cancer Aid, Ministry of
Science (Germany)
23
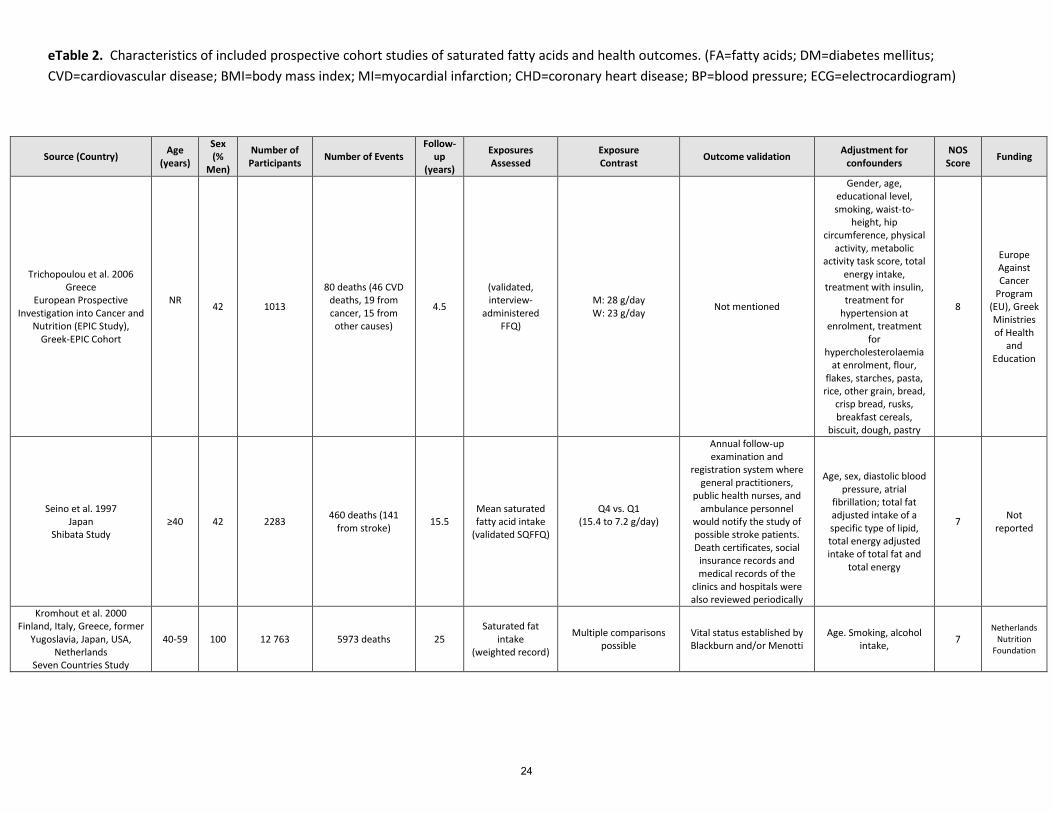
eTable 2. Characteristics of included prospective cohort studies of saturated fatty acids and health outcomes. (FA=fatty acids; DM=diabetes mellitus; CVD=cardiovascular disease; BMI=body mass index; MI=myocardial infarction; CHD=coronary heart disease; BP=blood pressure; ECG=electrocardiogram)
Source (Country) Age (years)
Sex (%
Men)
Number of Participants Number of Events
Follow-up
(years)
Exposures Assessed
Exposure Contrast Outcome validation Adjustment for
confounders NOS
Score Funding
Trichopoulou et al. 2006 Greece
European Prospective Investigation into Cancer and
Nutrition (EPIC Study), Greek-EPIC Cohort
NR 42 1013
80 deaths (46 CVD deaths, 19 from cancer, 15 from other causes)
4.5
(validated, interview-
administered FFQ)
M: 28 g/day W: 23 g/day Not mentioned
Gender, age, educational level, smoking, waist-to-
height, hip circumference, physical
activity, metabolic activity task score, total
energy intake, treatment with insulin,
treatment for hypertension at
enrolment, treatment for
hypercholesterolaemia at enrolment, flour,
flakes, starches, pasta, rice, other grain, bread,
crisp bread, rusks, breakfast cereals,
biscuit, dough, pastry
8
Europe Against Cancer
Program (EU), Greek Ministries of Health
and Education
Seino et al. 1997 Japan
Shibata Study ≥40 42 2283 460 deaths (141
from stroke) 15.5 Mean saturated fatty acid intake
(validated SQFFQ)
Q4 vs. Q1 (15.4 to 7.2 g/day)
Annual follow-up examination and
registration system where general practitioners,
public health nurses, and ambulance personnel
would notify the study of possible stroke patients. Death certificates, social
insurance records and medical records of the
clinics and hospitals were also reviewed periodically
Age, sex, diastolic blood pressure, atrial
fibrillation; total fat adjusted intake of a specific type of lipid, total energy adjusted intake of total fat and
total energy
7 Not reported
Kromhout et al. 2000 Finland, Italy, Greece, former
Yugoslavia, Japan, USA, Netherlands
Seven Countries Study
40-59 100 12 763 5973 deaths 25 Saturated fat
intake (weighted record)
Multiple comparisons possible
Vital status established by Blackburn and/or Menotti
Age. Smoking, alcohol intake, 7
Netherlands Nutrition
Foundation
24

eTable 2. Characteristics of included prospective cohort studies of saturated fatty acids and health outcomes. (FA=fatty acids; DM=diabetes mellitus; CVD=cardiovascular disease; BMI=body mass index; MI=myocardial infarction; CHD=coronary heart disease; BP=blood pressure; ECG=electrocardiogram)
Source (Country) Age (years)
Sex (%
Men)
Number of Participants Number of Events
Follow-up
(years)
Exposures Assessed
Exposure Contrast Outcome validation Adjustment for
confounders NOS
Score Funding
Alhazmi et al., 2013; Australia Longitudinal Study
on Women’s Health 45-50 0 9 101 311 incident cases 6
Saturated fat intake (Dietary
Questionnaire for Epidemiological Studies; DQES)
Q5 vs. Q1
Self-reported t2dm; validated by linkage to Medicare (MBS) and
Pharmaceutical Benefits Service (PBS)- 70%
confirmed
Area of residence, education, current smoking, physical activity, self-rated
health, menopausal status, BMI, alcohol, total energy, fibre,
other fats
6
Australian Government Department
of Health and Ageing
Chien et al., 2013; Japan (Chin-Shan)
≈60 47 3,602 568 deaths; 275 CVD events
≈10 Total saturated-fatty acids (Plasma)
56.3% vs. 45% of total fat
Official death certificates verified by house-to-house visits
Age, gender, BMI, smoking, drinking, marital status, education level, job and sports activity, hypertension, diabetes, LDL-C and HDL-C
7 National Science Council; National Taiwan University (Taiwan)
Wakai et al., 2014; Japan (JACC) ≈56 39 58,672 11,656 deaths;
1,665 CV deaths 19.3 Total saturated fat (validated
SQFFQ) 7.3 vs. 3.0% E
Population registries (mandatory reporting);
causes of death from death certificates
Age, area, education, smoking, alcohol, BMI,
sleep duration, walking, F&V, total energy
8
Ministry of education,
science, sports,
culture of Japan;
Japanese Ministry of Education,
Culture, Sports,
Science, and Technology,
National Cancer Center
Research Developmen
t Fund
Shekelle et al., 1981; U.S.A. (Western Electric Study) 40-55 100 1,900 215 CHD deaths 19
Total saturated fat (Burke diet
history) 1-unit increase
Death certificats for all decedants reviewed and adjudicated according to
ICD-8
Age, SBP, smoking, serum cholesterol,
alcohol, BMI, ancestry 6
American and Chicago
Heart Associations;
private donors; National Cancer
Institute
Kushi et al., 1985; U.S.A.-Ireland (Ireland-Boston Heart
Study) 40-60 100 1,001 110 CHD deaths 23
Total saturated fat (Burke diet
history) Top 3rd vs. Bottom 3rd
Death certificates for all decedants reviewed and adjudicated according to
ICD-9
Age, cohort, SBP, serum cholesterol, LVH, smoking, alcohol
6
NIH, Irish Heart
Foundation, Harvard
School of Public Health
25

eTable 2. Characteristics of included prospective cohort studies of saturated fatty acids and health outcomes. (FA=fatty acids; DM=diabetes mellitus; CVD=cardiovascular disease; BMI=body mass index; MI=myocardial infarction; CHD=coronary heart disease; BP=blood pressure; ECG=electrocardiogram)
Source (Country) Age (years)
Sex (%
Men)
Number of Participants Number of Events
Follow-up
(years)
Exposures Assessed
Exposure Contrast Outcome validation Adjustment for
confounders NOS
Score Funding
Virtanen et al., 2014; Finland (Kuopio Ischemic Heart
Disease Risk Factor Study) 42-60 100 1,981
183 fatal and 382 non-fatal CHD
events 21.4
Total saturated fat (4-day
prospective diet record)
Q4 vs. Q1 (22.8% vs. 13.4%)
Link to national death registry; adjudicated according to ICD-9
Age, examination year, energy intake, BMI,
diabetes, hypertension, family history of CHD, pack-years of smoking, education, leisure-time
physical activity, alcohol, fiber, % energy
from protein, other fatty acids
9 University of
Eastern Finland
Mahendran et al., 2014; Finland (METSIM Cohort) 45-73 100 735 30 incident type 2
diabetes cases 5
Erythrocyte fatty acids (total
saturated and isomers)
1-unit increase Some cases (23/30) diagnosed by OGTT at 5-y mark (remaining 7 unclear)
Age, BMI, smoking, physical activity, Matsuda insulin-sensitivity-index,
6
Academy of Finland,
Institute of Biomedicine Physiology,
Institute University of
Eastern Finland, Kuopio
University Hospital, Finnish
Diabetes Research
Foundation
De Goede et al., 2014; Netherlands (Zutphen Elderly
Study) 65-85 100 686 132 incident CHD
events 15
Total and food sources of
saturated fat (Cross-check diet history method)
T3 vs. T1 (21.7 vs. 14.2%)
Municipal population registries and hospital or GP records
Age, smoking, BMI, physical activity,
socioeconomic status, alcohol, total energy,
carbohydrates, protein, MUFA, trans fats,
dietary fibre
8
National Cancer
Institute (U.S.),
Academy of Finland
26

eTable 3. Characteristics of included nested case-control, and case-cohort studies of saturated fatty acids and health outcomes. (FA=fatty acids; DM=diabetes mellitus; CVD=cardiovascular disease; BMI=body mass index; MI=myocardial infarction; CHD=coronary heart disease; BP=blood pressure; ECG=electrocardiogram)
Source (Country)
Age (years)1
Sex (%
Men)2
Number of Cases/Controls
Case definition
Control definition
Follow-up (y) Exposures
Assessed Exposure Contrast
Case assessment
Adjustment for confounders
NOS Score Funding
Clarke et al. 2009
(Whitehall; nested case-
control)
79 (5) 100
116/239 [1:2]
CHD deaths in individuals
with no history of
CVD at baseline
Participants in Whitehall with no history of
CVD or statin use
30 Phosholipid fatty acids (16:0, 18:0, total SFA)
46.1% vs. 41.5% (4.6%) total SFA
Identified from Office for National
Statistics
Age, employment grade, SBP, BMI, smoking,
diabetes, apo A, HDL-C, apo-B, LDL-C, CRP,
fibrinogen, albumin
6 British Heart Foundation(UK),
Medical Research Council
(UK), Fisheries Scholarship
Grant, National Fisheries
Institute (USA) Hodge et al.
2007 (Melbourne
Collaborative Cohort Study; prospective case-cohort)
58/55 51/43 346/3391 [1:10]
Self-reported type 2
diabetes
Randomly sampled from
the cohort
4 Dietary saturated fat (total, 15:0, 16:0, 18:0),
phospholipid fatty acids
(total, 15:0, 16:0, 18:0)
Q5 vs. Q1 (not stated) confirmed by family
physician
Age, sex, country of birth, family history of DM,
physical activity, alcohol, BMI, WHR
8 VicHealth, Cancer Council
VIctoria, National Health
and Medical Research Council
(Australia)
Kröger et al. 2011 (EPIC-Potsdam;
prospective case-cohort)
55/50 58/39 673/2114 [1:3]
Self-reported t2dm during follow-up
Random sample; representative of
cohort at baseline
7 Erythrocyte fatty acids
(14:0 to 18:0; 20:0 to 24:0,
total SFA); also dietary fatty acids
(14:0 to 20:0, 22:0; total
SFA) by FFQ
Erythrocyte membrane FA (Q5 v Q1) [% total] 14:0 – 0.57 v. 0.23% 15:0- 0.32 v. 0.13% 16:0- 25.6 v. 19.8% 17:0-0.41 v. 0.26% 18:0- 15.1 v. 12.2% 20:0 0.52 v. 0.30% 21:0-0.07 v. 0.02% 22:0-2.15 v. 1.16% 23:0-0.39 v. 0.19% 24:0- 5.6 v. 3.1% Dairy: 0.71 v. 0.41% Total: 48.6 v. 41.2%
Self report; confirmed by
interview with
diagnosing physician
Age, sex, BMI, waist, cycling, sports activity,
education, coffee intake, smoking, alcohol intake,
occupational activity, fiber
8 Federal Ministry of Science,
German Cancer Aid, German
Research Foundation (Germany); European
Community
1 If a single number presented, represents mean age of all participants; if “x/y” then this is mean age of cases/controls 2 If a single number presented, represents percentage of all participants who were men; if “x/y” then this percentage of cases/controls who were men
27
eTable 3. Characteristics of included nested case-control, and case-cohort studies of saturated fatty acids and health outcomes. (FA=fatty acids; DM=diabetes mellitus; CVD=cardiovascular disease; BMI=body mass index; MI=myocardial infarction; CHD=coronary heart disease; BP=blood pressure; ECG=electrocardiogram)
Source (Country)
Age (years)3
Sex (%
Men)4
Number of Cases/Controls
Case definition
Control definition
Follow-up (y) Exposures
Assessed Exposure Contrast
Case assessment
Adjustment for confounders
NOS Score Funding
Simon et al. 1995 (MRFIT; nested case-control; USA)
35-57 100 94/94 [1:1]
Men with fatal or non-fatal MI or
sudden cardiac death
“Usual care” group subjects
matched on age, randomization
date, center
6.9 Cholesterol ester FA and phospholipids (14:0, 16:0, 18:0)
Per 1 standard deviation increase in % CE or PPL
Clinic, hospital records,
next-of-kin interviews,
death certificats,
autopsy reports
Plasma cholesterol levels, DBP, tobacco use
7 National Heart, Lung, and Blood Institute (USA)
Sun et al. 2007 (Nurses’ Health Study; USA; nested case-control)
30-55 0 166/327 [1:2]
Ischemic Heart Disease
From cohort, matched on age, smoking, fasting status, date of
blood draw
6 Plasma and erythrocyte fatty acids (14:0, 15:0, 16:0, 17:0, 18:0); diet (14:0; 16:0)
T3 vs. T1 (%) [plasma] 15:0-> 0.21 vs. 0.11% 17:0-> 0.36 vs. 0.25% T3 vs. T1 (%) [erythrocyte] 15:0-> 0.14 vs. 0.07% 17:0-> 0.40 vs. 0.29%
Self reported;
confirmed by medical record
review by blinded study
physicians
Age. date of blood draw, smoking, fasting status, BMI, post-menopausal status, physical activity, alcohol, aspirin, family history of MI, hypertension, hypercholesterolemia, history of diabetes, total trans fatty acids
9 National Institutes of Health (USA)
Matthan et al., 2014
(WHI-OS); nested case-
control
67.8 0 1224/1224 [1:1]
CHD (hospitalized myocardial infarction [MI], definite silent MI, and coronary death defined as death consistent with CHD as the underlying cause
Selected from cohort without CVD, matched on age, date of
enrollment, race/ethnicity, hysterectomy
status at baseline
4.5 Total saturated fat, 12:0, 14:0, 15:0, 16:0, 18:0, 20:0, 22:0, 24:0 (plasma PPL)
Per SD review of medical
records and death
certificate
Age, enrollment date, race/ethnicity, hysterectomy status, BMI, SBP, smoking, education, medication use, HRT use, carbohydrate, protein, and alcohol
8
3 If a single number presented, represents mean age of all participants; if “x/y” then this is mean age of cases/controls 4 If a single number presented, represents percentage of all participants who were men; if “x/y” then this percentage of cases/controls who were men
28

eTable 3. Characteristics of included nested case-control, and case-cohort studies of saturated fatty acids and health outcomes. (FA=fatty acids; DM=diabetes mellitus; CVD=cardiovascular disease; BMI=body mass index; MI=myocardial infarction; CHD=coronary heart disease; BP=blood pressure; ECG=electrocardiogram)
Source (Country)
Age (years)5
Sex (%
Men)6
Number of Cases/Controls
Case definition
Control definition
Follow-up (y) Exposures
Assessed Exposure Contrast
Case assessment
Adjustment for confounders
NOS Score Funding
Salonen et al. 1985 (Finnish Heart Study; nested case-
control)
55/54 76 92/92 [1:1] CHD deaths
From cohort; matched on age,
smoking, sex, cholsterol BP
5 Serum FA (total PUFA, total SFA)
Serum polyunsaturated/saturated
FA ratio >0.28 vs. ≤0.28
National death
certificate register; cause of
death was that assigned
by Central Statistical
Office
Age. smoking, sex, cholesterol, BP, strong
alcoholic beverages, absenteeism, diabetes, history of MI/angina in
parent or sibling, cardiovascular medication,
study area
6
Not stated
Pierucci et al. 2012 (nested case-control; ONCONUT,
Italy)
67 62 97/194 [1:2]
Self-reported cases of MI
Randomly sected from cohort; matched on diabetes, gender, age
5 Dietary SFA (validated
FFQ)
Q3 vs. Q1 Confirmed by discharge hospital
records and ECG
Energy, age, gender, BMI, smoking, hypertension
7 Not stated
Forouhi et al.; Europe; EPIC InterAct (case-cohort)
52±9 12,132/15,919 [1:1]
self-reported incident diabetes data
Randomly selected noncases
16 Total SFA, 14:0, 15:0, 16:0, 17:0, 18:0, 20:0, 22:0, 23:0, 24:0 (plasma PPL)
Per 1-SD difference linkage to primary care registers, secondary care registers, medication use (drug registers), hospital admissions, and mortality data
Age, centre, sex, physical activity, smoking,
education, total energy, alcohol, BMI, meat, fruits
and vegetables, soft drinks, total dairy products, HbA1c
8 European Union
5 If a single number presented, represents mean age of all participants; if “x/y” then this is mean age of cases/controls 6 If a single number presented, represents percentage of all participants who were men; if “x/y” then this percentage of cases/controls who were men
29

eTable 4. Characteristics of included retrospective case-control studies of saturated fatty acids and health outcomes. (FA=fatty acids; DM=diabetes mellitus; CVD=cardiovascular disease; BMI=body mass index; MI=myocardial infarction; CHD=coronary heart disease; BP=blood pressure; ECG=electrocardiogram)
Source (Country) Age Sex
(% Men)
No. Cases/Controls
Case definition Control definition
Exposures assessed
Exposure contrast
Case Assessment
Adjustment for confounders
NOS score
Funding
Hodge et al. 1996 (Wanigelas, Koki)
~40 52 145/140 Those in the study diagnosed with NIDDM
during follow-up
Matched for age, sex, with
normal glucose
Dietary saturated
fat; measured by
FFQ administered by dietitian
10 g increase in total saturated fat
Diagnosed by a physician or
observation of a 2h plasma
glucose >10 mmol/L
Age, sex, BMI, WHR, physical
activity
6 National Health and
Medical Research Council
(Australia)
Park et al. 2009 (Korea)
56 (14)
71 50/50 Consecutively recruited acute non-fatal MI
admitted to Hanyang University Kuri Hospital
Matched on age and sex,
with no history of CHD, cancer, hyperlipidemia,
or diabetes
Erythrocyte SFA: 14:0, 16:0, 18:0
T3 vs. T1 (%) 14:0->0.37 v. ≤0.26% 16:0->22.6 vs <21.6% 18:0->18.1 vs <16.3%
Hospital chart review
Matching: age, sex Covariates: Age, sex, history of DM, family history of CHD, smoking, hypertension, glucose, total-C, HDL-C
3 Korean Research Foundation
Monteiro et al. 2007
>44 57 290/697 Consecutively admitted cases of ischemic stroke admitted to St. John’s
Hospital
Random digit dialling from
parish registries in the
hospital’s catchement
area
Dietary SFA (FFQ)
Men 12:0 0.5 vs. 0.2 g 14:0 2.2 vs. 1.2 g
16:0 15.7 vs. 11.4 g 18:0 6.7 vs. 4.6 g
Women
12:0 0.5 vs. 0.2 g 14:0 2.0 vs. 1.2 g
16:0 13.0 vs. 9.9 g 18:0 5.7 vs. 4.1 g
Defined by clinical evaluation
including imaging
Age, education, energy, physical activity, smoking, alcohol, hypertension, dyslipidemia, diabetes, family history of CVD
8 Project EPICardis, Science and Technology Foundation (Portugal)
Sun et al. 2011 (Nanjing, China)
63/61 69/64 108/129
Cases of CAD (fatal and non-fatal) admitted to
Nanjing, CHINA hospitals based on symptoms and
ECG
Matched controls
(within 5y), sex, obesity,
DM
Serum free FA (16:0,
18:1)
Serum palmitic acid:oleic acid ratio
CAD assessed independently by 2
angiographers; defined as ≥70%
narrowing of lumen diameter of left
anterior descending, left circumflex, R
coronary artery; or ≥50% narrowing of
left main
LDL-C:HDL-C, apo-B:HDL-C 5
National Natural Science
Foundation, 973 Program,
The “111” project, Natural Science
Foundation of Jangsu
Province (China)
30
eTable 4. Characteristics of included retrospective case-control studies of saturated fatty acids and health outcomes. (FA=fatty acids; DM=diabetes mellitus; CVD=cardiovascular disease; BMI=body mass index; MI=myocardial infarction; CHD=coronary heart disease; BP=blood pressure; ECG=electrocardiogram)
Source (Country) Age Sex
(% Men)
No. Cases/Controls
Case definition Control definition
Exposures assessed
Exposure contrast
Case Assessment
Adjustment for confounders
NOS score
Funding
Aslibekyan et al. 2012 (Costa Rica) 58 73 1815/1815
Cases of first non-fatal MI residing in Central Valley of Costa Rica
Matched on residence, age,
sex
Adipose tissue FA (15:0 and
17:0)
Q5 vs. Q1 15:0 (0.30 vs. 0.13%) 17:0 (0.27 vs. 0.14%)
Assessed by 2 independent
cardiologists in participating
hospitals
Total energy, age/sex/residence,
income, physical activity, WHR,
alcohol, adipose tissue ALA, history of hypertension, dylsipidemia, or
DM, adipose tissue CLA, dietary
calcium
8 National
Institutes of Health (USA)
Biong et al. 2006 (Norway) 62 72 100/98
Cases of first MI recruited from coronary
care units of Ulleval Hospital (Oslo) and
Østfold Central Hospital (Fredrikstat and
Sarpsborg)
Frequency matched for age in 5-y intervals from catchement area of cases + friends and relatives of cases
Adipose tissue FA
(14:0, 15:0 and 17:0)
Q4 v. Q1 14:0->4.20 vs. <3.1%
15:0->0.47 vs. <0.36% 17:0->0.30 vs. <0.24%
Unclear
Age, sex, WHR, smoking, family history of CHD,
education
8 Not stated
Lopes et al. 1998 (Portugal)
58±11 100 214/214 Male patients ≥40 y.o. consecutively admitted
to northern Portugal hospital with 1st MI, and
4-day survival
Population-based; men
≥40 y.o.; random digit dialing from catchement area of the
hospital; no history of MI
Total saturated fat
(validated FFQ)
Q4 vs. Q1 (cutoffs not stated)
Attending cardiologist
Matching: age, sex Covariates: Age, education, family
history of MI, smoking, physical
activity, total energy, BMI
7 Not stated
Suh et al. 2001 ~55 100 108/142 Admitted to university teaching hospital
From departments of opthamology
and orthopedic surgery with no history of CVD
Dietary total SFA
(validated FFQ)
Per 1% of energy intake
ECG confirmed (≥50% stenosis)
BMI, smoking, energy intake,
total fat 6
Basic Research Medical Fund
(Korea)
31

eTable 5. Risk of bias of included reports from prospective cohort studies as assessed with the Newcastle-Ottawa Scale
Study References Selection (4) Comparability (2) Outcome (3) Total (9) Comments Adult Health Study (Japan)
Sauvaget 1 2 2 5 Cohort exposed to Hiroshima atomic bomb may manifest CVD in unique ways; single-day food diary not validated; CVD prevalence at baseline unclear; attrition rate unclear
ATBC Study (Finland)
Pietinen 1997 4 1 3 8 Did not collect data on/or control for family history
ATBC Study (Finland)
Simila 2012 4 1 3 8 Did not collect data on/or control for family history
Atheroclerosis Risk in Communities (ARIC) study (USA)
Wang 4 1 2 7 Did not control for total energy intake; unclear if events formally adjudicated
Atheroclerosis Risk in Communities (ARIC) study (USA)
Yamagishi 2013 Cerebrovasc Dis
4 1 2 7 Did not control for family history; attrition rate unclear
Australian Longitudinal Study on Women’s Health (Australia)
Alhazmi 2013 4 1 1 6 Did not control for family history; self-report of diabetes only with a 70% confirmation in a subset; attrition rate unclear
Baltimore Longitudinal Study of Aging (USA)
Tucker 4 1 3 8 Did not control for socioeconomic status or family history
Caerphilly Prospective Study (UK)
Atkinson 4 2 2 8 Attrition rate unclear
Caerphilly Prospective Study (UK)
Fehily 4 0 3 7 CVD prevalence at baseline ≈25%; Did not control for socioeconomic status, family history, or total energy intake
Cardiovascular Health Study (USA)
Ma, 2015 4 2 3 9
Cardiovascular Health Study (USA)
Mozaffarian, 2010
4 2 3 9
Cardiovascular Health study (USA)
Wang, 2015 [diabetes]
4 2 3 9
Diet, Cancer and Health (Denmark)
Jakobsen 2010 4 0 3 7 Did not control for socioeconomic status or family history
EPIC-Greece (Greece)
Misirli 4 1 3 8 Did not control for family history
32

eTable 5. Risk of bias of included reports from prospective cohort studies as assessed with the Newcastle-Ottawa Scale
Study References Selection (4) Comparability (2) Outcome (3) Total (9) Comments EPIC-Greece (Greece)
Trichopoulou 4 1 3 8 Did not control for family history
EPIC-Norfolk (UK) Harding 4 1 3 8 Did not control for socioeconomic status EPIC-Potsdam (Germany)
Schulze 4 1 3 8 Did not control for family history
EURODIAB Prospective Complications Study (16 European countries)
Shoenaker 4 0 3 7 Did not control for socioeconomic status or family history
Finnish Diabetes Prevention Study (Finland)
Lindstrom 2006 2 0 3 5 Participants with impaired glucose tolerance at baseline; did not control for socioeconomic status, smoking, total energy intake, or family history
Framingham Heart Study (USA)
Gillman 4 0 3 7 Did not control for socioeconomic status or family history
Framingham Heart Study (USA)
Posner 4 1 3 8 Did not control for family history
Health and Lifestyle Survey (UK)
Boniface 4 1 2 7 Did not control for total energy intake; deaths not formally adjudicated
Health Professionals’ Follow-up Study (USA)
Ascherio 1996 4 2 3 9
Health Professionals’ Follow-up Study (USA)
He 4 1 2 7 Did not control for family history; attrition rate unclear
Health Professionals’ Follow-up Study (USA)
van Dam 4 1 3 8 Did not control for family history
Honolulu Heart Program (USA)
McGee 1985 3 0 3 6 24-hour recall not validated; did not control for socioeconomic status or family history
Insulin Resistance Atherosclerosis Study (USA)
Santaren 4 1 3 8 Did not control for family history
Iowa Women’s Health Study (USA)
Meyer 4 1 1 6 Did not control for family history; self-reported diabetes diagnoses with poor validity (36% overreporting)
33
eTable 5. Risk of bias of included reports from prospective cohort studies as assessed with the Newcastle-Ottawa Scale
Study References Selection (4) Comparability (2) Outcome (3) Total (9) Comments Ireland–Boston Diet–Heart Study (USA, Ireland)
Kushi 3 0 3 6 Diet history not validated; Did not control for socioeconomic status or family history
Israeli Ischemic Heart Disease Study (Israel)
Goldbourt 4 0 3 7 Did not control for socioeconomic status or family history
Japan Collaborative Cohort (Japan)
Wakai 4 2 2 8 Response rate = 83%
Japan Public Health Center-based prospective Study (Japan)
Yamagishi 2013 Eur H J
4 1 2 7 No family history adjustment; no information on attrition rate
Kuopio Ischaemic Heart Disease Risk Factor (KIHD) Study (Finland)
Laaksonen 4 2 3 9
Kuopio Ischemic Heart Disease Risk Factor (KIHD) Study (Finland)
Virtanen 4 2 3 9
Lipid Research Clinics (Canada)
Esrey 4 0 2 6 Did not control for socioeconomic status or family history; attrition rate unclear
Malmö Diet and Cancer Study (Sweden)
Leosdottir 2005; 2007
4 1 2 7 Did not control for family history; unclear if events formally adjudicated
METSIM cohort (Finland)
Mahendran 2014
4 0 2 6 Subset of METSIM cohort (n=1346 of10,197) representative of full cohort; did not control for family history or total energy intake; 23 of 30 incident cases of t2dm diagnosed at 5-y followup visit; 7 cases unclear ascertainment procedure
MONICA+ Cohorts (Denmark)
Jakobsen 2004; 2007
4 2 2 8 Events ascertained through record linkage only prior to 1977
Multi-Ethnic Study of Atherosclerosis (USA)
De Oliveira Otto; Mozafarrian 2013
4 2 3 9
National Taiwan University Hospital Study (Taiwan)
Chien 4 1 2 7 Did not control for family history; response rate = 85%
34

eTable 5. Risk of bias of included reports from prospective cohort studies as assessed with the Newcastle-Ottawa Scale
Study References Selection (4) Comparability (2) Outcome (3) Total (9) Comments Norwegian Countries Study (Norway)
Laake 4 1 1 6 Did not control for family history; events not formally adjudicated
Nurses’ Health Study (USA)
Willett 1993 4 2 3 9 Sampling from homogenous profession effectively controls for socioeconomic status
Nurses’ Health Study (USA)
Hu 1997 4 2 3 9 Sampling from homogenous profession effectively controls for socioeconomic status
Nurses’ Health Study (USA)
Hu 1999 4 2 3 9 Sampling from homogenous profession effectively controls for socioeconomic status
Nurses’ Health Study (USA)
Salmeron 2001 4 2 3 9 Sampling from homogenous profession effectively controls for socioeconomic status
Nurses’ Health Study (USA)
Oh 2005 4 2 3 9 Sampling from homogenous profession effectively controls for socioeconomic status
Nurses’ Health study (USA)
Tanasescu 2004 4 2 2 8 Attrition rate unclear
Nurses’ Health study and Health Professionals’ Follow-up studies (pooled; USA)
Yakoob 2014 (diabetes) and 2014 (stroke)
4 2 3 9 Sampling from homogenous profession effectively controls for socioeconomic status
Seven Countries Study (7 countries)
Kromhout 4 0 3 7 Did not control for age, socioeconomic status, total energy intake, or family history
Reasons for Geographical and Racial Differences is Stroke (USA)
Kiage 2013 [total mortality outcome]
4 2 2 8 Attrition rate unclear
Reasons for Geographical and Racial Differences is Stroke (USA)
Kiage 2014 [stroke outcome]
4 1 2 7 Did not control for family history; attrition rate unclear
Shibata City Cohort (Japan)
Seino 4 0 3 7 Did not control for socioeconomic status, smoking, or family history
Strong Heart Study (USA)
Xu 2006 3 1 3 7 Diet assessed with single 24-h recall; did not control for family history
Uppsala Longitudinal Study of Adult Men (Sweden)
Wiberg 3 0 2 5 No reliability measures for fatty acids; did not control for socioeconomic status, family history, or total energy intake; unclear if events formally adjudicated
35

eTable 5. Risk of bias of included reports from prospective cohort studies as assessed with the Newcastle-Ottawa Scale
Study References Selection (4) Comparability (2) Outcome (3) Total (9) Comments Vegetarian Society Study (UK)
Mann 3 1 2 6 CVD prevalence at baseline unclear; Vegetarians may differ from omnivores in other health behaviours; attrition rate unclear
Western Electric Study (U.S.A.)
Shekelle 3 0 3 6 Diet history not validated; did not control for family history, socioeconomic status, or total energy intake
Western Norway B-Vitamin Intervention trial (Norway)
Puaschitz 4 0 0 4 All participants with coronary artery disease; did not control for socioeconomic status, total energy intake; death registry only; follow-up <5 years
Women’s Health Initiative (USA)
Howard 4 1 3 8 Did not control for family history
Women’s Health Initiative Observational Study (USA)
Yaemsiri 2012 4 1 3 8 Did not control for family history
Women’s Health Study (USA)
Song 4 1 2 7 Did not control for socioeconomic status; attrition rate unclear
Zutphen Elderly Study (Netherlands)
Oomen 4 0 3 7 Did not control for family history or socioeconomic status
Zutphen Elderly Study (Netherlands)
De Goede 4 1 3 8 Did not control for family history
Multiple publications from a single cohort (e.g. Nurses’ Health Study, Health Professionals Follow-up Study, Malmö Diet and Cancer Study) were each rated independently because they measured different exposures or outcomes in each publication.
36

eTable 6. Risk of bias of included prospective nested case-control/case-cohort and retrospective case-control studies as assessed with the Newcastle-Ottawa Scale
Study References Selection (4) Comparability (2) Outcome (3) Total (9) Comments Prospective nested case-control Whitehall Study (UK) Clarke 4 0 2 6 Did not control for or match on family history or total energy intake;
unclear if events formally adjudicated Cardiovascular Health Study (USA)
Lemaitre, 2006 4 1 3 8 Did not control for family history
European Prospective Investigation into Cancer (EPIC)-Norfolk (UK)
Khaw et al. 4 1 2 7 Did not control for total energy intake; attrition rate unclear
European Prospective Investigation into Cancer (EPIC)-Norfolk (UK)
Patel et al. 4 0 3 7 Did not control for total energy intake or socioeconomic status
Hunter Community Study (Australia)
Alhazmi 4 0 1 5 Did not control for or match on family history or total energy intake; self-report of type 2 diabetes only; 23% loss-to-follow up
ONCONUT Study (Italy)
Pierucci 4 0 3 7 Did not control for or match on socioeconomic status, smoking, or family history
Nurses’ Health Study (USA)
Q Sun 2007 – AJCN
4 2 3 9 Sampling from homogenous profession effectively controls for socioeconomic status
Nurses’ Health study (USA)
Q Sun 2007 – Circulation
4 2 3 9 Sampling from homogenous profession effectively controls for socioeconomic status
Women’s Health Initiative- Observational Study (USA)
Matthan 2014 4 1 3 8 Did not control for total energy intake
Multiple Risk Factor Intervention Trial (USA)
Simon 4 0 3 7 Did not control for or match on family history or total energy intake
41

eTable 6. Risk of bias of included prospective nested case-control/case-cohort and retrospective case-control studies as assessed with the Newcastle-Ottawa Scale
Study References Selection (4) Comparability (2) Outcome (3) Total (9) Comments Prospective case-cohort European Prospective Investigation into Cancer (EPIC)-InterAct (Europe)
Forouhi 4 1 3 8 Did not control for or match on family history
European Prospective Investigation into Cancer (EPIC)-Potsdam (Germany)
Kröger 4 1 3 8 Did not control for family history
Melbourne Collaborative Cohort (Australia)
Hodge 4 2 2 8 Attrition rate unclear
Retrospective case-control Costa Rica Asilbekyan 4 1 3 8 Did not control for or match on family history Costa Rica Baylin 4 1 3 8 Did not control for or match on family history Norway Biong 4 1 3 8 Did not control for or match on total energy intake Costa Rica Colon-Ramos 4 1 3 8 Did not control for match on family history Iran Ghahremanpour 3 0 2 5 Unclear if cases were consecutively sampled; did not control for or match
on age, total energy intake, socioeconomic status, or family history Portugal Lopes 1998 4 1 2 7 Did not control for match on family history; differential participation rates
(85% of approached cases vs. 70% of approached controls) Portugal Lopes 2007 4 1 3 8 Overall low participation rate for adipose tissue biopsies, but similar in
both cases and controls (16%); controls with biopsies were older, and more educated than cases
North Portugal Monteiro 4 1 3 8 Did not control for or match on socioeconomic status South Korea Park 1 0 2 3 Catchement area of hospital serving cases and control sampling frame
unclear; did not control for or match on socioeconomic status or total energy intake
Eastern Finland Salonen 4 0 2 6 Did not control for or match on socioeconomic status or total energy intake South Korea Suh 4 0 2 6 Did not control for or match on socioeconomic status or family history China L Sun 2011 3 0 2 5 Source of cases unclear; did not control for or match on socioeconomic
status, smoking, or total energy intake; participation rates in cases vs. controls unclear;
Paupa New Guinea Hodge 4 0 2 6 Did not control for or match on smoking or family history; unclear if events formally adjudicated
42

eTable 6. Risk of bias of included prospective nested case-control/case-cohort and retrospective case-control studies as assessed with the Newcastle-Ottawa Scale
Study References Selection (4) Comparability (2) Outcome (3) Total (9) Comments Retrospective case-control Rotterdam van de Vijver 3 0 3 6 Sources of controls unclear; did not control for or match on socioeconomic
status or family history EURAMIC Aro 3 0 2 5 Some controls were hospital controls or friends of cases; did not control for
on match on socioeconomic status or family history, or total energy United States Block 2 2 2 6 Source of cases unclear, but used hospital controls Norway Pedersen 2 2 3 7 Catchement area of cases unclear; friend controls Jordan Mashal 2 0 2 4 Unclear catchement area of cases; control selection not described; did not
control for or match on total energy intake or smoking Adelaide Clifton 4 1 2 7 Did not match on or control for family history or smoking Multiple publications from a single cohort (e.g. Nurses’ Health Study, Health Professionals Follow-up Study, Malmö Diet and Cancer Study) were each rated independently because they measured different exposures or outcomes in each publication.
43
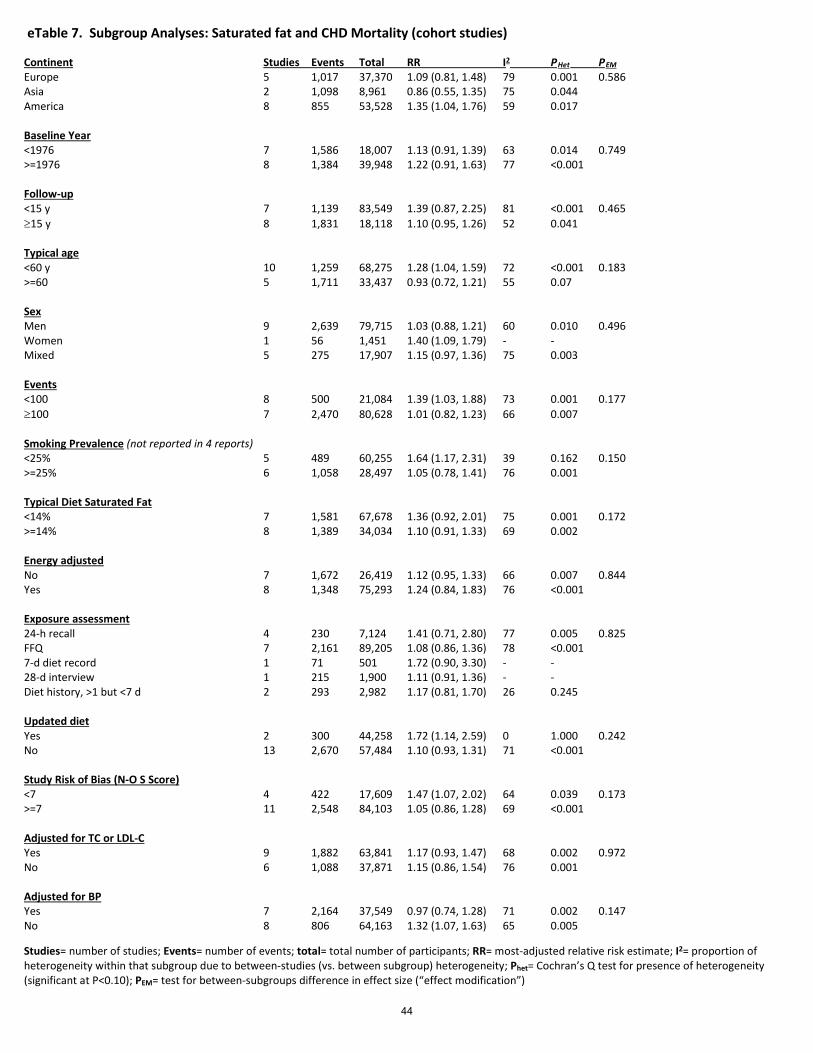
Studies= number of studies; Events= number of events; total= total number of participants; RR= most-adjusted relative risk estimate; I2= proportion of heterogeneity within that subgroup due to between-studies (vs. between subgroup) heterogeneity; Phet= Cochran’s Q test for presence of heterogeneity (significant at P<0.10); PEM= test for between-subgroups difference in effect size (“effect modification”)
eTable 7. Subgroup Analyses: Saturated fat and CHD Mortality (cohort studies)
Continent Studies Events Total RR I2 PHet PEM Europe 5 1,017 37,370 1.09 (0.81, 1.48) 79 0.001 0.586 Asia 2 1,098 8,961 0.86 (0.55, 1.35) 75 0.044 America 8 855 53,528 1.35 (1.04, 1.76) 59 0.017 Baseline Year <1976 7 1,586 18,007 1.13 (0.91, 1.39) 63 0.014 0.749 >=1976 8 1,384 39,948 1.22 (0.91, 1.63) 77 <0.001 Follow-up <15 y 7 1,139 83,549 1.39 (0.87, 2.25) 81 <0.001 0.465 ≥15 y 8 1,831 18,118 1.10 (0.95, 1.26) 52 0.041 Typical age <60 y 10 1,259 68,275 1.28 (1.04, 1.59) 72 <0.001 0.183 >=60 5 1,711 33,437 0.93 (0.72, 1.21) 55 0.07 Sex Men 9 2,639 79,715 1.03 (0.88, 1.21) 60 0.010 0.496 Women 1 56 1,451 1.40 (1.09, 1.79) - - Mixed 5 275 17,907 1.15 (0.97, 1.36) 75 0.003 Events <100 8 500 21,084 1.39 (1.03, 1.88) 73 0.001 0.177 ≥100 7 2,470 80,628 1.01 (0.82, 1.23) 66 0.007 Smoking Prevalence (not reported in 4 reports) <25% 5 489 60,255 1.64 (1.17, 2.31) 39 0.162 0.150 >=25% 6 1,058 28,497 1.05 (0.78, 1.41) 76 0.001 Typical Diet Saturated Fat <14% 7 1,581 67,678 1.36 (0.92, 2.01) 75 0.001 0.172 >=14% 8 1,389 34,034 1.10 (0.91, 1.33) 69 0.002 Energy adjusted No 7 1,672 26,419 1.12 (0.95, 1.33) 66 0.007 0.844 Yes 8 1,348 75,293 1.24 (0.84, 1.83) 76 <0.001 Exposure assessment 24-h recall 4 230 7,124 1.41 (0.71, 2.80) 77 0.005 0.825 FFQ 7 2,161 89,205 1.08 (0.86, 1.36) 78 <0.001 7-d diet record 1 71 501 1.72 (0.90, 3.30) - - 28-d interview 1 215 1,900 1.11 (0.91, 1.36) - - Diet history, >1 but <7 d 2 293 2,982 1.17 (0.81, 1.70) 26 0.245 Updated diet Yes 2 300 44,258 1.72 (1.14, 2.59) 0 1.000 0.242 No 13 2,670 57,484 1.10 (0.93, 1.31) 71 <0.001 Study Risk of Bias (N-O S Score) <7 4 422 17,609 1.47 (1.07, 2.02) 64 0.039 0.173 >=7 11 2,548 84,103 1.05 (0.86, 1.28) 69 <0.001 Adjusted for TC or LDL-C Yes 9 1,882 63,841 1.17 (0.93, 1.47) 68 0.002 0.972 No 6 1,088 37,871 1.15 (0.86, 1.54) 76 0.001 Adjusted for BP Yes 7 2,164 37,549 0.97 (0.74, 1.28) 71 0.002 0.147 No 8 806 64,163 1.32 (1.07, 1.63) 65 0.005
44
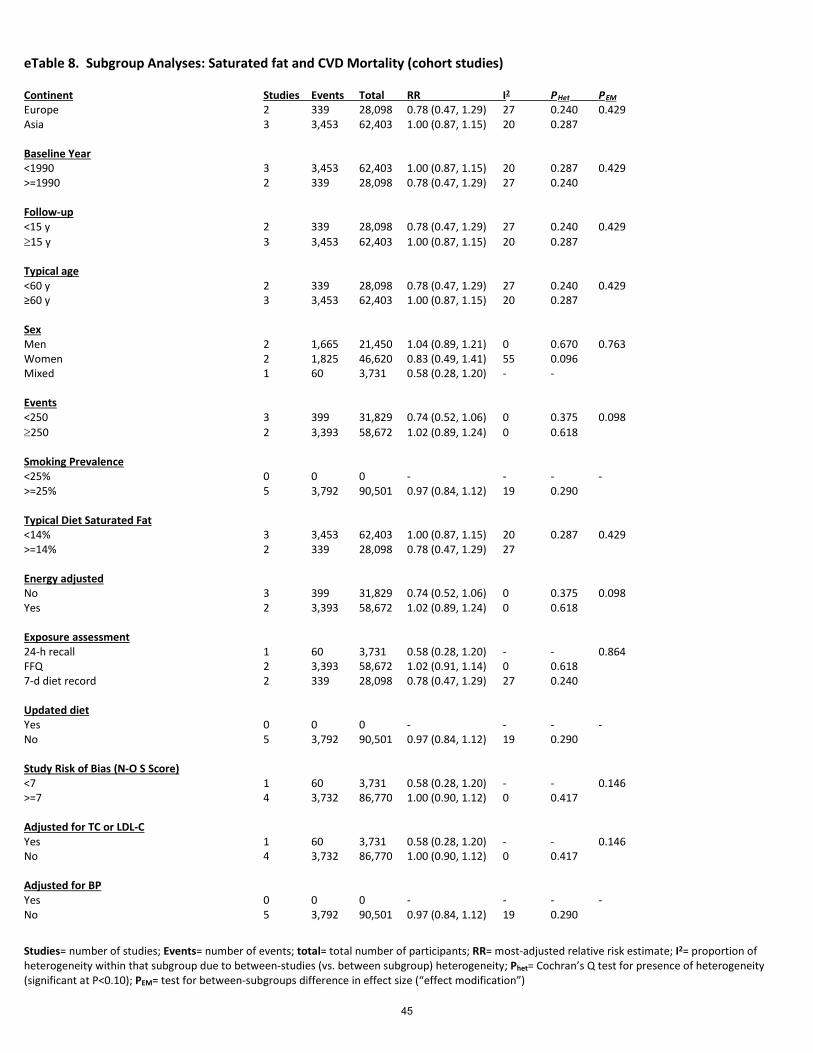
Studies= number of studies; Events= number of events; total= total number of participants; RR= most-adjusted relative risk estimate; I2= proportion of heterogeneity within that subgroup due to between-studies (vs. between subgroup) heterogeneity; Phet= Cochran’s Q test for presence of heterogeneity (significant at P<0.10); PEM= test for between-subgroups difference in effect size (“effect modification”)
eTable 8. Subgroup Analyses: Saturated fat and CVD Mortality (cohort studies)
Continent Studies Events Total RR I2 PHet PEM Europe 2 339 28,098 0.78 (0.47, 1.29) 27 0.240 0.429 Asia 3 3,453 62,403 1.00 (0.87, 1.15) 20 0.287 Baseline Year <1990 3 3,453 62,403 1.00 (0.87, 1.15) 20 0.287 0.429 >=1990 2 339 28,098 0.78 (0.47, 1.29) 27 0.240 Follow-up <15 y 2 339 28,098 0.78 (0.47, 1.29) 27 0.240 0.429 ≥15 y 3 3,453 62,403 1.00 (0.87, 1.15) 20 0.287 Typical age <60 y 2 339 28,098 0.78 (0.47, 1.29) 27 0.240 0.429 ≥60 y 3 3,453 62,403 1.00 (0.87, 1.15) 20 0.287 Sex Men 2 1,665 21,450 1.04 (0.89, 1.21) 0 0.670 0.763 Women 2 1,825 46,620 0.83 (0.49, 1.41) 55 0.096 Mixed 1 60 3,731 0.58 (0.28, 1.20) - - Events <250 3 399 31,829 0.74 (0.52, 1.06) 0 0.375 0.098 ≥250 2 3,393 58,672 1.02 (0.89, 1.24) 0 0.618 Smoking Prevalence <25% 0 0 0 - - - - >=25% 5 3,792 90,501 0.97 (0.84, 1.12) 19 0.290 Typical Diet Saturated Fat <14% 3 3,453 62,403 1.00 (0.87, 1.15) 20 0.287 0.429 >=14% 2 339 28,098 0.78 (0.47, 1.29) 27 Energy adjusted No 3 399 31,829 0.74 (0.52, 1.06) 0 0.375 0.098 Yes 2 3,393 58,672 1.02 (0.89, 1.24) 0 0.618 Exposure assessment 24-h recall 1 60 3,731 0.58 (0.28, 1.20) - - 0.864 FFQ 2 3,393 58,672 1.02 (0.91, 1.14) 0 0.618 7-d diet record 2 339 28,098 0.78 (0.47, 1.29) 27 0.240 Updated diet Yes 0 0 0 - - - - No 5 3,792 90,501 0.97 (0.84, 1.12) 19 0.290 Study Risk of Bias (N-O S Score) <7 1 60 3,731 0.58 (0.28, 1.20) - - 0.146 >=7 4 3,732 86,770 1.00 (0.90, 1.12) 0 0.417 Adjusted for TC or LDL-C Yes 1 60 3,731 0.58 (0.28, 1.20) - - 0.146 No 4 3,732 86,770 1.00 (0.90, 1.12) 0 0.417 Adjusted for BP Yes 0 0 0 - - - - No 5 3,792 90,501 0.97 (0.84, 1.12) 19 0.290
45
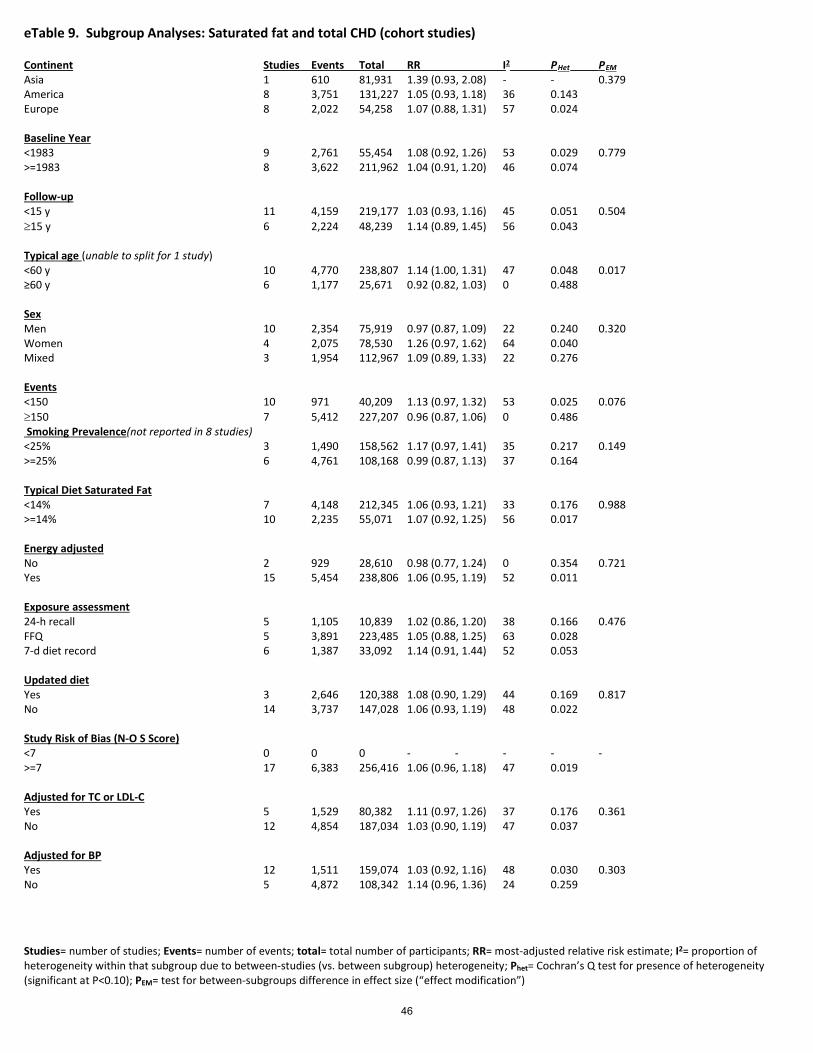
Studies= number of studies; Events= number of events; total= total number of participants; RR= most-adjusted relative risk estimate; I2= proportion of heterogeneity within that subgroup due to between-studies (vs. between subgroup) heterogeneity; Phet= Cochran’s Q test for presence of heterogeneity (significant at P<0.10); PEM= test for between-subgroups difference in effect size (“effect modification”)
eTable 9. Subgroup Analyses: Saturated fat and total CHD (cohort studies)
Continent Studies Events Total RR I2 PHet PEM Asia 1 610 81,931 1.39 (0.93, 2.08) - - 0.379 America 8 3,751 131,227 1.05 (0.93, 1.18) 36 0.143 Europe 8 2,022 54,258 1.07 (0.88, 1.31) 57 0.024 Baseline Year <1983 9 2,761 55,454 1.08 (0.92, 1.26) 53 0.029 0.779 >=1983 8 3,622 211,962 1.04 (0.91, 1.20) 46 0.074 Follow-up <15 y 11 4,159 219,177 1.03 (0.93, 1.16) 45 0.051 0.504 ≥15 y 6 2,224 48,239 1.14 (0.89, 1.45) 56 0.043 Typical age (unable to split for 1 study) <60 y 10 4,770 238,807 1.14 (1.00, 1.31) 47 0.048 0.017 ≥60 y 6 1,177 25,671 0.92 (0.82, 1.03) 0 0.488 Sex Men 10 2,354 75,919 0.97 (0.87, 1.09) 22 0.240 0.320 Women 4 2,075 78,530 1.26 (0.97, 1.62) 64 0.040 Mixed 3 1,954 112,967 1.09 (0.89, 1.33) 22 0.276 Events <150 10 971 40,209 1.13 (0.97, 1.32) 53 0.025 0.076 ≥150 7 5,412 227,207 0.96 (0.87, 1.06) 0 0.486 Smoking Prevalence(not reported in 8 studies) <25% 3 1,490 158,562 1.17 (0.97, 1.41) 35 0.217 0.149 >=25% 6 4,761 108,168 0.99 (0.87, 1.13) 37 0.164 Typical Diet Saturated Fat <14% 7 4,148 212,345 1.06 (0.93, 1.21) 33 0.176 0.988 >=14% 10 2,235 55,071 1.07 (0.92, 1.25) 56 0.017 Energy adjusted No 2 929 28,610 0.98 (0.77, 1.24) 0 0.354 0.721 Yes 15 5,454 238,806 1.06 (0.95, 1.19) 52 0.011 Exposure assessment 24-h recall 5 1,105 10,839 1.02 (0.86, 1.20) 38 0.166 0.476 FFQ 5 3,891 223,485 1.05 (0.88, 1.25) 63 0.028 7-d diet record 6 1,387 33,092 1.14 (0.91, 1.44) 52 0.053 Updated diet Yes 3 2,646 120,388 1.08 (0.90, 1.29) 44 0.169 0.817 No 14 3,737 147,028 1.06 (0.93, 1.19) 48 0.022 Study Risk of Bias (N-O S Score) <7 0 0 0 - - - - - >=7 17 6,383 256,416 1.06 (0.96, 1.18) 47 0.019 Adjusted for TC or LDL-C Yes 5 1,529 80,382 1.11 (0.97, 1.26) 37 0.176 0.361 No 12 4,854 187,034 1.03 (0.90, 1.19) 47 0.037 Adjusted for BP Yes 12 1,511 159,074 1.03 (0.92, 1.16) 48 0.030 0.303 No 5 4,872 108,342 1.14 (0.96, 1.36) 24 0.259
46
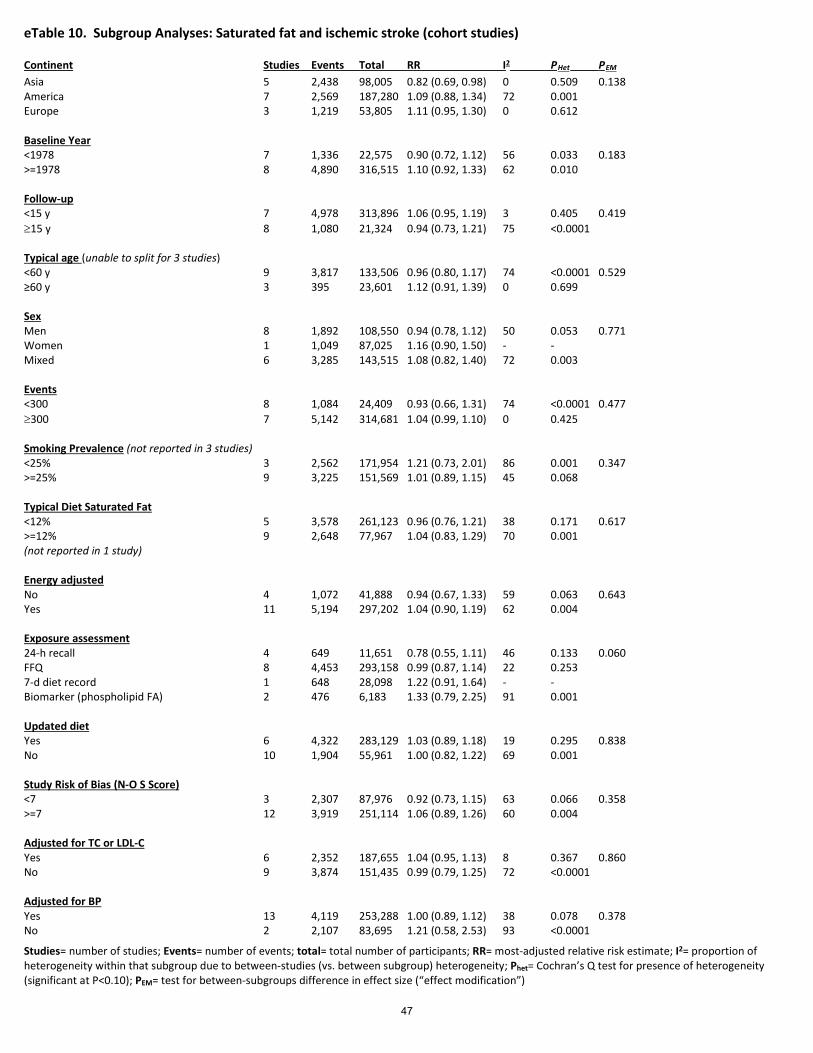
Studies= number of studies; Events= number of events; total= total number of participants; RR= most-adjusted relative risk estimate; I2= proportion of heterogeneity within that subgroup due to between-studies (vs. between subgroup) heterogeneity; Phet= Cochran’s Q test for presence of heterogeneity (significant at P<0.10); PEM= test for between-subgroups difference in effect size (“effect modification”)
eTable 10. Subgroup Analyses: Saturated fat and ischemic stroke (cohort studies)
Continent Studies Events Total RR I2 PHet PEM Asia 5 2,438 98,005 0.82 (0.69, 0.98) 0 0.509 0.138 America 7 2,569 187,280 1.09 (0.88, 1.34) 72 0.001 Europe 3 1,219 53,805 1.11 (0.95, 1.30) 0 0.612 Baseline Year <1978 7 1,336 22,575 0.90 (0.72, 1.12) 56 0.033 0.183 >=1978 8 4,890 316,515 1.10 (0.92, 1.33) 62 0.010 Follow-up <15 y 7 4,978 313,896 1.06 (0.95, 1.19) 3 0.405 0.419 ≥15 y 8 1,080 21,324 0.94 (0.73, 1.21) 75 <0.0001 Typical age (unable to split for 3 studies) <60 y 9 3,817 133,506 0.96 (0.80, 1.17) 74 <0.0001 0.529 ≥60 y 3 395 23,601 1.12 (0.91, 1.39) 0 0.699 Sex Men 8 1,892 108,550 0.94 (0.78, 1.12) 50 0.053 0.771 Women 1 1,049 87,025 1.16 (0.90, 1.50) - - Mixed 6 3,285 143,515 1.08 (0.82, 1.40) 72 0.003 Events <300 8 1,084 24,409 0.93 (0.66, 1.31) 74 <0.0001 0.477 ≥300 7 5,142 314,681 1.04 (0.99, 1.10) 0 0.425 Smoking Prevalence (not reported in 3 studies) <25% 3 2,562 171,954 1.21 (0.73, 2.01) 86 0.001 0.347 >=25% 9 3,225 151,569 1.01 (0.89, 1.15) 45 0.068 Typical Diet Saturated Fat <12% 5 3,578 261,123 0.96 (0.76, 1.21) 38 0.171 0.617 >=12% 9 2,648 77,967 1.04 (0.83, 1.29) 70 0.001 (not reported in 1 study) Energy adjusted No 4 1,072 41,888 0.94 (0.67, 1.33) 59 0.063 0.643 Yes 11 5,194 297,202 1.04 (0.90, 1.19) 62 0.004 Exposure assessment 24-h recall 4 649 11,651 0.78 (0.55, 1.11) 46 0.133 0.060 FFQ 8 4,453 293,158 0.99 (0.87, 1.14) 22 0.253 7-d diet record 1 648 28,098 1.22 (0.91, 1.64) - - Biomarker (phospholipid FA) 2 476 6,183 1.33 (0.79, 2.25) 91 0.001 Updated diet Yes 6 4,322 283,129 1.03 (0.89, 1.18) 19 0.295 0.838 No 10 1,904 55,961 1.00 (0.82, 1.22) 69 0.001 Study Risk of Bias (N-O S Score) <7 3 2,307 87,976 0.92 (0.73, 1.15) 63 0.066 0.358 >=7 12 3,919 251,114 1.06 (0.89, 1.26) 60 0.004 Adjusted for TC or LDL-C Yes 6 2,352 187,655 1.04 (0.95, 1.13) 8 0.367 0.860 No 9 3,874 151,435 0.99 (0.79, 1.25) 72 <0.0001 Adjusted for BP Yes 13 4,119 253,288 1.00 (0.89, 1.12) 38 0.078 0.378 No 2 2,107 83,695 1.21 (0.58, 2.53) 93 <0.0001
47

eTable 11. Characteristics of included prospective cohort studies of trans fatty acids and health outcomes.
Source (Country) Age Sex (% Men)
No. of Participants
No. of Events
Follow-up (y)
Exposures assessed Exposure contrast
Outcome validation
Adjustment for confounders
NOS score
Funding
Willett et al., 1993; United States (Nurses’ Health Study I)
34-59 0 69,181 356 CHD 8 Total trans fatty acid; vegetable trans; animal trans (validated FFQ)
Q5 vs. Q1 (5.7 vs. 2.4 g/d)
self report; confirmed by medical record review; national death index
Age, smoking, BMI, hypertension, alcohol intake, menopausal status, PMH use, energy intake, dietary lipids, family history of MI <60, multivitamin use
9 National Institutes of Health (U.S.)
Ascherio et al., 1996; United States (Health Professionals’ Follow-up Study)
40-75 100 43,757 734 total MI; 229 CHD deaths
6 Total trans fatty acids (validated FFQ)
Q5 vs. Q1 (4.3 to 1.5 g/d)
Self report; confirmed by medical record review, deaths confirmed by next of kin; national death index
Age, BMI, smoking, alcohol, physical activity, history of HTN/ high blood cholesterol, family history of MI<60; profession, dietary fiber, energy
9 National Institutes of Health (U.S.)
Oh et al., 2004; United States (Nurses’ Health Study I)
34-59 0 78,778 1766 CHD; 1241 non-
fatal MI and 525
CHD death
20 Total trans fatty acids (validated FFQ)
Q5 vs. Q1 (2.8 vs. 1.3% energy)
self report; confirmed by medical record review; national death index
Age, BMI, smoking, alcohol, parental history of MI, hypertension, menopausal status and hormone use, aspirin use, multivitamin use, vitamin E supplement use, physical activity, energy, protein, dietary cholesterol
9 National Institutes of Health (U.S.)
Oomen et al, 2001; Netherlands (Zutphen Elders’ Study)
71 (5) 100 667 49 Fatal CHD 98 Non-fatal MI
6 Total trans fatty acids; ruminant trans fatty acids; manufactured C18:1 trans; other manufactured trans (validated FFQ)
Ruminant: T3 vs. T1 (6.4% vs. 2.4% energy)
self-report or hospital discharge data; confirmed by municipal registries
Age, total energy, BMI, smoking, alcohol, vitamin use, saturated fat, monounsaturated fat, polyunsaturated fat, dietary cholesterol, dietary fiber
7 Netherlands Prevention Foundation
48

eTable 11. Characteristics of included prospective cohort studies of trans fatty acids and health outcomes.
Source (Country) Age Sex
(% Men) No. of
Participants No. of Events Follow-
up (y) Exposures assessed Exposure
contrast Outcome validation
Adjustment for confounders
NOS score
Funding
Pietinen et al., 1997; (α-tocopherol and β-carotene Study)
50-69 100 21,930 1,399 Major coronary events: first non-fatal MI; 635 coronary death
6 All trans isomers from 16-22C: C16:1 trans; C18:1 trans; C18:2 trans; C20:1 trans (validated FFQ)
Q4 vs. Q1: 3.9% vs. 0.9% energy Q4 vs. Q1: 4.0% vs. 0.9% energy; Per 2 g/d (≈1% energy)
National hospital discharge register diagnosis and obtained hospital and pathology reports; deaths through national population register
Age, treatment group, smoking, BMI, blood pressure, energy, alcohol, fiber, education, physical activity
8 National Cancer Institute (U.S.), Academy of Finland
Xu et al., 2006; United States (Strong Heart Study)
45-74 36 2,938 436 incident CHD; 298 non-fatal CHD + 138 fatal CHD
7.2
Total trans fatty acids (24-hour recall)
≈4.0 vs. 2.0% energy
Annual mortality and morbidity surveillance or at 3rd examination; confirmed by medical records
Sex, age, study center, diabetes, BMI, HDL-C, LDL-C, triacylglycerol, smoking, alcohol, hypertension, dietary protein, total energy
7 National Heart, Lung and Blood Institute (U.S.)
Howard et al., 2006; United States (Womens’ Health Initiative RCT)
50-79 0 31,258 146 major CHD event
1 Total trans fatty acids (validated FFQ)
≈2.5% energy in control arm vs. <1.1% energy in intervention arm
Hospital records; death certificates
Age, baseline CHD, HRT , randomization, BMI, hypertension, dyslipidemia, smoking, diabetes, physical activity, energy expenditure, ethnicity, education, income, psychological stress
8 National Heart, Lung and Blood Institute (U.S.)
Jakobsen et al., 2007; Denmark (1914, 1936 cohorts; MONICA I & III)
30-71 50 3,686 374 total CHD 18 Ruminant trans fatty acids (7-day weighed food record)
Per 0.5 g/d record linkage to Causes of Death registry; review of medical files
Energy, cohort, SBP, family history of MI, education, smoking, alcohol, % protein, % mono, % poly, dietary fiber, dietary cholesterol, industrially-produced TFA, % SFA, BMI, physical activity
8 Danish Heart Foundation; Danish Medical Research Council
49

eTable 11. Characteristics of included prospective cohort studies of trans fatty acids and health outcomes.
Source (Country) Age Sex (% Men)
No. of Participants
No. of Events Follow-up (y)
Exposures assessed Exposure contrast
Outcome validation
Adjustment for confounders
NOS score
Funding
Laake et al., 2012; Norway (Norwegian Countries Study)
≈40 50 71,464 11,190 total mortality; 3870 CVD death; 2383 CHD death; 732 cerebrovascular death; 243 sudden death of unknown cause
26 Partially hydrogenated vegetable oil trans, partially hydrogenated fish oil trans, ruminant trans (FFQ)
5 categories (not quintiles; as % energy) PHVO: ≥1.65 vs. <0.15 PHFiO ≥2.35 vs. <0.85 rTFA (%): ≥0.85 vs. <0.4
Not stated Age, sex, energy intake, SBP, BMI, smoking, education, SFA, unsaturated cis-FA, protein, cholesterol, and each type of TFA for the others
6 Throne–Holst Foundation for Nutrition Research (Marabou company)
Yaemsiri et al., 2012; United States (Womens’ Health Initiative)
64 (7) 0 87,025 1,049 ischemic stroke, 101 atherosclerotic stroke, 269 lacunar stroke, 244 cardioembolic stroke
7.6 Total trans fatty acids (validated FFQ)
Q4 vs. Q1 6.1 vs. 2.2 g/d
Self report; adjudicated by local physicians and centrally by trained neurologists
Age, race, education, income, smoking, HRT use, physical activity, alcohol, history of CHD, history of A. Fib, history of diabetes, aspirin use, use of antihypertensives, use of cholesterol-lowering medication, BMI, SBP, total energy, vitamin E, fruits and vegetables intake, fiber
8 National Heart, Lung, and Blood Institute (U.S.)
He et al., 2003; United States (Health Professionals’ Follow-up Study)
40-75 100 43,732 725 total stroke; 455 ischemic stroke, 125 haemorrhagic stroke
14 Total trans fatty acids (validated FFQ)
Q5 vs. Q1 4.42 vs. 1.67 g/d
Blind record review by MD; fatal stroke reported by next of kin corroborated against national death index
BMI, physical activity, history of hypertension, smoking status, aspirin use, alcohol, dietary potassium, dietary fiber, dietary vitamin E, fruits and vegetables, total energy intake, hypercholesterolemia at baseline, polyunsaturated, monounsaturated, and saturated fat
7 National Institutes of Health (U.S.)
50

eTable 11. Characteristics of included prospective cohort studies of trans fatty acids and health outcomes.
Kiage et al., 2013 and 2014; United States (Reasons for Geographical and Racial Differences in Stroke cohort)
≈65 45 18,513 401 ischemic stroke events [2014]
1,572 all-cause deaths [2013]
7 Total trans fatty acids (validated FFQ)
Q5 vs. Q1
4.68 vs. 1.60 % energy
Next-of-kin report, national death index, and adjudicated
Sex, age, smoking, race, region, alcohol use, education, waist circumference, physical activity, diabetes, CHD, hypertension, stroke, heart failure, CKD, statin use, total energy, energy-adjusted SFA, MUFA, PUFA, protein, CHO
7 [2014]
8 [2013]
National Institutes of Neurological Disorders and Stroke, National Institutes of Health (U.S.)
van Dam et al., 2002; United States (Health Professionals’ Follow-up Study)
40-75 100 42,504 1,321 type 2 diabetes
12 Total trans fatty acids (validated FFQ)
Q5 vs. Q1
2.0 vs. 0.7% energy
Self-report, confirmed by medical records, blinded study physician
Age, total energy, time, physical activity, smoking, alcohol, hypertension, hypercholesterolemia, family history, cereal fiber, magnesium, BMI
8 National Institutes of Health (U.S.)
Meyer et al., 2001; United States (Iowa Womens’ Health Study)
56-69 0 35,988 1,890 type 2 diabetes
11 Total trans fatty acids (validated FFQ)
Q5 vs. Q1
5.2 vs. 2.2 g/d
Self-report (only validated in subsample)
Age, total energy, WHR, BMI, physical activity, smoking, alcohol, education, marital status, residence area, use of HRT, magnesium, cereal fiber, SFA, MUFA, w-3 FA, cholesterol
6 National Cancer Institute (U.S.)
Source (Country) Age Sex (% Men)
No. of Participants
No. of Events Follow-up (y)
Exposures assessed Exposure contrast
Outcome validation
Adjustment for confounders
NOS score
Funding
Knekt (personal communication 2013; unpublished); Finnish Mobile Health Clinics
40-69 50 3,980 519 fatal CHD 17 Total trans fatty acids (Validated dietary interview)
Q5 vs. Q1: 4.6 vs. 1.3 g/d (M); 3.4 vs. 0.9 g/d (W)
Cause of death registry using ICD-8
Age, lipids, blood pressure, BMI, MUFA, PUFA, SFA, smoking
n/a n/a
Robien (as reported by Bendsen et al., 2011; unpublished); Iowa Womens’ Health Study
55-69 0 32,766 1,875 fatal CHD 21 Total trans fatty acids (validated FFQ)
Q5 vs. Q1 (1.5%E contrast)
Cause of Death Registry using ICD-9
Age, BMI, education, alcohol, dietary cholesterol, total energy, fiber, n-3 fatty acids, MUFA, protein, PUFA, SFA, physical activity, smoking, use of post-menopausal hormones
n/a n/a
51

eTable 11. Characteristics of included prospective cohort studies of trans fatty acids and health outcomes.
Source (Country) Age Sex
(% Men) No. of
Participants No. of Events Follow-
up (y) Exposures assessed Exposure
contrast Outcome validation
Adjustment for confounders
NOS score
Funding
Salmeron et al., 2001; United States (Nurses’ Health Study)
35-49 0 84,204 2,507 type 2 diabetes
14 Total trans fatty acids (validated FFQ)
Q5 vs. Q1
2.9 vs. 1.3% energy
Self-report, confirmed by medical records, blinded study physician
Age, BMI, time, smoking, family history of DM, alcohol, physical activity, protein (%), total energy, dietary cholesterol
9 National Institutes of Health (U.S.)
Song et al., 2004; United States (Women’s Health Study)
>45 0 37,309 1,558 type 2 diabetes
8.8 Total trans fatty acids (validated FFQ)
Q5 vs. Q1
3.7 vs. 1.1 g/d
Self-report, MD confirmed in subsample
Age, BMI, total energy, smoking, exercise, alcohol, family history of DM, fiber, glycemic load, magnesium, total fat
7 National Institutes of Health (U.S.)
Simila et al., 2012; Finland (α-tocopherol and β-carotene Study)
50-69 100 25,943 1,098 type 2 diabetes
12 Total trans fatty acids (validated FFQ)
Replacement of 1% energy with carbohydrate
Registry of reimbursement for diabetes medications
Age, intervention, BMI, smoking, physical activity, coffee, total energy, protein, fat, SFA, MUFA, PUFA
8 U.S. Public Health Services (U.S.)
Mozaffarian et al., 2010; U.S. (Cardiovascular Health Study)
≈75 45 3,736 304 incident type 2 diabetes
14 Trans-palmitoleate (plasma phospholipid)
0.25% vs. 0.13% total FA
Assessed at annual study clinic visits by study physician
Age, sex, race, education, enrollment site, smoking, waist, CHD, physical activity, alcohol use, % energy from carbohydrate, % energy from protein, red meat, whole-fat dairy, low-fat dairy, total energy
9 National Heart, Lung and Blood Institute, NIH Office of Dietary Supplements, National Institute of Neurological Diseases and Stroke (U.S.)
Mozaffarian et al., 2013; U.S. (MESA)
62 47 2,281 205 type 2 diabetes
≈5 Trans-palmitoleate (plasma phospholipid)
0.10% vs. 0.03 total FA
Study physicians determined presence of DM each 2y study visit based on fasting glucose (≥126 mg/dl)
Age, sex, race, education, field center, smoking, alcohol use, physical activity, BMI, waist circumference
9 National Heart, Lung, and Blood Institute, NIH NIDDK, Harvard Bunge Fellowship Fund (U.S.)
52

eTable 11. Characteristics of included prospective cohort studies of trans fatty acids and health outcomes.
Source (Country) Age Sex
(% Men) No. of
Participants No. of Events Follow-
up (y) Exposures assessed Exposure
contrast Outcome validation
Adjustment for confounders
NOS score
Funding
Chien et al., 2013; Japan (Chin-Shan)
≈60 47 3,602 568 deaths; 275 CVD events
≈10 Total trans-fatty acids (Plasma)
10.4% vs. 7.3% of total fat
Official death certificates verified by house-to-house visits
Age, gender, BMI, smoking, drinking, marital status, education level, job and sports activity, hypertension, diabetes, LDL-C and HDL-C
7 National Science Council; National Taiwan University (Taiwan)
Virtanen et al., 2014; Finland (Kuopio Ischemic Heart Disease Risk Factor Study)
42-60 100 1,981 183 fatal and 382 non-fatal CHD events
21.4 Total trans fatty acids (4-day prospective diet record)
Q4 vs. Q1 (1.5 vs. 0.7% of energy)
Link to national death registry; adjudicated according to ICD-9
Age, examination year, energy intake, BMI, diabetes, hypertension, family history of CHD, pack-years of smoking, education, leisure-time physical activity, alcohol, fiber, % energy from protein, other fatty acids
9 University of Eastern Finland
Wang et al., 2015; USA; Cardiovascular Health Study
74±5 74 4,207 (of which 2,919 had plasma PPL TFA)
407 incident type 2 diabetes
20 Total trans fatty acids (FFQ); t-16:1n9, t-18:1, c/t-18:2, t/c-18:2, t/t-18:2, t-16:1n7 (plasma PPL)
Q4 vs. Q1 Mean intake of total TFA = 3.7±1.3 g/d
Self-reported diagnosis by new use of insulin/ hypoglycemic meds during f/u; elevated non-fasting glucose; or elevated 2-h glucose challenge
Age, sex, rage, education, enrollment site, smoking, alcohol, physical activity, BMI, waist circumference, CVD, hypertension at baseline, coffee, red meat, fiber, glycemic load, PUFA, SFA, total energy, “healthy diet score”
9 National Heart, Lung, and Blood Institute (NHLBI); Office of Dietary Supplements; National Institutes of Neurological Disorders and Stroke; National Institute on Aging
53

eTable 11. Characteristics of included prospective cohort studies of trans fatty acids and health outcomes.
Source (Country) Age Sex
(% Men) No. of
Participants No. of Events Follow-
up (y) Exposures assessed Exposure
contrast Outcome validation
Adjustment for confounders
NOS score
Funding
Santaren et al., 2014; USA; Insulin Resistance Atherosclerosis Study
40-60 55 659 103 incident type 2 diabetes
5 Trans 16:1n7 (plasma PPL)
T3 vs. T1 (0.4 vs. 0.2 mol% FA)
Diabetes diagnosed on end-of-study visit using American Diabetes Association criteria for fasting or 2h-post challenge glucose, oral hypoglycemic agent or insulin use
Age, sex, ethnicity, study center, physical activity, smoking, alcohol, eduction, total energy, fruit and vegetables, red meat, soft drinks, fiber
8 Dairy Farmers of Canada, National Heart, Lung, and Blood Institute
Yakoob et al., 2014; USA; Nurses’ Health and Health Professionals Followup Studies
30-75 50 3,347 254 incident type 2 diabetes
14 Trans 16:1n7(plasma PPL)
Q4 vs. Q1 plasma FA biomarkers
Self-report; validated by supplementary questionnaires on symptoms, diagnostic tests, and medical therapy
Age, race, month of blood collection, smoking, physical activity, alcohol, family history of t2dm and MI, menopausal status, fish, processed and unprocessed meats, fruits, vegetables, whole grains, coffee, sugar-sweetened beverages, glycemic load, dietary calcium, PUFA, trans fatty acids, total energy, and CVD status
9 American Heart Association, Founders Affiliate
54

eTable 12. Characteristics of included prospective nested case-control and case-cohort of trans fatty acids and health outcomes.
Source (Country)
Age Sex (%
Men)
No. Cases/ Participants
[Case:Control]
Case definition
Control definition
Follow-up (y)
Exposures assessed Exposure contrast
Outcome validation
Adjustment for confounders
NOS score
Funding
Lemaitre et al., 2006; USA; Cardiovascular Health Study (nested case-control)
77±6 60 224/428 [1:1] Fatal myocardial infarction or fatal events with chest pain within 72 hours of death; or had a history of chronic IHD. Myocardial infarction was defined on the basis of cardiac enzyme levels, chest pain, and serial ECG changes
Random CHS participants who did not experience a fatal IHD event and did not use fish oil supplements
2-10 Trans 18:1 (12 trans-18:1; 11 trans-18:1; 10 trans-18:1; and mix of 6 to 8 trans-18:1); Trans 18:2 (9 cis, 12 trans-18:2 and 9 trans, 12 cis 18:2); trans 16:1 (7-trans 16:1; 9-trans 16:1) (plasma phospholipid)
Interquintile range: Total trans: 1.39% Trans 16:1: 0.13% Trans 18:2: 0.13% Trans 18:1: >20th %ile vs. <20th %ile
Cardiologist reviewed all fatal IHD records, including hospital records; interviews with physicians, next-of-kin, and/or witnesses; death certificates; and autopsy reports to identify sudden cardiac deaths
Matching: gender, clinic site, entry cohort, age (±5y), time of blood draw (±90d), follow-up duration Covariates: diabetes mellitus, education, smoking, congestive heart failure, stroke history, DHA+EPA
8 National Heart, Lung and Blood Institute (USA); National Institute of Neurological Disorders (USA)
Sun et al., 2007; USA; Nurses’ Health Study (nested case-control)
61±6 0 166/493 [1:2] CHD deaths were identified from autopsy reports, hospital records, or death certificates, Nonfatal MI by WHO criteria
randomly selected with risk-set sampling (ie, controls were selected from the rest of the nondiseased participants at the time of diagnosis of the cases
6 Total trans, all C18:1 trans, all C18:2 trans (Erythrocyte)
Total trans: ~0.14%, all C18:1 trans:~1.2%, all C18:2 trans: 0.37%
Charts reviewed by MD blind to exposure status
Age, smoking, fasting status, time of blood draw, BMI, menopausal status, hormone use, physical activity, alcohol, parental history of MI <65, hypertension, hypercholesterolemia, diabetes, LC n-3 fatty acids and total n-6 fatty acids
7 National Institutes of Health (USA)
63
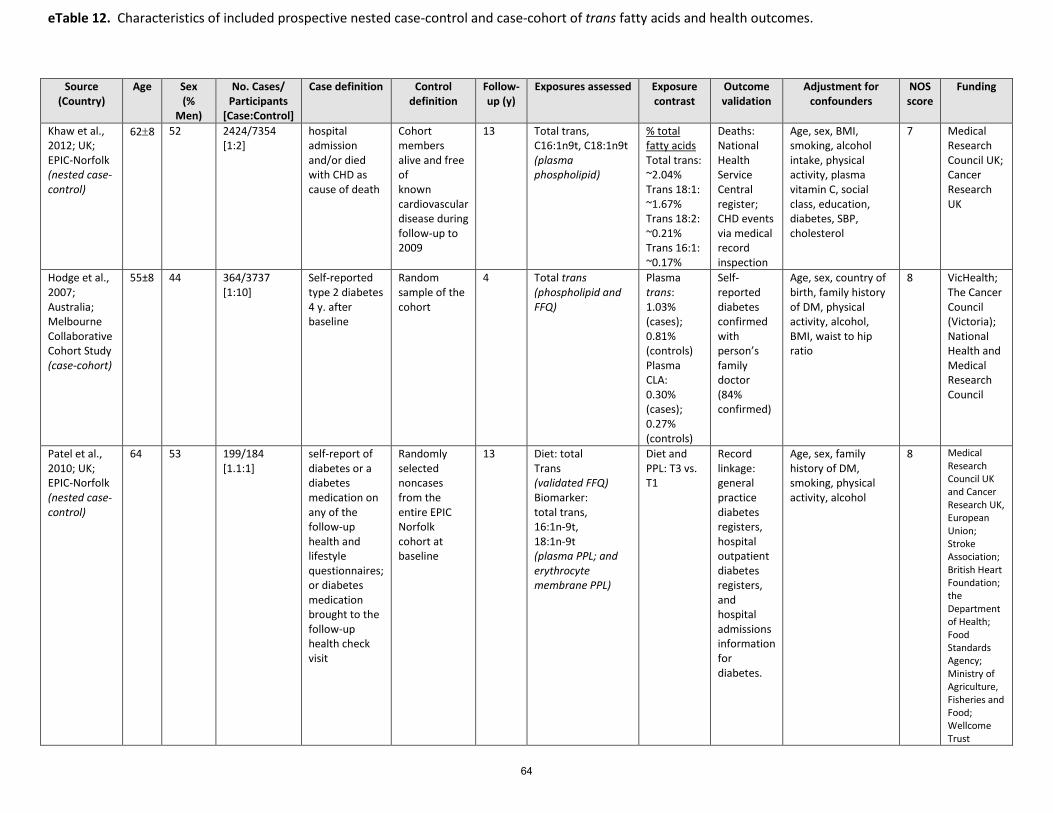
eTable 12. Characteristics of included prospective nested case-control and case-cohort of trans fatty acids and health outcomes.
Source (Country)
Age Sex (%
Men)
No. Cases/ Participants
[Case:Control]
Case definition Control definition
Follow-up (y)
Exposures assessed Exposure contrast
Outcome validation
Adjustment for confounders
NOS score
Funding
Khaw et al., 2012; UK; EPIC-Norfolk (nested case-control)
62±8 52 2424/7354 [1:2]
hospital admission and/or died with CHD as cause of death
Cohort members alive and free of known cardiovascular disease during follow-up to 2009
13 Total trans, C16:1n9t, C18:1n9t (plasma phospholipid)
% total fatty acids Total trans: ~2.04% Trans 18:1: ~1.67% Trans 18:2: ~0.21% Trans 16:1: ~0.17%
Deaths: National Health Service Central register; CHD events via medical record inspection
Age, sex, BMI, smoking, alcohol intake, physical activity, plasma vitamin C, social class, education, diabetes, SBP, cholesterol
7 Medical Research Council UK; Cancer Research UK
Hodge et al., 2007; Australia; Melbourne Collaborative Cohort Study (case-cohort)
55±8 44 364/3737 [1:10]
Self-reported type 2 diabetes 4 y. after baseline
Random sample of the cohort
4 Total trans (phospholipid and FFQ)
Plasma trans: 1.03% (cases); 0.81% (controls) Plasma CLA: 0.30% (cases); 0.27% (controls)
Self-reported diabetes confirmed with person’s family doctor (84% confirmed)
Age, sex, country of birth, family history of DM, physical activity, alcohol, BMI, waist to hip ratio
8 VicHealth; The Cancer Council (Victoria); National Health and Medical Research Council
Patel et al., 2010; UK; EPIC-Norfolk (nested case-control)
64 53 199/184 [1.1:1]
self-report of diabetes or a diabetes medication on any of the follow-up health and lifestyle questionnaires; or diabetes medication brought to the follow-up health check visit
Randomly selected noncases from the entire EPIC Norfolk cohort at baseline
13 Diet: total Trans (validated FFQ) Biomarker: total trans, 16:1n-9t, 18:1n-9t (plasma PPL; and erythrocyte membrane PPL)
Diet and PPL: T3 vs. T1
Record linkage: general practice diabetes registers, hospital outpatient diabetes registers, and hospital admissions information for diabetes.
Age, sex, family history of DM, smoking, physical activity, alcohol
8 Medical Research Council UK and Cancer Research UK, European Union; Stroke Association; British Heart Foundation; the Department of Health; Food Standards Agency; Ministry of Agriculture, Fisheries and Food; Wellcome Trust
64

eTable 12. Characteristics of included prospective nested case-control and case-cohort of trans fatty acids and health outcomes.
Source (Country)
Age Sex (%
Men)
No. Cases/ Participants
[Case:Control]
Case definition Control definition
Follow-up (y)
Exposures assessed Exposure contrast
Outcome validation
Adjustment for confounders
NOS score
Funding
Kröger et al. 2011; Germany; EPIC-Potsdam (case-cohort)
53 58 cases; 39 controls
673/2,787 [1:3]
self-report of diabetes or a diabetes medication on any of the follow-up health and lifestyle questionnaires; or diabetes medication brought to the follow-up health check visit
Randomly selected noncases from the entire EPIC Potsdam cohort at baseline
7 Total TFA, C16:1n-7t, C18:1n-9t+C18:1n7t (erythrocyte membrane)
Q5 vs. Q1 (0.94 vs. 0.54% FA)
Incident cases verified by diagnosing physician
Age, sex, BMI, waist, cycling, sports activity, education, coffee intake, smoking, alcohol intake, occupational activity, fiber
8 Federal Ministry of Science, Germany; European Union; German Cancer Aid; European Community; German Research Foundation
65

eTable 13. Characteristics of included retrospective case-control studies of trans fatty acids and health outcomes.
Source (Country)
Age Sex (%
Men)
No. Cases/ Participants
[Case:Control]
Case definition
Control definition
Follow-up (y)
Exposures assessed Exposure contrast
Outcome validation
Adjustment for confounders
NOS score
Funding
Lemaitre et al., 2006; USA; Cardiovascular Health Study (nested case-control)
77±6 60 224/428 [1:1] Fatal myocardial infarction or fatal events with chest pain within 72 hours of death; or had a history of chronic IHD. Myocardial infarction was defined on the basis of cardiac enzyme levels, chest pain, and serial ECG changes
Random CHS participants who did not experience a fatal IHD event and did not use fish oil supplements
2-10 Trans 18:1 (12 trans-18:1; 11 trans-18:1; 10 trans-18:1; and mix of 6 to 8 trans-18:1); Trans 18:2 (9 cis, 12 trans-18:2 and 9 trans, 12 cis 18:2); trans 16:1 (7-trans 16:1; 9-trans 16:1) (plasma phospholipid)
Interquintile range: Total trans: 1.39% Trans 16:1: 0.13% Trans 18:2: 0.13% Trans 18:1: >20th %ile vs. <20th %ile
Cardiologist reviewed all fatal IHD records, including hospital records; interviews with physicians, next-of-kin, and/or witnesses; death certificates; and autopsy reports to identify sudden cardiac deaths
Matching: gender, clinic site, entry cohort, age (±5y), time of blood draw (±90d), follow-up duration Covariates: diabetes mellitus, education, smoking, congestive heart failure, stroke history, DHA+EPA
8 National Heart, Lung and Blood Institute (USA); National Institute of Neurological Disorders (USA)
Sun et al., 2007; USA; Nurses’ Health Study (nested case-control)
61±6 0 166/493 [1:2] CHD deaths were identified from autopsy reports, hospital records, or death certificates, Nonfatal MI by WHO criteria
randomly selected with risk-set sampling (ie, controls were selected from the rest of the nondiseased participants at the time of diagnosis of the cases
6 Total trans, all C18:1 trans, all C18:2 trans (Erythrocyte)
Total trans: ~0.14%, all C18:1 trans:~1.2%, all C18:2 trans: 0.37%
Charts reviewed by MD blind to exposure status
Age, smoking, fasting status, time of blood draw, BMI, menopausal status, hormone use, physical activity, alcohol, parental history of MI <65, hypertension, hypercholesterolemia, diabetes, LC n-3 fatty acids and total n-6 fatty acids
7 National Institutes of Health (USA)
66

eTable 13. Characteristics of included retrospective case-control studies of trans fatty acids and health outcomes.
Source (Country)
Age Sex (%
Men)
No. Cases/ Participants
[Case:Control]
Case definition Control definition
Follow-up (y)
Exposures assessed Exposure contrast
Outcome validation
Adjustment for confounders
NOS score
Funding
Khaw et al., 2012; UK; EPIC-Norfolk (nested case-control)
62±8 52 2424/7354 [1:2]
hospital admission and/or died with CHD as cause of death
Cohort members alive and free of known cardiovascular disease during follow-up to 2009
13 Total trans, C16:1n9t, C18:1n9t (plasma phospholipid)
% total fatty acids Total trans: ~2.04% Trans 18:1: ~1.67% Trans 18:2: ~0.21% Trans 16:1: ~0.17%
Deaths: National Health Service Central register; CHD events via medical record inspection
Age, sex, BMI, smoking, alcohol intake, physical activity, plasma vitamin C, social class, education, diabetes, SBP, cholesterol
7 Medical Research Council UK; Cancer Research UK
Hodge et al., 2007; Australia; Melbourne Collaborative Cohort Study (case-cohort)
55±8 44 364/3737 [1:10]
Self-reported type 2 diabetes 4 y. after baseline
Random sample of the cohort
4 Total trans (phospholipid and FFQ)
Plasma trans: 1.03% (cases); 0.81% (controls) Plasma CLA: 0.30% (cases); 0.27% (controls)
Self-reported diabetes confirmed with person’s family doctor (84% confirmed)
Age, sex, country of birth, family history of DM, physical activity, alcohol, BMI, waist to hip ratio
8 VicHealth; The Cancer Council (Victoria); National Health and Medical Research Council
Patel et al., 2010; UK; EPIC-Norfolk (nested case-control)
64 53 199/184 [1.1:1]
self-report of diabetes or a diabetes medication on any of the follow-up health and lifestyle questionnaires; or diabetes medication brought to the follow-up health check visit
Randomly selected noncases from the entire EPIC Norfolk cohort at baseline
13 Diet: total Trans (validated FFQ) Biomarker: total trans, 16:1n-9t, 18:1n-9t (plasma PPL; and erythrocyte membrane PPL)
Diet and PPL: T3 vs. T1
Record linkage: general practice diabetes registers, hospital outpatient diabetes registers, and hospital admissions information for diabetes.
Age, sex, family history of DM, smoking, physical activity, alcohol
8 Medical Research Council UK and Cancer Research UK, European Union; Stroke Association; British Heart Foundation; the Department of Health; Food Standards Agency; Ministry of Agriculture, Fisheries and Food; Wellcome Trust
67
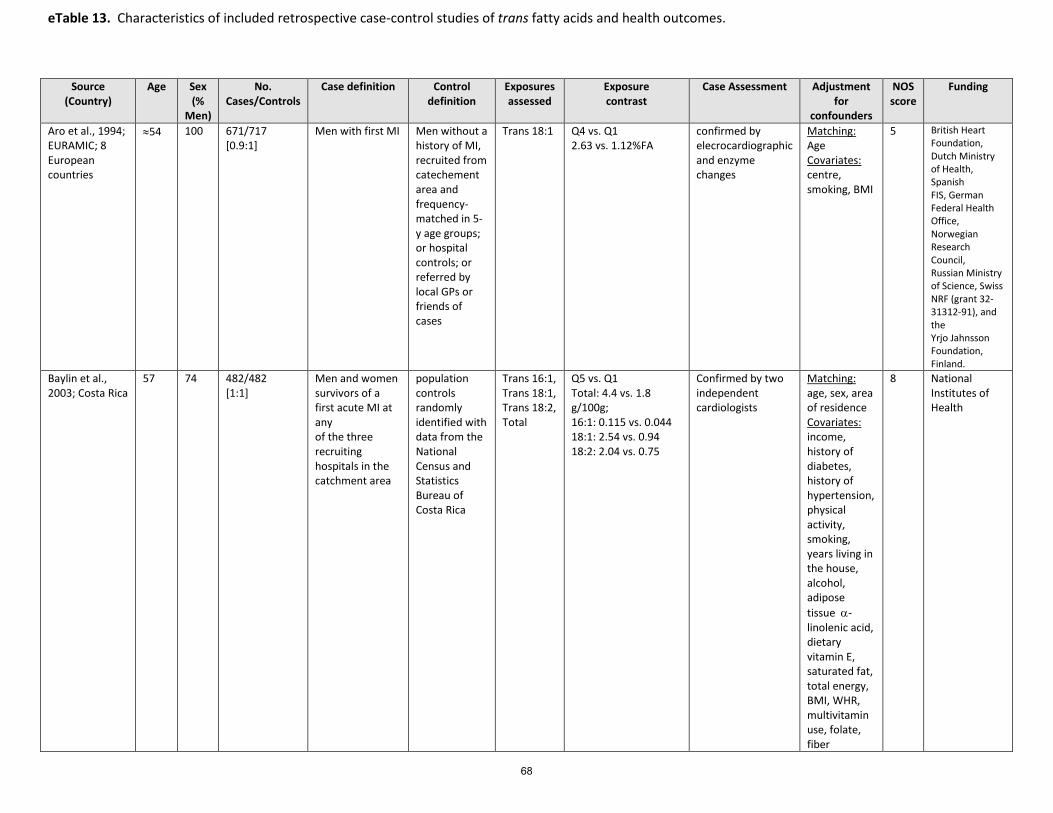
eTable 13. Characteristics of included retrospective case-control studies of trans fatty acids and health outcomes.
Source (Country)
Age Sex (%
Men)
No. Cases/Controls
Case definition Control definition
Exposures assessed
Exposure contrast
Case Assessment Adjustment for
confounders
NOS score
Funding
Aro et al., 1994; EURAMIC; 8 European countries
≈54 100 671/717 [0.9:1]
Men with first MI Men without a history of MI, recruited from catechement area and frequency-matched in 5-y age groups; or hospital controls; or referred by local GPs or friends of cases
Trans 18:1 Q4 vs. Q1 2.63 vs. 1.12%FA
confirmed by elecrocardiographic and enzyme changes
Matching: Age Covariates: centre, smoking, BMI
5 British Heart Foundation, Dutch Ministry of Health, Spanish FIS, German Federal Health Office, Norwegian Research Council, Russian Ministry of Science, Swiss NRF (grant 32-31312-91), and the Yrjo Jahnsson Foundation, Finland.
Baylin et al., 2003; Costa Rica
57 74 482/482 [1:1]
Men and women survivors of a first acute MI at any of the three recruiting hospitals in the catchment area
population controls randomly identified with data from the National Census and Statistics Bureau of Costa Rica
Trans 16:1, Trans 18:1, Trans 18:2, Total
Q5 vs. Q1 Total: 4.4 vs. 1.8 g/100g; 16:1: 0.115 vs. 0.044 18:1: 2.54 vs. 0.94 18:2: 2.04 vs. 0.75
Confirmed by two independent cardiologists
Matching: age, sex, area of residence Covariates: income, history of diabetes, history of hypertension, physical activity, smoking, years living in the house, alcohol, adipose tissue α-linolenic acid, dietary vitamin E, saturated fat, total energy, BMI, WHR, multivitamin use, folate, fiber
8 National Institutes of Health
68

eTable 13. Characteristics of included retrospective case-control studies of trans fatty acids and health outcomes.
Source (Country)
Age Sex (%
Men)
No. Cases/Controls
Case definition Control definition
Exposures assessed
Exposure contrast
Case Assessment Adjustment for
confounders
NOS score
Funding
Colon-Ramos et al., 2006; Costa Rica
≈54 73 1797/1797 [1:1]
Men and women survivors of first MI at 3 recruiting hospitals
Randomly sampled from area of residence of case using data from National Census and Statistic Bureau
Total trans, 18:1 trans, 18:2 trans (adipose tissue)
Q5 vs. Q1 1994-1999: Total trans: 4.40 vs. 1.85 g/100 g 18:1 trans: 2.54 vs. 0.93 g/100 g 18:2 trans: 2.02 vs. 0.75 g/100 g 2000-2003 Total trans: 3.42 vs. 1.84 18:1 trans: 1.94 vs. 0.85 18:2 trans: 1.40 vs. 0.74
Confirmed by 2 independent cardiologists
Matching: Age, sex, area of residence Covariates: Income, history of diabetes, history of hypertension, physical activity, smoking status, alcohol intake, adipose tissue α-linolenic acid, vitamin E intake, saturated fat, total energy
8 NIDDK; National Institutes of Health (U.S.)
Ghahremanpour et al., 2008; Iran
53 (8)
69 105/68 [1.5:1]
Men and women <75 y.o. with no previous admission for CVD events, or treatment for diabetes or dyslipidemia; angiographically proven coronary artery stenosis from Rajaee Hospital (Tehran)
Healthy volunteers with no history of CVD and same exclusion criteria
Total trans; 18:1 trans, 18:2 trans, 16:1 trans (Adipose tissue)
IQR (g/100 g) total trans: 13.7; 18:1 trans: 11.3; 18:2 trans: 4.6; 16:1 trans: 1.5
Unclear Matching: age, sex Covariates: Hypertension, smoking, triglyceride, adipose tissue PUFA
5 Not stated
69
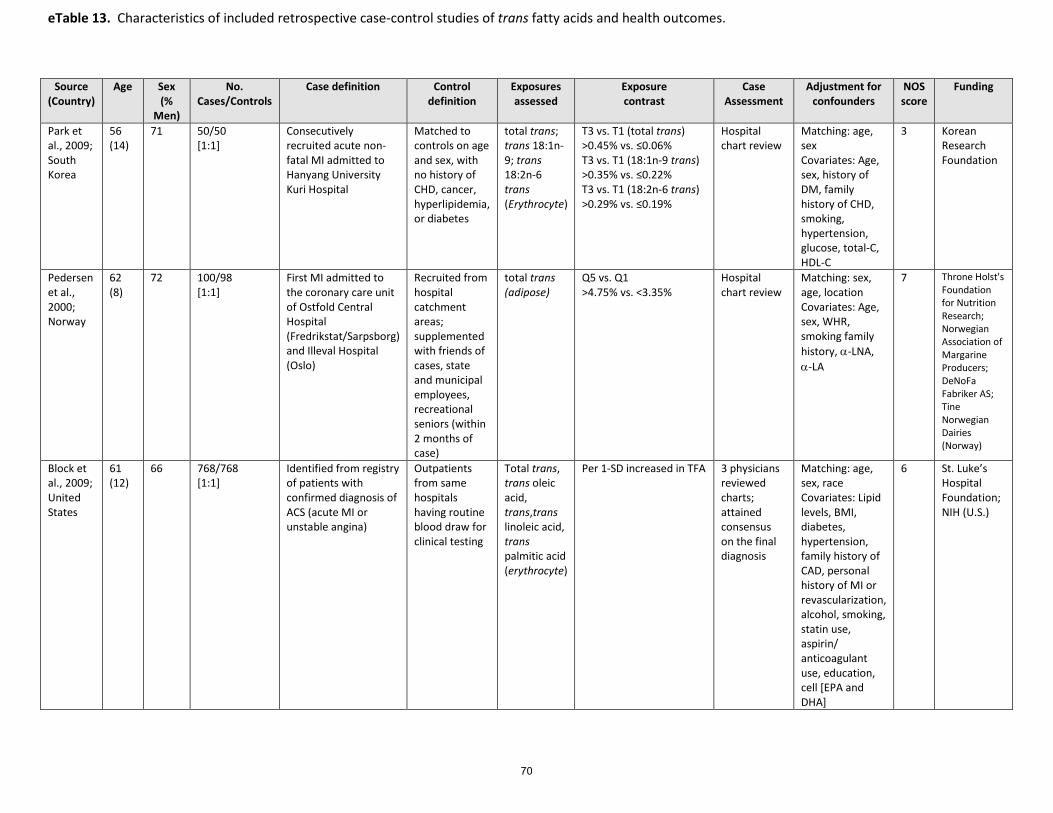
eTable 13. Characteristics of included retrospective case-control studies of trans fatty acids and health outcomes.
Source (Country)
Age Sex (%
Men)
No. Cases/Controls
Case definition Control definition
Exposures assessed
Exposure contrast
Case Assessment
Adjustment for confounders
NOS score
Funding
Park et al., 2009; South Korea
56 (14)
71 50/50 [1:1]
Consecutively recruited acute non-fatal MI admitted to Hanyang University Kuri Hospital
Matched to controls on age and sex, with no history of CHD, cancer, hyperlipidemia, or diabetes
total trans; trans 18:1n-9; trans 18:2n-6 trans (Erythrocyte)
T3 vs. T1 (total trans) >0.45% vs. ≤0.06% T3 vs. T1 (18:1n-9 trans) >0.35% vs. ≤0.22% T3 vs. T1 (18:2n-6 trans) >0.29% vs. ≤0.19%
Hospital chart review
Matching: age, sex Covariates: Age, sex, history of DM, family history of CHD, smoking, hypertension, glucose, total-C, HDL-C
3 Korean Research Foundation
Pedersen et al., 2000; Norway
62 (8)
72 100/98 [1:1]
First MI admitted to the coronary care unit of Ostfold Central Hospital (Fredrikstat/Sarpsborg) and Illeval Hospital (Oslo)
Recruited from hospital catchment areas; supplemented with friends of cases, state and municipal employees, recreational seniors (within 2 months of case)
total trans (adipose)
Q5 vs. Q1 >4.75% vs. <3.35%
Hospital chart review
Matching: sex, age, location Covariates: Age, sex, WHR, smoking family history, α-LNA, α-LA
7 Throne Holst's Foundation for Nutrition Research; Norwegian Association of Margarine Producers; DeNoFa Fabriker AS; Tine Norwegian Dairies (Norway)
Block et al., 2009; United States
61 (12)
66 768/768 [1:1]
Identified from registry of patients with confirmed diagnosis of ACS (acute MI or unstable angina)
Outpatients from same hospitals having routine blood draw for clinical testing
Total trans, trans oleic acid, trans,trans linoleic acid, trans palmitic acid (erythrocyte)
Per 1-SD increased in TFA 3 physicians reviewed charts; attained consensus on the final diagnosis
Matching: age, sex, race Covariates: Lipid levels, BMI, diabetes, hypertension, family history of CAD, personal history of MI or revascularization, alcohol, smoking, statin use, aspirin/ anticoagulant use, education, cell [EPA and DHA]
6 St. Luke’s Hospital Foundation; NIH (U.S.)
70
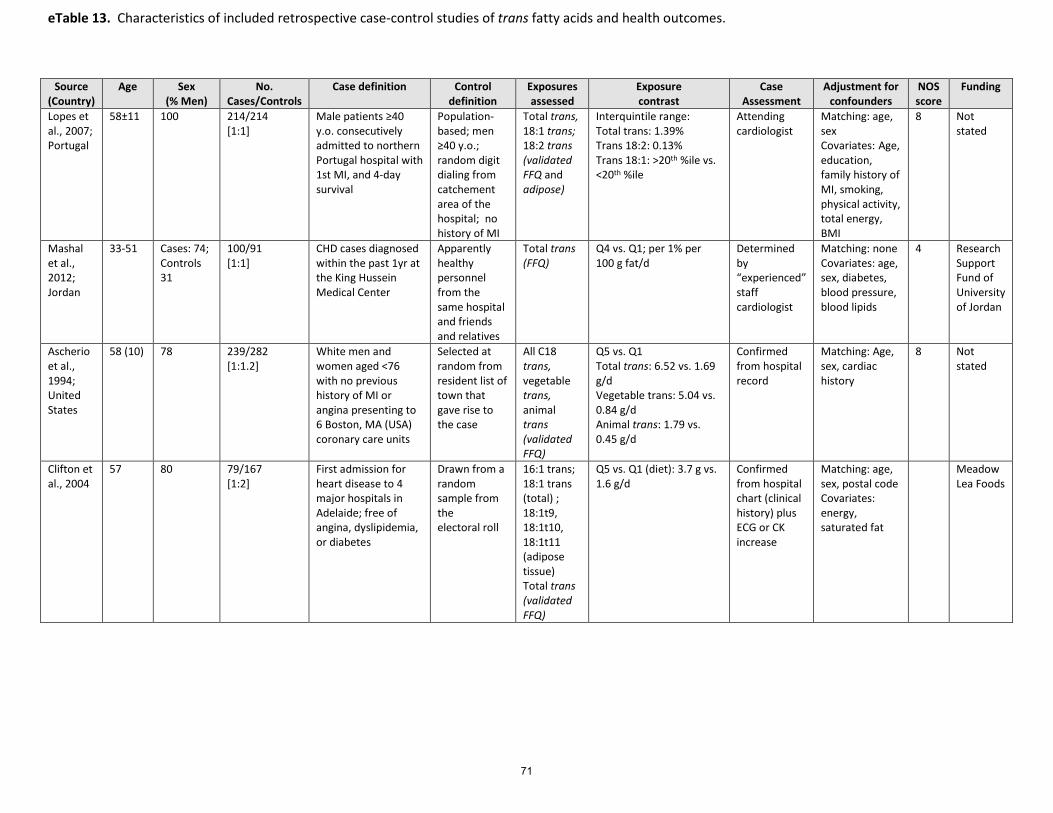
eTable 13. Characteristics of included retrospective case-control studies of trans fatty acids and health outcomes.
Source (Country)
Age Sex (% Men)
No. Cases/Controls
Case definition Control definition
Exposures assessed
Exposure contrast
Case Assessment
Adjustment for confounders
NOS score
Funding
Lopes et al., 2007; Portugal
58±11 100 214/214 [1:1]
Male patients ≥40 y.o. consecutively admitted to northern Portugal hospital with 1st MI, and 4-day survival
Population-based; men ≥40 y.o.; random digit dialing from catchement area of the hospital; no history of MI
Total trans, 18:1 trans; 18:2 trans (validated FFQ and adipose)
Interquintile range: Total trans: 1.39% Trans 18:2: 0.13% Trans 18:1: >20th %ile vs. <20th %ile
Attending cardiologist
Matching: age, sex Covariates: Age, education, family history of MI, smoking, physical activity, total energy, BMI
8 Not stated
Mashal et al., 2012; Jordan
33-51 Cases: 74; Controls 31
100/91 [1:1]
CHD cases diagnosed within the past 1yr at the King Hussein Medical Center
Apparently healthy personnel from the same hospital and friends and relatives
Total trans (FFQ)
Q4 vs. Q1; per 1% per 100 g fat/d
Determined by “experienced” staff cardiologist
Matching: none Covariates: age, sex, diabetes, blood pressure, blood lipids
4 Research Support Fund of University of Jordan
Ascherio et al., 1994; United States
58 (10) 78 239/282 [1:1.2]
White men and women aged <76 with no previous history of MI or angina presenting to 6 Boston, MA (USA) coronary care units
Selected at random from resident list of town that gave rise to the case
All C18 trans, vegetable trans, animal trans (validated FFQ)
Q5 vs. Q1 Total trans: 6.52 vs. 1.69 g/d Vegetable trans: 5.04 vs. 0.84 g/d Animal trans: 1.79 vs. 0.45 g/d
Confirmed from hospital record
Matching: Age, sex, cardiac history
8 Not stated
Clifton et al., 2004
57 80 79/167 [1:2]
First admission for heart disease to 4 major hospitals in Adelaide; free of angina, dyslipidemia, or diabetes
Drawn from a random sample from the electoral roll
16:1 trans; 18:1 trans (total) ; 18:1t9, 18:1t10, 18:1t11 (adipose tissue) Total trans (validated FFQ)
Q5 vs. Q1 (diet): 3.7 g vs. 1.6 g/d
Confirmed from hospital chart (clinical history) plus ECG or CK increase
Matching: age, sex, postal code Covariates: energy, saturated fat
Meadow Lea Foods
71

Study Follow‐up Diet Method Diet measured Unit increase
RR
Nurses’ Health Study66 14 y Validated semi‐quantitative FFQ Baseline, 1984, 1986,
1990 2% E 1.30 (1.15, 1.47)
Zutphen Elders Study30 10 y Cross‐check diet history Baseline, 1990, 1995 2% E 1.28 (1.01, 1.61)
ATBC29 10 y Diet history questionnaire Baseline 2% E 1.14 (0.96, 1.35)
Health Professionals Follow‐up Study2,28 14 y Validated semi‐quantitative FFQ Baseline, 1990, 1994,
1998 2% E 1.26 (0.99, 1.61)
Meta‐analysis 2% E 1.25 (1.15, 1.36) eTable 14. Pooled multivariable RR of CHD associated with a 2% increase in TFA intake at the expense of carbohydrate.
Study Follow‐up Diet Method Diet measured Unit
increase RR
Strong Heart Study (47‐59 y)26 7 y 24‐hour recall Baseline 2% E 1.25 (0.80, 1.94)
Strong Heart Study (60‐79 y)26 7 y 24‐hour recall Baseline 2% E 1.12 (0.75, 1.43)
Health Professionals’ Followup Study28,2 6 y Validated semi‐quantitative FFQ Baseline, 1990 2% E 0.93 (0.52, 1.66)
ATBC29 6.1 y Validated diet questionnaire Baseline 2% Ecxiii
1.41 (1.28, 1.56) Meta‐analysis 2%E 1.31 (1.13, 1.56) eTable 15. Pooled multivariable RR of CHD mortality associated with a 2% increase in TFA intake at the expense of carbohydrate.
72
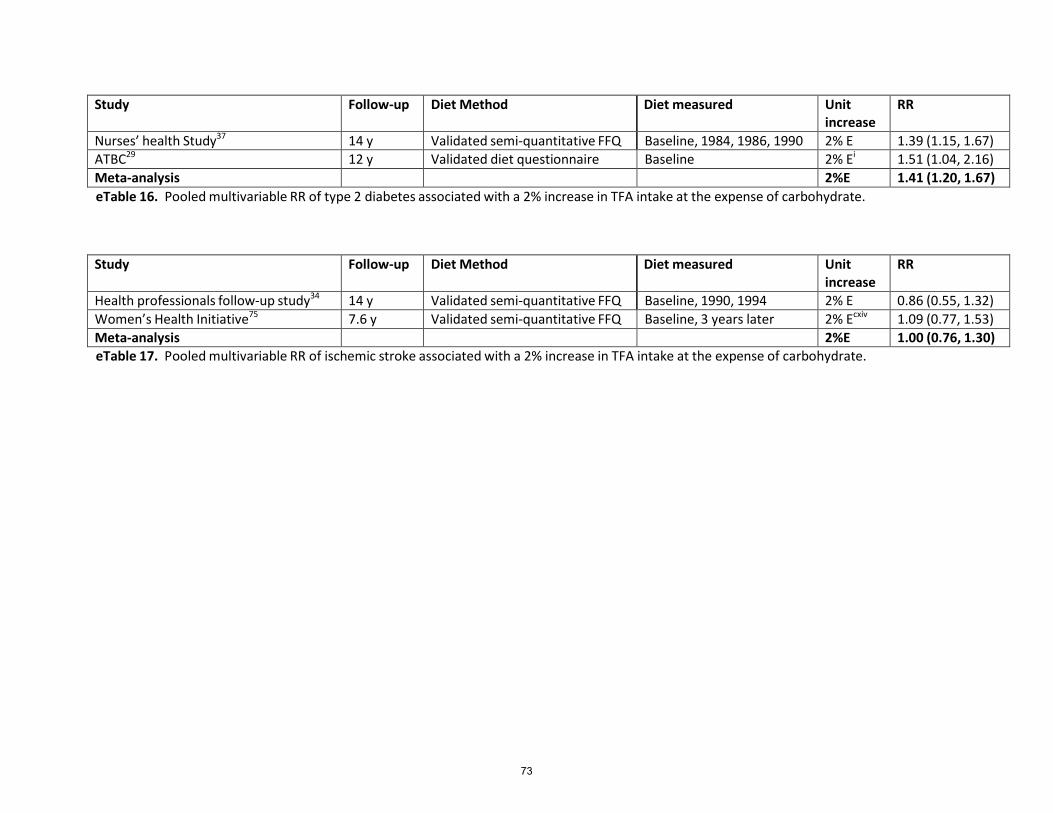
Study Follow‐up Diet Method Diet measured Unit
increase RR
Nurses’ health Study37 14 y Validated semi‐quantitative FFQ Baseline, 1984, 1986, 1990 2% E 1.39 (1.15, 1.67)
ATBC29 12 y Validated diet questionnaire Baseline 2% Ei
1.51 (1.04, 2.16) Meta‐analysis 2%E 1.41 (1.20, 1.67) eTable 16. Pooled multivariable RR of type 2 diabetes associated with a 2% increase in TFA intake at the expense of carbohydrate.
Study Follow‐up Diet Method Diet measured Unit increase
RR
Health professionals follow‐up study34 14 y Validated semi‐quantitative FFQ Baseline, 1990, 1994 2% E 0.86 (0.55, 1.32)
Women’s Health Initiative75 7.6 y Validated semi‐quantitative FFQ Baseline, 3 years later 2% Ecxiv
1.09 (0.77, 1.53) Meta‐analysis 2%E 1.00 (0.76, 1.30) eTable 17. Pooled multivariable RR of ischemic stroke associated with a 2% increase in TFA intake at the expense of carbohydrate.
73
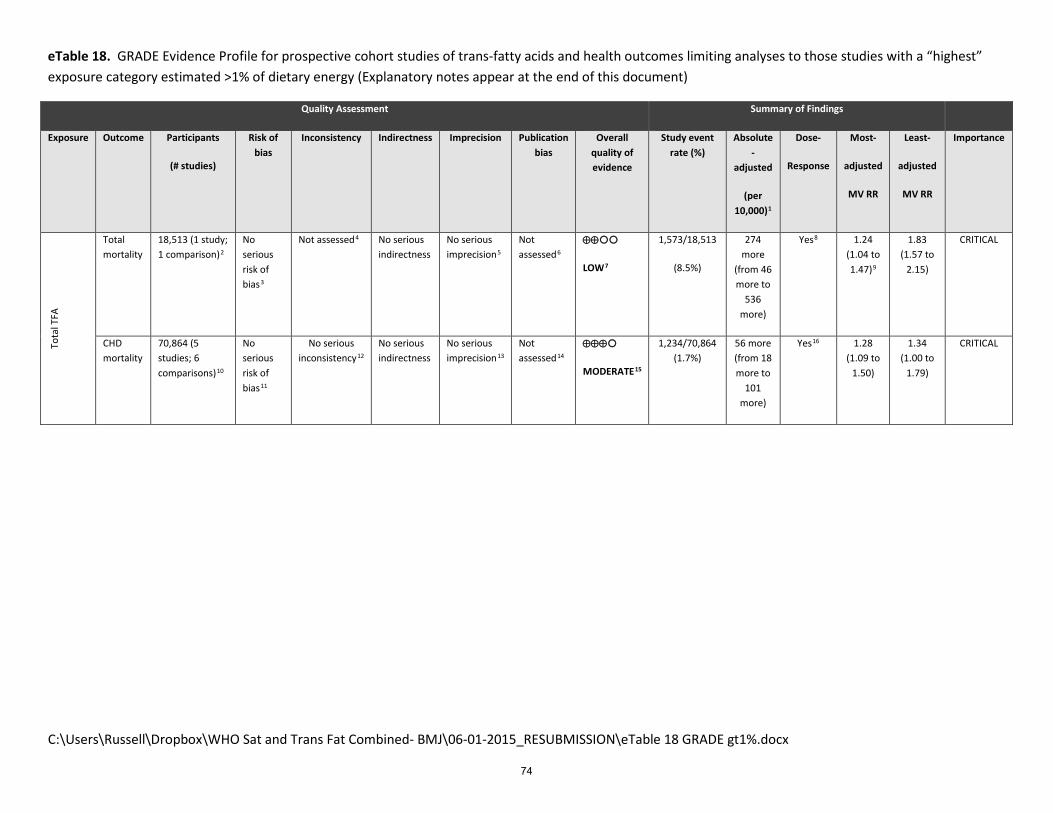
C:\Users\Russell\Dropbox\WHO Sat and Trans Fat Combined- BMJ\06-01-2015_RESUBMISSION\eTable 18 GRADE gt1%.docx
eTable 18. GRADE Evidence Profile for prospective cohort studies of trans-fatty acids and health outcomes limiting analyses to those studies with a “highest” exposure category estimated >1% of dietary energy (Explanatory notes appear at the end of this document)
Quality Assessment Summary of Findings
Exposure Outcome Participants
(# studies)
Risk of bias
Inconsistency Indirectness Imprecision Publication bias
Overall quality of evidence
Study event rate (%)
Absolute -
adjusted
(per 10,000)1
Dose-
Response
Most-
adjusted
MV RR
Least-
adjusted
MV RR
Importance
Tota
l TFA
Total mortality
18,513 (1 study; 1 comparison)2
No serious risk of bias3
Not assessed4 No serious indirectness
No serious imprecision5
Not assessed6
⊕⊕
LOW7
1,573/18,513
(8.5%)
274 more
(from 46 more to
536 more)
Yes8 1.24 (1.04 to 1.47)9
1.83 (1.57 to
2.15)
CRITICAL
CHD mortality
70,864 (5 studies; 6 comparisons)10
No serious risk of bias11
No serious inconsistency12
No serious indirectness
No serious imprecision13
Not assessed14
⊕⊕⊕
MODERATE15
1,234/70,864 (1.7%)
56 more (from 18 more to
101 more)
Yes16 1.28 (1.09 to
1.50)
1.34 (1.00 to
1.79)
CRITICAL
74
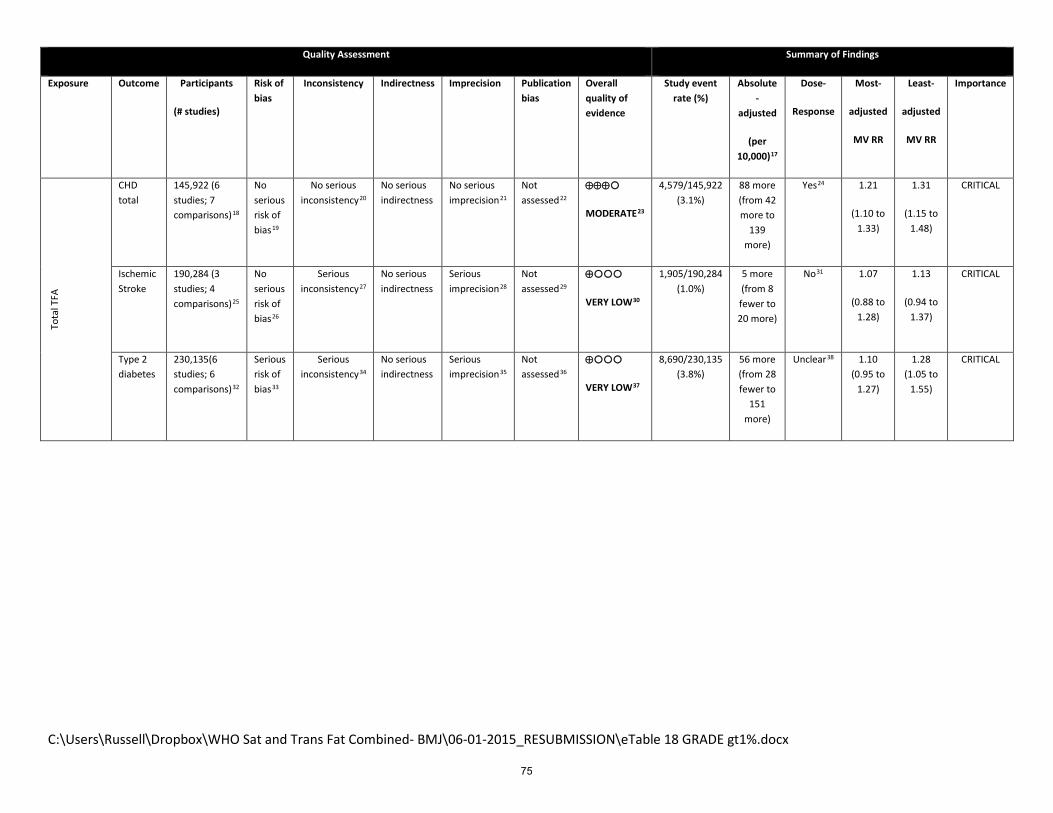
C:\Users\Russell\Dropbox\WHO Sat and Trans Fat Combined- BMJ\06-01-2015_RESUBMISSION\eTable 18 GRADE gt1%.docx
Quality Assessment Summary of Findings
Exposure Outcome Participants
(# studies)
Risk of bias
Inconsistency Indirectness Imprecision Publication bias
Overall quality of evidence
Study event rate (%)
Absolute -
adjusted
(per 10,000)17
Dose-
Response
Most-
adjusted
MV RR
Least-
adjusted
MV RR
Importance
Tota
l TFA
CHD total
145,922 (6 studies; 7 comparisons)18
No serious risk of bias19
No serious inconsistency20
No serious indirectness
No serious imprecision21
Not assessed22
⊕⊕⊕
MODERATE23
4,579/145,922 (3.1%)
88 more (from 42 more to
139 more)
Yes24 1.21
(1.10 to 1.33)
1.31
(1.15 to 1.48)
CRITICAL
Ischemic Stroke
190,284 (3 studies; 4 comparisons)25
No serious risk of bias26
Serious inconsistency27
No serious indirectness
Serious imprecision28
Not assessed29
⊕
VERY LOW30
1,905/190,284 (1.0%)
5 more (from 8 fewer to 20 more)
No31 1.07
(0.88 to 1.28)
1.13
(0.94 to 1.37)
CRITICAL
Type 2 diabetes
230,135(6 studies; 6 comparisons)32
Serious risk of bias33
Serious inconsistency34
No serious indirectness
Serious imprecision35
Not assessed36
⊕
VERY LOW37
8,690/230,135 (3.8%)
56 more (from 28 fewer to
151 more)
Unclear38 1.10 (0.95 to
1.27)
1.28 (1.05 to
1.55)
CRITICAL
75

C:\Users\Russell\Dropbox\WHO Sat and Trans Fat Combined- BMJ\06-01-2015_RESUBMISSION\eTable 18 GRADE gt1%.docx
1 Absolute risk was estimated using the method of Newcombe et al. (Evid Based Med 2014;19;6-8). Estimates of baseline risk and associated 95% confidence levels, were obtained from the Emerging Risk Factors Consortium (Lancet 2010 Jun 26;375(9733):2215-22) which included 691,872 people from 102 prospective studies. Overall, the mean age of participants at entry was 52 (SD 13) years, and 297,081 (43%) were women. (96%) were in Europe, North America, and Australasia, with the remainder in Japan or the Caribbean. These risks were 11.4% (11.2% to 11.6%) for total mortality; 2.0% (1.9% to 2.2%) for CHD mortality, 4.2% (4.1% to 4.4%) for total CHD: 0.7% (0.5% to 0.8%) for ischemic stroke; and 5.6% (5.5% to 5.8%) for type 2 diabetes. 2 Included data from 1 prospective cohort study (1 comparison), with 7 years of follow-up, enrolling participants from the United States. 3 Possibility of residual confounding always must be considered in observational studies. Newcastle-Ottawa score was 8. Fully-adjusted model yielded weaker estimate than minimally-adjusted model, suggesting that these variables captured some important confounders. Since the direction of the bias is likely towards the null, and the pooled estimate exceeded the threshold of harm (>1.2), not downgraded. 4 Unable to assess with only one study. 5 Optimal information size met (n= 1,573 events); summary RR does not cross 1.0, however upper 95% CI exceeds threshold of harm (>1.2) and lower 95% CI excludes meaningful benefit. 6 Unable to assess with only one study. 7 Data from cohort studies begin with a grade of “LOW”. Not downgraded. 8 P-value for trend of increased risk across quintiles of intake=0.004; the study did not present data for the continuous association. Because only 1 cohort provided data for test for trend, we did not feel confident upgrading for possible dose-response. 9 Estimate from one study. 10 Included data from 5 prospective cohort studies (6 comparisons), with a duration of follow-up from 6 to 21.4 years (median=6.6), enrolling participants from 3 different countries (USA, Finland, and the Netherlands). 11 Possibility of residual confounding always must be considered in observational studies. Fully-adjusted model yielded weaker estimates than minimally-adjusted models, suggesting that these variables captured some important confounders. Newcastle-Ottawa scores of these studies range from 7 to 9 (median=7.5). Diet assessment in 3 studies (Ascherio et al., Pietinen et al., Oomen et al.) was by validated instrument. In Xu et al., a single 24-h recall was used. Using a single dietary assessment may induce misclassification of true diet over the longer term, as during the follow-up period, it is likely that the composition of the food supply changed substantially. Since the direction of the bias is likely towards the null, and the pooled estimate exceeded the threshold of harm (>1.2), not downgraded. 12 I2=0%; Phet=0.66. 5 studies had point estimates >1.0 and 95% CI and in the 1 study that did not, the 95% CI of this estimate was 0.42 to 1.65. 13 Optimal information size met (n=1,234 events); summary RR does not cross 1.0, however upper 95% CI exceeds threshold of harm (>1.2) and lower 95% CI bound excludes meaningful benefit. 14 Due to small number of studies (n<10) risk of publication bias not formally assessed. However, inclusion of additional “underpublished” data from the Iowa Womens’ Health study + Finnish Mobile Health Clinics Study (see eFigure 17) results in pooled estimate of 1.22 (95% CI: 1.07 to 1.36; P=0.002; I2=0%; Phet=0.46) 15 Data from cohort studies begin with a grade of “LOW”. Upgraded (+1) due to evidence for dose-response. 16 Continuous dose-response relationship was assessed in 4 studies (n=1,002 events; RR per 2% increase in TFA at the expense of carbohydrate: 1.31 (1.13 to 1.56). 17 Estimated using prevalence data from Heart and Stroke Foundation (Canada), American Heart Association (U.S.A.), American Diabetes Association (U.S.A.), World Health Organization (WHO), Centers for Disease Control (U.S.A.) 18 Included data from 6 prospective cohort studies (7 comparisons), with a duration of follow-up from 1 to 20 years (median=6), enrolling participants from 3 different countries (USA, Finland, Netherlands). 19 Possibility of residual confounding always must be considered in observational studies. Newcastle-Ottawa scores of these studies range from 7 to 9 (median=8). Fully-adjusted model yielded weaker estimates than minimally-adjusted models, suggesting that these variables captured some important confounders. Both studies assessed diet with validated instruments, at multiple time points. Not downgraded. 20 I2=0%; Phet=0.43. All 7 comparisons reported point estimates >1.0.
76
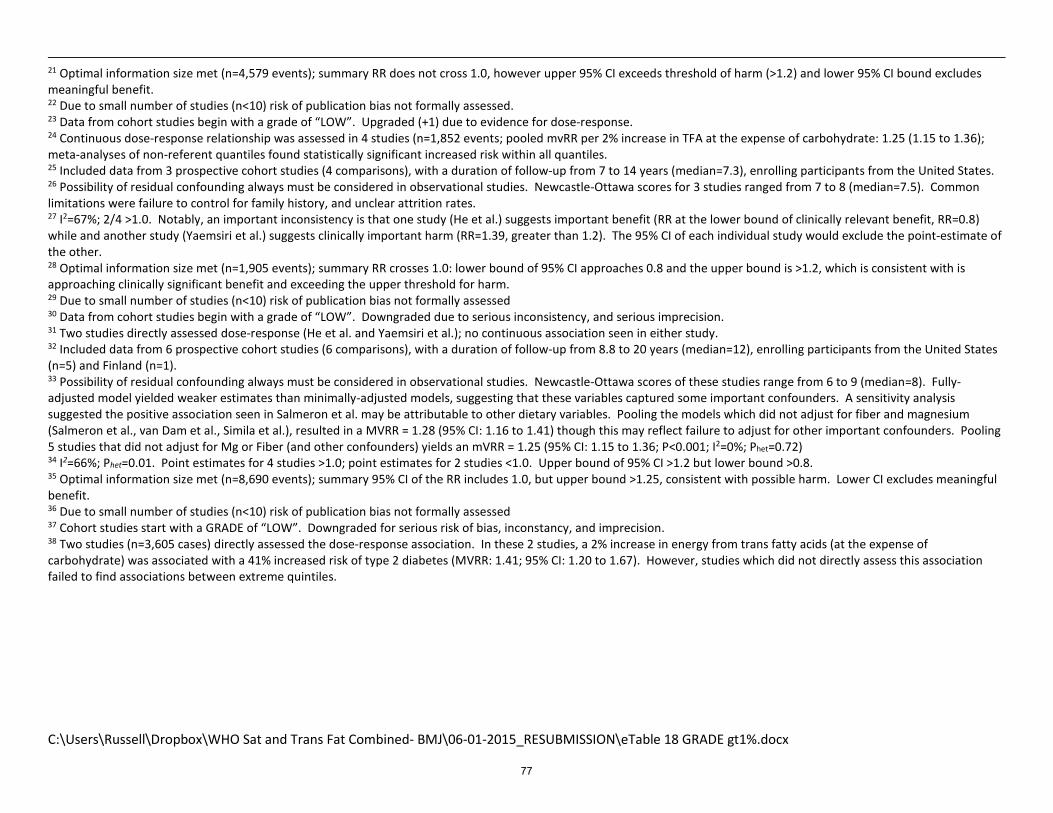
C:\Users\Russell\Dropbox\WHO Sat and Trans Fat Combined- BMJ\06-01-2015_RESUBMISSION\eTable 18 GRADE gt1%.docx
21 Optimal information size met (n=4,579 events); summary RR does not cross 1.0, however upper 95% CI exceeds threshold of harm (>1.2) and lower 95% CI bound excludes meaningful benefit. 22 Due to small number of studies (n<10) risk of publication bias not formally assessed. 23 Data from cohort studies begin with a grade of “LOW”. Upgraded (+1) due to evidence for dose-response. 24 Continuous dose-response relationship was assessed in 4 studies (n=1,852 events; pooled mvRR per 2% increase in TFA at the expense of carbohydrate: 1.25 (1.15 to 1.36); meta-analyses of non-referent quantiles found statistically significant increased risk within all quantiles. 25 Included data from 3 prospective cohort studies (4 comparisons), with a duration of follow-up from 7 to 14 years (median=7.3), enrolling participants from the United States. 26 Possibility of residual confounding always must be considered in observational studies. Newcastle-Ottawa scores for 3 studies ranged from 7 to 8 (median=7.5). Common limitations were failure to control for family history, and unclear attrition rates. 27 I2=67%; 2/4 >1.0. Notably, an important inconsistency is that one study (He et al.) suggests important benefit (RR at the lower bound of clinically relevant benefit, RR=0.8) while and another study (Yaemsiri et al.) suggests clinically important harm (RR=1.39, greater than 1.2). The 95% CI of each individual study would exclude the point-estimate of the other. 28 Optimal information size met (n=1,905 events); summary RR crosses 1.0: lower bound of 95% CI approaches 0.8 and the upper bound is >1.2, which is consistent with is approaching clinically significant benefit and exceeding the upper threshold for harm. 29 Due to small number of studies (n<10) risk of publication bias not formally assessed 30 Data from cohort studies begin with a grade of “LOW”. Downgraded due to serious inconsistency, and serious imprecision. 31 Two studies directly assessed dose-response (He et al. and Yaemsiri et al.); no continuous association seen in either study. 32 Included data from 6 prospective cohort studies (6 comparisons), with a duration of follow-up from 8.8 to 20 years (median=12), enrolling participants from the United States (n=5) and Finland (n=1). 33 Possibility of residual confounding always must be considered in observational studies. Newcastle-Ottawa scores of these studies range from 6 to 9 (median=8). Fully-adjusted model yielded weaker estimates than minimally-adjusted models, suggesting that these variables captured some important confounders. A sensitivity analysis suggested the positive association seen in Salmeron et al. may be attributable to other dietary variables. Pooling the models which did not adjust for fiber and magnesium (Salmeron et al., van Dam et al., Simila et al.), resulted in a MVRR = 1.28 (95% CI: 1.16 to 1.41) though this may reflect failure to adjust for other important confounders. Pooling 5 studies that did not adjust for Mg or Fiber (and other confounders) yields an mVRR = 1.25 (95% CI: 1.15 to 1.36; P<0.001; I2=0%; Phet=0.72) 34 I2=66%; Phet=0.01. Point estimates for 4 studies >1.0; point estimates for 2 studies <1.0. Upper bound of 95% CI >1.2 but lower bound >0.8. 35 Optimal information size met (n=8,690 events); summary 95% CI of the RR includes 1.0, but upper bound >1.25, consistent with possible harm. Lower CI excludes meaningful benefit. 36 Due to small number of studies (n<10) risk of publication bias not formally assessed 37 Cohort studies start with a GRADE of “LOW”. Downgraded for serious risk of bias, inconstancy, and imprecision. 38 Two studies (n=3,605 cases) directly assessed the dose-response association. In these 2 studies, a 2% increase in energy from trans fatty acids (at the expense of carbohydrate) was associated with a 41% increased risk of type 2 diabetes (MVRR: 1.41; 95% CI: 1.20 to 1.67). However, studies which did not directly assess this association failed to find associations between extreme quintiles.
77
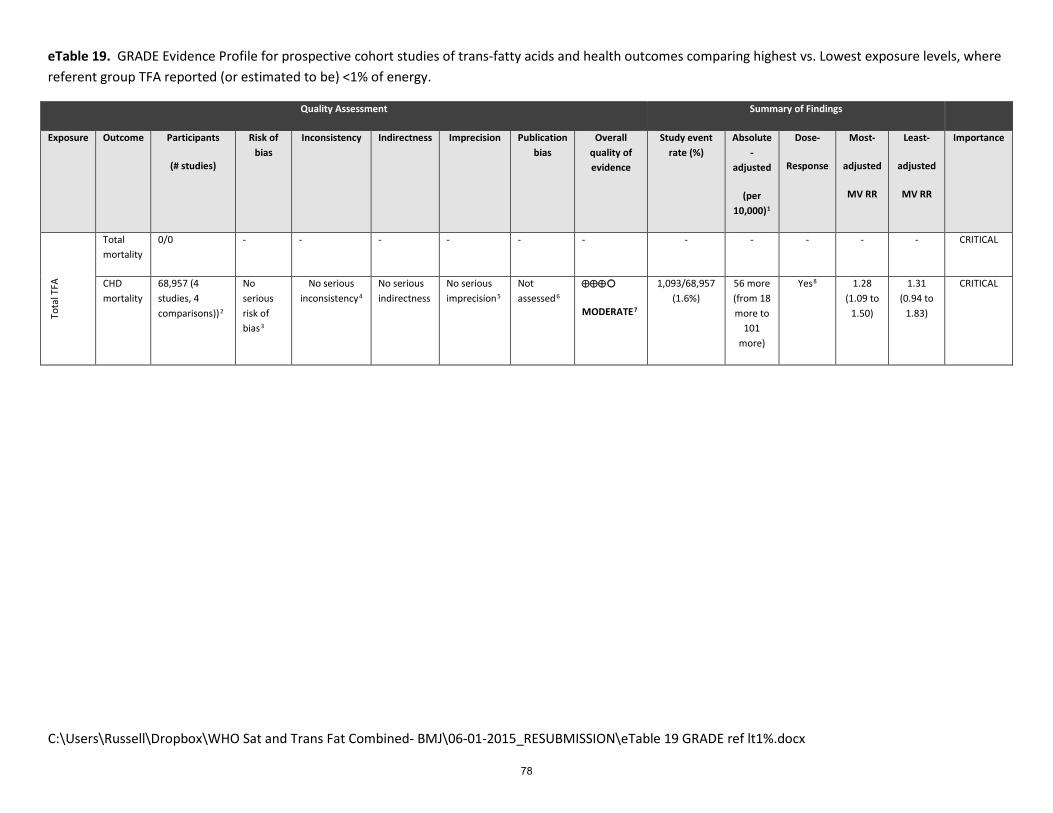
C:\Users\Russell\Dropbox\WHO Sat and Trans Fat Combined- BMJ\06-01-2015_RESUBMISSION\eTable 19 GRADE ref lt1%.docx
eTable 19. GRADE Evidence Profile for prospective cohort studies of trans-fatty acids and health outcomes comparing highest vs. Lowest exposure levels, where referent group TFA reported (or estimated to be) <1% of energy.
Quality Assessment Summary of Findings
Exposure Outcome Participants
(# studies)
Risk of bias
Inconsistency Indirectness Imprecision Publication bias
Overall quality of evidence
Study event rate (%)
Absolute -
adjusted
(per 10,000)1
Dose-
Response
Most-
adjusted
MV RR
Least-
adjusted
MV RR
Importance
Tota
l TFA
Total mortality
0/0 - - - - - - - - - - - CRITICAL
CHD mortality
68,957 (4 studies, 4 comparisons))2
No serious risk of bias3
No serious inconsistency4
No serious indirectness
No serious imprecision5
Not assessed6
⊕⊕⊕
MODERATE7
1,093/68,957 (1.6%)
56 more (from 18 more to
101 more)
Yes8 1.28 (1.09 to
1.50)
1.31 (0.94 to
1.83)
CRITICAL
78

Quality Assessment Summary of Findings
Exposure Outcome Participants
(# studies)
Risk of bias
Inconsistency Indirectness Imprecision Publication bias
Overall quality of evidence
Study event rate (%)
Absolute -
adjusted
(per 10,000)9
Dose-
Response
Most-
adjusted
MV RR
Least-
adjusted
MV RR
Importance
Tota
l TFA
CHD total
101,499 (4 studies, 4 comparisons)10
No serious risk of bias11
No serious inconsistency12
No serious indirectness
No serious imprecision13
Not assessed14
⊕⊕⊕
MODERATE15
2,715/101,499 (2.7%)
67 more (from 17 more to
122 more)
Yes16 1.16
(1.04 to 1.29)
1.26
(1.10 to 1.44)
CRITICAL
Ischemic Stroke
86,152 (1 study, 1 comparison)17
No serious risk of bias18
Not assessed19
No serious indirectness
Serious imprecision20
Not assessed21
⊕
VERY LOW22
455/86,152 (0.5%)
14 fewer (from 33 fewer to 13 more)
No23 0.80 (0.54 to
1.18)
0.93 (0.69 to
1.25)
CRITICAL
Type 2 diabetes
109,963 (4 studies, 4 comparisons)24
Serious risk of bias25
Serious inconsistency26
No serious indirectness
Serious imprecision27
Not assessed28
⊕
VERY LOW29
4,293/109,963 (3.9%)
45 more (from 45 fewer to
157 more)
Unclear30 1.08 (0.92 to
1.28)
1.42 (1.20 to
1.69)
CRITICAL
79

80

1 Absolute risk was estimated using the method of Newcombe et al. (Evid Based Med 2014;19;6-8). Estimates of baseline risk and associated 95% confidence levels, were obtained from the Emerging Risk Factors Consortium (Lancet 2010 Jun 26;375(9733):2215-22) which included 691,872 people from 102 prospective studies. Overall, the mean age of participants at entry was 52 (SD 13) years, and 297,081 (43%) were women. (96%) were in Europe, North America, and Australasia, with the remainder in Japan or the Caribbean. These risks were 11.4% (11.2% to 11.6%) for total mortality; 2.0% (1.9% to 2.2%) for CHD mortality, 4.2% (4.1% to 4.4%) for total CHD: 0.7% (0.5% to 0.8%) for ischemic stroke; and 5.6% (5.5% to 5.8%) for type 2 diabetes. 2 Included data from 4 prospective cohort studies (4 comparisons), with a duration of follow-up from 6 to 21.4 years (median=6.6), enrolling participants from 2 different countries (USA and Finland). 3 Possibility of residual confounding always must be considered in observational studies. Fully-adjusted model yielded similar estimates to minimally adjusted models. Newcastle-Ottawa scores of these studies range from 7 to 9 (median=8.5). Diet assessment in 3 studies (Ascherio et al., Pietinen et al., Virtanen et al.) was by validated instrument. In Xu et al., a single 24-h recall was used. Using a single dietary assessment may induce misclassification of true diet over the longer term, as during the follow-up period, it is likely that the composition of the food supply changed substantially. Since the direction of the bias is likely towards the null, and the pooled estimate exceeded the threshold of harm (>1.2), not downgraded. 4 I2=0%; Phet=0.64. All 4 studies had point estimates >1.0. 5 Optimal information size met (n=1,093 events); summary RR does not cross 1.0, however upper 95% CI exceeds threshold of harm (>1.2) and lower 95% CI bound excludes meaningful benefit. 6 Due to small number of studies (n<10) risk of publication bias not formally assessed. However, inclusion of additional “underpublished” data from the Iowa Womens’ Health study + Finnish Mobile Health Clinics Study results in pooled estimate of 1.21 (95% CI: 1.05 to 1.40; P=0.008; I2=4%; Phet=0.40) 7 Data from cohort studies begin with a grade of “LOW”. Upgraded (+1) due to evidence for dose-response. 8 Continuous dose-response relationship was assessed in 3 studies (n=910 events; RR per 2% increase in TFA at the expense of carbohydrate: 1.37 (1.21 to 1.56). 9 Estimated using prevalence data from Heart and Stroke Foundation (Canada), American Heart Association (U.S.A.), American Diabetes Association (U.S.A.), World Health Organization (WHO), Centers for Disease Control (U.S.A.) 10 Included data from 4 prospective cohort studies (4 comparisons), with a duration of follow-up from 1 to 7.2 years (median=6), enrolling participants from 2 different countries (USA, Finland). 11 Possibility of residual confounding always must be considered in observational studies. Newcastle-Ottawa scores of these studies range from 8 to 9 (median=8.5). Fully-adjusted model yielded weaker estimates than minimally-adjusted models, suggesting that these variables captured some important confounders. Both studies assessed diet with validated instruments, at multiple time points. Not downgraded. 12 I2=0%; Phet=0.91. All 4 comparisons reported point estimates >1.0. 13 Optimal information size met (n=2,719 events); summary RR does not cross 1.0, however upper 95% CI exceeds threshold of harm (>1.2) and lower 95% CI bound excludes meaningful benefit. 14 Due to small number of studies (n<10) risk of publication bias not formally assessed. 15 Data from cohort studies begin with a grade of “LOW”. Upgraded (+1) due to evidence for dose-response. 16 Continuous dose-response relationship was assessed in 2 studies (n=2,133 events; pooled mvRR per 2% increase in TFA at the expense of carbohydrate: 1.15 (0.97 to 1.36); meta-analyses of non-referent quantiles found statistically significant increased risk within all quantiles. 17 Included data from 1 prospective cohort study (1 comparison), with a duration of follow-up of 14 years, enrolling participants from the United States. 18 Possibility of residual confounding always must be considered in observational studies. Newcastle-Ottawa score for this study was 7. Limitations were failure to control for family history, and unclear attrition rate. 19 Not assessed; only 1 study. 20 Optimal information size met (n=455 events); summary RR crosses 1.0: lower bound of 95% CI exceeds 0.8 and the upper bound is approaching 1.2, which is consistent with is approaching clinically significant benefit and exceeding the upper threshold for harm. 21 Not assessed; only 1 study. 22 Data from cohort studies begin with a grade of “LOW”. Downgraded due to serious imprecision. 23This study directly modeled continuous dose-response; no continuous association was seen. 24 Included data from 4 prospective cohort studies (4 comparisons), with a duration of follow-up from 8.8 to 20 years (median=12), enrolling participants from the United States (n=3) and Finland (n=1). 25 Possibility of residual confounding always must be considered in observational studies. Newcastle-Ottawa scores of these studies range from 7 to 9 (median=8). Fully-adjusted model yielded weaker estimates than minimally-adjusted models, suggesting that these variables captured some important confounders. Pooling the models which did not adjust for fiber and magnesium (van Dam et al., Simila et al.), resulted in a MVRR = 1.26 (95% CI: 1.11 to 1.43) though this may reflect failure to adjust for other important
81

confounders. Pooling 4 estimates that did not adjust for Mg or Fiber (but which did address other potential confounders) yields an mVRR = 1.23 (95% CI: 1.12 to 1.35; P<0.001; I2=0%; Phet=0.67) 26 I2=54%; Phet=0.09. Point estimates for 3 studies >1.0; point estimates for 1 study <1.0. Upper bound of 95% CI >1.2 but lower bound >0.8. 27 Optimal information size met (n=4,293 events); summary 95% CI of the RR includes 1.0, but upper bound >1.25, consistent with possible harm. Lower CI excludes meaningful benefit. 28 Due to small number of studies (n<10) risk of publication bias not formally assessed 29 Cohort studies start with a GRADE of “LOW”. Downgraded for serious risk of bias, inconsistency, and imprecision. 30 One study (n=1,097 cases) directly assessed the dose-response association. In this study, a 2% increase in energy from trans fatty acids (at the expense of carbohydrate) was associated with a 51% increased risk of type 2 diabetes (MVRR: 1.51; 95% CI: 1.04 to 2.16). However, studies which did not directly assess this association failed to find associations between extreme quintiles.
82

eTable 20: Reported and estimated dietary intakes of trans fatty acids in cohort studies, according to quantile.
Percent intakes, where not provided (italics) were calculated from grams/d assuming that cohorts of women consumed 1800 kcal/d; and cohorts of men consumed 2100 kcal/d. Highest = fifth quintile, unless another quantile is in bold, in which case that quantile is the highest category.
% energy grams
Study figure Measure Lowest Q2 Q3 Q4 Highest Contrast Lowest Q2 Q3 Q4 Highest
All-Cause Mortality
Chien eFigure 11 total tfa n/r n/r n/r n/r
Kiage eFigure 11 total tfa 1.60% 2.30% 2.84% 3.45% 4.68% 3.08%
CHD Mortality
Ascherio eFigure 15 total tfa 0.64% 0.94% 1.16% 1.41% 1.84% 1.20% 1.5 2.2 2.7 3.3 4.3
Pietinen eFigure 15 total tfa 0.56% 0.73% 0.86% 1.16% 2.40% 1.84% 1.3 1.7 2 2.7 5.6
Oomen eFigure 15 total tfa 2% contrast 2.00%
Xu 60-79 eFigure 15 total tfa 1.00% 1.80% 2.60% 3.90% 3.90% 2.90%
Xu 47-59 eFigure 15 total tfa 0.90% 1.80% 2.60% 4.00% 4.00% 3.10%
Virtanen eFigure 15 total tfa 0.70% 0.90% 1.10% 1.50% 1.50% 0.80%
CHD Mortality (+ unpublished)
Ascherio eFigure 17 total tfa 0.64% 0.94% 1.16% 1.41% 1.80% 1.16% 1.5 2.2 2.7 3.3 4.2
Pietinen eFigure 17 total tfa 0.56% 0.73% 0.86% 1.16% 2.40% 1.84% 1.3 1.7 2 2.7 5.6
Oomen eFigure 17 total tfa 2% contrast 2%
Xu 60-79 eFigure 17 total tfa 1.00% 1.80% 2.60% 3.90% 3.90% 2.90%
Xu 47-59 eFigure 17 total tfa 0.90% 1.80% 2.60% 4.00% 4.00% 3.10%
Robien eFigure 17 total tfa 1.5% contrast 1.50%
Knekt 2013 eFigure 17 total tfa (W) 0.45% 0.68% 0.85% 1.08% 1.70% 1.25% 0.89 1.35 1.69 2.16 3.39
Knekt 2013 eFigure 17 total tfa (M) 0.56% 0.79% 0.98% 1.23% 1.99% 1.43% 1.3 1.85 2.29 2.87 4.64
Virtanen eFigure 17 total tfa 0.70% 0.90% 1.10% 1.50% 1.50% 0.80%
83

% energy
grams
Study figure Measure Lowest Q2 Q3 Q4 Highest Contrast Lowest Q2 Q3 Q4 Highest
CHD total
Pietinen eFigure 19 total tfa 0.56% 0.73% 0.86% 1.16% 2.66% 2.10% 1.3 1.7 2 2.7 6.2
Oomen eFigure 19 total tfa 2% contrast 2.00%
Oh >=65 eFigure 19 total tfa 1.30% 1.60% 1.90% 2.20% 2.80% 1.50% *not reported by age; used whole pop
Oh <65 eFigure 19 total tfa 1.30% 1.60% 1.90% 2.20% 2.80% 1.50% *not reported by age; used whole pop
Xu eFigure 19 total tfa 0.90% 1.80% 2.60% 3.90% 3.90% 3.00%
Howard eFigure 19 total tfa 0.55% 2.50% 2.50% 1.95%
Ischemic Stroke
He eFigure 21 total tfa 0.72% 1.00% 1.23% 1.47% 1.89% 1.18% 1.67 2.34 2.86 3.44 4.42
Yaemsiri eFigure 21 total tfa 1.10% 1.15% 1.30% 1.70% 3.05% 1.95% 2.2 2.3 2.6 3.4 6.1
Kiage 2014 W eFigure 21 total tfa 1.1% contrast 1.1% 2.13
Kiage 2014 M eFigure 21 total tfa 0.9% contrast 0.9% 2.13
type 2 diabetes
Salmeron eFigure 23 total tfa 1.30% 1.70% 2.00% 2.40% 2.90% 1.60%
Meyer eFigure 23 total tfa 1.10% 1.20% 1.40% 1.75% 2.60% 1.50% 2.2 2.4 2.8 3.5 5.2
van Dam eFigure 23 total tfa 0.70% 1.00% 1.30% 1.50% 2.00% 1.30%
Song eFigure 23 total tfa 0.56% 0.82% 1.05% 1.33% 1.83% 1.27% 1.12 1.64 2.09 2.65 3.66
Simila eFigure 23 total tfa 1% energy 1.00%
Wang eFigure 23 total tfa Q4 vs. Q1
INDUSTRIAL TFA
all-cause mortality
Laake M+W no figure PHVO 0.08% 0.40% 0.90% 1.40% 2.15% 2.08%
Laake W+M no figure PHFO 0.43% 1.10% 1.60% 2.10% 2.85% 2.43%
CHD mortality
Laake M+W eFigure 25 PHVO 0.08% 0.40% 0.90% 1.40% 2.15% 2.08%
Laake W+M eFigure 25 PHFO 0.43% 1.10% 1.60% 2.10% 2.85% 2.43%
Pietinen eFigure 25 Vegetable TFA 0.04% 0.17% 0.34% 0.69% 2.19% 2.14% 0.1 0.4 0.8 1.6 5.1
Pietinen no figure elaidic acid 0.56% 0.73% 0.86% 1.16% 2.40% 1.84% 1.3 1.7 2 2.7 5.6
84

% energy
grams
Study figure Measure Lowest Q2 Q3 Q4 Highest Contrast Lowest Q2 Q3 Q4 Highest CHD total
Willettt eFigure 29 Vegetable TFA 0.72% 0.97% 1.22% 1.46% 1.71% 0.99% 1.44 1.935 2.43 2.925 3.42
Oomen eFigure 29 Manufactured TFA 2% contrast 2%
RUMINANT TFA
all-cause mortality
Laake M eFigure 33 ruminant TFA 0.20% 0.47% 0.62% 0.77% 1.00% 0.80%
Laake W eFigure 33 ruminant TFA 0.20% 0.47% 0.62% 0.77% 1.00% 0.80%
CHD mortality
Pietinen eFigure 35 ruminant TFA 0.26% 0.47% 0.64% 0.81% 1.07% 0.81% 0.6 1.1 1.5 1.9 2.5
Laake M eFigure 35 ruminant TFA 0.20% 0.47% 0.62% 0.77% 1.00% 0.80%
Laake W eFigure 35 ruminant TFA 0.20% 0.47% 0.62% 0.77% 1.00% 0.80%
CHD total
Willett 1993 eFigure 37 ruminant TFA 0.48% 0.65% 0.81% 0.98% 1.14% 0.66% 0.96 1.29 1.62 1.95 2.28
Oomen 2001 eFigure 37 ruminant TFA 0.75% contrast 0.75%
Jakobsen W eFigure 37 ruminant TFA 0.35% 0.55% 0.75% 0.95% 1.35% 1.00% 0.7 1.1 1.5 1.9 2.7
Jakobsen M eFigure 37 ruminant TFA 0.34% 0.56% 0.77% 1.03% 1.46% 1.11% 0.8 1.3 1.8 2.4 3.4
type 2 diabetes
Mozaffarian 2010 eFigure 41 trans-palmitoleic
Mozaffarian 2013 eFigure 41 trans-palmitoleic
Sartaren eFigure 41 trans-palmitoleic
Yakoob eFigure 41 trans-palmitoleic
Wang eFigure 41 trans-palmitoleic 0.94% 1.42% 1.89% 2.44% 2.98% 1.8875 3.775 5.95
85