SUPPLEMENTARY MATERIALS Supplementary … MATERIALS Supplementary Figures Supplementary Figure 1....
9
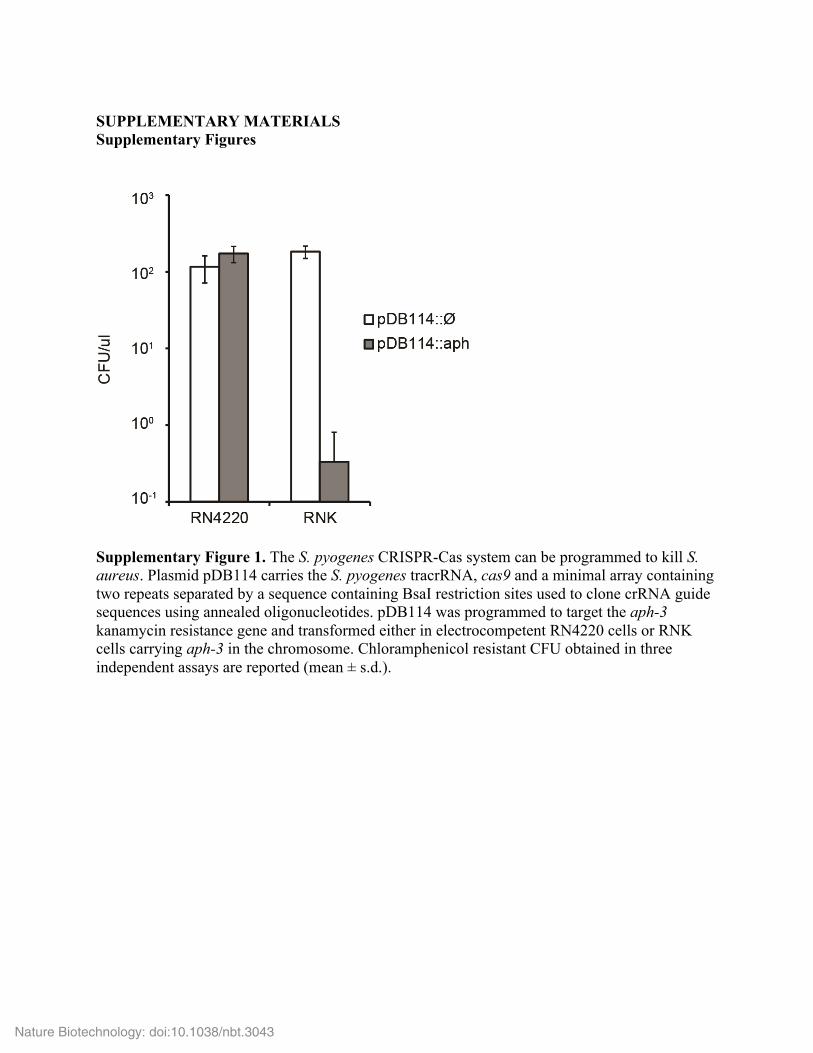
SUPPLEMENTARY MATERIALS Supplementary Figures Supplementary Figure 1. The S. pyogenes CRISPR-Cas system can be programmed to kill S. aureus. Plasmid pDB114 carries the S. pyogenes tracrRNA, cas9 and a minimal array containing two repeats separated by a sequence containing BsaI restriction sites used to clone crRNA guide sequences using annealed oligonucleotides. pDB114 was programmed to target the aph-3 kanamycin resistance gene and transformed either in electrocompetent RN4220 cells or RNK cells carrying aph-3 in the chromosome. Chloramphenicol resistant CFU obtained in three independent assays are reported (mean ± s.d.). Nature Biotechnology: doi:10.1038/nbt.3043
Transcript of SUPPLEMENTARY MATERIALS Supplementary … MATERIALS Supplementary Figures Supplementary Figure 1....
SUPPLEMENTARY MATERIALS Supplementary Figures
Supplementary Figure 1. The S. pyogenes CRISPR-Cas system can be programmed to kill S. aureus. Plasmid pDB114 carries the S. pyogenes tracrRNA, cas9 and a minimal array containing two repeats separated by a sequence containing BsaI restriction sites used to clone crRNA guide sequences using annealed oligonucleotides. pDB114 was programmed to target the aph-3 kanamycin resistance gene and transformed either in electrocompetent RN4220 cells or RNK cells carrying aph-3 in the chromosome. Chloramphenicol resistant CFU obtained in three independent assays are reported (mean ± s.d.).
Nature Biotechnology: doi:10.1038/nbt.3043
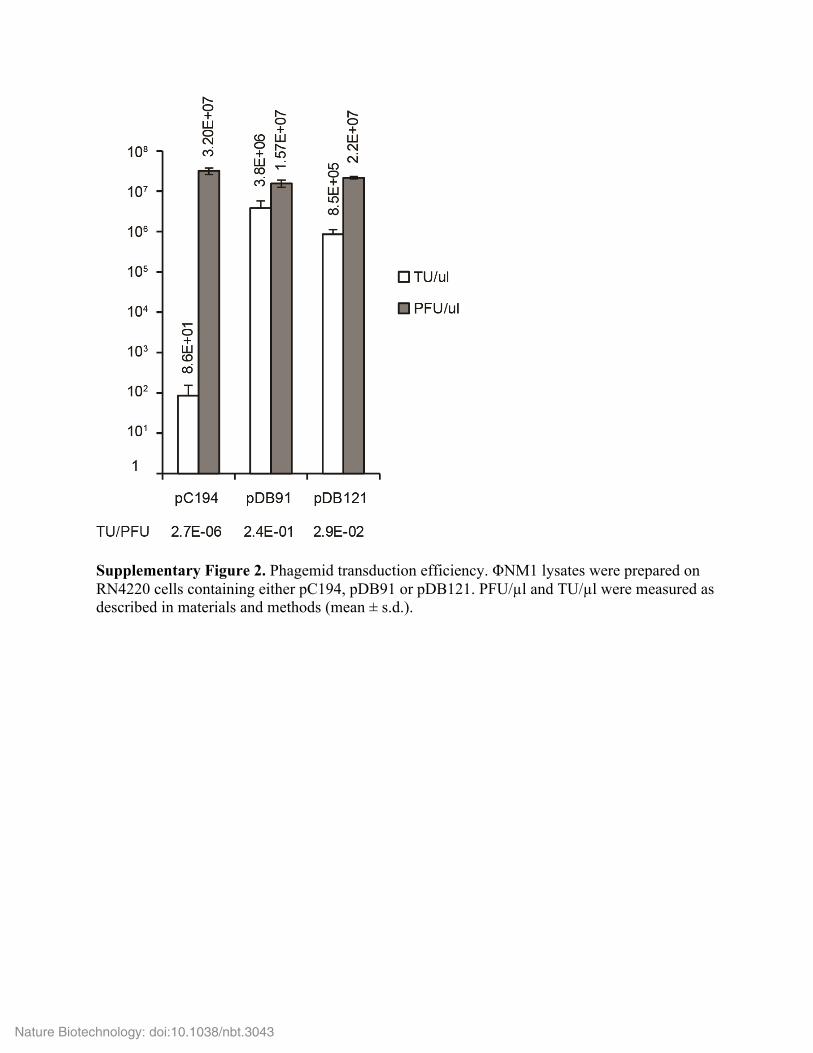
Supplementary Figure 2. Phagemid transduction efficiency. ΦNM1 lysates were prepared on RN4220 cells containing either pC194, pDB91 or pDB121. PFU/µl and TU/µl were measured as described in materials and methods (mean ± s.d.).
Nature Biotechnology: doi:10.1038/nbt.3043

Supplementary Figure 3. Analysis of survivor colonies. Eight colonies of RNKΦ that survived a treatment with pDB121::aph were re-streaked on TSA-chloramphenicol plates. Two chloramphenicol-resistant colonies were isolated, indicating that they carried the pDB121 plasmid (E3 and E7). (a) The plasmids from E3 and E7 were purified and retransformed in RN4220 or RNK electrocompetent cells and plated on TSA-chloramphenicol. While a control pDB121::aph plasmid did not yield any colonies when transformed in RNK, plasmids prepared from E3 and E7 could be efficiently transformed, indicating that the CRISPR system was no longer functional. (b) PCR amplification of the Cas9 region with primers B113 and W270 on pDB121::aph (control, C) and the E3 and E7 escapers, showing a deletion of the whole region. The expected size of the control is 7,137bp. (c) In order to assess the integrity of the target, the survivor colonies were streaked on a HIA containing 5 mM CaCl2 plate and a drop of pDB121::aph phagemid was added on top. Clearance indicates that the isolated colonies are still sensitive; hence the target is still intact.
Nature Biotechnology: doi:10.1038/nbt.3043

Supplementary Figure 4. Determination of GFP fluorescence as a measure of cell growth after phagemid or antibiotic treatment. (a) Flow cytometry of cells shown in Fig. 1d either before, without or with different treatments. Y-axis, GFP fluorescence in absolute units); X-axis, number of cells. (b) Same as Fig. 1d but using a monoculture of RNK cells.
Nature Biotechnology: doi:10.1038/nbt.3043
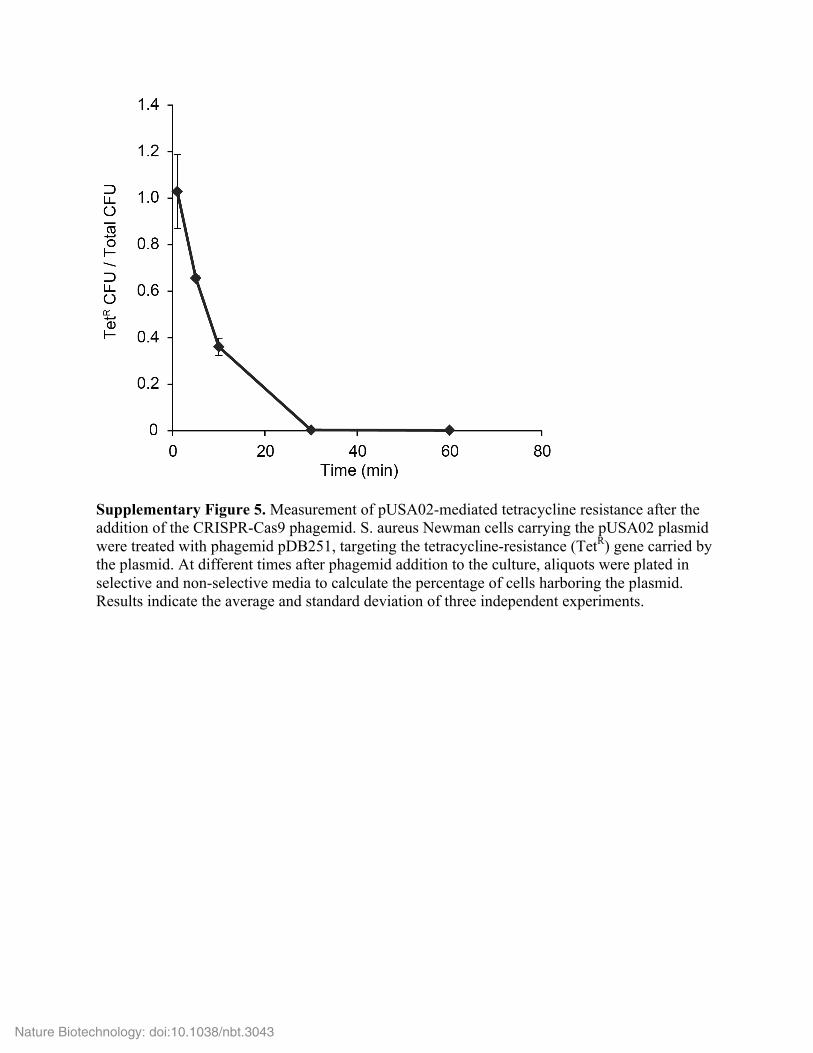
Supplementary Figure 5. Measurement of pUSA02-mediated tetracycline resistance after the addition of the CRISPR-Cas9 phagemid. S. aureus Newman cells carrying the pUSA02 plasmid were treated with phagemid pDB251, targeting the tetracycline-resistance (TetR) gene carried by the plasmid. At different times after phagemid addition to the culture, aliquots were plated in selective and non-selective media to calculate the percentage of cells harboring the plasmid. Results indicate the average and standard deviation of three independent experiments.
Nature Biotechnology: doi:10.1038/nbt.3043
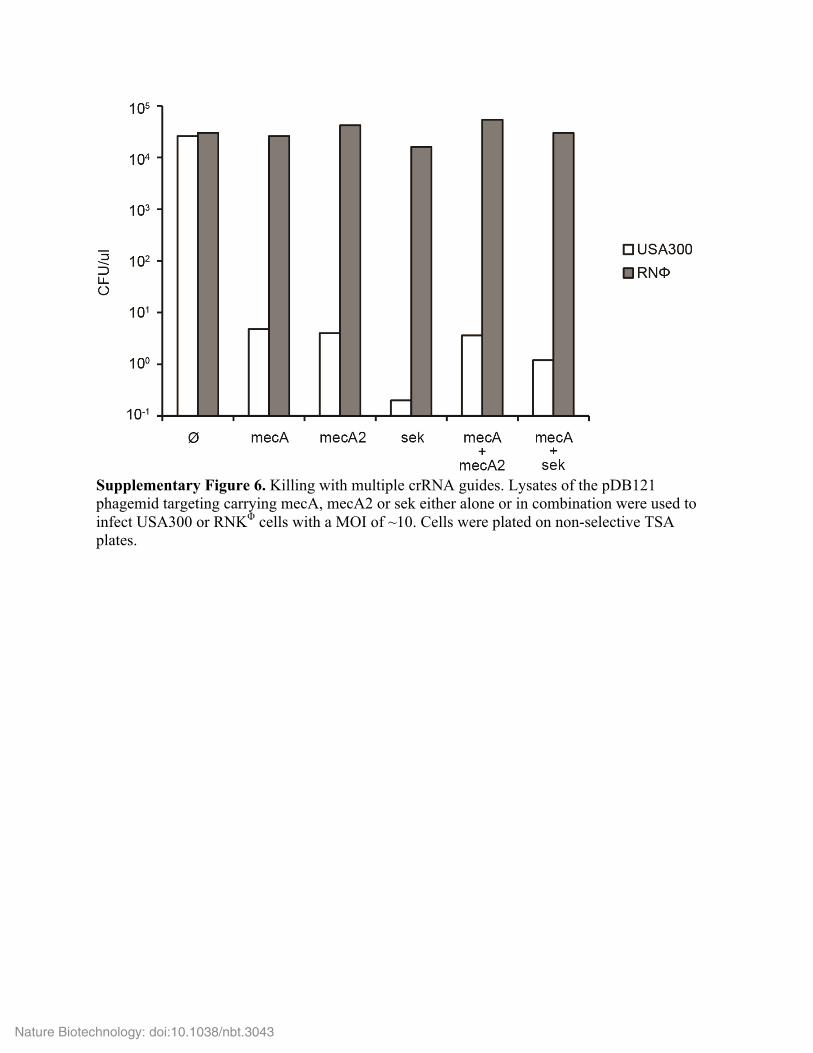
Supplementary Figure 6. Killing with multiple crRNA guides. Lysates of the pDB121 phagemid targeting carrying mecA, mecA2 or sek either alone or in combination were used to infect USA300 or RNKΦ cells with a MOI of ~10. Cells were plated on non-selective TSA plates.
Nature Biotechnology: doi:10.1038/nbt.3043

Supplementary Tables Supplementary Table 1. Cfu counts of data represented in Fig. 3b (three independent experiments were performed for each treatment: 1-3).
PBS Mouse # GFP CFU
TOTAL CFU GFP%
1 17 4.50E+05 1.05E+06 42.86
18 6.50E+06 1.50E+07 43.33
19 4.50E+07 1.05E+08 42.86
20 1.00E+05 3.50E+05 28.57
2 24 8.00E+03 2.15E+04 37.21
25 1.50E+04 5.00E+04 30.00
26 5.00E+06 2.40E+07 20.83
27 2.00E+05 9.00E+05 22.22
28 6.50E+06 1.50E+07 43.33
3 20 1.50E+05 4.00E+05 37.50
21 5.00E+04 3.00E+05 16.67
22 2.00E+05 6.50E+05 30.77
23 2.00E+04 9.50E+04 21.05
24 5.00E+05 2.50E+06 20.00
25 1.00E+04 2.50E+04 40.00
Mean 4.31E+06 1.10E+07 31.81 SD 1.15E+07 2.70E+07 9.82
ΦNM1 Mouse # GFP CFU
TOTAL CFU GFP%
1 11 2.50E+06 9.00E+06 27.78
12 9.00E+06 2.00E+07 45.00
13 1.20E+07 2.95E+07 40.68
14 2.50E+06 6.00E+06 41.67
15 1.50E+06 6.00E+06 25.00
16 5.00E+05 2.50E+06 20.00 2 19 4.00E+06 9.50E+06 42.11
20 5.00E+05 3.00E+06 16.67
21 1.00E+05 3.00E+05 33.33
22 1.40E+07 3.00E+07 46.67
23 3.50E+06 1.90E+07 18.42 3 14 2.00E+05 4.50E+05 44.44
16 3.50E+04 7.50E+04 46.67
17 4.00E+04 1.90E+05 21.05
18 1.50E+03 5.00E+03 30.00
19 1.50E+04 5.00E+04 30.00
Mean 3.15E+06 8.47E+06 33.09 SD 4.52E+06 1.05E+07 10.85
DB121::aph Mouse # GFP CFU
TOTAL CFU GFP%
1 1 5.00E+05 7.00E+06 7.14
2 2.00E+05 1.50E+06 13.33
3 2.00E+05 1.90E+06 10.53
4 5.00E+04 1.00E+06 5.00
5 2.50E+06 2.00E+07 12.50 2 1 5.00E+04 1.40E+06 3.57
Nature Biotechnology: doi:10.1038/nbt.3043

2 2.00E+05 1.05E+06 19.05
3 2.00E+04 1.05E+05 19.05
4 5.00E+06 2.70E+07 18.52
5 5.00E+04 9.00E+05 5.56
6 1.50E+04 1.05E+05 14.29 3 1 5.00E+05 6.50E+06 7.69
3 5.00E+05 9.00E+06 5.56
4 1.00E+06 5.50E+06 18.18
Mean 7.70E+05 5.93E+06 11.43 SD 1.38E+06 8.09E+06 5.75
Mupirocin Mouse # GFP CFU
TOTAL CFU GFP%
1 6 2.00E+05 4.50E+05 44.44
7 2.00E+04 8.00E+04 25.00
8 3.00E+04 9.50E+04 31.58
9 1.00E+03 4.00E+03 25.00
10 <500 <500
2 7 <500 <500
8 5.00E+03 2.00E+04 25.00
9 2.00E+06 1.15E+07 17.39
10 <500 <500
11 <500 <500 3 8 <500 <500
9 2.00E+03 6.50E+03 30.77
10 1.50E+03 5.00E+03 30.00
11 1.50E+04 3.00E+04 50.00
12 4.50E+04 8.00E+04 56.25
13 <500 <500
Mean* 2.32E+05 1.23E+06 33.54 SD* 6.24E+05 3.61E+06 12.51 * Mean and StDev calculated using only values above the limit of detection of the assay (500 cfus)
Nature Biotechnology: doi:10.1038/nbt.3043
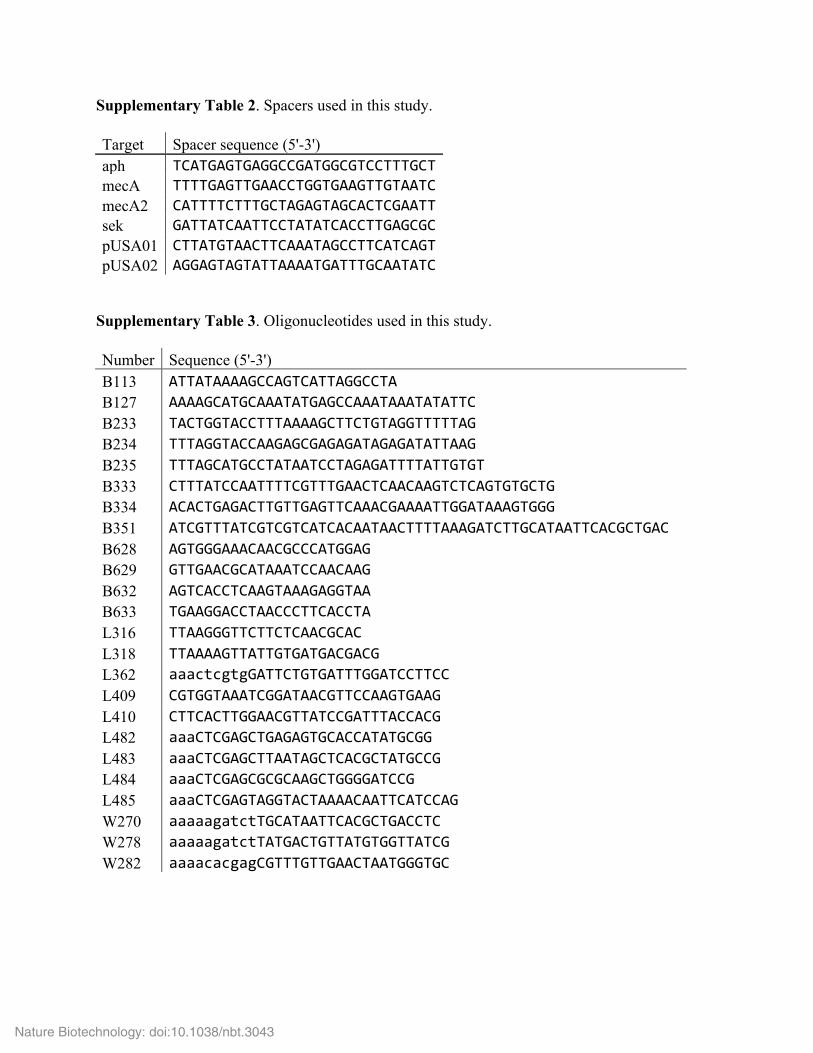
Supplementary Table 2. Spacers used in this study. Target Spacer sequence (5'-3') aph TCATGAGTGAGGCCGATGGCGTCCTTTGCT mecA TTTTGAGTTGAACCTGGTGAAGTTGTAATC mecA2 CATTTTCTTTGCTAGAGTAGCACTCGAATT sek GATTATCAATTCCTATATCACCTTGAGCGC pUSA01 CTTATGTAACTTCAAATAGCCTTCATCAGT pUSA02 AGGAGTAGTATTAAAATGATTTGCAATATC
Supplementary Table 3. Oligonucleotides used in this study. Number Sequence (5'-3') B113 ATTATAAAAGCCAGTCATTAGGCCTA B127 AAAAGCATGCAAATATGAGCCAAATAAATATATTC B233 TACTGGTACCTTTAAAAGCTTCTGTAGGTTTTTAG B234 TTTAGGTACCAAGAGCGAGAGATAGAGATATTAAG B235 TTTAGCATGCCTATAATCCTAGAGATTTTATTGTGT B333 CTTTATCCAATTTTCGTTTGAACTCAACAAGTCTCAGTGTGCTG B334 ACACTGAGACTTGTTGAGTTCAAACGAAAATTGGATAAAGTGGG B351 ATCGTTTATCGTCGTCATCACAATAACTTTTAAAGATCTTGCATAATTCACGCTGAC B628 AGTGGGAAACAACGCCCATGGAG B629 GTTGAACGCATAAATCCAACAAG B632 AGTCACCTCAAGTAAAGAGGTAA B633 TGAAGGACCTAACCCTTCACCTA L316 TTAAGGGTTCTTCTCAACGCAC L318 TTAAAAGTTATTGTGATGACGACG L362 aaactcgtgGATTCTGTGATTTGGATCCTTCC L409 CGTGGTAAATCGGATAACGTTCCAAGTGAAG L410 CTTCACTTGGAACGTTATCCGATTTACCACG L482 aaaCTCGAGCTGAGAGTGCACCATATGCGG L483 aaaCTCGAGCTTAATAGCTCACGCTATGCCG L484 aaaCTCGAGCGCGCAAGCTGGGGATCCG L485 aaaCTCGAGTAGGTACTAAAACAATTCATCCAG W270 aaaaagatctTGCATAATTCACGCTGACCTC W278 aaaaagatctTATGACTGTTATGTGGTTATCG W282 aaaacacgagCGTTTGTTGAACTAATGGGTGC
Nature Biotechnology: doi:10.1038/nbt.3043

![[Supplementary materials]](https://static.fdocuments.net/doc/165x107/56816583550346895dd82b8a/supplementary-materials-56cd0e37cc26b.jpg)