Supplementary Materials for -...
22
www.sciencemag.org/cgi/content/full/340/6128/52/DC1 Supplementary Materials for Broadband 2D Electronic Spectroscopy Reveals a Carotenoid Dark State in Purple Bacteria Evgeny E. Ostroumov, Rachel M. Mulvaney, Richard J. Cogdell, Gregory D. Scholes* *Corresponding author. E-mail: [email protected] Published 5 April 2013, Science 340, 52 (2013) DOI: 10.1126/science.1230106 This PDF file includes: Materials and Methods Assignment of 2DEAS Peaks Figs. S1 to S13 Captions for Movies S1 to S4 References (39–47) Other Supplementary Material for this manuscript includes the following: (available at www.sciencemag.org/cgi/content/full/340/6128/52/DC1) Movies S1 to S4
Transcript of Supplementary Materials for -...

www.sciencemag.org/cgi/content/full/340/6128/52/DC1
Supplementary Materials for
Broadband 2D Electronic Spectroscopy Reveals a Carotenoid Dark State in Purple Bacteria
Evgeny E. Ostroumov, Rachel M. Mulvaney, Richard J. Cogdell, Gregory D. Scholes*
*Corresponding author. E-mail: [email protected]
Published 5 April 2013, Science 340, 52 (2013) DOI: 10.1126/science.1230106
This PDF file includes:
Materials and Methods Assignment of 2DEAS Peaks Figs. S1 to S13 Captions for Movies S1 to S4 References (39–47)
Other Supplementary Material for this manuscript includes the following: (available at www.sciencemag.org/cgi/content/full/340/6128/52/DC1)
Movies S1 to S4

2
Materials and Methods
Sample preparations
The LH2 complexes from Rhodopseudomonas (Rps.) acidophia 10050 and
Rhodobacter (Rba.) sphaeroides 2.4.1 were prepared as previously described (39, 40).
The rhodopin glucoside and spheroidene carotenoids were isolated from anaerobically
grown cells of wild type strains of Rps. acidophila 10050 and Rba. sphaeroides 2.4.1,
respectively. The carotenoids were isolated using acetone extraction and petroleum ether
partitioning. The isolated spheroidene was further purified by alumina column
chromatography using 1% – 15% diethyl ether in petroleum ether. The purified samples
were stored in acetone at 4oC. For 2D measurements the LH2 complexes from Rps.
acidophila and Rba. sphaeroides were dissolved to a final concentration of 0.3 OD/mm,
contained 0.1% LDAO to prevent aggregation. Measurements were taken in a 1 mm flow
cell. The spheroidene and rhodopin glucoside carotenoids were measured in acetone
solution at 1 OD/mm final concentration in the maximum of absorption. The higher
concentration was used since the excitation pulses covered only the far red shoulder of
the main absorption band and absorption within the excitation spectral region did not
exceed 0.2 OD. In order to confirm that no photo-degradation had occurred during the
measurements, the absorption spectra before and after the 2D experiments were
compared.
2D electronic spectroscopy
The 2DES setup is described in detail elsewhere (41). Briefly, a regenerative amplifier
(Spitfire, Spectra-Physics) seeded by Ti:sapphire oscillator generates 150 fs pulses at 800
nm. A home-built NOPA converts the 10 mJ pump pulses into 10 mW broad-bandwidth
pulses (<70 nm FWHM) which are than compressed to 13 fs. The typical frequency-
resolved optical gating (FROG) map of the excitation pulse is shown in Fig. S1. A
diffractive optic splits the compressed pulse into four beams arranged in a box geometry
so that the signal is emitted in the background free direction. The emitted signal is
heterodyne detected by the spectrograph (Shamrock, Andor). The time axis t1 (coherence
time) is scanned from -60 to 60 fs (negative time range corresponds to non-rephasing
signal, positive to the rephasing signal), a Fourier transform along t1 yields the excitation
frequency axis (reported in wavelength). The dynamics of the absorptive 2D signal are
monitored as a function of t2 delays (waiting time). Several different t2 time ranges and
steps have been used in measurements of each sample in order to exclude artifact signals
and confirm repeatability of the results. Following t2 times were used in presented data:
0–400 fs with 5 fs step in Fig. 2A, 3C-D, S5-8, S11, Movie S1-2 and S4; 0–200 fs with 1
fs step in Fig. 2B, 3, S9A; 0–400 fs with 2 fs step in Fig. 3A-B and Movie S3. The
phasing of the 2D spectra has been performed using the projection-slice theorem (42, 43),
with the pump-probe spectra measured under the same experimental conditions right after
the 2D experiment. In presented figures the 2D spectra were generated in Matlab using
specially generated color map in order to emphasize signals of interest and diminish
noise. In the movies the 2D spectra were generated in Matlab using a default color map
with no noise filtering.

3
Fig. S1. FROG map of excitation pulses used to collect data shown in Fig. 2B, S7–8 and
Movie S2. Spectral and temporal profiles are shown to the right and below the plot. Fit of
the profiles to a single Gaussian function is shown by red line.
Global analysis
Global analysis was performed using home-written Matlab code (MATLAB R2011a,
The Mathworks). The procedure of the non-linear fitting algorithm was based on the
Runge-Kutta method and included a separate fit of the oscillatory contribution and kinetic
relaxation decay. For fitting of the oscillatory contribution, the frequency spectrum was
generated by simulating the Fourier spectrum (Fig. S9B) with Gaussian functions and
wavelength-dependent phase factors. This simulated spectrum was transformed into the
time-domain and used within the fitting algorithm to extract pure kinetic contributions.
The principles of the global analysis applied kinetic data without oscillations can be
found in the following reviews (24, 25). In the present work several kinetic schemes were
tested: the lifetime scheme, the evolutionary scheme and the branching scheme. Each of
these schemes resulted in a good fit quality, however only one kinetic scheme describes
the actual dynamics, while other schemes are merely an alternative mathematical
solution. In order to find the kinetic scheme that provides the best overall description of
the data, first some preliminary information has to be obtained using the lifetime analysis.
By increasing the number of lifetimes and evaluating the quality of the fit, the number of
interconverting species can be estimated. The decay-associated spectra (DAS, which are
pre-exponential amplitudes at different wavelengths) can often give a good first estimate
for energy transfer processes (25). In order to find the actual SAS (species-associated
spectra) and excited state dynamics, different kinetic schemes have to be tested using the
preliminary information from lifetime analysis as well as auxiliary information from
other resources (transient absorption/fluorescence studies etc.). Since the quality of the fit
appears the same for all schemes (they are linear combination of each other and,
therefore, mathematically indistinguishable), the judgment of the optimal kinetic scheme

4
has to be made by the consistency of SAS spectral features, rate values and the scheme
pathways with complementary information about the studied system (25). This
information includes time constants obtained by alternative time-resolved methods,
spectra of isolated chromophores, electronic structure estimated from theoretical
calculations etc. Of particular importance are the SAS, which should show clear well-
resolved peaks consistent with the spectral properties of the chromophores (see (44)).
During analysis, first the time evolution of species populations is calculated using a
kinetic scheme. During the second step, the calculated population evolution is convoluted
with the instrument response function, estimated from the cross-correlation profile of the
laser pulses (Fig. S1). Data points over the first 15 fs of population time were excluded
from the fitting process because during the pulse overlap multiple pathways are allowed
and simulation of the resulting signal in 2D spectroscopy is not possible. In order to avoid
local minima in the solution space, the fitting procedure was repeated several times
(N>30) with various starting values of the system parameters. Different numbers of
species were tested for the fitting model. The scheme with four species resulted in both
meaningful spectra and good fit quality.
Assignment of spectral features
In Fig. S2-S4 all identified features are marked in accordance with assigned state(s).
Each diagonal feature (GSB) is designated by a single symbol, while off-diagonal
features are marked by two symbols. The first symbol denotes the locally excited state,
and the second symbol denotes the acceptor state. The signals in the 2DEAS can be
separated into several contributions: (i) Positive diagonal peaks, which represent GSB
signals (Fig. S13, R1 pathway) and stimulated emission (SE) from the locally excited
states (Fig. S13, R3 pathway), (ii) Positive cross-peaks, which represent GSB via
common ground state (Fig. S13, R2 pathway) and SE following the energy transfer from
the locally excited states (Fig. S13, R4 pathway), (iii) Negative peaks, which are due to
ESA signals, originated from the locally excited states (Fig. S13, R5 pathway), or from S1
state, which is populated from the locally excited states (Fig. S13, R6 pathway).
Lifetime analysis (parallel kinetic scheme)
The 2DDAS (2D decay-associated spectra), obtained in this work for LH2
complexes of Rps. acidophila, are shown in Fig. S2. Four lifetime components were
necessary to obtain a good fit, while larger number of lifetimes did not improve the fit
significantly. The values of the 66 fs and 398 fs lifetimes are in good agreement with the
values reported from transient absorption studies of LH2 complexes from Rps. acidophila
(11, 28, 29). The other two lifetimes have not been reported previously. The 2DDAS-1
reveals two weak diagonal signals at 530 nm and 560 nm, which are attributed to
GSB/SE from S2 and X states respectively. The strong off-diagonal positive peak at
530/560 nm excitation/detection wavelengths is due to S2-to-X energy transfer and/or
GSB via common ground state. The negative signal at 585 nm detection wavelength
might indicate the rise of the signal from Qx state populated from both S2 and X states, as
follows from elongation of the signal between 530-560 nm excitation wavelengths. The
5
2DDAS-2 and 3 have features similar to each other, but have opposite sign. This effect is
indicative of strong mixing among the spectral components in 2DDAS-2 and 3 and, as a
result, their spectral features do not correspond to any particular physical state. For that
reason interpretation of 2DDAS-2 and 3 is not possible. The 2DDAS-4 shows a positive
diagonal signal at 540 nm, caused by GSB from S2 state, and negative signal arising from
S1 ESA, with typical elongation along the detection wavelength scale. The ESA signal is
observed at both 530 nm and 560 nm excitation wavelengths due to S2-to-S1 and X-to-S1
energy transfer, respectively. In conclusion, the lifetime analysis revealed four species
with relaxation time constants of approximately 30 fs, 70 fs, 150 fs and 400 fs.
Fig. S2. 2D decay-associated spectra (2DDAS) of Rps. acidophila and corresponding
population dynamics. The parallel kinetic scheme and lifetimes are shown to the right of
the population dynamics plot.

6
Evolutionary analysis (sequential kinetic scheme)
Using the time constants from lifetime analysis we applied an evolutionary kinetic
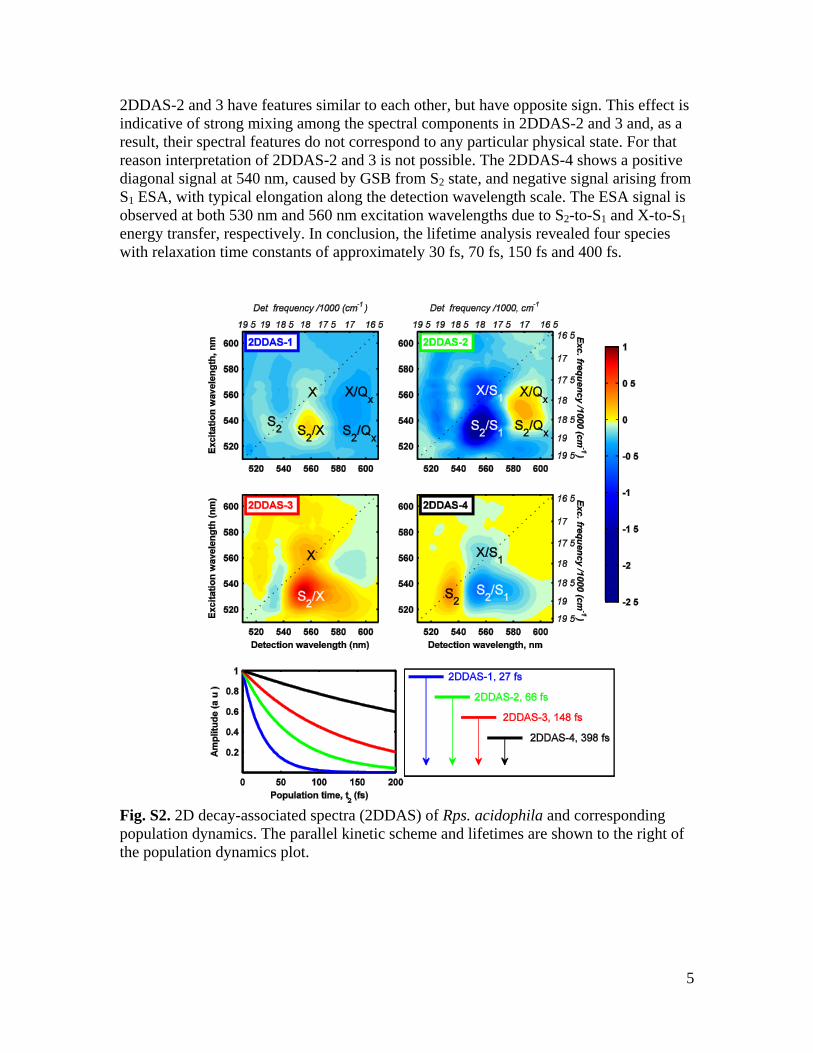
scheme to reveal spectral profiles of the sequential species. The 2DEAS (2D
evolutionary-associated spectra) are shown in Fig. S3. The first spectrum (2DEAS-1, Fig.
S3) reveals three diagonal contributions: a strong peak at 530 nm, and two weak peaks at
560 nm and 585 nm. These diagonal features are due to GSB/SE signals from the Car S2,
X and BChl Qx states, respectively. Since GSB represents depopulation of the ground
state, these diagonal features are present in all 2DEAS-1-4, but are not visible in 2DEAS-
2 and 4 because of overlap with negative ESA signal. The strong S2/X cross-peak results
from ultrafast S2 X energy transfer and consists of three contributions: (i) X SE, and (ii)
GSB signal arising from S2/X pathway via common ground state. The Qx/X cross-peak is
unlikely to originate from up-hill energy transfer and is more likely due to the GSB signal
arising from mixed excitation of coupled BChl Qx and Car X states. However, this feature
has to be studied in more detail for a clearer interpretation. The origin of the negative
signal below the diagonal (at 540–570 nm excitation and 570–600 nm detection
wavelengths) is uncertain, and can be due to ESA from S2 and X states. The S2 ESA
signal has been reported previously (45, 46); however the detailed properties of that
signal are still unknown. The global analysis revealed a 48 ps-1
rate constant (~21 fs, see
Fig. S3) for the 2DEAS-1 component.
The 2DEAS-2 (Fig. S3) has two diagonal peaks at 530 nm and 590 nm, which
correspond to the GSB signals from Car S2 and BChl Qx states, respectively. The positive
S2/Qx cross-peak is due to S2 Qx energy transfer, followed by Qx SE. This peak shows
slight elongation to shorter detection wavelength, which suggests the presence of a S2 X
energy transfer cross-peak hidden beneath the strong negative signal. The positive X/Qx
cross-peak is due to X Qx energy transfer, followed by Qx SE. The strong negative S2/S1
signal is due to S2 S1 energy transfer followed by S1 ESA. Similarly, the negative
diagonal X/S1 signal is due to X S1 energy transfer followed by S1 ESA. Notably, the
X/S1 signal is overlapped with GSB from the X state, and, because of its stronger
transition dipole moment, the S1 ESA signal obscures the bleach signal completely. The
Qx /X cross-peak in 2DEAS-2 is assigned to the same signal as in 2DEAS-1. The decay
rate of this spectrum is found to be 16 ps-1
(~62 fs).
The 2DEAS-3 (Fig. S3) has a simple profile. The three diagonal peaks at 530 nm,
560 nm and 585 nm are assigned to GSB signals from Car S2, X and BChl Qx states,
respectively. The broad negative S2/S1 peak is due S2 S1 energy transfer followed by S1
ESA. The decay rate of this spectrum is 8 ps-1
(~125 fs).
The 2DEAS-4 (Fig. S3) has two diagonal peaks at 530 nm and 585 nm, originating
from Car S2 and BChl Qx states, respectively. The positive X/Qx cross-peak is due to
X Qx energy transfer, followed by Qx SE. Three negative signals in 2DEAS-4 are due to
ESA from the S1 state, populated from S2, X, and Qx states. The overall profile of the
2DEAS-4 is very similar to the raw 2D spectra of isolated rhodopin glucoside (Fig. 3C-
D), if the contribution from the BChl Qx state were eliminated. This is a valuable
confirmation that the 560 nm diagonal feature is due to carotenoid, not
bacteriochlorophyll. The decay rate of this spectrum is 2.6 ps-1
(~385 fs), which is very
close to the hot-S1 state lifetime, well-known from TA studies (11, 29).
7
Fig. S3. 2D evolutionary-associated spectra (2DEAS) of Rps. acidophila and
corresponding population dynamics. The sequential kinetic scheme and rates are shown
to the right of the population dynamics plot. This figure is a replica of Fig.4 in the main
text.
The 2DEAS 1–3 reveal ultrafast decay rates. Previously reported fluorescence up-
conversion and transient absorption (TA) studies of carotenoids/light-harvesting
complexes with excitation to Car S2 state found only one ultrashort lifetime component
on the timescale of 60–70 fs (11, 28, 29). This lifetime is ascribed in the literature to the
S2 SE and GSB signals. We explain the observation of three ultrafast components in the
current work by the better temporal resolution attained using 13 fs broad-band excitation
pulses, as well as by excitation wavelength resolution gained from Fourier transform 2D
spectroscopy. 2DEAS-1 is mostly due to GSB and SE from S2 and X states, revealing S2-
to-X energy transfer. The 2DEAS-2 combines both ESA from the S1 state and SE from
the Qx state, showing that BChl Qx state is populated from both S2 and X states, while
Car S1 state is populated from Car S2, X and BChl Qx states. The ESA signal most

8
probably arises from a higher lying vibrational level of S1 (S1,v). Similarly the ESA in
2DEAS-3 is due to the same or another vibrational level of S1 (S1,v). Whether these S1,v
vibrational levels are different or the same level, which mixes into both 2DEAS, cannot
be determined at present and further studies are necessary to answer that question.
Branching kinetic scheme
From the evolutionary analysis it follows that several parallel relaxation pathways
are active in the LH2 proteins we have studied. The S2 state populates the X state, S1 state
and Qx state. The X state populates both S1 state and Qx state. Finally, the Qx state
populates the S1 state. In addition, all of these states can have alternative relaxation
pathways to states not visible in our experiment (e.g. the Qy state of bacteriochlorophyll).
Evolutionary analysis also revealed that the S2 and X states are not time-resolved in our
experiment and are represented by single compartment. A complex branching kinetic
scheme results from these findings, shown in Fig. S4, together with the corresponding
2DSAS (2D species-associated spectra). The 2DSAS1-3 have similar spectral features,
but of opposite sign, not too different from 2DDAS obtained by lifetime analysis (see Fig
S2). Only the 2DSAS-4 reveals a profile with distinctive features which can be assigned
to physical states of the system. In fact, 2DSAS-4 is very similar to 2DDAS-4 and
2DEAS-4 (Figs. S2 and S3). The likeness of the fourth spectrum among all models is
probably due to the weak mixing of the spectrum of the slowest physical state with
spectra of other physical states. In other words, the component with slowest time constant
dominates in the fourth species independently of the scheme in use, while the other three
components can show significant mixing in species 1-3 depending on the kinetic scheme.
In the current work it was found that the evolutionary kinetic scheme produced the
most meaningful spectra, i.e. only the 2DEAS features can be easily identified while
lifetime analysis and branching scheme analysis failed to produce resolved spectral
features. However, the 2DEAS in this work (Fig. 4 and S3) as well as several
independent TA studies (10, 19, 47) have shown that several branching energy transfer
pathways are present in LH2 proteins. Therefore the evolutionary scheme does not
represent the actual energy transfer scheme. Nevertheless by arrangement of the species
in the order of their relaxation rates the evolutionary scheme reveals quantitative kinetic
parameters of the system and allows resolution of spectral features for physical states.
Moreover, according to the location of these spectral features (positive and negative
peaks) in the 2DEAS, it is possible to identify the key energy transfer pathways. It was
not possible to determine the actual kinetic scheme with branching energy transfer
pathways in the current work owing to imperfections of the data (presence of noise,
limited time-range, etc.) as well as indistinguishable temporal features of some of the
physical states. Owing to the high sensitivity of the 2DSAS profile on the parameters of
the model as well as particular pathways within the branching kinetic scheme, the
demand for the quality of the experimental data is very high.

9
Fig. S4. 2D species-associated spectra (2DSAS) of Rps. acidophila and corresponding
population dynamics obtained using scheme, shown on the bottom right hand side.
Arrows in the kinetic scheme indicate relaxation pathways. Corresponding rates are
shown in ps-1
. The resulted lifetimes are: 37 fs, 63 fs, 125 fs, 385 fs. Ratio of initial
population at t2=0 in species 1 and 2 was 1:0.7.

10
Fig. S5. 2D spectra of Rba. sphaeroides measured in 0–400 fs range with 5 fs step. The t2 times
of each spectrum are shown in the top. These data are not a replica of the data plotted if Fig. 2A,
but represent a separate measurement taken at identical excitation conditions.

11
Fig. S6. 2D spectra of Rba. sphaeroides measured in 0–400 fs range with 5 fs step. Replica of
data plotted in Fig. S5 but in contour representation.
12
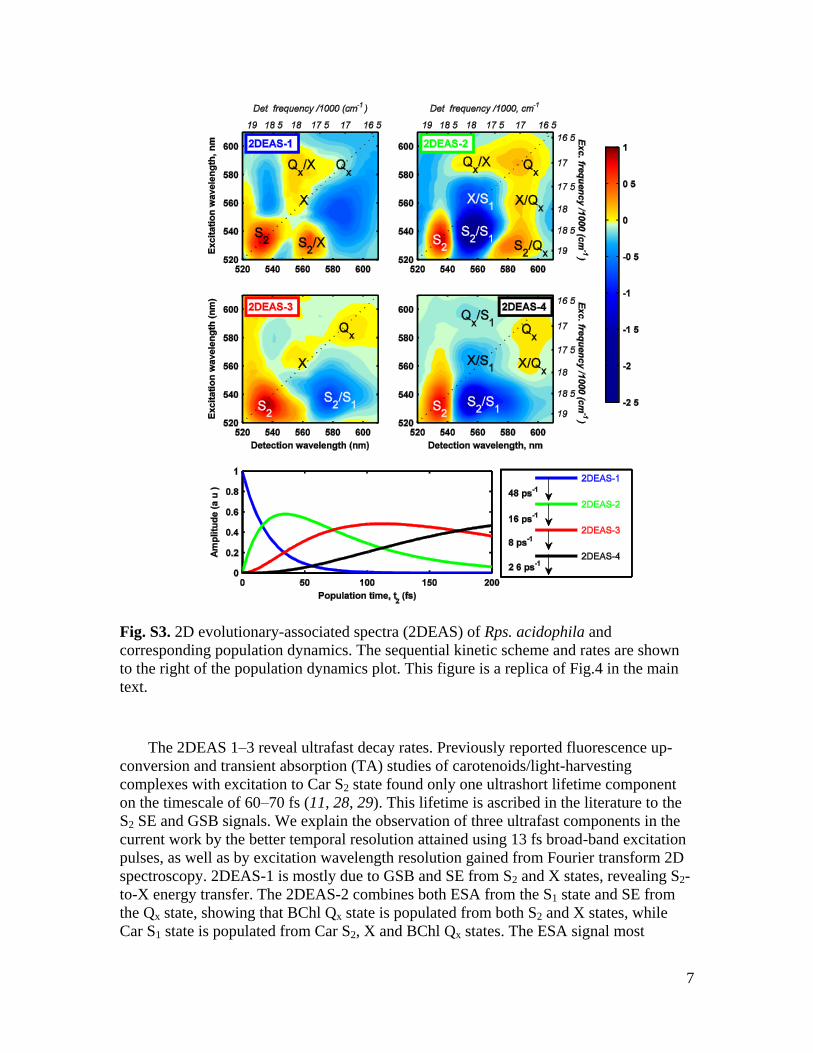
Fig. S7. 2D spectra of Rps. acidophila measured in 0–400 fs range with 5 fs step. The t2 times of
each spectrum are shown in the top. These data are not a replica of the data plotted if Fig. 2B, but
represent a separate measurement taken at identical excitation conditions.

13
Fig. S8. 2D spectra of Rps. acidophila measured in 0–400 fs range with 5 fs step. Replica of data
plotted in Fig. S7 but in contour representation.

14
Fig. S9. (A) Time traces of Rps. acidophila (measured at 0–200 fs, 1 fs step). (B) Fourier spectra
of Rps. acidophila corresponding to time traces in (A). Blue solid line show the time trace at S2
diagonal peak ( exc= em=530 nm), red dashed line – the time trace at X diagonal peak
( exc= em=560 nm), green dash-dotted line – the time trace at Qx diagonal peak ( exc= em=585
nm). For peak positions see Fig. 2B. The Fourier spectra are normalized to the amplitude at 1590
cm-1. The time traces represent raw data. Prior to Fourier analysis the exponentially decaying
term was extracted from these time traces.
Fig. S10. (A) Rephasing, (B) non-rephasing and (C) absorptive 2D spectra of Fourier transformed
data of Rps. acidophila (from Fig. 2B of the manuscript) along t2 scale, integrated over 1000-
1700 cm-1 frequency range. The Fourier transformation has been applied after extraction of the
exponential term.

15
Fig. S11. (A) Time traces of Rba. sphaeroides (measured at t2=0–400 fs, 5 fs step). (B) Fourier
spectra of Rba. sphaeroides corresponding to time traces in (A). Blue solid line show the time
trace at S2 diagonal peak, red dotted line – the time trace at X diagonal peak, green dashed line –
the time trace at Qx diagonal peak. For peak positions see Fig. 2A. The Fourier spectra are
normalized to the amplitude at 1590 cm-1. The time traces represent raw data. Prior to Fourier
analysis the exponentially decaying term was extracted from these time traces.

16
Fig. S12. Selected experimental time traces from Rps. acidophila data shown in Fig. 2B (blue,
green and black dotted lines) together with time traces obtained using evolutionary global
analysis (red solid lines). Data points of first 15 fs have been excluded from the analysis.
17
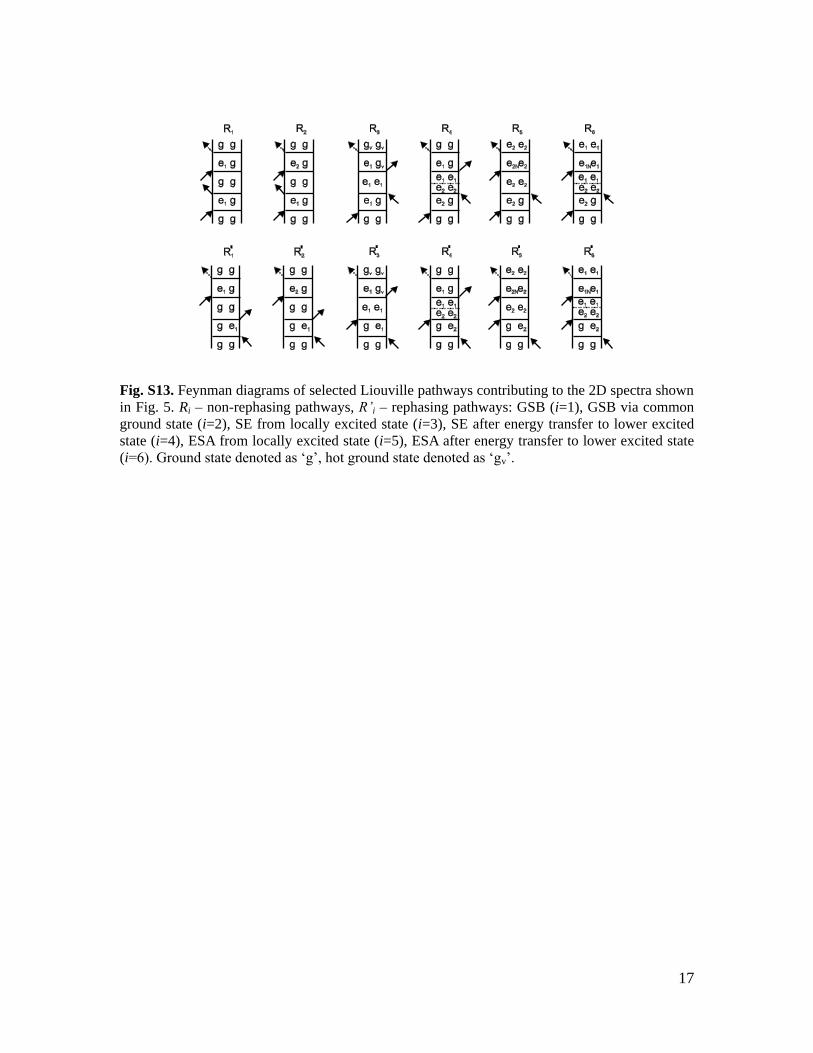
Fig. S13. Feynman diagrams of selected Liouville pathways contributing to the 2D spectra shown
in Fig. 5. Ri – non-rephasing pathways, R’i – rephasing pathways: GSB (i=1), GSB via common
ground state (i=2), SE from locally excited state (i=3), SE after energy transfer to lower excited
state (i=4), ESA from locally excited state (i=5), ESA after energy transfer to lower excited state
(i=6). Ground state denoted as ‘g’, hot ground state denoted as ‘gv’.

18
Movie S1
2D data of Rba. sphaeroides taken at t2 = 0–400 fs delay times with step 5 fs (replica of
data plotted in Fig. S5-6). The spectra were plotted in Matlab using the default color map
with no noise filtering.
Movie S2
2D data of Rps. acidophila taken at t2 = 0–400 fs delay times with step 5 fs (replica of
data plotted in Fig. S7-8). The spectra were plotted in Matlab using the default color map
with no noise filtering.
Movie S3
2D data of spheroidene in acetone taken at t2 = 0–400 fs delay times with step 2 fs
(replica of data plotted in Fig. 4A-B). The spectra were plotted in Matlab using the
default color map with no noise filtering.
Movie S4
2D data of rhodopin glucoside taken at t2 = 0–400 fs delay times with step 5 fs (replica of
data plotted in Fig. 4C-D). The spectra were plotted in Matlab using the default color
map with no noise filtering.
References and Notes 1. A. Telfer, A. Pascal, A. Gall, in Carotenoids, Vol 4: Natural Functions, G. Britton, S. Liaaen-
Jensen, H. Pfander, Eds. (Birkhauser-Verlag, Basel, Switzerland, 2008), pp. 265–308.
2. R. Hiller, in The Photochemistry of Carotenoids, H. A. Frank, A. J. Young, G. Britton, R. J. Cogdell, Eds. (Kluwer Academic, Dordrecht, Netherlands, 2004), vol. 8, pp. 81–98.
3. T. Polívka, H. A. Frank, Molecular factors controlling photosynthetic light harvesting by carotenoids. Acc. Chem. Res. 43, 1125 (2010). doi:10.1021/ar100030m Medline
4. T. Ritz, A. Damjanović, K. Schulten, J. P. Zhang, Y. Koyama, Efficient light harvesting through carotenoids. Photosynth. Res. 66, 125 (2000). doi:10.1023/A:1010750332320 Medline
5. P. Tavan, K. Schulten, Electronic excitations in finite and infinite polyenes. Phys. Rev. B 36, 4337 (1987). doi:10.1103/PhysRevB.36.4337 Medline
6. G. Cerullo et al., Photosynthetic light harvesting by carotenoids: Detection of an intermediate excited state. Science 298, 2395 (2002). doi:10.1126/science.1074685 Medline
7. W. Wohlleben et al., Pump-deplete-probe spectroscopy and the puzzle of carotenoid dark states. J. Chem. Phys. B 108, 3320 (2004). doi:10.1021/jp036145k
8. M. Yoshizawa, D. Kosumi, M. Komukai, H. Hashimoto, Ultrafast optical responses of three-level systems in b-carotene: Resonance to a high-lying n1Ag- excited state. Laser Phys. 16, 325 (2006). doi:10.1134/S1054660X06020204
9. B. P. Krueger, G. D. Scholes, R. Jimenez, G. R. Fleming, Electronic excitation transfer from carotenoid to bacteriochlorophyll in the purple bacterium Rhodopseudomonas acidophila. J. Phys. Chem. B 102, 2284 (1998). doi:10.1021/jp973062t
10. D. Polli et al., Carotenoid-bacteriochlorophyll energy transfer in LH2 complexes studied with 10-fs time resolution. Biophys. J. 90, 2486 (2006). doi:10.1529/biophysj.105.069286 Medline
11. H. Cong et al., Ultrafast time-resolved carotenoid to-bacteriochlorophyll energy transfer in LH2 complexes from photosynthetic bacteria. J. Phys. Chem. B 112, 10689 (2008). doi:10.1021/jp711946w Medline
12. T. Polívka, V. Sundström, Ultrafast dynamics of carotenoid excited states-from solution to natural and artificial systems. Chem. Rev. 104, 2021 (2004). doi:10.1021/cr020674n Medline
13. W. Wohlleben, T. Buckup, J. L. Herek, R. J. Cogdell, M. Motzkus, Multichannel carotenoid deactivation in photosynthetic light harvesting as identified by an evolutionary target analysis. Biophys. J. 85, 442 (2003). doi:10.1016/S0006-3495(03)74489-0 Medline
14. H. A. Frank, R. J. Cogdell, Carotenoids in photosynthesis. Photochem. Photobiol. 63, 257 (1996). doi:10.1111/j.1751-1097.1996.tb03022.x Medline
15. P. J. Walla, P. A. Linden, C.-P. Hsu, G. D. Scholes, G. R. Fleming, Femtosecond dynamics of the forbidden carotenoid S1 state in light-harvesting complexes of purple bacteria observed after two-photon excitation. Proc. Natl. Acad. Sci. U.S.A. 97, 10808 (2000). doi:10.1073/pnas.190230097 Medline

2
16. B. P. Krueger, G. D. Scholes, G. R. Fleming, Calculation of couplings and energy-transfer pathways between the pigments of LH2 by the ab initio transition density cube method. J. Phys. Chem. B 102, 5378 (1998). doi:10.1021/jp9811171
17. D. M. Jonas, Two-dimensional femtosecond spectroscopy. Annu. Rev. Phys. Chem. 54, 425 (2003). doi:10.1146/annurev.physchem.54.011002.103907 Medline
18. T. Brixner et al., Two-dimensional spectroscopy of electronic couplings in photosynthesis. Nature 434, 625 (2005). doi:10.1038/nature03429 Medline
19. D. Kosumi et al., Ultrafast energy-transfer pathway in a purple-bacterial photosynthetic core antenna, as revealed by femtosecond time-resolved spectroscopy. Angew. Chem. Int. Ed. Engl. 50, 1097 (2011). doi:10.1002/anie.201003771 Medline
20. D. Kosumi et al., Ultrafast excited state dynamics of monomeric bacteriochlorophyll a. Phys. Status Solidi C 8, 92 (2011). doi:10.1002/pssc.201000684
21. Information on materials and methods is available in the supplementary materials on Science Online.
22. B. Robert, Resonance Raman spectroscopy. Photosynth. Res. 101, 147 (2009). doi:10.1007/s11120-009-9440-4 Medline
23. G. Chumanov, R. Picorel, I. Ortiz de Zarate, T. M. Cotton, M. Seibert, Resonance Raman and surface-enhanced resonance Raman spectra of LH2 antenna complex from Rhodobacter sphaeroides and Ectothiorhodospira sp. excited in the Qx and Qy transitions. Photochem. Photobiol. 71, 589 (2000). doi:10.1562/0031-8655(2000)071<0589:RRASER>2.0.CO;2 Medline
24. I. H. M. van Stokkum, D. S. Larsen, R. van Grondelle, Global and target analysis of time-resolved spectra. Biochim. Biophys. Acta 1657, 82 (2004). doi:10.1016/j.bbabio.2004.04.011 Medline
25. A. R. Holzwarth, in Biophysical Techniques in Photosynthesis, J. Amesz, A. J. Hoff, Eds. (Kluwer Academic, Dordrecht, Netherlands, 1996), pp. 75–92.
26. M. Mameloot, N. Boens, R. Andriessen, V. Van Den Bergh, F. C. De Schryver, Compartmental analysis of fluorescence decay surfaces of excited-state processes. Methods Enzymol. 210, 314 (1992). doi:10.1016/0076-6879(92)10016-7
27. E. Ostroumov, M. G. Müller, C. M. Marian, M. Kleinschmidt, A. R. Holzwarth, Electronic coherence provides a direct proof for energy-level crossing in photoexcited lutein and β-carotene. Phys. Rev. Lett. 103, 108302 (2009). doi:10.1103/PhysRevLett.103.108302 Medline
28. D. Niedzwiedzki et al., Ultrafast dynamics and excited state spectra of open-chain carotenoids at room and low temperatures. J. Phys. Chem. B 111, 5984 (2007). doi:10.1021/jp070500f Medline
29. A. N. Macpherson, J. B. Arellano, N. J. Fraser, R. J. Cogdell, T. Gillbro, Efficient energy transfer from the carotenoid S(2) state in a photosynthetic light-harvesting complex. Biophys. J. 80, 923 (2001). doi:10.1016/S0006-3495(01)76071-7 Medline

3
30. H. A. Frank et al., Spectroscopic properties of spheroidene analogs having different extents of π-electron conjugation. J. Phys. Chem. A 101, 149 (1997). doi:10.1021/jp962373l
31. D. Kosumi, K. Yanagi, R. Fujii, H. Hashimoto, M. Yoshizawa, Conjugation length dependence of relaxation kinetics in b-carotene homologs probed by femtosecond Kerr-gate fluorescence spectroscopy. Chem. Phys. Lett. 425, 66 (2006). doi:10.1016/j.cplett.2006.05.023
32. M. Kleinschmidt, C. M. Marian, M. Waletzke, S. Grimme, Parallel multireference configuration interaction calculations on mini-beta-carotenes and beta-carotene. J. Chem. Phys. 130, 044708 (2009). doi:10.1063/1.3062842 Medline
33. G. Herzberg, E. Teller, Fluctuation structure of electron transfer in multiatomic molecules. Z. Phys. Chem. B 21, 410 (1933).
34. P. A. Geldof, R. P. H. Rettschnick, G. J. Hoytink, Vibronic coupling and radiative transitions. Chem. Phys. Lett. 10, 549 (1971). doi:10.1016/0009-2614(71)87035-5
35. D. S. McClure, Excited states of the naphthalene molecule. I. Symmetry properties of the first two excited singlet states. J. Chem. Phys. 22, 1668 (1954). doi:10.1063/1.1739870
36. J.-P. Zhang, T. Inaba, Y. Watanabe, Y. Koyama, Sub-picosecond time-resolved absorption spectroscopy of all-trans-neurosporene in solution and bound to the LH2 complex from Rhodobacter sphaeroides G1C. Chem. Phys. Lett. 331, 154 (2000). doi:10.1016/S0009-2614(00)01165-9
37. M. Maiuri et al., Solvent-dependent activation of intermediate excited states in the energy relaxation pathways of spheroidene. Phys. Chem. Chem. Phys. 14, 6312 (2012). doi:10.1039/c2cp23585d Medline
38. N. Christensson et al., Electronic double-quantum coherences and their impact on ultrafast spectroscopy: The example of b-carotene. J. Phys. Chem. Lett. 1, 3366 (2010). doi:10.1021/jz101409r
39. A. T. Gardiner, R. J. Cogdell, S. Takaichi, The effect of growth conditions on the light-harvesting apparatus in Rhodopseudomonas acidophila. Photosynth. Res. 38, 159 (1993). doi:10.1007/BF00146415
40. S. Scheuring et al., AFM characterization of tilt and intrinsic flexibility of Rhodobacter sphaeroides light harvesting complex 2 (LH2). J. Mol. Biol. 325, 569 (2003). doi:10.1016/S0022-2836(02)01241-X Medline
41. D. B. Turner, K. E. Wilk, P. M. G. Curmi, G. D. Scholes, Comparison of electronic and vibrational coherence measured by two-dimensional electronic spectroscopy. J. Phys. Chem. Lett. 2, 1904 (2011). doi:10.1021/jz200811p
42. J. D. Hybl, A. Albrecht Ferro, D. M. Jonas, Two-dimensional Fourier transform electronic spectroscopy. J. Chem. Phys. 115, 6606 (2001). doi:10.1063/1.1398579
43. M. Khalil, N. Demirdöven, A. Tokmakoff, Obtaining absorptive line shapes in two-dimensional infrared vibrational correlation spectra. Phys. Rev. Lett. 90, 047401 (2003). doi:10.1103/PhysRevLett.90.047401 Medline

4
44. M. G. Müller et al., Singlet energy dissipation in the photosystem II light-harvesting complex does not involve energy transfer to carotenoids. ChemPhysChem.. 11, 1289 (2010). doi:10.1002/cphc.200900852 Medline
45. T. R. Calhoun, J. Davis, M. W. Graham, G. R. Fleming, The separation of overlapping transitions in b-carotene with broadband 2D electronic spectroscopy. Chem. Phys. Lett. 523, 1 (2012). doi:10.1016/j.cplett.2011.10.051
46. N. Christensson et al., Two-dimensional electronic spectroscopy of beta-carotene. J. Phys. Chem. B 113, 16409 (2009). doi:10.1021/jp906604j Medline
47. S. Maruta et al., The dependence of excitation energy transfer pathways on conjugation length of carotenoids in purple bacterial photosynthetic antennae. Phys. Status Solidi (B) 248, 403 (2011). doi:10.1002/pssb.201000687