
Supplementary Information Unidirectional molecular motor ... · To a mixture of Oct4NBr (13 mg, 24...
36
S1 Supplementary Information Unidirectional molecular motor on a gold surface Richard A. van Delden, Matthijs K.J. ter Wiel, Michael M. Pollard, Javier Vicario, Nagatoshi Koumura, Ben L. Feringa* Department of Organic Chemistry, Stratingh Institute, University of Groningen, Nijenborgh 4, 9747 AG Groningen, The Netherlands. Section 1: Structural and photophysical characterization of 1 and 1-Au. Section 2: Structural and photophysical characterization of 2. Section 3: Experiments with cis-3 to confirm the unidirectionality of rotary motion of 2 in solution. Section 4: Experiments with cis-4-Au to confirm the unidirectionality of rotary motion on gold. Section 5: General remarks
Transcript of Supplementary Information Unidirectional molecular motor ... · To a mixture of Oct4NBr (13 mg, 24...

S1
Supplementary Information
Unidirectional molecular motor on a gold surface
Richard A. van Delden, Matthijs K.J. ter Wiel, Michael M. Pollard, Javier Vicario,
Nagatoshi Koumura, Ben L. Feringa*
Department of Organic Chemistry, Stratingh Institute, University of Groningen,
Nijenborgh 4, 9747 AG Groningen, The Netherlands.
Section 1: Structural and photophysical characterization of 1 and 1-Au.
Section 2: Structural and photophysical characterization of 2.
Section 3: Experiments with cis-3 to confirm the unidirectionality of rotary motion of 2 in solution. Section 4: Experiments with cis-4-Au to confirm the unidirectionality of rotary motion on gold. Section 5: General remarks

S2
Section 1: This section describes the characterization of molecular motors on gold
nanoparticles.
S
SOOC8H16C8H16SHSH
4,5-Bis[(8-sulfanyloctyl)oxy]-9-(2',3'-dihydro-2'-methyl-1'H-naphtho[2,1-
b]thiopyran-1'-ylidene)-9H-thioxanthene (1)
1H NMR (300 MHz, CDCl3) δ 0.74 (d, J = 7.0 Hz, 3H), 1.20-1.65 (m, 20H), 1.87-2.00
(m, 4H), 2.50-2.58 (m, 4H), 3.08 (dd, J = 11.4, 2.6 Hz, 1H), 3.72 (dd, J = 11.4, 7.3 Hz,
1H), 3.90-4.20 (m, 5H), 6.02 (dd, J = 7.7, 1.1 Hz, 1H), 6.26-6.36 (m, 2H), 6.83 (d, J =
7.7 Hz, 1H), 6.99 (m, 1H), 7.09 (m, 1H), 7.20 (d, J = 7.5 Hz, 1H), 7.29 (m, 1H), 7.34 (d,
J = 8.4 Hz, 1H), 7.53 (m, 3H).

S3
Figure 1: 400 MHz 1H NMR of 1. S
SOOC8H16C8H16SS
Au
(2'R)-(M)-1-Au: Meax
Motor protected gold colloids 1-Au
To a mixture of Oct4NBr (13 mg, 24 μmol) in toluene (1.6 ml) was added a solution of
HAuCl4·3 H2O (5.5 mg, 13.3 μmol) in water (0.6 ml) giving an orange solution which
was stirred for 5 min. Then was added the dithiol 1 (4.5 mg, 6.2 μmol) in a small amount
of toluene (0.5 ml). The mixture was stirred again for 5 min and then a solution of NaBH4
(5 mg, 0.13 mmol) was added immediately giving a black suspension. The reaction
mixture was stirred overnight and the organic layer washed with water (3x 2 ml). The

S4
toluene was then removed under reduced pressure and the colloids were dried vacuo. The
colloids were purified by dissolution in toluene (2 mL) and precipitation by the addition
of MeOH (30 mL). This material was filtered, and purified by gel permeation
chromatography (Sephadex LH-20, 5/1 CHCl3/MeOH) and concentrated in vacuo to give
pure gold colloids. 1H NMR of this material had only broad signals. UV-Vis: (toluene)
λmax(ε): 296 (28600), (20400), 351 (15200), 526 (3900); CD: (toluene) λmax(Δε): 283
(+91.0), 324 (-15.8), 359 (-19.6).) 296 (28600), (20400), 351 (15200), 526 (3900); CD:
(toluene) λmax(Δε): 283 (+91.0), 324 (-15.8), 359 (-19.6).
Figure 2: UV-Vis spectra of functionalised gold nanoparticles 1-Au (dashed black) in toluene (baseline: toluene), 1-Au (solid grey) in toluene (baseline: octanethiol functionalised gold nanoparticles in toluene) and methoxy-legged motor 2 (solid black). The UV of 1-Au with a very weak surface plasmon band around 520 nm, characteristic for Au colloids of these dimensions1.

S5
Figure 3: CD spectra of pure (2'R)-(M)-1 (solid), PSS≥ 280 nm (dashed), and PSS365 nm (dotted) in toluene solution. All spectra are adjusted for molar concentration of chromophores.
0.02.55.07.5
Figure 4: 400 MHz 1H NMR of 1-Au. This spectrum has only broad signals replacing the signals of unbound motor molecule 1, indicating that no free motor was present.

S6
Motor functionalised colloids 1-Au after irradiation and cleavage from the
nanoparticles.
Method: 1-Au (2 mg) in toluene (1.5 mL) was irradiated with at 280 or 365 nm light for 3
h. Etching of the gold nanoparticles was achieved by concentration of the mixture in
vacuo, redissolution in THF (0.5 mL) and addition of a solution of KCN in water (3 mL,
2 mg/mL). The broad UV/Vis absorption of the gold plasmon had disappeared
completely after 30 min. After this, the material was extracted with toluene (2 x 5 mL),
concentrated in vacuo, and analysed by 1H and 13C NMR.
5.0
7.92
07.
914
7.90
07.
897
7.89
27.
771
7.75
06.
549
6.53
26.
529
6.52
06.
499
6.34
46.
326
6.30
76.
226
6.20
56.
186
6.01
65.
996
5.97
7
0.91
50.
897
0.54
5
1.002.45
2.69
3.833.713.56
Figure 5: KCN mediated etching of the gold core of 1-Au after 3 h irradiation revealed motor 1 as its
unstable and stable isomers in a (2.5:1 ratio).

S7
6.006.507.007.508.00
7.92
07.
914
7.90
07.
897
7.89
2
7.77
17.
750
6.54
96.
532
6.52
96.
520
6.49
96.
344
6.32
66.
307
6.22
66.
205
6.18
6
6.01
6
1.00
2.54
3.70
4.95
4.604.29
Figure 6: Expansion of 400 MHz 1H NMR after irradiation of 1-Au, etching of the gold core leaving the motor free in solution, likely as a mixture of thiol and disulfide. Comparison of the integration of peaks at 7.76 (unstable isomer) and 7.91 (stable isomer) is 2.5 : 1.
Reflectance FT-IR, solid state Raman and Surface enhanced resonance Raman
spectroscopic characterisation of motor derivatised Au nanoparticles.
Spectroscopic marker bands of the motor’s alkyl ‘legs’ in the derivatised nanoparticles
were used to determine the mode of binding of the motor to the gold nanoparticles. The
low energy finger print region (Figure 7) of the modified nanoparticles both with
dodecanethiol and motor modification show strong alkane vibrational features at 803
cm-1, 1022 cm-1, 1094 cm-1 and 1260 cm-1. They confirm that in both cases long alkyl
chains are present in the modified nanoparticles. The strong aliphatic C-H vibrations
observed <3000 cm-1 support this assignment. By examination of the high energy

S8
fingerprint region of the IR spectra (Figure 8) it is clear that the aromatic C=C stretching
vibrations of the motor (1571/1558 cm-1) and the very weak C-H vibrations >3000 cm-1
(Figure 9) are present in the motor modified nanoparticles and are unaffected by the
modification suggesting non specific binding of the motor to the gold surface does not
occur (see Raman section below). The absence of these vibrational bands in the IR
spectrum of the dodecanethiol modified nanoparticles supports this assignment.
800 900 1000 1100 1200 1300
Wavenumber (cm-1)
Scaled to 1558 cm-1 band
1260
cm
-1
1094
cm
-1
1022
cm
-1
803
cm-1
800 900 1000 1100 1200 1300
Wavenumber (cm-1)
Scaled to 1558 cm-1 band
1260
cm
-1
1094
cm
-1
1022
cm
-1
803
cm-1
DODECANETHIOL-NANOPARTICLES
Motor Motor modified-NANOPARTICLES
DODECANETHIOL-NANOPARTICLES
Motor Motor modified-NANOPARTICLES
Figure 7: Overlay of low energy fingerprint region in FT-IR spectrum of motor, dodecanethiol modified nanoparticles and motor modified nanoparticles.

S9
1300 1350 1400 1450 1500 1550 1600 1650
Wavenumber (cm-1)
1558
cm
-115
71 c
m-1
1300 1350 1400 1450 1500 1550 1600 1650
Wavenumber (cm-1)
1558
cm
-115
71 c
m-1
DODECANETHIOL-NANOPARTICLES
Motor Motor modified-NANOPARTICLES
DODECANETHIOL-NANOPARTICLES
Motor Motor modified-NANOPARTICLES
Figure 8: Overlay of high-energy finger print region in FT-IR spectrum of motor, dodecanethiol modified nanoparticles and motor modified nanoparticles.
DODECANETHIOL-NANOPARTICLES
Motor Motor modified-NANOPARTICLES
2750 2800 2850 2900 2950 3000 3050 3100 3150
Wavenumber (cm-1)
3059
cm
-1
3006
cm
-1
DODECANETHIOL-NANOPARTICLES
Motor Motor modified-NANOPARTICLES
DODECANETHIOL-NANOPARTICLES
Motor Motor modified-NANOPARTICLES
2750 2800 2850 2900 2950 3000 3050 3100 3150
Wavenumber (cm-1)
3059
cm
-1
3006
cm
-1
Figure 9: Overlay of C-H stretching region of FT-IR for motor, dodecane thiol modified nanoparticles and motor modified nanoparticles.

S10
Solid state Raman and surface enhanced resonance Raman spectroscopy: evidence
for vibrational perturbation by non-specific binding to gold nanoparticles
In Figure 10, the solid state Raman spectrum and the SERS spectrum of the motor are
presented. The very large changes in vibrational structure in the SERS spectrum
compared with the solid state spectrum imply that the interaction of the motor with the
gold nanoparticles in the SERS experiments results in considerable perturbation of the
molecular structure, presumably through interaction of the thioether and alkene moieties
with the gold surface. The absence of significant changes to the vibrational features (in
particular the C=C vibrations around 1500-1600 cm-1) in the IR spectra of the modified
nanoparticles supports the conclusion that the binding mode of the motors to the
nanoparticles is via the alkylthiol ‘legs’ and that non-specific interactions of the motor
with the gold nanoparticles surface do not occur to a significant degree.

S11
Surface enhanced resonance Raman spectroscopic characterisation of motor
derivatised Au nanoparticles
Figure 10: Solid state Raman (upper) and surface enhanced Raman {on Au} (lower) spectra of motor recorded at 785 nm.
Non-specific adsorption of the olefin via the thioether moieties was further excluded by
control experiments with motor molecules lacking the octylthiol legs, which did not
result in stable nanoparticles.
TEM studies
Representative TEM images (left, Figure 11) of capped gold nanoparticles 1-Au
deposited on an amorphous carbon film by drop-casting from a dilute toluene solution
and the corresponding particle size distribution derived from digital analysis of 1246
particles. The nanoparticles are well-dispersed and spherical in shape with an average
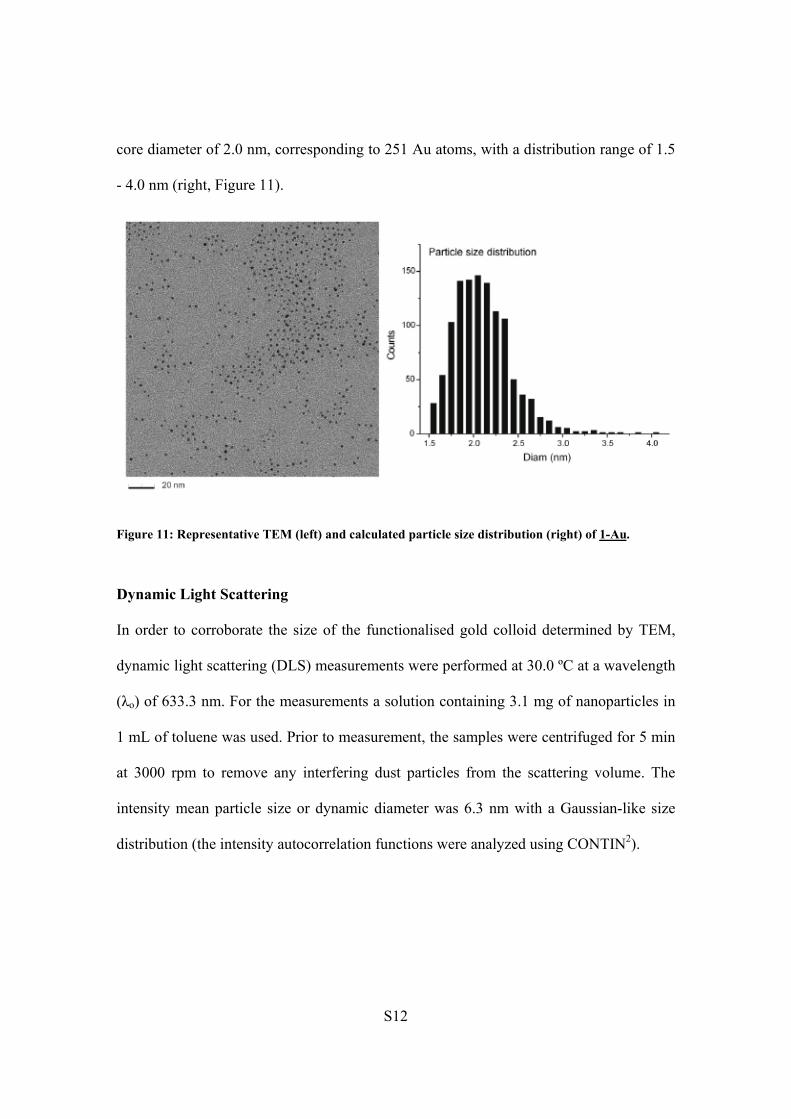
S12
core diameter of 2.0 nm, corresponding to 251 Au atoms, with a distribution range of 1.5
- 4.0 nm (right, Figure 11).
Figure 11: Representative TEM (left) and calculated particle size distribution (right) of 1-Au.
Dynamic Light Scattering
In order to corroborate the size of the functionalised gold colloid determined by TEM,
dynamic light scattering (DLS) measurements were performed at 30.0 ºC at a wavelength
(λo) of 633.3 nm. For the measurements a solution containing 3.1 mg of nanoparticles in
1 mL of toluene was used. Prior to measurement, the samples were centrifuged for 5 min
at 3000 rpm to remove any interfering dust particles from the scattering volume. The
intensity mean particle size or dynamic diameter was 6.3 nm with a Gaussian-like size
distribution (the intensity autocorrelation functions were analyzed using CONTIN2).

S13
Section 2: This section describes characterization of compound 2.
S
SOMe OMe
4,5-Dimethoxy-9-(2',3'-dihydro-2'-methyl-1'H-naphtho[2,1-b]thiopyran-1'-ylidene)-
9Hthioxanthene (2)
1H NMR (CDCl3, 400 MHz) δ 0.74 (d, J = 6.6, 3H, CH3), 3.07 (dd, J = 11.4, 2.9 Hz, 1H,
CH2), 3.69 (dd, J = 11.4, 7.3 Hz, 1H, CH2), 3.81 (s, 3H, OCH3), 4.00 (s, 3H, OCH3), 4.11
(m, 1H, CH), 6.06 (dd, J = 7.7, 1.1 Hz, 1H), 6.29 (dd, J = 8.1, 1.1 Hz, 1H), 6.38 (m, 1H),
6.87 (dd, J = 8.1, 1.1 Hz, 1H), 7.02 (m, 1H), 7.0113 (m, 1H), 7.22 (dd, J = 7.7, 1.1 Hz,
1H), 7.37 (m, 1H), 7.41 (d, J = 8.4 Hz, 1H), 7.57 (d, J =8.4 Hz, 1H), 7.60 (d, J = 8.4 Hz,
1H), 7.63 (d, J = 8.4 Hz, 1H); 1H NMR (toluene-D8, 400 MHz, stable isomer, axial
methyl substituent) δ 0.53 (d, J = 6.6 Hz, 3H, CH3), 2.69 (dd, J = 11.5, 2.7 Hz, 1H, CH2),
3.22 (s, 3H, OCH3), 3.36 (s, 3H, OCH3), 3.38 (m, 1H, CH2), 4.06-4.10 (m, 1H, CH), 5.87
(d, J = 8.1 Hz, 1H), 6.18 (m, 1H), 6.32 (d, J = 7.0 Hz, 1H), 6.40 (d, J = 8.1 Hz, 1H), 6.89
(m, 1H), 6.97-7.09 (m, 2H), 7.15 (d, J = 7.7 Hz, 1H), 7.31-7.37 (m, 3H), 7.88 (d, J = 8.4
Hz, 1H); 1H NMR (toluene-D8, 400 MHz, unstable isomer, equatorial methyl substituent)
δ 0.89 (d, J = 7.0 Hz, 3H, CH3), 2.26 (m, 1H, CH2), 2.98-3.05 (m, 2H, CH2+CH), 3.22 (s,
3H, OCH3), 3.34 (s, 3H, OCH3), 5.86 (d, J = 8.1 Hz, 1H), 6.16 (m, 1H), 6.29 (d, J = 7.7
Hz, 1H), 6.36 (m, 1H), 6.90-7.16 (m, 4H), 7.36-7.44 (m, 3H), 7.74 (d, J = 8.1 Hz, 1H);
13C NMR (CDCl3, 75 MHz) δ 19.1 (q), 32.0 (d), 37.2 (t), 56.0 (2xq), 107.6 (d), 108.2 (d),
119.9 (d), 121.6 (d), 122.7 (s), 124.3 (d), 124.5 (d), 125.4 (d), 125.5 (d), 125.7 (d), 126.5
(d), 127.3 (d), 127.4 (d), 130.8 (s), 131.3 (s), 131.6 (s), 132.2 (s), 134.7 (s), 136.3 (s),

S14
136.5 (s), 138.8 (s), 155.2 (s), 156.1 (s), one (s) signal was not observed; m/z (EI, %) =
468 (M+, 100); HRMS (EI): calcd. for C29H24O2S2: 468.1218, found 468.1208.
Resolution of (2'R)-(M)-2 and (2'S)-(P)-2 was achieved by preparative chiral HPLC
employing a Chiralcel AD column as the stationary phase and n-heptane : i-propanol 9:1
as the eluent (1 mL·min-1). The first eluted fraction (t = 5.1 min) was assigned by CD
spectroscopy to be (2'R)-(M)-2 and second eluted fraction (t = 6.4 min) was assigned to
be (2'S)-(P)-2. The fraction containing the (2'R)-(M) isomer of 2 was used for all
chiroptical studies on compound. The absolute configuration of the molecule chosen for
the molecule was determined by Flack’s refinement (x = 0.01(5); UV-Vis and CD
spectroscopic data for pure stable (2’R)-(M)-2: UV-Vis: (toluene) λmax(ε) 295 (16300),
323 (10500), 350 (shoulder, 6400); CD: (toluene) λmax(Δε) 283 (+92.6), 322 (-15.2), 351
(-18.6); CD: (n-dodecane) λmax(Δε)202 (+31.4), 214 (-67.5), 241 (-5.4), 251 (-46.0), 281
(+92.0), 321 (-14.8), 349 (-18.8); UV-Vis and CD spectroscopic data for pure unstable
(2’R)-(P)-2: UV-Vis (calc., toluene) λmax(Δε) 295 (16900), 315 (10900), 347 (shoulder,
3900); CD: (calc., toluene) λmax(Δε) 283 (-66.0), 318 (+26.2), 345 (+13.5)

S15
Table 1: X-Ray crystallographic data for (2'R)-(M)-2.

S16
Figure 12: 400 MHz 1H NMR of 2.
Figure 13: 400 MHz 1H NMR of 2, expansion to show crucial reporter peak at 7.88 ppm.

S17
Figure 14: 100 MHz APT spectrum of 2 in CDCl3.
Figure 15: UV-Vis spectra of pure (2'R)-(M)-2 (solid line), PSS≥ 280 nm (dashed line), PSS365 nm (dotted line) and the calculated UV-Vis spectrum of (2'R)-(P)-2 (thick solid line) recorded in toluene.

S18
Figure 16: CD spectra of dimethoxy substituted motor 2 in toluene (solid line) and dodecane (dashed line).
Figure 17: CD spectra of pure (2'R)-(M)-2 (solid black), PSS≥280 nm (dashed black), PSS365 nm (dotted black) and the calculated CD spectrum of (2'R)-(P)-2 (thick black) recorded in toluene.

S19
Figure 18 UV-Vis spectra of pure (2'R)-(M)-2 (solid line), PSS≥ 280 nm (dashed line), PSS365 nm (dotted line) and the calculated UV/Vis spectrum of (2'R)-(P)-2 (thick solid line, based on correlating 94:6 unstable/stable in NMR studies with observed UV) recorded in toluene.

S20
Section 3: This section describes experiments designed to verify that 2 behaves as a
unidirectional molecular motor. This was achieved by replacing the CH3 group with a
CD3 group to allow distinction between cis and trans diastereomers. The experiments
performed on the cis-3 exclude any alternative mechanisms to explain the data observed
for 1, involving either photochemical helix inversion without isomerisation and/or
thermal isomerisation.
S
SOCD3OCH3
4-Methoxy(D3)-5-methoxy-9-(2',3'-dihydro-2'-methyl-1'H-naphtho[2,1-b]thiopyran-
1'-ylidene)-9H-thioxanthene (3)
According to 1H NMR, the cis-trans ratio of the enriched product for study was 80:20.
The 1H and 13C NMR spectra were identical to the previously synthesized all hydrogen
analogue 2, except for the methoxy signal (which had a 4/1 relative integration for signal
from the expected methoxy CH3); m/z (EI, %) = 471 (M+, 100); HRMS (EI): calcd. for
C29D3H21O2S2: 471.1403, found: 471.1410.
S21
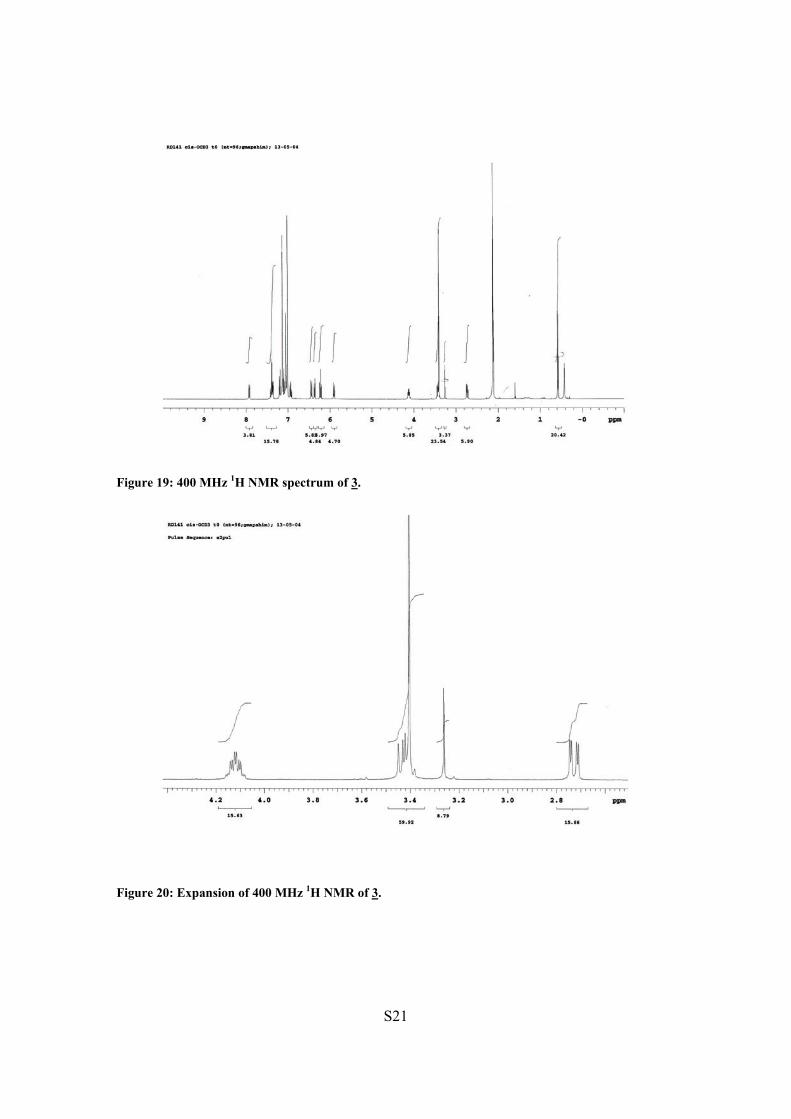
Figure 19: 400 MHz 1H NMR spectrum of 3.
Figure 20: Expansion of 400 MHz 1H NMR of 3.

S22
S
S
S
SOCD3OCH3
S
S
S
S
Δ
OCD3OCH3
OCD3H3COOCD3OCH3
hν
hν
Stable-cis-3 Meax
step 1
step 3
step 2step 4
Unstable-trans-3: Meeq
Stable-trans-3: MeaxUnstable-cis-3: Meeq
Δ
Figure 21: Unidirectional rotation was demonstrated by comparing the conversion of the stable form of 3 to the unstable form, with the conversion of cis to trans.
Figure 22: A sample consisting of 80% stable-cis-3 and 20% unstable-trans-3 was irradiated (λ≥ 280 nm) generating a mixture 73:18 : 7:2 of unstable-trans-3, unstable-cis-3, stable-cis-3 and stable-trans-3. This is consistent with 90% conversion of each of isomers to their corresponding unstable forms, which is supported by the change in the signals from the methoxy groups.

S23
Figure 23: The expansion of the 400MHz 1H NMR of an irradiated sample of 80% enriched stable-cis-3 revealed a ratio of cis/trans by relative integrations of methoxy protons. The absorptions of the methoxy groups shift only slightly and overlap with protons of the upper half. 73:18 : 7: 2.
Figure 24: Expansion of 400 MHz 1H NMR of the PSS>280 of 3, revealing a mixture of starting material stable isomers (left doublet, 9% total) and a mixture of the unstable isomers unstable-trans-3 and unstable-cis-3 (right doublet, 91 % total).

S24
Figure 25: 400 MHz 1H NMR of PSS>280nm of irradiated 80% enriched cis-3.
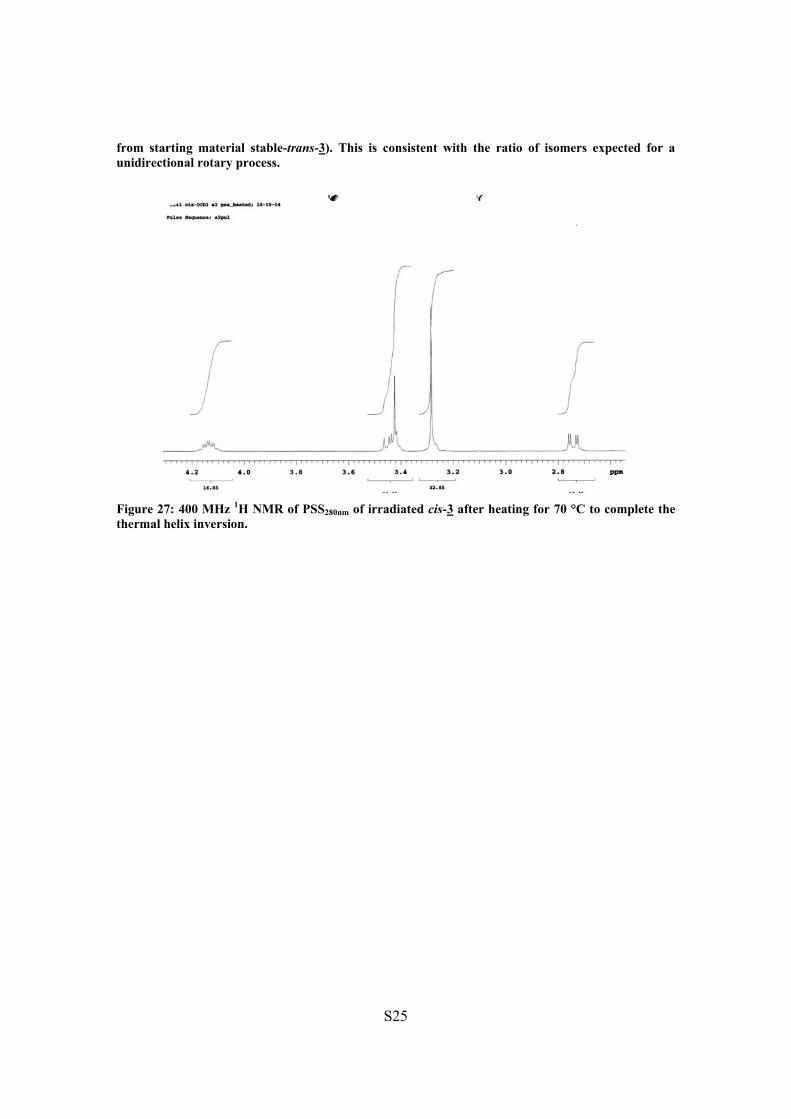
Figure 26: 400 MHz 1H NMR of PSS280nm of irradiated cis-3 after heating to 70 °C to complete the thermal helix inversion. The spectrum shows complete conversion of unstable-trans-3 and unstable-cis-3 to stable-trans-3 and stable-cis-3 respectively. The cis/trans ratio after irradiation and subsequent heating was determined by 1H NMR to be 25:75 (CIS: 7% remaining from starting cis-3 plus 18% from isomerised unstable-trans-3; TRANS: 71% from isomerised unstable-cis-3, and 4%
S25
from starting material stable-trans-3). This is consistent with the ratio of isomers expected for a unidirectional rotary process.
Figure 27: 400 MHz 1H NMR of PSS280nm of irradiated cis-3 after heating for 70 °C to complete the thermal helix inversion.

S26
Section 4 This section describes data from experiments designed to verify that 1 behaves as a
unidirectional molecular motor while attached to the gold colloid, 1-Au. This was
achieved by 13C isotope enrichement of the ether carbon of one “leg” which allowed the
distiction between cis and trans diastereomers (cis-4 and trans-4 respectively). The
experiments performed on cis-4 and cis-4-Au are described below.
( )6
50 % 13C( )650 % 13C
SO O
S
SH SH 13C-Labelled 4,5-bis[(8-sulfanyloctyl)oxy]-9-(2',3'-dihydro-2'-methyl-1'H-
naphtho[2,1-b]thiopyran-1'-ylidene)-9H-thioxanthene (cis-4)
1H NMR (400 MHz, CDCl3) δ 0.74 (d, J = 7.2 Hz, 3H), 1.20-1.65 (m, 20H), 1.72-1.79
(m, 2H), 1.92 (quin, J = 6.9 Hz, 2H), 2.88 (m, 3H), 2.88 (dt, 3JHH = 7.4 Hz, 1JCH = 141
Hz, 1H, 13CH2SH,), 3.08 (dd, J = 11.4, 2.6 Hz, 1H), 3.72 (dd, J = 11.2, 7.6 Hz, 1H),
3.63-4.00 (m, 2H), 4.00-4.19 (m, 3H), 6.01 (d, J = 7.6 Hz, 1H), 6.26 (AB doublet, 1H),
6.33 (ABX triplet, 1H), 6.83 (d, J = 8.0 Hz, 1H), 6.98 (t, J = 8.0 Hz, 1H), 7.09 (t, J = 7.4
Hz, 1H), 7.19 (d, J = 7.8 Hz, 1H), 7.28 (t, J = 8.0 Hz, 1H), 7.34 (d, J = 8.8 Hz, 1H),
7.49-7.59 (m, 3H), SH not observed.

S27
Figure 28: 400 MHz 1H NMR spectrum of cis-4.
Figure 29: Expansion of the key region in the 400 MHz 1H NMR spectrum of cis-4.

S28
Figure 30: Expansion of 400 MHz 1H NMR spectrum of cis-4.
Figure 31: 400 MHz 13C NMR spectrum in Toluene D8 of cis-4. Note spectrum is not referenced to toluene D8. PhD5CD3 should be shifted 0.76 ppm downfield from 21.6 to 20.4 ppm, shifting the O13CH2 resonance at 68.9 ppm.

S29
Experiments with 13C labeled motor functionalised nanoparticles 4-Au to
demonstrate unidirectional rotation on gold
( )6
50 % 13C( )6
( )6 ( )6
Au
hν = 365 nm3 h
SO O
S
( )6
SR SR
( )6
KCN, THF/H2O
Unstable-Trans-4/Stable Cis-4Ratio 1.2/1
SO O
S
( )6
SR SR
( )6
70 ºC, 2 h70 ºC, 2 h
Stable Trans-4/Stable Cis-4Ratio 1.2/1
( )6 ( )6
Au
KCN, THF/H2O
50 % 13C
Thermal isomerizationon gold
Thermal isomerizationin solution
Photoirradiationon gold
Detach fromgold
Detach fromgold
Stable-Cis-4-Au
Au
SO O
S
S S
Au
SO O
S
S S
SO O
S
S SAu
Stable-Trans-4-Au/Stable Cis-4-Au
Ratio 1.2/1
Unstable-Trans-4-Au/Stable Cis-4-Au
Ratio 1.2/1
1H NMR obtained here to determine stable to unstable ratio
13C NMR obtained here to determine trans to cis ratio from material heated before and
after KCN etch of the gold core
Path B
Path A
Figure 32: Depiction of the two experiments performed on 4-Au.
S30
Gold colloids 4-Au were prepared and purified from cis-4 using an analogous procedure
as for 1-Au. These colloids were irradiated at 365 nm for 3 h at with vigorous stirring in a
cuvette in toluene (Figure 32). This sample was split into two portions. The first (Path A)
was reduced in vacuo, and treated with aqueous KCN/THF (5 mL, 1 mg/mL in
THF/H2O, 5/1). After 30 minutes the colour associated with the colloids had completely
disappeared. This sample was extracted with toluene, dried, concentrated in vacuo and
analyzed by 1H NMR. This mixture was then heated at 70 °C for 2 h, and analyzed by 1H
NMR and 13C NMR. The second portion of irradiated cis-4-Au was heated while the
motor was still on the nanoparticle (Path B). These nanoparticles were
etched with KCN as described for Path A, and analyzed by 1H and 13C NMR.
A unidirectional process would generate identical conversions of stable to
unstable isomer and cis to trans isomer. This was observed in the experiments described.
Crucially, after heating both samples, the 13C NMRs both revealed a ratio of cis/trans of
1/1.2, corresponding to exactly the ratio of stable to unstable obtained in the 1H NMR of
the mixture in Path A before heating (as expected for a unidirectional process).

S31
6.006.507.007.508.00
7.83
97.
818
7.69
67.
675
6.47
76.
466
6.44
76.
259
6.24
06.
220
6.14
36.
123
6.10
35
951
1.00
1.17
3.41
2.85
2.64
2.43
Figure 33: 400 MHz 1H NMR expansion of key signals showing doublet associated with stable form (7.82 ppm) and unstable form (7.68 ppm). The integrals show 1/1.2 stable/unstable ratio.
0.05.010.0
7.91
47.
897
6.57
86.
562
6.35
06.
335
6.24
06.
224
6.20
8
1.00
0.900.73
3.02
0.730.690.40
Figure 34: 400 MHz 1H NMR of sample of cis-4-Au after irradiation, KCN mediated etching of the gold core, then heating at 70 °C for 2 h.

S32
6.507.007.508.00
7.91
47.
897
6.57
86.
562
6.35
06.
335
6.24
06
224
1.00
0.90
0.73
3.02
0.73
Figure 35: 400 MHz 1H NMR expansion of sample of 4-Au after irradiation, heating at 70 °C for 2 h, then KCN mediated etching of the gold core (end of Path B). This mixture contains a 1.2/1 mixture of stable-cis-4 and stable-trans-4 (not discernable from the 1H spectrum). Importantly, all unstable isomer is gone as judged by the absence of a peak at 7.68 ppm. This spectrum is essentially identical to the 1H NMR obtained by Path A.
13C Signal for stable-cis -4 at 68.9 ppm
SO O
S
( )6
SH SH
( )6( )6 ( )6
SO O
S
SH SH
Stable-cis-4 Stable-trans-4
= 50 % 13C Enrichment
13C Signal for stable-trans-4 at 68.8 ppm
Figure 36: The distinct NMR signal from the 13C labeled ether carbon flanking the motor allowed quantitative detection of cis to trans isomerisation.

S33
68.5069.0069.50
68.8
96
68.8
26
1.00
1.17
Figure 37: Expansion of 500 MHz 13C NMR of a sample of cis-4-Au after irradiation, KCN mediated etching of the gold core, then heating at 70 °C for 2 h (Path A). The new cis/trans ratio of 1.0/1.2 is consistent with the amount of unstable isomer generated (1.0/1.2 : stable-4/unstable-4).
5060708090
68.8
9668
.826
1.001.17
Figure 38: 500 MHz 13C NMR of a sample of cis-4-Au after irradiation, KCN mediated etching of the gold core, then heating at 70 °C for 2 h (Path A).

S34
69.5069.6069.7069.8069.9070.0070.10
69.8
75
69.8
1
1.00
1.18
Figure 39: 500 MHz 13C NMR expansion of a sample of cis-4-Au after irradiation, heating at 70 °C for 2 h, then KCN mediated etching of the gold core, liberating free motor (Path B). The new cis/trans ratio of 1.0/1.2 is consistent with the amount of unstable isomer generated (1.0/1.2: stable-4/unstable-4).

S35
405060708090100110120
125.
112
4.94
124.
74
68.8
8468
.820
1.001.18
Figure 40: 500 MHz 13C NMR in toluene D8 of a sample of cis 4-Au after irradiation, heating at 70 °C for 2 h, then KCN mediated etching of the gold core, liberating free motor (Path B). See the expansion for integration.
Section 5: General remarks.
The high-resolution 1H NMR spectra were obtained using a Varian VXR-300, Varian
Mercury Plus and a Varian Unity Plus Varian-500 operating at 299.97, 399.93 and
499.86 MHz, respectively, for the 1H nucleus. 13C NMR spectra were recorded on a
Varian Mercury Plus and a Varian Unity Plus Varian-500 operating at 100.57 and 125.70
MHz, respectively. Chemical shifts are reported in δ units (ppm) relative to the residual
deuterated solvent signals of CHCl3 (1H NMR: δ 7.26 ppm; 13C NMR: δ 77.0 ppm) and
toluene (1H NMR: δ 2.04 ppm, 13C NMR: δ 20.4 ppm). The splitting patterns are
designated as follows: s (singlet), d (doublet), t (triplet), q (quartet), quin (quintet), m

S36
(multiplet) and br (broad). Irradiation experiments were performed with a 180 W Oriel
Hg-lamp using a pyrex filter or 365 nm bandwidth filters or a Spectroline ENB-280C/FE
UV lamp at 366 nm. UV-Vis measurements were performed on a Hewlett-Packard HP
8453 FT spectrophotometer and CD spectra were recorded on a JASCO J-715
spectropolarimeter using Uvasol grade solvents (Merck). Thermal helix inversions were
monitored by CD spectroscopy using the apparatus just described and a JASCO PFD-
350S/350L Peltier type FDCD attachment with a temperature control.
1 Chen, S. & Murray, R.W. Arenethiolate monolayer-protected gold clusters. Langmuir 15, 682-689 (1999). 2 Provencher, S.W. A constrained regularization method for inverting data represented by
linear algebraic or integral equations. Comput. Phys. Commun. 27, 229-227 (1982).


![Clinical Translation of [68Ga]NOTA-anti-MMR-sdAb for PET ...NOTA (2.6 mg, 47 μmol), pH adjusted to 8.5–8.7 with 0.2 M Na 2CO 3. After 2-h incubation at room temperature (RT), the](https://static.fdocuments.net/doc/165x107/602e0af57efda84b4463a9fe/clinical-translation-of-68ganota-anti-mmr-sdab-for-pet-nota-26-mg-47-mol.jpg)