Supplementary Information - Royal Society of Chemistry · Supplementary Information...
10
Supplementary Information High-performance nanoporous Si/Al 2 O 3 foam lithium-ion battery anode fabricated by selective chemical etching of Al-Si alloy and subsequent thermal oxidation Gaeun Hwang, Hyungmin Park, Taesoo Bok, Sinho Choi, Sungjun Lee, Inchan Hwang, Nam-Soon Choi, Kwanyong Seo & Soojin Park* Department of Energy Engineering, School of Energy and Chemical Engineering, Ulsan National Institute of Science and Technology (UNIST), Ulsan 689-798, Republic of Korea Electronic Supplementary Material (ESI) for ChemComm. This journal is © The Royal Society of Chemistry 2015
Transcript of Supplementary Information - Royal Society of Chemistry · Supplementary Information...

Supplementary Information
High-performance nanoporous Si/Al2O3 foam lithium-ion battery anode fabricated by selective chemical etching of Al-Si alloy and
subsequent thermal oxidationGaeun Hwang, Hyungmin Park, Taesoo Bok, Sinho Choi, Sungjun Lee, Inchan Hwang,
Nam-Soon Choi, Kwanyong Seo & Soojin Park*
Department of Energy Engineering, School of Energy and Chemical Engineering, Ulsan National Institute of
Science and Technology (UNIST), Ulsan 689-798, Republic of Korea
Electronic Supplementary Material (ESI) for ChemComm.This journal is © The Royal Society of Chemistry 2015

Experimental Sections
Preparation of nanostructured micrometer sized Al-Si powder: 13.0 g Al-Si alloy powder
(325 mesh, 99%, Al:Si = 88:12 wt.%, Alfa Aesar) was immersed in 400 mL of 3 M
hydrochloric acid (HCl) solution (SAMCHUN chemical, Korea) for 30 min with stirring. The
chemically etched powder was filtered, washed several times with deionized (DI) water and
dried at 70 °C for 12 hr. At this condition, we obtained the production yield of 18%.
Synthesis of Si/Al2O3 foam particles: To oxidize residual Al in the chemically etched Al-Si
particles, 0.35 g of the etched Al-Si powder was thermally oxidized with water vapor as an
oxidant at 600 oC for 10, 30 and 60 min. The water vapor was supplied into the tube furnace
by bubbling DI water assisted with N2 gas (5 L min-1).
Characterization: Scanning electron microscopy (SEM, S-4800, Hitachi) at an accelerating
voltage of 10kV and high-resolution transmission electron microscopy (HR-TEM, JEOL,
JEM-2100F) operating at 200kV were used to characterize morphologies and element
mapping of Al-Si and Si/Al2O3 samples. To investigate the microstructures of samples, X-ray
diffractometer (XRD, D8 Advance, Bruker, Cu Kα radiation) was used between 10 and 90° at
a scan rate of 1.4° sec-1.
Electrochemical measurements: To evaluate electrochemical performances of chemically
etched and thermally oxidized samples, the electrodes were prepared by mixing 70 wt%
active material (etched Al-Si powder, thermally oxidized Si/Al2O3 powder), 20 wt% of super
P and 10 wt% of binder (poly(acrylic acid)/sodium carboxymethyl cellulose (PAA:CMC =
1:1, w/w)) with a mixer (Thinky mixer, ARE310) at 2200 rpm for 15 min to homogenize
slurry. After the slurries were casted on a coper foil, the electrodes were dried at 150 °C for 2
hr in a vacuum oven to solidify electrodes. The mass loading level of active materials in
electrodes was around 0.9 mg cm-2. The coin-type half-cell (2016R) was assembled in an Ar-
filled glove box with oxygen and water less than 1 ppm. The Li metal foil was used as
counter electrode and micro porous polyethylene film (Celgard 2400) was used as a
separator. The electrolyte consisted of a solution of 1.3M LiPF6 in a mixture of ethylene
carbonate (EC)/diethyl carbonate (DEC) (3:7, v/v) with 10% fluorinated ethylene carbonate
(FEC) additive. Galvanostatic charge and discharge cycling (WonATech WBCS 3000 battery
measurement system) was performed between 0.005 and 1.2 V (versus Li/Li+) at 25 °C. For
the chemically etched (30 min) Al-Si, 10 min-, 30 min-, and 60 min- oxidized Si/Al2O3

electrodes, 1C rate is 2.1, 1.4, 1.0, and 0.8 A/g, respectively. After cycling, the cells were
disassembled in a glove box and the electrodes were rinsed with dimethyl carbonate (DMC)
for 1 h to remove residual electrolytes and dried at room temperature. The AC impedance
analysis was obtained using IVIUM frequency response analyzer ranging from 0.01 Hz to
100 kHz.
Table. S1 EDS data of the amount of elements depending on etching time.
Before
etching15 min 30 min 45 min 60 min
Elements
Weight% Weight% Weight% Weight% Weight%
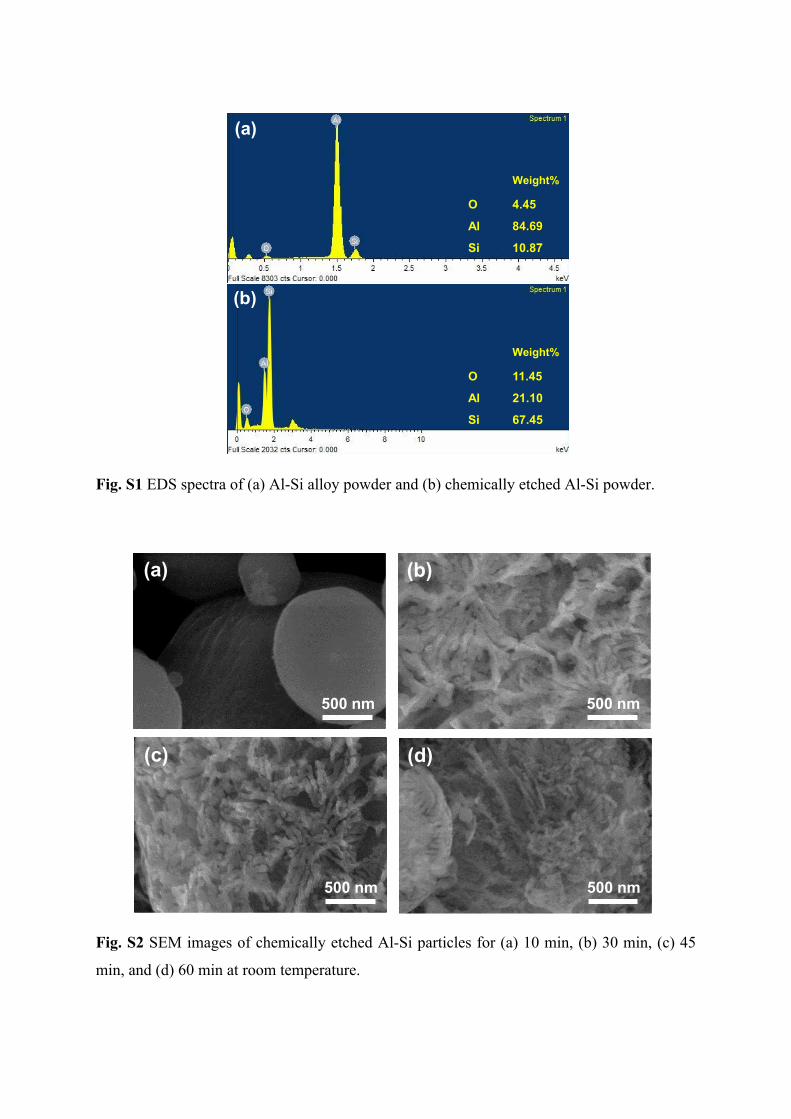
O 4.45 5.88 11.45 12.90 12.56
Al 84.69 60.58 21.10 7.58 4.28
Si 10.87 33.54 67.45 79.53 83.16
(a)
(b)
Weight%
O 4.45
Al 84.69
Si 10.87
Weight%
O 11.45
Al 21.10
Si 67.45
Fig. S1 EDS spectra of (a) Al-Si alloy powder and (b) chemically etched Al-Si powder.
500 nm
(b)(a)
500 nm
(d)
500 nm
(c)
500 nm
Fig. S2 SEM images of chemically etched Al-Si particles for (a) 10 min, (b) 30 min, (c) 45
min, and (d) 60 min at room temperature.

5μm 5μm
5μm SEM image5μm
(a) (b)
(c) (d)
O
Al
Si
Fig. S3 SEM images and EDS spectra of (a) chemically etched Al-Si powder and Si/Al2O3
particles thermally oxidized for (b) 10 min, (c) 30 min, and (d) 60 min.
(a) (b)
(c) (d)
Fig. S4 TEM images of thermally oxidized samples at 600 oC: Thermally oxidized Si for (a)
10 min, (b) 30 min, (c) 60 min and (d) thermally oxidized Al sample for 10 min. In the case
Al particle, we used micrometer-sized Al (an average particle size of 3 μm). After thermal
oxidation at 600 oC for 10 min, a focused-ion beam technique was employed to obtain
sectioned sample for TEM measurement.

10 20 30 40 50 60 70 80 90
Inte
nsity
(a.u
.)
2 (degree)
Pure Al
Oxidized Al (10 min)
Oxidized Al (30 min)
Oxidized Al (60 min)
Fig. S5 XRD patterns of pure Al and samples thermally oxidized at 600 oC for 10 min (red),
30 min (blue), and 60 min (cyan). As the oxidation time increased, the Al peak was gradually
decreased. From the first order scattering peak of each sample, we estimated the Al2O3
contents from the Al contents remained after the thermal oxidation. When the pure Al was
thermally oxidized for 10 min, 30 min, and 60 min, the Al2O3 layers of 20%, 25%, and 35%
were formed on the Al surface, respectively. It should be noted that the Al of 65% was still
left, even though the pure micrometer-sized Al particles was oxidized at 600 oC for 60 min.

0.0 0.2 0.4 0.6 0.8 1.00
10
20
30
40
50
60
70
Volu
me
Abso
rbed
(cm
3 /g)
Relative Pressure (P/Po)
0.0 0.2 0.4 0.6 0.8 1.00
10
20
30
40
50
60
70
Volu
me
Abso
rbed
(cm
3 /g)
Relative Pressure (P/Po)
0 20 40 60 80 100 120
0.000
0.001
0.002
0.003
0.004
0.005 0 min 10 min
dV/d
D (c
m3 g-1
nm-1)
Pore Diameter (nm)
(b)
(c) (d)
0.0 0.2 0.4 0.6 0.8 1.00
10
20
30
40
50
60
70Vo
lum
e Ab
sorb
ed (c
m3 /g
)
Relative Pressure (P/Po)
(a)
10 min-oxidation
Etched Al-Si
Fig. S6 BET surface area of (a) pristine Al-Si alloy, (b) 30 min-etched Al-Si, and (c) 10 min-
thermally oxidized Si/Al2O3. (d) Pore size distribution of the chemically etched and 10 min-
oxidized particles.
0 2 4 6 8 100
2
4
6
8
10
0min 10min 30min 60min
-Z'' (
Ohm
)
Z' (Ohm)0 500 1000 1500 2000 2500
0
500
1000
1500
2000
2500 0min 10min 30min 60min
-Z'' (
Ohm
)
Z' (Ohm)
0 5 10 15 200
5
10
15
20
-Z'' (
Ohm
)
Z' (Ohm)
(a) (b)
Fig. S7 Electrochemical impedance spectra of chemically etched Al-Si and Si/Al2O3
electrodes thermally oxidized for 10, 30 and 60 min (a) after 1st cycle (b) after 120th cycle.

0 10 20 30 40 50 60 70 800
500
1000
1500
2000
60min
30min10min
0min
Lith
ium
inse
rtion
cap
acity
(mAh
g-1)
Cycle number
0.2C10C7C5C3C0.5C 1C0.2C
Fig. S8 Rate capabilities of chemically etched Al-Si and Si/Al2O3 electrodes thermally
oxidized for 10, 30, and 60 min. The Li extraction rate was fixed at C/5 and Li insertion rate
was varied from C/5 to 10C.

Before cycle After cycle
100 μm23 μm
50 μm
44 μm21 μm
50 μm
22 μm
50 μm
52 μm
50 μm
20 μm
50 μm
49 μm
50 μm
50 μm 50 μm
(a)
(b)
(c)
(d)
124th cycle
150th cycle
150th cycle
150th cycle
Fig. S9 Cross-sectional SEM images of electrode before and after cycle. (a) Chemically
etched Al-Si electrode after 124th cycle and Si/Al2O3 electrodes thermally oxidized for (b) 10
min, (c) 30 min, and (d) 60 min after 150th cycle.

Before cycle After cycle
50nm
3 μm
100nm
3 μm
200nm
3 μm
100nm
3 μm
100nm
(a) (b)
(c) (d)
Fig. S10 SEM images of (a) 30 min-chemically etched Al-Si powder before and (b) after 120
cycles. Inset shows the corresponding TEM image of Al-Si frame before and after cycle.
SEM images of 10 min-oxidized Si/Al2O3 particles (c) before and (b) after 120 cycles. The
corresponding TEM image of Si/Al2O3 frame was seen in the inset before and after cycle.