
Supplementary information Interaction between … Skokowa1*, Maxim Klimiankou1, , Olga Klimenkova1,...
42
Supplementary information Interaction between HCLS1, HAX1 and LEF-1 proteins is essential for G-CSF-triggered granulopoiesis Julia Skokowa 1* , Maxim Klimiankou 1,§ , Olga Klimenkova 1,§ , Dan Lan 1 , Kshama Gupta 1 , Kais Hussein 2 , Esteban Carrizosa 3 , Inna Kusnetzova 1 , Zhixiong Li 4 , Claudio Sustmann 5 , Arnold Ganser 5 , Cornelia Zeidler 1 , Hans-Heinrich Kreipe 2 , Janis Burkhardt 3 , Rudolf Grosschedl 6 , Karl Welte 1* 1 Department of Molecular Hematopoiesis, Hannover Medical School, Hannover, Germany; 2 Department of Pathology, Hannover Medical School, Hannover, Germany; 3 Department of Pathology and Laboratory Medicine, Children's Hospital of Philadelphia and University of Pennsylvania School of Medicine, Philadelphia, USA; 4 Institute of Experimental Hematology, Hannover Medical School, Hannover, Germany; 5 Department of Hematology, Hemostasis, Oncology, and Stem Cell Transplantation, Hannover Medical School, Hannover, Germany; 6 Max Planck Institute of Immunobiology, Department of Cellular and Molecular Immunology, Freiburg, Germany § These authors contributed equally to this work e-mail: [email protected]; e-mail:[email protected] Nature Medicine doi:10.1038/nm.2958
Transcript of Supplementary information Interaction between … Skokowa1*, Maxim Klimiankou1, , Olga Klimenkova1,...

Supplementary information
Interaction between HCLS1, HAX1 and LEF-1 proteins is
essential for G-CSF-triggered granulopoiesis
Julia Skokowa1*, Maxim Klimiankou1,§, Olga Klimenkova1,§, Dan Lan1, Kshama Gupta1, Kais
Hussein2, Esteban Carrizosa3, Inna Kusnetzova1, Zhixiong Li4, Claudio Sustmann5, Arnold Ganser5,
Cornelia Zeidler1, Hans-Heinrich Kreipe2, Janis Burkhardt3, Rudolf Grosschedl6, Karl Welte1*
1Department of Molecular Hematopoiesis, Hannover Medical School, Hannover, Germany; 2Department of Pathology, Hannover Medical School, Hannover, Germany; 3Department of Pathology
and Laboratory Medicine, Children's Hospital of Philadelphia and University of Pennsylvania School
of Medicine, Philadelphia, USA; 4Institute of Experimental Hematology, Hannover Medical School,
Hannover, Germany; 5Department of Hematology, Hemostasis, Oncology, and Stem Cell
Transplantation, Hannover Medical School, Hannover, Germany; 6Max Planck Institute of
Immunobiology, Department of Cellular and Molecular Immunology, Freiburg, Germany §These
authors contributed equally to this work
e-mail: [email protected]; e-mail:[email protected]
Nature Medicine doi:10.1038/nm.2958

Supplementary Materials and Methods
Sequential chromatin immunoprecipitation (ChIP-re-ChIP). We cross-linked
chromatin from 5 × 10⁷ Jurkat cells by adding 3.7% of formaldehyde to cell culture
medium and incubation for 10 min at the room temperature. The cross-linking
reaction was quenched by adding 100 µl/ml of 1.375 M glycine. Cells were washed
twice with 10 ml of ice-cold PBS, resuspended in 10 ml of ice-cold ChIP cell lysis
buffer (5 mM PIPES pH 8.0, 85 mM KCl, 0.5% Nonidet-40) and incubate for 10 min
on ice. The released nuclei were pelleted by centrifugation for 10 min at 40C. The
supernatant was carefully aspirated. Nuclei were resuspended in 1ml of ice-cold ChIP
nuclei lysis buffer (50 mM Tris-Cl pH 8.0, 10m M EDTA, 1% SDS) supplemented
with protease inhibitor cocktail (Pierce), incubated for 10 min on ice and chromatin
was sonicated. Sonicated chromatin was incubated on ice for 20 min and centrifuged
at high speed for 15 min at 40C. Chromatin was diluted to a final volume of 600
µl/probe with dilution buffer (16.7 mM Tris-Cl pH 8.0, 167 mM NaCl, 1.2 mM
EDTA, 0,01% SDS, 1.1% Triton X-100) supplemented with protease inhibitor
cocktails. To pre-clear chromatin we added 60 µl of magnetic beads (Dynabeads
Protein G, Invitrogen, cat. Nr. 100.04D) blocked with salmon sperm/BSA and
incubated for 2 h at 40C. For 1st ChIP, we added 7 µg of anti-LEF1 antibody
(monoclonal mouse, cat. Nr. CS200635, Millipore) or isotype control antibody
(normal mouse IgG, cat. Nr. CS200635, Millipore) to the pre-cleared chromatin and
rotated overnight at 40C. After that we added 60 µl of magnetic beads blocked with
salmon sperm/BSA to the chromatin samples and rotated for 2h at 40C. Unbound
chromatin was used as input. Magnetic beads were washed with high-salt ChIP wash
buffer (50 mM HEPES pH 7.9, 500 mM NaCl, 1 mM EDTA, 0,1% SDS, 1% Triton
X-100, 0,1% deoxycholate) followed by washing with 1 ml TE buffer. Each wash was
performed four times by rotation for 10 min at room temperature. Precipitated
DNA:protein complexes were eluted in 100 µl of ChIP elution buffer (50 mM Tris-
HCl, pH 8.0, 10 mM EDTA and 1% SDS) by incubation for 10 min at 680C (1st
ChIP). For re-ChIP (2nd ChIP), DNA-protein complexes from 1st ChIP were incubated
with 7 µg of anti-LEF1, isotype control or anti-HCLS1 antibody (anti-HCLS1, rabbit
polyclonal antibody against full-length native HCLS1 protein, Abnova cat. nr.
H00003059-D01) and 60 µl of pre-blocked magnetic beads. The incubations and
wash steps were performed as described for 1st ChIP. To reverse crosslinks we
incubated samples from 1st ChIP, 2nd ChIP and input overnight at 650C. DNA was
Nature Medicine doi:10.1038/nm.2958

purified using Chromatin IP DNA Purification Kit (Active Motif, cat. Nr. 58002),
according to the manufacturer’s protocol and analyzed by real-time PCR. We
determined the fold changes (enrichment) of target DNA regions (binding sites for
LEF1 protein on the cyclin D1, C/EBPAα and LEF1 gene promoters) in 1st (LEF-1
ChIP) and 2nd (LEF-1 and HCLS1 re-ChIP) samples in comparison to respective
isotype control sample: ∆Ct IP sample = Ct IP sample – Ct input, ∆Ct isotype = Ct
isotype– Ct input isotype; ∆∆Ct= ∆Ct isotype – ∆Ct IP sample for each primer pair.
Final ratio was calculated as F.r.= 1,9^(∆∆Ct), where 1,9 is empirically derived
average of the amplification efficiency for given set of primers and F.r. is a degree of
occupancy of the immunoprecipitated protein at the sequence of interest in the IP
sample with target anibody relative to its level in isotype sample.
To evaluate whether HCLS1 antibody could IP HCLS1 bound to chromatin and are
suitable for ChIP, we performed ChIP with HCLS1 antibody and chromatin from
Jurkat cells. We measured DNA concentration in anti-HCLS1 ChIP DNA sample, in
comparison to anti-LEF-1ChIP DNA sample, isotype ctrl and mock samples. We
could not perform any PCR with anti-HCLS1 ChIP DNA samples, because no
consensus DNA-binding sites for HCLS1 are known. Interestingly, we found that in
anti-HCLS1 ChIP sample concentration of ChIP DNA was significantly higher, in
comparison to isotype control and mock ChIP samples and was comparable to anti-
LEF-1 ChIP DNA sample.
Laser-assisted single cell picking. Participants in this study included: three CN
patients under long-term G-CSF treatment (G-CSF dose ranged between 1.2 and 7.5
mg per kg body weight per day, or once in 2 days); three healthy volunteers during
treatment with G-CSF at a dose of 5 mg per kg body weight per day for 3 days. We
isolated myeloblasts and promyelocytes from bone marrow slides using the PALM
Laser-MicroBeam System (P.A.L.M.) and controlled the purity of individual
populations (100 cells per sample) by qRT-PCR of transcripts encoding myeloid-
specific primary (myeloperoxidase; MPO) and secondary (matrix metalloproteinase-
9; MMP9) granule proteins (data not shown). mRNA was isolated using TRIZOL
reagent (Invitrogen) according to the manufacturer`s protocol with slight
modifications: 10 ng/ml of tRNA and 50 ng/ml of linear polyacrylamide (LPA) (both
Sigma-Aldrich) were added to the TRIZOL.
LEF1, HCLS1 and HAX1 shRNA synthesis, construction of shRNA expression
cassettes and shRNA containing lentiviral vectors. We chemically synthesized
Nature Medicine doi:10.1038/nm.2958

shRNA oligonucleotides corresponding to the human LEF-1, HCLS1, or HAX1 gene
sequences. As control shRNA (ctrl shRNA), we used irrelevant nucleotide of
Arabidopsis thaliana, not mached to any Homo sapiens DNA sequences. All
nucleotides also contained overhang sequences from a 5’ BglII- and a 3’ HindIII-
restriction sites (BioSpring). The oligonucleotide sequences for HCLS1 shRNA has
been published previously1 and for LEF-1 and HAX1 shRNA are available on
request. We inserted the oligonucleotides into the BglII/HindIII-digested pSUPER-
derived plasmid to generate pSUPER-LEF-1, pSUPER-HCLS1 or pSUPER-HAX1
and verified the isolated clone by DNA sequencing. To generate lentiviral transgenic
plasmids containing shRNA expression cassettes located in the U3 region of the ∆∆∆∆3´-
LTR we used pRRL.PPT.SF.DsRedEx.pre, which is a derivative of the standard
lentiviral vector pRRL.PPT.PGK. DsRedEx.pre (kindly provided by Luigi Naldini,
Milano, Italy) using an internal SFFV promoter2. To generate the lentiviral LEF-1,
HCLS1 and HAX1 shRNA plasmids, we digested the pSUPER-LEF-1, pSUPER-
HCLS1 and pSUPER-HAX1 with SmaI and HindII and ligated the resulting DNA
fragments (360 bp) into the SnaBI site of the pRRL.PPT.SF.DsRedEx.pre. The
lentiviral plasmid encodes RFPEXPRESS as reporter gene.
HCLS1 cDNA synthesis and construction of HCLS1 cDNA and HCLS1_NLS or
HCLS1_Y397F cDNA containing lentiviral vectors We amplified 1,560 bp HCLS1
cDNA and cloned it into pRRL.PPT.SF.i2GFPpre vector. This vector is a derivative
of the standard lentiviral vector pRRL.PPT.PGK.GFPpre (kindly provided by Luigi
Naldini, Milano, Italy)2. Details are available on request. To construct the
HCLS1_NLS, we cut pRRL.PPT.SF.HCLS1.i2GFPpre with BamHI, treated it with
Klenow polymerase, redigested with SacI and ligated with a StuI/SacI fragment
(containing the HCLS1 NLS IRES GFP cassette) of the same vector. We introduced
mutation in Tyrosine 397 of pRRL.PPT.SF.HCLS1.i2GFPpre by replacement of Tyr
397 with alanine.
Gene expression microarray analysis. CD34+ cells were transduced with HCLS1
shRNA or ctrl shRNA RFP lentiviral constructs, RFP+ cells were isolated on day 4 of
Nature Medicine doi:10.1038/nm.2958

transduction. RNA was isolated using RNA Isolation Kit from Qiagen. RNA was
subjected to microarray analysis using Affymetrix Microarray Platform. The
Genechip WT cDNA Synthesis and Amplification Kit was used to make double-
stranded cDNA from total RNA, which was then labeled with biotin (Genechip WT
Terminal Labeling Kit). After chemical fragmentation of the biotin-labeled cRNA
targets, they were hybridized to Affymetrix Human Genom WT microarrays using the
Fluidics Station 450 and scanned using the Affymetrix Genechip Scanner 3000 with
Genechip Operating Software 1.4 (Affymetrix, Santa Clara, CA). Data analysis was
performed using Affymetrix Expression Console Version 1.1 for invariant set
normalization and PARTEK (www.partek.com) software was used for identification
of differentially expressed genes.
Tissue array expression analysis in clinical bone marrow samples. Protein
expression was analysed in clinical samples from 52 patients (supplementary Table
4). Formalin-fixed and paraffin-embedded (FFPE) bone marrow biopsies and lymph
node resection in all cases, including controls, had been taken as part of standard
clinical care for the evaluation of bone marrow and lymph node status for exclusion
of an underlying neoplasm. After the diagnosis had been established (Institute of
Pathology, Hannover Medical School), the archived tissue was considered as
remained material, unnecessary for patient’s treatment. The retrospective analysis of
these samples was approved by the local Ethics Committee, Hannover Medical
School. Representative areas were selected for generation of a FFPE tissue array with
samples from 38 patients with acute and chronic stage myeloid neoplasms, 8 non-
neoplastic controls and 1 negative control (canine cardiomyocytes). Myeloid
malignancies comprised AML M0 (n = 9), AML M1 (n = 8), AML M2 (n = 8), AML
M4 (n = 12), AML M5 (n = 9), AML M6 (n = 2) and post-myelodysplastic syndrome
(MDS) AML (n = 4) (Suppl. Table 3). Controls comprised normal medullar
haematopoiesis without maturation defects (n = 5 cases/6 biopsies; in one case bone
marrow biopsies from right and left crista iliaca had been taken for exclusion of
Ewing sarcoma infiltrates and both samples were analysed for intraindividual control)
and abdominal, cervical and lung lymph node samples (n = 3 cases/4 samples; in one
case two areas of an abdominal lymph node were analysed). Four control bone
marrows were placed at the corners and one control bone marrow and one lymph
node in the centre of the micro array; all other cases were randomly organised on the
Nature Medicine doi:10.1038/nm.2958

array. Immunohistochemistry was performed with a ZytoChem-Plus HRP Polymer kit
(Zytomed Systems, Berlin, Germany). Xylol-deparaffinised and re-hydrated FFPE-
sections (~3 µm) were pre-treated in an autoclave, incubation with peroxide (3% in
70% ethanol) and than blocking solution prior to over night-incubation in a humified
camber at 4°C with anti-HS1 monoclonal mouse antibody (1:25, BD Biosciences
Pharmingen, Franklin Lakes, NJ, USA). After visualization of immunostaining with
DAB sections were counterstained with haematoxylin. Analysis was performed in
duplicate and evaluation was performed separately according to the following scoring
system: - = no staining; + = weak staining; ++/+++ = strong staining; ++++ = very
strong staining/lymph node (pos. control).
Vitamin B3 treatment. We treated six healthy individuals with Vitamin B3
(Nicotinsäureamid, JENAPHARM, Germany; Zul.-Nr.: 3000282.00.00) doses 10
mg/kg/day for 7 days. Three persons were treated twice in two independent
experiments. Informed consent was obtained from all subjects. We obtained approval
for this study from the Hannover Medical School’s institutional review board.
Supplementary references
1. Gomez TS, McCarney SD, Carrizosa E, Labno CM, Comiskey EO, et al. HS1
functions as an essential actin-regulatory adaptor protein at the immune
synapse. Immunity. 24, 741-52 (2006).
2. Dull, T. et al. A third-generation lentivirus vector with a conditional
packaging system. J. Virol. 72, 8463-8471 (1998).
Nature Medicine doi:10.1038/nm.2958

Supplementary figures
Nature Medicine doi:10.1038/nm.2958

a
LEF-1-HA Tag
HAX1
IP: HA TagWB: HA Tag
IP: HA TagWB: HAX1
Supplementary Figure 1
Nature Medicine doi:10.1038/nm.2958

b
WB:HCLS1
inputG-CSF 0` 30`
WB:Syk
WB:Lyn
IP: HCLS1
HCLS1
Syk
* * Lyn
phHCLS1
G-CSF 0` 30`
ß-actin
a
Lyn
HCLS1
input
0` 30` G-CSF
Supplementary Figure 2
Nature Medicine doi:10.1038/nm.2958

b ctrlG-CSF
a
HC
LS1/
ß-a
ctin
m
RN
A r
atio
, AU
- NA+ NA
0
200
400
600
CD33+ cells
**
0
100
200
300
CD34+ cells
*
CD34+ cells
HC
LS1/
ß-a
ctin
m
RN
A r
atio
, AU
G-CSF
0
100
200
300
*
Nampt
*
Supplementary Figure 3
Nature Medicine doi:10.1038/nm.2958

60
90
HC
LS1/
ß-a
ctin
m
RN
A r
atio
, AU
**
ctrlCN
0
20
40
60
HA
X1/
ß-a
ctin
m
RN
A r
atio
, AU
G-CSF - + - + + +
MNctrlctrl INCN CN
20
30
HA
X1/
ß-a
ctin
m
RN
A r
atio
, AU
a
b
- G-CSF+ G-CSF
Supplementary Figure 4
0
30
HC
LS1/
ßm
RN
A r
atio
, AU
0
10
HA
X1/
ßm
RN
A r
atio
, AU
0
0,5
1,0
1,5
LEF
-1/ß
-act
in
mR
NA
rat
io, A
U
G-CSF - + - + + +
MNctrlctrl INCN CN
c- G-CSF+ G-CSF*
Nature Medicine doi:10.1038/nm.2958

a
G-CSF 0` 30`
heal
thy
indi
vidu
alC
Npa
tient
total HCLS1 / phospho-HCLS1
total HCLS1Isotype ctrl
phospho-HCLS1
b
30
cctrl shRNAanti-HAX1a shRNAanti-HAX1b shRNA
100
80
60
40
20
0100 101 102 103 104
FL2-H
80
60
40
20
0
100
100 101 102 103 104
FL2-H100
80
60
40
20
0
100
80
60
40
20
0100 101 102 103 104 100 101 102 103 104
FL2-HFL2-H
Supplementary Figure 5
0` 15`G-CSF 30`0
*
25
50
75
*100 ctrl shRNAHAX1 shRNA
0` 15` 30`
tubulin
HAX1
HA
X1/
ß-a
ctin
mR
NA
ratio
, AU
0
10
20
HAX1
30
* *
d
% o
f pH
CLS
1+ce
lls w
ithin
po
pula
tion
of H
CLS
1+ce
lls
Nature Medicine doi:10.1038/nm.2958

a
mockctrl shRNAanti-HCLS1b shRNAanti-HCLS1f shRNA
targ
et g
ene/
ß-a
ctin
mR
NA
ratio
, AU
0
20
40
60
TCF30
50
100
150
TCF4
+ G-CSF
targ
et g
ene/
ß-a
ctin
mR
NA
ratio
, AU
0
20
10
cyclin D1 survivin
30
40
+ G-CSF
** *
*
Supplementary Figure 6
mockctrl shRNAanti-HCLS1b shRNAanti-HCLS1f shRNA
targ
et g
ene/
ß-a
ctin
mR
NA
ratio
, AU
0
100
200
Nampt
b
0
10
20
30
SIRT1
+ G-CSF
0
25
50
C/EBPβ
Nature Medicine doi:10.1038/nm.2958

targ
et g
ene/
ß-a
ctin
mR
NA
ratio
, AU
0
40
20
60
80
*
*
mockctrl shRNAanti-HAX1a shRNAanti-HAX1b shRNA
*
*
targ
et g
ene/
ß-a
ctin
mR
NA
ratio
, AU
0
50
100
150
a
*
0
100
200
300
* *
Supplementary Figure 7
0cyclin D1 survivin
+ G-CSF
targ
et g
ene/
ß
0C/EBPα
0ELA2
+ G-CSF
Nature Medicine doi:10.1038/nm.2958

a
anti-HAX1a shRNAanti-HAX1b shRNA
0
15
30
HAX10
3
6
9
12
targ
et g
ene/
ß-a
ctin
m
RN
A r
atio
, AU
HCLS1
*
mockctrl shRNAanti-HCLS1b shRNAanti-HCLS1f shRNA
* * *
HAX1 HCLS1
b
Supplementary Figure 8
CFU-GM0
100
200
300
BFU-E
CF
Us
num
ber
+ IL-3, SCF, TPO, GM-CSF, G-CSF
mockctrl shRNAanti-HCLS1b shRNA
anti-HAX1a shRNAanti-HCLS1f shRNA
anti-HAX1b shRNA
CFU-G CFU-M
c
* * * ** * * *
ponceau ponceau
Nature Medicine doi:10.1038/nm.2958

- ATRA + ATRA
ctrl
sh
RN
AH
AX
1a
shR
NA
HA
X1b
shR
NA
HC
LS
1b
shR
NA
0.26 % 0.75 %
0.15 % 0.02 %
0.08 % 0.06 %
0.12 % 0.03 %
0.65 % 63.2 %
0.01 % 19.4 %
0.03 % 14.5 %
0.02 % 17.9 %
a
100
101
102
103
104
100 101 102 103 104
FL1-H: FL1-Height
FL2
-H: R
FP
100
101
102
103
104
FL2
-H: R
FP
100
101
102
103
104
FL2
-H: R
FP
100
101
102
103
104
FL2
-H: R
FP
100
101
102
103
104
FL2
-H: R
FP
100
101
102
103
104
FL2
-H: R
FP
100
101
102
103
104
FL2
-H: R
FP
100
101
102
103
104
FL2
-H: R
FP
100
101
102
103
104
FL2
-H: R
FP
100
101
102
103
104
FL2
-H: R
FP
100
101
102
103
104
FL2
-H: R
FP
100
101
102
103
104
FL2
-H: R
FP
103
104
H: R
FP 103
104
H: R
FP
103
104
H: R
FP 103
104
H: R
FP
100 101 102 103 104
FL1-H: FL1-Height100 101 102 103 104
FL1-H: FL1-Height100 101 102 103 104
FL1-H: FL1-Height
100 101 102 103 104
FL1-H: FL1-Height100 101 102 103 104
FL1-H: FL1-Height100 101 102 103 104
FL1-H: FL1-Height100 101 102 103 104
FL1-H: FL1-Height
100 101 102 103 104
FL1-H: FL1-Height100 101 102 103 104
FL1-H: FL1-Height100 101 102 103 104
FL1-H: FL1-Height100 101 102 103 104
FL1-H: FL1-Height
Supplementary Figure 9
isotype ctrl CD11b isotype ctrl CD11b
HC
LS
1b
shR
NA
HC
LS
1f
shR
NA
0.38 % 0.12 % 0.05 % 22.3 %
b
ctrl shRNAHCLS1b shRNA
HAX1a shRNAHCLS1f shRNA
HAX1b shRNA
0
35
70
% C
D11
b+ce
lls
+ ATRA- ATRA
* * **
cctrl shRNAHCLS1b shRNA
HAX1a shRNAHCLS1f shRNA
HAX1b shRNA
0
10
20
**
HAX1
targ
et g
ene/
ß-a
ctin
m
RN
A r
atio
, AU
HCLS1
*
*
0
15
30
100
101
102
10
FL2
-H: R
FP
100
101
102
FL2
-H: R
FP
100
101
102
103
FL2
-H: R
FP
100
101
102
10
FL2
-H: R
FP
100
101
102
103
104
FL2
-H: R
FP
100
101
102
103
104
FL2
-H: R
FP
100
101
102
103
104
FL2
-H: R
FP
100
101
102
103
104
FL2
-H: R
FP
100 101 102 103 104
FL1-H: FL1-Height100 101 102 103 104
FL1-H: FL1-Height100 101 102 103 104
FL1-H: FL1-Height100 101 102 103 104
FL1-H: FL1-Height
100 101 102 103 104
FL1-H: FL1-Height100 101 102 103 104
FL1-H: FL1-Height100 101 102 103 104
FL1-H: FL1-Height100 101 102 103 104
FL1-H: FL1-Height
Nature Medicine doi:10.1038/nm.2958

c
0
0.1
0.2
0.3
- G-CSF+ G-CSF
LEF-1 promoterwith mutated LEF-1 binding sites
x xxx x
LEF1 binding sitesx
LEF
-1 p
rom
oter
(RLU
)
0
0.1
0.2
0.3
LEF-1 shRNA
*
HCLS1
HAX1 shRNA
+
–
+
–
+–
+
+
–
b
LEF
-1 p
rom
oter
(RLU
)
0
0.1
0.2
0.3
LEF1HCLS1 shRNA
+ +
**
HAX1 shRNA
+ –
––
+ –
+
a
*
MU
T L
EF
-1 p
rom
oter
(RLU
)
Supplementary Figure 10
0
LEF1 – + –
HCLS1 – – +
+ + + –
–
+ vector+
+
+ LEF1 binding sitesx
MU
T L
EF
Nature Medicine doi:10.1038/nm.2958

a
C/EBPα promoter
LEF1 binding sites
CE
BP
A p
rom
oter
(RLU
)
LEF1
0
0.3
0.6
– + –
*
*
*
HCLS1LEF-1 HCLS1 bs MUT
––
––
+ –
+ + + –––
+ vector+ + –
+
- G-CSF+ G-CSF
––
+
+
*
CE
BP
A p
rom
oter
(RLU
)
0.3
0.6
*
b - G-CSF+ G-CSF
c
CE
BP
A p
rom
oter
(RLU
)
0.3
0.6
*
- G-CSF+ G-CSF
*
*
dnLEF-1 – – –– – +
–
+ –
+
+
– +
–
––
Supplementary Figure 11
CE
BP
A p
rom
oter
(RLU
)
LEF-1 shRNA
0
0.3
HCLS1
HAX1 shRNA
+ –
–
+
+
+–
– +
–
–
+
CE
BP
A p
rom
oter
(RLU
)
0
0.3
HCLS1 shRNAHAX1 shRNA
–
–
+ LEF1+ –– +
+ +–
–
+
d
CE
BP
A p
rom
oter
mut
LE
F-1
bs
(RLU
)
LEF1
0
0.3
0.6
– + –
HCLS1 – – +
+ + + –
–
+ vector
+
+
+
- G-CSF+ G-CSF
*
C/EBPα promoterx xx
Mut. LEF1 binding sitesx
Nature Medicine doi:10.1038/nm.2958

a
0.01
0.02
TOP promoter
*
*
c
-6.94E-1
0.006
0.012
0.018
*
*
+ + – +
+ + ––
+ LEF1
HCLS1
vector
LEF-1 binding site
0
0.025
0.05
0.075
0.1
+ + –
+ + ––
+ LEF-1
dnLEF-1
vector
– +–HCLS1
*
**
b
+ +
–+ +
––
+
– +––
–
*
LEF-1 binding site
LEF
-1 p
rom
oter
(RLU
)
LEF
-1 p
rom
oter
(RLU
)
TO
P r
epor
ter
(RLU
)
Supplementary Figure 12
0
LEF1 + + HCLS1 – +
+ + ––
+ vector
TOP promoter
C/E
BP
α/ß
-act
in
mR
NA
rat
io, A
U
LEF-1_ala16 cDNA
0
50
100
150
+ + +
** *
LEF-1a shRNA
LEF-1b shRNA ––
+–+
–
––
+
–
– + –– + –
–
+ +
d
LEF-1 cDNA
dnLEF-1 cDNA
– ––– +
+–
+
– –
– –
–
–– – –
–
+
–
–
–
–
*
LEF-1 binding site
TO
P r
epor
ter
Nature Medicine doi:10.1038/nm.2958

c
a
LEF-1
ß-actin
b
HCLS1 promoter
LEF-1 binding siteC/EBPα binding site
HC
LS1/
ß-a
ctin
mR
NA
ratio
, AU
0
25
50
75
ctrl shRNAanti-LEF-1a shRNA
*
HCLS1
d
anti-LEF-1b shRNA
*
0.3 *
0.1
0.2
0.1
0.2
0.3
293 cellseH
CLS
11 p
rom
oter
(RLU
)
MU
T H
CLS
1 pr
omot
er(R
LU)
LEF-1 b. s. 1 LEF-1 b. s. 2
ChIP
neg. ctrl for ChIP
0
0.01
0.02
0.03
LEF1 +–
*
f - G-CSF+ G-CSF
–
*
HCLS1 HCLS1x x
LEF1 binding sites Mut. LEF1 binding sitesx
0
0.01
0.02
0.03
LEF1 + ––LEF-1 shRNA + +
– ––––
+
*
–
HC
LS1
prom
oter
(RLU
)
HC
LS1
prom
oter
(RLU
)
LEF10
+ –0
LEF1 + –
HCLS1 HCLS1x x
LEF1 binding sites Mut. LEF1 binding sitesx
HC
LS11
pro
mot
er
MU
T H
CLS
1 pr
omot
er
Supplementary Figure 13
Nature Medicine doi:10.1038/nm.2958

a
0` 15`G-CSF 30`0
*25
50
75
pAkt
ser
473/
tota
l Akt
ratio
, %
*
0` 15` 30`
100
0` 15`G-CSF 30`0
*
25
50
75
pPI3
K p
85/to
tal P
I3K
p85
ratio
, %
*
0` 15` 30`
ctrlCN100
ctrlCN
b
Supplementary Figure 14
Nature Medicine doi:10.1038/nm.2958

2` 5`+ G-CSF 3`
- G-CSF+ G-CSF
23.4% 9.85%11.9%
b
HAX1 shRNActrl shRNAHCLS1 shRNA
ctrl shRNA
53.5%34.9%
F-actin F-actin
a
100 100 100
100
80
60
40
20
0
% o
f Max
100 101 102 103 104
FL3-H
100
80
60
40
20
0
% o
f Max
100101 102 103 104
FL3-H
Supplementary Figure 15
ctrl
shR
NA
HC
LS1
shR
NA
HA
X1
shR
NA
23.4% 9.85%11.9%
F-actin
80
60
40
20
0100 101 102 103 104
FL3-H
80
6040
20
0100 101 102 103 104
FL3-H
8060
40
20
0100 101 102 103 104
FL3-H100
80
60
40
20
0100 101 102 103 104
FL3-H
10080
6040
20
0100 101 102 103 104
FL3-H
10080
60
40
20
0100 101 102 103 104
FL3-H100
80
60
40
20
0100 101 102 103 104
FL3-H
100
80
60
40
20
0100 101 102 103 104
FL3-H
100
80
60
40
20
0100 101 102 103 104
FL3-H
Nature Medicine doi:10.1038/nm.2958

a
Lin-/c-Kit+/Sca1-
GMP
CMPMEP
CD34
Fc γγ γγ
RII/
III
Lin-/c-Kit+/Sca1-
Supplementary Figure 16
WTHCLS1-/-
GMP
CMP
MEPGMP
CMP
MEP
CD34
Fc γγ γγ
RII/
III
24.5 %
51.2 %19 %
18 %
62 %17.3 %
FL2
-H
100
101
102
103
104
100
101
102
103
104
100 101 102 103 104 100 101 102 103 104
FL2
-H
FL3-H FL3-H
WT3 cd34 fcg…FSC-H, SSC-H subset HS! 2 cd34 fcg…FSC-H, SSC-H subset
Nature Medicine doi:10.1038/nm.2958

a
0
40
80
120
WTHCLS1-/-
CFU-GM BFU-E
+ IL-3, SCF, TPO, GM-CSF, G-CSF
CFU-G CFU-M CFU-Mega
CF
Us
num
ber
*
**
Supplementary Figure 17
b
targ
et g
ene/
ß-a
ctin
mR
NA
ratio
, AU
0
5
10
15
C/EBPα
WTHCLS1-/-
0
10
20
*
LEF-1
*
C/EBPβ0
40
80
0
20
40
60
0
5
10
Nampt SIRT1
*
Nature Medicine doi:10.1038/nm.2958

b mockctrl shRNA
anti-LEF1a shRNA
anti-HCLS1b shRNAanti-HCLS1f shRNA
a
HC
LS1/
ß-a
ctin
mR
NA
ratio
, AU
ctrl CD33+ cells
0
100
200
400 *
300
AML
*
ctrl CD34+ cells
Supplementary Figure 18
targ
et g
ene/
ß-a
ctin
mR
NA
ratio
, AU
0
5
10
15
LEF-1
0
100
200
300
survivin
anti-LEF1a shRNA
0
50
100
150
cyclin D1
**
**
**
targ
et g
ene/
ß-a
ctin
mR
NA
ratio
, AU
0
20
40
60
HCLS1
***
**
**
*
*
*
anti-LEF1b shRNA
Nature Medicine doi:10.1038/nm.2958

Supplementary Figure Legends
Supplementary Figure 1. Overexpressed LEF-1 protein interacts with
endogenous HAX1 protein in 293T HEK cells
(a) HEK293T cells were transfected with pcDNA-HCLS1 and pcDNA-LEF-1-HA-
Tag (LEF-1-HA WT). 36 hours after transfection, cells were lysed and LEF-1 protein
was immunoprecipitated with protein G agarose beads conjugated with anti-HA-Tag
antibody. Co-immunoprecipitation of overexpressed LEF-1 and endogenous HAX1
proteins was detected by WB. Representative WB image is depicted.
Supplementary Figure 2. HCLS1 co-immunoprecipitated with Lyn and Syk in
bone marrow CD34+ cells
(a) We treated CD34+ bone marrow cells from two healthy individuals (ctrl) with 10
ng/ml of G-CSF, at indicated time points, we lysed cells in Laemmli buffer and
analysed phospho-HCLS1 protein and ß-actin expression by WB. Representative WB
image of phHCLS1 protein and ß-actin of cells of one healthy individual.
(b) CD34+ cells were treated or not with 10 ng/ml of G-CSF; endogenous HCLS1
protein was immunoprecipitated from cell lysates with rabbit polyclonal anti-HCLS1
antibody; interaction with endogenous Lyn and Syk proteins was detected by Western
blot (WB) analysis with mouse monoclonal anti-Lyn and mouse monoclonal anti-Syk
antibody; upper panel: representative WB image is depicted, isotype control was
negative and therefore is not presented. Lower panel: Representative image of Lyn
and HCLS1 inputs for IP are presented.
Supplementary Figure 3. Nicotinamide (NA, vitamin B3) and Nampt induce
HCLS1 mRNA expression in hematopoietic cells
(a) We treated 3 healthy individuals with Vitamin B3 (nicotinamide, NA) (10
mg/kg/day) for one week and measured mRNA expression of HCLS1 in bone marrow
CD34+ and CD33+ cells quantified by qRT-PCR and normalized to ß-actin on day 3
of Vitamin B3 treatment, data represent means ± s.d. of triplicates, *, P < 0.05. (b)
We treated CD34+ cells of healthy individuals (n = 3) with 10 ng/ml of G-CSF or 10
ng/ml of Nampt for 24 hours. HCLS1 mRNA expression is normalized to ß-actin and
is presented as arbitrary units (AU). Data represent means ± s.d. and are derived from
three independent experiments each in triplicates (*, P < 0.05).
Nature Medicine doi:10.1038/nm.2958

Supplementary Figure 4. Diminished HCLS1 and unaffected HAX1 mRNA
expression in myeloid cells of CN patients
(a) HAX1 mRNA expression in CD33+ cells of studied groups: eight CN patients
harbouring HAX1 mutations, three patients with neutropenia associated with
congenital disorders of metabolism (MN) and three healthy G-CSF-treated individuals
(ctrl), HAX1 mRNA expression is normalized to ß-actin and is presented as arbitrary
units (AU), data represent means ± s.d. of triplicates. (b) We isolated myeloblasts and
promyelocytes from bone marrow slides of G-CSF treated CN patients harbouring
HAX1 mutations (n = 3) and G-CSF treated healthy individuals (n = 3) using the
PALM Laser-MicroBeam System. For qRT-PCR we isolated RNA using TRIZOL
reagent (Invitrogen), amplified cDNA using random hexamer primer (Fermentas) and
measured HCLS1 and HAX1 mRNA expression using SYBR green qPCR kit
(Qiagen). Target gene mRNA expression was normalized to ß-actin and was
represented as arbitrary units (AU). Data represent means ± s.d. and are derived from
triplicates, *, P < 0.05. (c) LEF-1 mRNA expression in CD33+ cells of studied
groups: eight CN patients harbouring HAX1 mutations, three patients with
neutropenia associated with congenital disorders of metabolism (MN) and three
healthy G-CSF-treated individuals (ctrl), LEF-1 mRNA expression is normalized to ß-
actin and is presented as arbitrary units (AU), data represent means ± s.d. of triplicates
(*, P < 0.05).
Supplementary Figure 5. Defective phosphorylation of HCLS1 in response to G-
CSF in CD 33+ cells of CN patients and in CD34+ cells of healthy individuals
transduced with HAX1 shRNA
(a) We treated CD33+ bone marrow cells of two healthy individuals (ctrl) and two CN
patients (CN) with 10 ng/ml of G-CSF, at indicated time points, we harvested, fixed,
permeabilized cells and quantified amounts of intracellular total- and phospho-
HCLS1 protein using immunostaining and FACS analysis. Representative histogram
is depicted. (b-d) We transduced CD34+ cells of healthy individuals (n = 3) with ctrl-
RFP shRNA or two different anti-HAX1-RFP shRNAs, sorted RFP+ cells on day 4 of
culture, we measured: (b) HAX1 mRNA expression levels by real-time qRT-PCR
(HAX1 mRNA expression is normalized to ß-actin and is presented as arbitrary units
(AU). Data represent means ± s.d. and are derived from three independent
experiments each in triplicates (*, P < 0.05) and (c) HAX1 protein levels by WB
Nature Medicine doi:10.1038/nm.2958

(representative WB image is depicted); (d) We treated sorted cells with 10 ng/ml of
G-CSF, at indicated time points, we harvested, fixed, permeabilized cells and
quantified amounts of cells positive for intracellular total- and phospho-HCLS1
protein using immunostaining and FACS analysis. Percentage of phosphoHCLS1
positive cells within population of total HCLS1 protein positive cells is represented.
Data represent means ± s.d. and are derived from three independent experiments each
in duplicate (*, P < 0.05).
Supplementary Figure 6. HCLS1 is required for LEF-1-target genes mRNA
expression, but not for mRNA expression of components of Nampt signaling
(a, b) We transduced CD34+ cells from healthy individuals (n = 3) with two different
constructs of anti-HCLS1 shRNA, or ctrl shRNA contained RFP, sorted RFP+ cells,
treated sorted cells with 10 ng/ml of G-CSF for 12 hours and measured mRNA
expression of indicated genes using qRT-PCR. mRNA expression is normalized to ß-
actin and is presented as arbitrary units (AU). Data represent means ± s.d. and are
derived from three independent experiments each in triplicate, *, P < 0.05. Effects of
HCLS1 shRNA on HCLS1 inhibition are represented in Fig. 2d.
Supplementary Figure 7. HAX1 is required for LEF-1-target genes mRNA
expression
(a) We transduced CD34+ cells from healthy individuals (n = 3) with two different
constructs of anti-HAX1 shRNA or ctrl shRNA contained RFP, sorted RFP+ cells,
treated sorted cells with 10 ng/ml of G-CSF for 12 hours and measured mRNA
expression of indicated genes using qRT-PCR. mRNA expression is normalized to ß-
actin and is presented as arbitrary units (AU). Data represent means ± s.d. and are
derived from three independent experiments each in triplicate, *, P < 0.05. Effects of
HAX1 shRNA on HAX1 inhibition are represented in Suppl. Fig. 4b,c.
Supplementary Figure 8. HCLS1 and HAX1 are involved in myeloid
differentiation in vitro
We transduced CD34+ cells from healthy individuals (n = 3) with two different anti-
HCLS1 shRNAs or two different anti-HAX1 shRNAs and ctrl shRNA constructs
contained RFP and sorted RFP+ cells. (a) HCLS1 and HAX1 mRNA expression
levels were measured by real-time qRT-PCR (data represent means ± s.d. and are
Nature Medicine doi:10.1038/nm.2958

derived from three independent experiments each in duplicate, *, P < 0.05) and (b)
HCLS1 and HAX1 protein levels were assessed by WB (representative WB image is
depicted). (c) We performed CFUs assay of transduced and sorted cells, as described
in Materials and Methods. Data represent means ± s.d. and are derived from two
independent experiments each in duplicate, *, P < 0.05.
Supplementary Figure 9. HCLS1 and HAX1 are required for ATRA-triggered
myeloid differentiation of the promyelocytic cell line NB4
We transduced the promyelocytic cell line NB4 with two different anti-HCLS1
shRNAs or two different anti-HAX1 shRNAs and ctrl shRNA constructs contained
RFP and sorted RFP+ cells and treated or not with 0.1 mM of ATRA. On day 2 of
stimulation, we measured CD11b surface expression in RFP+ cells using FACS.
Representative FACS images are depicted in (a), % of CD11b+ cells is shown in (b).
Data represent means ± s.d. and are derived from two independent experiments each
in duplicate (*, P < 0.05). (c) mRNA expression levels of HCLS1 and HAX1 in
transduced and sorted NB4 cells, were measured by real-time qRT-PCR (data
represent means ± s.d. and are derived from three independent experiments each in
triplicate, *, P < 0.05).
Supplementary Figure 10. LEF-1-, HCLS1- and HAX1- dependent activation of
the LEF-1 gene promoter
(a) We measured the effects of LEF-1 on G-CSF- dependent activation of the LEF-1
gene promoter in CD34+ cells of healthy individuals (n = 3) transfected with cDNA of
LEF-1 cDNA in the presence or absence of HCLS1-, or HAX1 shRNA. Data
represent means ± s.d. and are derived from three independent experiments each in
triplicate, *, P < 0.05. (b) We measured the effects of HCLS1, HAX1 and LEF-1 on
G-CSF- dependent activation of the LEF-1 gene promoter in CD34+ cells of healthy
individuals (n = 3) transfected with cDNA of HCLS1 in the presence or absence of
LEF1-, or HAX1 shRNA. Performance of the reporter gene assay is described in
Materials and Methods. Data represent means ± s.d. and are derived from three
independent experiments each in triplicate, *, P < 0.05. (c) We measured the effects
of HCLS1 and LEF-1 on G-CSF-dependent activation of LEF-1 gene promoter with
mutated LEF-1 binding sites in CD34+ cells of healthy individuals (n = 3) transfected
with LEF-1 cDNA, or HCLS1 cDNA, or combination of both. Data represent means
Nature Medicine doi:10.1038/nm.2958

± s.d. and are derived from three independent experiments each in triplicate.
Schematic presentation of promoter construct with five mutated LEF-1 binding sites
(pink cycles). Performance of the reporter gene assay is described in Materials and
Methods.
Supplementary Figure 11. LEF-1- and HCLS1-dependent activation of C/EBPαααα
gene promoter
(a) We measured the effects of HCLS1 on G-CSF- and LEF-1/ß-catenin- dependent
activation of C/EBPα gene promoter in CD34+ cells of healthy individuals (n = 3)
transfected with HCLS1 cDNA in combination with LEF-1 cDNA (LEF-1), or LEF-1
with mutated HCLS1 binding site (LEF-1_HCLS1_bs_MUT) or dominant negative
LEF-1 (dnLEF-1). Data represent means ± s.d. and are derived from three
independent experiments each in triplicate, *, P < 0.05. (b) We assessed the effects of
HCLS1 on C/EBPα gene promoter activation after inhibition of LEF-1 or HAX1
using specific anti-LEF-1 or anti-HAX1 shRNA constructs. Data represent means ±
s.d. and are derived from three independent experiments each in triplicate, *, P <
0.05. (c) We analysed the effects of LEF-1 on C/EBPα gene promoter activation after
inhibition of HCLS1 or HAX1 using specific anti-HCLS1 or anti-HAX1 shRNA
constructs. Data represent means ± s.d. and are derived from three independent
experiments each in triplicate, *, P < 0.05. (d) We measured the effects of HCLS1 on
G-CSF-dependent activation of C/EBPα gene promoter with mutated LEF-1 binding
sites in CD34+ cells of healthy individuals (n = 3) transfected with LEF-1 cDNA in
combination with HCLS1 cDNA. Data represent means ± s.d. and are derived from
three independent experiments each in triplicate. On the left side of the Figures (a)
and (c) are schematic presentations of C/EBPα gene promoter construct with LEF-1
binding sites (pink cycles). Performance of the reporter gene assay is described in
Materials and Methods.
Supplementary Figure 12. LEF-1- and HCLS1-dependent activation of the LEF-
1 gene promoter as well as of C/EBPαααα mRNA expression
We measured the effects of HCLS1 on LEF-1- and dnLEF-1- dependent activation of
the LEF-1 reporter gene (a,b), or TOP reporter (c) in HEK 293 cells, as described in
Materials and Methods. Data represent means ± s.d. and are derived from three
Nature Medicine doi:10.1038/nm.2958

independent experiments each in triplicate, *, P < 0.05; bottom lines: schematic
representation of promoter constructs, TOP promoter contains six and LEF-1
promoter five LEF-1/TCF binding sites (pink cycles). (d) We transduced CD34+ cells
of healthy individuals (n = 3) with two different anti-LEF-1 shRNAs in combination
with LEF-1 cDNA, or dnLEF-1 cDNA, or LEF-1_HCLS1_MUT cDNA, sorted RFP+
cells on day 4 of culture and measured C/EBPα mRNA expression using qRT-PCR.
mRNA expression is normalized to ß-actin and is presented as arbitrary units (AU).
Data represent means ± s.d. and are derived from three independent experiments each
in triplicate, *, P < 0.05.
Supplementary Figure 13. Feed-back regulation of HCLS1 by LEF-1
(a, b) We transduced CD34+ cells of healthy individuals (n = 3) with anti-LEF-1-RFP
shRNA, or ctrl-RFP shRNA, sorted RFP+ cells and assessed: (a) HCLS1 mRNA
expression levels by real-time qRT-PCR, data represent means ± s.d. and are derived
from three independent experiments each in triplicate, *, P < 0.05; (b) HCLS1 and
LEF-1 protein levels by WB, representative WB images are presented; (c) putative
LEF-1 binding sites (depicted in pink) and C/EBPa binding sites (depicted in blue)
were mapped on the 5400 bp HCLS1 promoter, using Genomatix Software; (d)
chromatin immunoprecipitation (ChIP) assay of nuclear extracts of CD33+ bone
marrow cells using rabbit polyclonal anti-LEF-1 antibody; PCR products were
amplified using primer pairs flanking two LEF1 binding sites (LEF-1 b.s. 1 and LEF-
1 b.s. 2) of the HCLS1 gene promoter and a primer pair for negative control of ChIP
reaction (neg. ctrl for ChIP), as described in Materials and Methods. No Ab, no
antibody; isotype, isotype antibody control; anti-LEF-1, IP with anti-LEF-1 antibody;
(e) We measured the effects of LEF-1 on activation of the HCLS1 reporter gene
constructs in HEK 293 cells transfected or not with LEF-1 cDNA. Performance of the
reporter gene assay is described in Materials and Methods. Data represent means ±
s.d. and are derived from three independent experiments each in triplicate, *, P <
0.05; Schematic presentation of promoter construct with two LEF-1 binding sites
(pink cycles); (f) We measured the effects of LEF-1 on G-CSF-dependent activation
of HCLS1 gene promoter in CD34+ cells of healthy individuals (n = 3) transfected or
not with LEF-1 cDNA, or with LEF1 shRNA. Performance of the reporter gene assay
Nature Medicine doi:10.1038/nm.2958

is described in Materials and Methods. Data represent means ± s.d. and are derived
from three independent experiments each in triplicate, *, P < 0.05.
Supplementary Figure 14. Severely diminished levels of phospho-PI3K p85 (Tyr
458) and of phospho-Akt (Ser 473) in CD34+ cells of CN patients, as compared to
healthy individuals.
We treated or not CD34+ cells of healthy individuals (n = 3) or of CN patients (n = 3)
with 10 ng/ml of G-CSF. At indicated time points, we harvested, fixed, permeabilized
cells and quantified amounts of (a) intracellular total PI3K p85 and phospho-PI3K
p85 (Tyr 458) and of (b) total Akt and phospho-Akt (Ser473) using immunostaining
and FACS analysis. Percentage of phospho- to total protein positive cells is
represented. Data represent means ± s.d. and are derived from two independent
experiments each in duplicate (*, P < 0.05).
Supplementary Figure 15. HCLS1 and HAX1 control F-actin rearrangement in
response to G-CSF
(a) We transduced CD34+ cells of healthy individuals (n = 3) with anti-HCLS1-RFP
shRNA, anti-HAX1-RFP shRNA or ctrl-RFP shRNA, sorted RFP+ cells, subsequently
fixed, permeabilized and stained RFP+ cells with phalloidin for one hour at 4 °C and
assessed intracellular F-actin amount in RFP+ cells by FACS. Representative
histograms showing F-actin staining are depicted; (b) We treated transduced and
sorted HCLS1-RFP+, HAX1-RFP+ or ctrl-RFP+ cells with 10 ng/ml of G-CSF for
indicated time points, subsequently fixed, permeabilized and stained cells with
phalloidin for one hour at 4 °C and assessed intracellular F-actin amount in RFP+ cells
by FACS. Representative histograms showing F-actin staining are depicted.
Supplementary Figure 16. FACS analysis of myeloid cells in bone marrow of
HCLS1-/- and WT mice
We harvested bone marrow cells from the long bones of WT (n = 4) and HCLS1-/- (n
= 4) mice using ice-cold PBS. After subsequent Ficoll gradient centrifugation, cells
were stained with appropriate antibodies and analysed by FACS. Representative
FACS images of the myeloid compartment in HCLS1-/- and WT mice: we gaited
lineage-negative (neg for CD3, CD4, CD8, CD19, B220, Gr-1), c-kit positive, sca-1
negative (LSK) bone marrow cells and assessed FcgRII/III and CD34 expression
Nature Medicine doi:10.1038/nm.2958

within LSK cells. Upper gate: CD34+/FcgRII/IIIhi granulocyte/macrophage
progenitors (GMP); middle gate: CD34+/FcgRII/IIIlow common myeloid progenitors
(CMP); bottom gate: CD34-/FcgRII/III- megakaryocyte/erythrocyte progenitors
(MEP). Percentage of total bone marrow cells is presented.
Supplementary Figure 17. Defective LEF-1-dependent granulopoiesis in HCLS1-
/- mice
(a) We performed CFUs assay using bone marrow of HCLS1-/- (n = 4) and WT mice
(n = 4) as described in materials and methods. Data represent means ± s.d. and are
derived from three independent experiments each in duplicate, *, P < 0.05, **, P <
0.01. (b) We isolated mRNA from CFU-G cells of of HCLS1-/- (n = 3) and WT (n =
3) mice and measured mRNA expression of indicated genes by real-time PCR;
mRNA expression is normalized to ß-actin and is presented as arbitrary units (AU).
Data represent means ± s.d. and are derived from three independent experiments each
in triplicate, *, P < 0.05.
Supplementary Figure 18. HCLS1 mRNA expression is dramatically elevated in
primary blasts of AML patients and effects of the inhibition of HCLS1 or LEF-1
on LEF-1 target genes mRNA expression in primary blasts of AML patients
(a) We measured HCLS1 mRNA expression levels in primary blasts of 10 patients
with AML by real-time qRT-PCR. mRNA expression is normalized to ß-actin and is
presented as arbitrary units (AU). Data represent means ± s.d. and are derived from
three independent experiments each in triplicate, *, P < 0.05. (b) We transduced blasts
of patients with AML (n = 3) with two different constructs of anti-HCLS1 shRNA, or
anti-LEF-1 shRNA or ctrl shRNA contained RFP, sorted RFP+ cells and measured
mRNA expression levels of indicated genes by real-time qRT-PCR. mRNA
expression is normalized to ß-actin and is presented as arbitrary units (AU). Data
represent means ± s.d. and are derived from three independent experiments each in
triplicate, *, P < 0.05.
Nature Medicine doi:10.1038/nm.2958

Supplementary tables 2, 3, 4, 5
Nature Medicine doi:10.1038/nm.2958
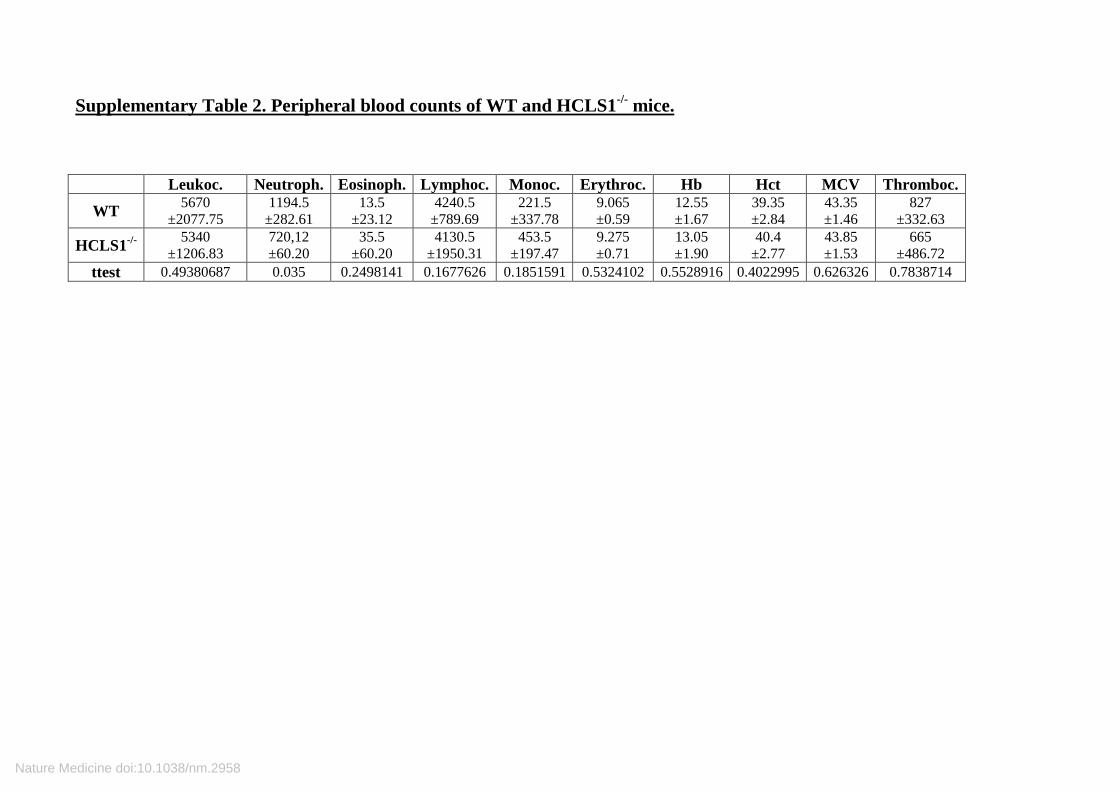
Supplementary Table 2. Peripheral blood counts of WT and HCLS1-/- mice.
Leukoc. Neutroph. Eosinoph. Lymphoc. Monoc. Erythroc. Hb Hct MCV Thromboc.
WT 5670
±2077.75 1194.5 ±282.61
13.5 ±23.12
4240.5 ±789.69
221.5 ±337.78
9.065 ±0.59
12.55 ±1.67
39.35 ±2.84
43.35 ±1.46
827 ±332.63
HCLS1-/- 5340 ±1206.83
720,12 ±60.20
35.5 ±60.20
4130.5 ±1950.31
453.5 ±197.47
9.275 ±0.71
13.05 ±1.90
40.4 ±2.77
43.85 ±1.53
665 ±486.72
ttest 0.49380687 0.035 0.2498141 0.1677626 0.1851591 0.5324102 0.5528916 0.4022995 0.626326 0.7838714
Nature Medicine doi:10.1038/nm.2958

Supplementary Table 3.AML patients characteristics and intensity of HCLS1 expression in tissue microarrays
Diagnosis Karyotype Gender Age Bone marrow blasts, %
Intensity of HCLS1 protein staining in
BM blasts
M0 46,XX,t(1;11)(q25;q23),-7,+r 13/46,XX 2 F 58 95 +++
M0 47,XX,+13 2/46,XX 14. F 57 95 +++
M0 92,XXX,-X,+13 5/50,XX,+X,+4,+8,+21 2/46,XX 14. F 61 80 +++
M0 46,XX [25]. F 44 90 ++
post-MDS AML M0 46,XX,t(4;12)(q11;p13) [22]. F 39 80 ++
M0 46,XX [25]. F 34 80 +++
M0 unknown unkn. unkn. <5 ++
M0 44,XY, del(5)(q15),-7,-16,13/46,XY M 69 unknown ++
M0 unknown F 44 unknown +++
M1 48-49,XX,+6,+8,der9,-21,+mar1-4 [4]/46,XX[13]. F 54 90 +++
M1 46,XY, t(1;7)(p34;q33), t(8;21)(q22;q22) 10/46,XY 7. M 74 80 ++
M1 45,XX,t(3;4)(q26;q2?6),-7,inv(9)(p11q13)c 15. F 56 90 +++
M1 46,XY[15]. M 72 80 ++
Nature Medicine doi:10.1038/nm.2958

M1 47,XY,+9 13/46,XY 2. M 70 50 +++
M1 46,XX F 50 unknown +++
M1 46,XY M 48 unknown +++
M1 46,X,t(X;3)(q25?,p11), 2/46,X,idem…. F 30 unknown ++
M2 43,XY,-3,der(5)add(5)(p12)t(5;5)(p12;q33),add(6)(p23),-7,?del(11) (q23),-20, dic(20;21)(q11;p12) [18]/46,XY [2]. M 62 unknown -
M2 46,XY [25]. M 64 70 ++
M2 45,XY,-13 4/46,XY 20. M 75 35 +
M2 46,XY,t(10;11)(p13;q14 21) 11/46,XY 5. M 19 90 +++
M2 46,XX F 61 unknown +++
M2 46,XY M 58 unknown +++
M2 46,XX F 43 unknown +++
M2 46,XY M 84 unknown +++
M4 46,XY M 55 unknown ++
M4 unknown M 46 >20 ++
M4 46,XY,del(11)(p11p13),inv(16)(p13q22) 25/47,XY,idem,+8 2. M 56 95 +++
M4eo unknown M 67 55 +
Nature Medicine doi:10.1038/nm.2958

M4eo unknown M 66 30 ++
M4eo 46,XY,inv(16)(p13q22),+22 18/46,idem,idic(22)(p11),-22 2/46,idem,-22 1 M 62 >20 +
M4eo 46,XY,inv(16)(p13q22) 14/46,XY 11 M 32 90 ++
M4 46,XX,der(2)t(2;11)(q22;q14)?add(11)(q24),t(16;16)(p13;q22) [15] F 23 90 +++
M4 48,XY, add(5)(q14), ?t(6;11)(q27;q23), del(16)(p11), +21, M 44 unknown +++
M4 45,XY, -7, Monosomie 7 M 51 unknown +++
M4 46,XY M 56 unknown +++
M4 46,XX F 58 unknown ++
M5 46,XX [20]. F 51 95 +++
M5 46,XX F 47 unknown +++
M5a unknown unkn. unkn. unknown +
M5a 46,XX [25]. F 61 90 ++
M5b 46,XX [25]. F 69 70 +++
M5b 46,XX [16]. F 66 55 +++
M5b 47,XX,+8 1/46,XX 19 F 74 90 +++
M5b 46,XX F 75 unknown +++
Nature Medicine doi:10.1038/nm.2958

M5a 45,XX, -7 F 61 unknown +++
M6a unknown M 55 >20 +
M6a unknown M 60 >20 +++
post-MDS AML 41-48XY aberrant 3, -5,-6,+11,-12,-13 aberrant 14, +1 M 57 unknown ++
post-MDS AML 45-46,Xydel(3),-5 aberrant 7,9,-13,21,+21,t(8;11) M 74 unknown ++
post-MDS AML 46,XY M 77 unknown ++
post-MDS AML 44,X,-Y,add(2)(q34),-12 M 62 unknown +++
Nature Medicine doi:10.1038/nm.2958

Supplementary Table 4.Expression of cytokines and cytokine receptors in AML blasts from public databases
Data set 1 GSE1729http://www.ncbi.nlm.nih.gov/geo/query/acc.cgi?acc=GSE1729
GeneSymbol probeset_ID param Fval p-val p-val.adjCSF3 207442_at Karyotype 6.740835689 1.65E-05 9.31E-05MPL 207550_at Karyotype 15.75020219 5.48E-09 4.25E-08EPOR 209962_at Karyotype 3.212466038 0.004384945 0.016991663EPOR 209963_s_at Karyotype 2.418211588 0.022731502 0.07417648MPL 216825_s_at Karyotype 2.7192153 0.011956917 0.041184936EPOR 37986_at Karyotype 3.781446581 0.001490804 0.007702486
Data set 1 GSE1729http://www.ncbi.nlm.nih.gov/geo/query/acc.cgi?acc=GSE1729
GeneSymbol probeset_ID param Fval p-val p-val.adjCSF3R 203591_s_at FAB.WHO 3.624650711 0.004850853 0.021482349EPOR 209962_at FAB.WHO 7.98483222 8.80E-06 5.46E-05EPOR 209963_s_at FAB.WHO 7.0868934 2.77E-05 0.000156067EPOR 215054_at FAB.WHO 4.217561471 0.001825108 0.009429725EPOR 216999_at FAB.WHO 3.40148799 0.007078019 0.027427324EPOR 37986_at FAB.WHO 10.03434177 8.17E-07 6.33E-06EPO 217254_s_at FAB.WHO 3.900318986 0.003064263 0.014614176
Data set 2 GSE9476http://www.ncbi.nlm.nih.gov/geo/query/acc.cgi?acc=GSE9476
GeneSymbol probeset_ID param Fval p-val p-val.adjEPO 207257_at FLT3_ITD 5.413039736 0.011843388 0.054141204CSF3 207442_at FLT3_ITD 5.238869247 0.013340583 0.056919822EPOR 209963_s_at FLT3_ITD 4.422716217 0.023704341 0.084282101TPO 210342_s_at FLT3_ITD 6.022128682 0.007884537 0.042050866MPL 216825_s_at FLT3_ITD 8.594821799 0.001631388 0.010440885EPOR 216999_at FLT3_ITD 5.839249444 0.008895631 0.043793878
Data set 2 GSE9476http://www.ncbi.nlm.nih.gov/geo/query/acc.cgi?acc=GSE9476
GeneSymbol probeset_ID param Fval p-val p-val.adjEPOR 209962_at aml 2.470916665 0.057784563 0.176105335TPO 210342_s_at aml 2.412645021 0.062616381 0.182156746MPL 211903_s_at aml 3.198583323 0.022029413 0.082934262EPOR 37986_at aml 6.909845027 0.000448428 0.002207647EPOR 396_f_at aml 2.864195149 0.03400293 0.120899305
Data set 3 GSE17855http://www.ncbi.nlm.nih.gov/geo/query/acc.cgi?acc=GSE17855
GeneSymbol probeset_ID dep Fval p-val p-val.adjCSF3R 1553297_a_at karyotype 14.64739264 9.77E-16 6.66E-15CSF3R 203591_s_at karyotype 14.57918633 1.14E-15 6.68E-15MPL 207550_at karyotype 13.68382674 9.16E-15 4.91E-14EPOR 209962_at karyotype 3.885942457 0.000507697 0.001010326TPO 210342_s_at karyotype 2.144506009 0.040079994 0.053678564MPL 211903_s_at karyotype 3.937070914 0.000444442 0.000925921EPOR 215054_at karyotype 3.314382018 0.002221146 0.003874092MPL 216825_s_at karyotype 3.497965943 0.001386359 0.002536022EPOR 37986_at karyotype 2.742171075 0.00942085 0.014720077EPOR 396_f_at karyotype 7.63683026 2.77E-08 7.69E-08
Nature Medicine doi:10.1038/nm.2958

Data set 4 GSE13159http://www.ncbi.nlm.nih.gov/geo/query/acc.cgi?acc=GSE13159Gene probeset_ID param Fval p-val p-val.adjCSF3R 203591_s_at leukemia_class 6.091798729 0.014336512 0.034305226KIT 205051_s_at leukemia_class 35.99080484 7.98E-09 5.34E-08EPOR 396_f_at leukemia_class 38.93745324 2.19E-09 1.63E-08MPL 207550_at leukemia_class 5.402500921 0.021011631 0.048544113EPOR 215054_at leukemia_class 67.7921504 1.55E-14 2.08E-13EPOR 37986_at leukemia_class 57.46026308 9.29E-13 8.90E-12EPOR 209963_s_at leukemia_class 66.41570917 2.65E-14 2.96E-13EPOR 209962_at leukemia_class 74.66373288 1.11E-15 1.86E-14CSF3 207442_at leukemia_class 3.418986398 0.065780102 0.12592191MPL 216825_s_at leukemia_class 4.157811832 0.042627775 0.089251904
Nature Medicine doi:10.1038/nm.2958

Supplementary Table 5. Frequency of Pro-Glu-Pro-Glu insertion in HCLS1
protein in AML patients
Pro-Glu-Pro-Glu insertion AML Patients Controls OR P*
Genotype frequency 0.0001389
Pro-Glu-Pro-Glu -/- 46 (34,1 %) 63 (60,5 %) 0,56
Pro-Glu-Pro-Glu +/- 83 (61,5 %) 39 (37,5 %) 1,64
Pro-Glu-Pro-Glu +/+ 6 (4,4 %) 2 (1,9 %) 2,31
Allele frequency 0.0005313
Pro-Glu-Pro-Glu - 175 (64,8 %) 165 (79 %) 0,82
Pro-Glu-Pro-Glu + 95 (35,2 %) 43 (21,5 %) 1,7
OR = odds ratio.
* Distribution in patients versus controls, by chi-square test.
Nature Medicine doi:10.1038/nm.2958


![-- T.Y.B.Com. [2014 - 2015]mithibai.ac.in/Common/Uploads/TabbedContentTemplate... · 40311120797 nandani kshama raj iv preeti ... 40311121027 pamecha nikhil rakesh pushpa 40311128270](https://static.fdocuments.net/doc/165x107/5a9002ec7f8b9ac87a8e73c5/-tybcom-2014-2015-nandani-kshama-raj-iv-preeti-40311121027-pamecha.jpg)
