
Supplementary Information for Investors and Analysts Information for Investors and Analysts Second...
78
Investor Relations Supplementary Information for Investors and Analysts Second quarter 2003 (Unaudited)
Transcript of Supplementary Information for Investors and Analysts Information for Investors and Analysts Second...

Investor Relations
Supplementary Information for Investors and Analysts
Second quarter 2003(Unaudited)

Chief Executive Officer
Svein Aaser
For further information, please contact
Tom Grøndahl, Chief Financial Officer [email protected] +47 2248 2922
Per Sagbakken, Head of Investor Relations [email protected] +47 2248 2072
Jan Erik Gjerland, Investor Relations [email protected] +47 2294 9969
Halfdan Bakøy, Group Financial Reporting [email protected] +47 2248 1071
Kristine L. Njaastad, Secretary, Investor Relations [email protected] +47 2248 2613
Address
DnB Holding ASA, Stranden 21, N-0021 Oslo
Visiting address: Stranden 21 (Bryggetorget), Aker Brygge, Oslo
e-mail Investor Relations: [email protected]
Telefax Investor Relations: +47 2248 2035
DnB switchboard: +47 2248 1050
Information on the Internet
DnB’s Investor Relations English page www.DnB.no/ir
DnB’s Investor Relations Norwegian page www.DnB.no/ir/no
DnB’s home page www.DnB.no
Third quarter 30 October
Annual general meeting 24 April
Ex-dividend date 25 April
Payment of dividend 15 May
Extraordinary general meeting 19 May
Financial calendar 2003

Second quarter 2003
DnB Group 3
Contents Page
1. DnB - an overview 5 Financial highlights .................................................................................... 6 DnB - Norway's leading financial services group ...................................... 7 Credit ratings ............................................................................................. 7 Accounting changes and other adjustments ............................................. 8 2. Financial results DnB Group 9
Financial highlights .................................................................................. 11 Profit and loss accounts .......................................................................... 12 Net interest income.................................................................................. 13 Net other operating income ..................................................................... 15 Net commissions and fees on banking services ..................................... 17 Net gain on financial instruments ............................................................ 18 Sundry operating income ........................................................................ 20 Operating expenses ................................................................................ 21 Losses and reversals on loans and guarantees ..................................... 24 Asset quality ............................................................................................ 25 Total assets owned or managed by the DnB Group ............................... 27 Lending to principal sectors..................................................................... 28 Customer savings.................................................................................... 30 Capital adequacy and taxes ................................................................... 31 Financial results DnB Group ................................................................... 32 Key figures............................................................................................... 34 3. DnB Group and business areas 37 Group strategy......................................................................................... 38 Legal structure......................................................................................... 39 Group structure........................................................................................ 40 Business areas ........................................................................................ 41 - Corporate Banking ........................................................................... 43 - Retail Banking .................................................................................. 49 - Capital markets ................................................................................ 53 - Life Insurance - Vital ........................................................................ 56 - Asset management .......................................................................... 62 - Nordlandsbanken ............................................................................. 66 4. Shareholder information 69 Equity-related data ................................................................................. 70 Shareholder structure.............................................................................. 71 5. The Norwegian economy 73 6. DnB NOR Group 77

Second quarter 2003
4 DnB Group
DnB Group 5
Section 1
DnB - an overview

1. DnB - an overview Second quarter 2003
6 DnB Group
Financial highlights
Sound income growth and improved return on equity • Total income up 23 per cent to NOK 3 573 million (2 917)
• Ordinary cost/income ratio before goodwill amortisation: 56.1 per cent (65.4)
• Pre-tax operating profits before losses up 61 per cent to NOK 1 478 million (918)
• Net losses on loans and guarantees etc.: NOK 560 million (87)
• Profits for the period rose to NOK 883 million (412)
• Earnings per share before goodwill amortisation: NOK 1.26 (0.59)
• Return on equity before goodwill amortisation: 14.3 per cent (6.8)
(Figures for the second quarter of 2002 in parentheses)

Second quarter 2003 1. DnB - an overview
DnB Group 7
DnB - Norway's leading financial services group
Banking operations As at 30 June 2003: • Total assets NOK 436.4 billion • Net lending NOK 318.6 billion • Customer deposits NOK 213.0 billion
Assets under management • Life insurance (Vital) NOK 80 billion • Mutual funds (DnB Investor) NOK 28 billion • Discretionary management NOK 244 billion • Total assets under management NOK 352 billion
Customer base • Serving around 1.7 million retail customers throughout Norway with various levels of activity • More than 51 000 business customers • Some 630 000 individuals are insured
Distribution network • 144 domestic DnB branches, of which • Online equities trading 57 fully automated financial services,
19 Nordlandsbanken branches and • About 300 post office counters 1) • More than 1 100 in-store postal outlets 1)
12 regional centres (incl. Oslo) • About 2 000 rural postmen 1) • 6 international branches • More than 60 Postbanken Eiendomsmegling • 5 international representative offices sales offices (franchises) • 34 Postbanken sales outlets • 46 DnB Eiendom sales offices • Internet banking (all located in DnB branches) • Electronic banking • 17 Vital sales offices • Telephone banking • 21 Vital agent agreements • SMS/WAP banking 1) Provided by Norway Post (the Norwegian postal system)
Credit ratings from international rating agencies
Long-term Short-term Long-term Short-termDen norske Bank ASA Aa3 P1 A A1
Moody's Standard & Poor's

1. DnB - an overview Second quarter 2003
8 DnB Group
Accounting changes and other adjustments
Accounting treatment of the acquisition of Nordlandsbanken On the basis of an invitation extended by the Board of Directors in Nordlandsbanken at the end of 2002, DnB presented an offer to acquire all shares in Nordlandsbanken ASA. The offer price was NOK 35 per share, representing a total of NOK 1 050 million. At the expiry of the extended offer period, on 17 January 2003, Den norske Bank had received acceptances which along with DnB's own holdings represented 96.35 per cent of the shares in Nordlandsbanken. DnB's conditions for acceptance were fulfilled on 21 February 2003, and the acquisition was implemented in accordance with the acceptances as of this date. Minority shareholders were given an offer to redeem their shares in Nordlandsbanken as from 27 February 2003. The alternative would be mandatory transfer. As from the same date, all shares not previously acquired were transferred to Den norske Bank ASA. On 21 February 2003, the Ministry of Finance approved the acquisition of Nordlandsbanken. In the accounts, the acquisition of Nordlandsbanken is treated according to the purchase method. To establish a basis for the accounting treatment, an analysis was carried out to identify market values above or below book values in the acquired operations and allocate these to the appropriate balance sheet items. Nordlandsbanken's balance sheet as at 31 December 2002 was used to identify approximate values on the transaction date. Based on assessments made in the first quarter the market value of the loan portfolio turned out to be NOK 164 million lower than book value. A review in the second quarter identified an additional NOK 80 million in market value below book value in the loan portfolio relating to new information concerning certain aspects of these commitments prior to DnB's takeover. The market value of long-term shareholdings exceeded book value by NOK 15 million. The part of the acquisition cost exceeding recorded equity after value adjustments, costs relating to the acquisition and restructuring provisions are recorded as goodwill in the Group's balance sheet. Goodwill relating to the acquisition will be amortised over ten years based on an analysis of values in the acquired operations as well as the significance of operations for the DnB Group.
Amounts in NOK million DnB GroupAcquisition cost 1 050 Recorded equity as at 31 December 2002 754 Value adjustments (229)Acquisition cost exceeding recorded equity 525 Costs relating to the acquisition 10 Restructuring provisions 76 Deferred taxes 85 Recorded goodwill in the balance sheet of acquired operations 4 Goodwill in the DnB Group on the acquisition date 531 Annual amortisation 53
Nordlandsbanken's accounts for 2002 reflected the special circumstances leading up to the acquisition by DnB. Pro forma accounts for DnB including Nordlandsbanken will thus not provide an appropriate basis for evaluating Nordlandsbanken's impact on DnB's future accounts. Pro forma accounts for previous periods have therefore not been prepared. In the formal accounts, Nordlandsbanken has been included as from 1 January 2003, which approximates the implementation date for the acquisition.

DnB Group 9
Section 2
Financial results DnB Group

10 DnB Group

Second quarter 2003 2. Financial results DnB Group
DnB Group 11
Financial highlights Key financials
2Q03 1Q03 4Q02 3Q02 2Q02 2003 2002
Pre-tax operating profit before losses
(NOK million) 1 478 1 047 1 182 879 918 2 524 1 998
Pre-tax operating profit (NOK million) 949 679 798 714 549 1 627 1 755
Net profit for the period (NOK million) 883 502 576 441 412 1 385 1 317
Ordinary cost/income ratio excluding
goodwill amortisation (per cent) 56.1 63.6 58.3 65.8 65.4 59.6 64.1
Earnings per share excluding
goodwill amortisation (NOK) 1.26 0.76 0.84 0.66 0.59 2.01 1.81
Earnings per share (NOK) 1.15 0.65 0.75 0.57 0.53 1.80 1.71
Return on equity excluding
goodwill amortisation (per cent) 14.3 8.8 9.3 7.5 6.8 11.6 10.5
Return on equity (per cent) 13.0 7.6 8.3 6.5 6.1 10.4 9.9
Total combined assets (NOK billion) 781 749 680 666 694 781 694
Core capital ratio at end of
period 1) (per cent) 6.7 6.9 7.8 8.3 8.1 6.7 8.1
1) Including 50 per cent of profit for the period, apart from year-end figures
1st half
Total combined assets NOK billion
168190
228 246
313344 358
385
436
182
257300 319
407445 460
680
781
31 Dec.1995
31 Dec.1996
31 Dec.1997
31 Dec.1998
31 Dec.1999
31 Dec.2000
31 Dec.2001
31 Dec.2002
30 June2003
Total DnB Group assets
Combined assets owned or managed
1) Vital is included as from 1996, Postbanken as from 1999, Skandia Asset Management as from 2002 and Nordlandsbanken as from 2003
1) 1)1) 1)

2. Financial results DnB Group Second quarter 2003
12 DnB Group
Profit and loss accounts Profit and loss accounts
Amounts in NOK million 2Q03 1Q03 4Q02 3Q02 2Q02 2003 2002Net interest income 2 047 2 123 2 169 2 112 2 148 4 170 4 098 Net other ordinary operating income 1 525 1 009 1 091 776 766 2 535 1 792 Ordinary operating expenses 2 077 2 062 1 958 1 960 1 942 4 139 3 839 Ordinary operating profit 1 496 1 069 1 302 927 971 2 565 2 050 Gains on the sale of fixed assets 0 1 28 1 3 2 6
Other expenses 1) 18 24 149 49 57 42 58 Pre-tax operating profit before losses 1 478 1 047 1 182 879 918 2 524 1 998 Net losses/(reversals) on loans etc. 560 367 363 154 87 927 (39) Net gain/(loss) on long-term securities 31 (1) (21) (11) (282) 30 (283) Pre-tax operating profit 949 679 798 714 549 1 627 1 755 Taxes 66 176 222 273 137 242 439 Profit for the period 883 502 576 441 412 1 385 1 317 1) Restructuring, allocations to the DnB Employee Fund and losses on fixed assets
1st half
Ordinary operating profit

Second quarter 2003 2. Financial results DnB Group
DnB Group 13
Net interest income Net interest income
Amounts in NOK million 2Q03 1Q03 4Q02 3Q02 2Q02 2003 2002Net interest income 2 047 2 123 2 169 2 112 2 148 4 170 4 098
1st half
Changes in net interest income Amounts in NOK million 2Q03 Change 2Q02
Net interest income 2 047 (100) 2 148 Of which:
Lending and deposit volumes 202
Lending and deposit spreads 77
Exchange rate movements (36)
Payments of interest income on a previously non-performing commitment in 2002 (141)
Equity (107)
Funding costs and interest reservations on problem loans (42)
Other (53)
1) Of which Nordlandsbanken NOK 116 million
1)
Net interest income

2. Financial results DnB Group Second quarter 2003
14 DnB Group
Development in average interest rate spread
Development in average volumes
265 269 273 275 277 277 280
308 310
186 191 190198 195 196 196
209213
289283
200204
2Q01 3Q01 4Q01 1Q02 2Q02 3Q02 4Q02 1Q03 2Q03
NOK billion
Deposits
Lending
1) 1)
1) 1)
1) Excl. Nordlandsbanken

Second quarter 2003 2. Financial results DnB Group
DnB Group 15
Net other operating income Net other operating income
Amounts in NOK million 2Q03 1Q03 4Q02 3Q02 2Q02 2003 2002
Dividends 70 5 10 12 31 75 40
Net profit/(loss) from Vital 222 (23) 1 (74) (119) 199 (42)
Net commissions and fees 686 643 685 605 631 1 329 1 220
Net gain on foreign exchange
and interest rate instruments 349 280 254 222 209 629 417
Net gain/(loss) on short-term shareholdings 29 (47) (10) (139) (144) (19) (133)
Sundry operating income 171 151 151 149 159 322 290
Net other ordinary operating income 1 525 1 009 1 091 776 766 2 535 1 792 Gains on the sale of fixed assets 0 1 28 1 3 2 6
Net other operating income 1 526 1 010 1 119 777 769 2 536 1 798 As a percentage of total income 42.7 32.2 34.0 26.9 26.4 37.8 30.5
Unrealised gains on short-term shareholdings at end of period 0 0 0 0 0 0 0
1st half
Changes in net other operating income
Amounts in NOK million 2Q03 Change 2Q02
Net other operating income 1 526 757 769 Of which
Vital 341
Short-term shareholdings 165
Other financial instruments 128
Nordlandsbanken 54
Dividends 32
Asset management services 1) 17
Money transfers 14
Other 6
1) The acquisition of Skandia Asset Management gave an increase in asset management fees of around NOK 32 million

2. Financial results DnB Group Second quarter 2003
16 DnB Group
Stock market-related income
Amounts in NOK million 2Q03 1Q03 4Q02 3Q02 2Q02 2003 2002Dividends 70 5 10 12 31 75 40 Net profit/(loss) from Vital 222 (23) 1 (74) (119) 199 (42) Net gain/(loss) on short-term shareholdings 29 (47) (10) (139) (144) (19) (133)
Asset management services 1) 139 142 156 137 120 281 201 Custodial services 28 28 29 28 26 56 59 Corporate finance 45 45 33 3 42 90 91 Securities brokerage 22 18 21 18 19 40 47 Total stock-market related income 555 167 240 (15) (26) 722 263 As a percentage of total income (per cent) 15.5 5.3 7.3 (0.5) (0.9) 10.8 4.5Gains/(losses) on long-term securities 33 0 (1) 177 0 33 0 Losses/write downs on long-term securities 1 1 20 188 282 2 283
1) The acquisition of Skandia Asset Management gave an increase in asset management fees of around NOK 32 million
1st half

Second quarter 2003 2. Financial results DnB Group
DnB Group 17
Net commissions and fees on banking services Net commissions and fees
Amounts in NOK million 2Q03 1Q03 4Q02 3Q02 2Q02 2003 2002
Money transfers 1) 311 262 289 282 285 573 532
Asset management services 2) 139 142 156 137 120 281 201
Custodial services 28 28 29 28 26 56 59
Corporate finance etc. 45 45 33 3 42 90 91
Securities broking 22 18 21 18 19 40 47
Credit broking, guarantees etc. 54 65 78 72 56 120 139
Insurance sales 21 29 19 19 21 51 45
Other 64 55 60 47 63 119 107
Net commissions and fees on banking services 686 643 685 605 631 1 329 1 220
1) Postbanken's Clearing House was sold to the Banks' Central Clearing House (BBS) in the first quarter of 2001. After the sale, fees paid to BBS have been netted against income received from customers2) Skandia Asset Management was acquired as at 1 June 2002 and provided a revenue contribution of around NOK 75 million in the first quarter of 2003 and NOK 70 million in the second quarter of 2003
1st half
Net commissions and fees
1 218 1 355 1 3941 157 1 102
445
363 494
195342 212
122
145
210
214 296
252310114102
131
141 117
482
292169
167
182
217 289
1998 1999 2000 2001 2002
OtherCredit broking, guarantees etc.Securities broking and corporate financeCustodial servicesAsset management servicesMoney transfers
NOK million 2 843
2 0712 371
2) 2)
2 434 2 510
1) Postbanken's Clearing House was sold to the Bank's Central Clearing House (BBS) in the first quarter of 2001. After the sale, fees paid to BBS have been netted against income received from customers2) Pro forma figures
1)

2. Financial results DnB Group Second quarter 2003
18 DnB Group
Net gain on financial instruments
Net gain on foreign exchange and financial instruments
Amounts in NOK million 2Q03 1Q03 4Q02 3Q02 2Q02 2003 2002Net gain/(loss) on short-term shareholdings 29 (47) (10) (139) (144) (19) (133) Net gain/(loss) on commercial paper and bonds 240 101 43 18 20 341 (32) Net gain on trading in foreign exchange
and financial derivatives 232 412 63 551 301 643 542 Net gain/(loss) on other money market
instruments (122) (233) 148 (347) (112) (356) (94) Net gain on foreign exchange and
financial instruments 377 233 244 83 64 610 284
1st half
Market value above acquisition cost, banking portfolio excl. NB 1)
30 June 31 March 31 Dec. 30 Sept. 30 June 31 Dec.
Amounts in NOK million 2003 2003 2002 2002 2002 2001Commercial paper and bonds 33 6 0 0 0 8 Short-term shareholdings 0 0 0 0 0 0 1) Unrealised gains have not been included in the profit and loss accounts

Second quarter 2003 2. Financial results DnB Group
DnB Group 19
Short-term investments in securities 1)
Book Market Book Market Book MarketAmounts in NOK million value value value value value value
Commercial paper and bondsTrading portfolio 28 880 28 880 26 496 26 496 27 484 27 484
Banking portfolio 7 720 7 752 7 373 7 373 7 154 7 154
Nordlandsbanken 1 810 1 810 - - - -
Total commercial paper and bonds 38 410 38 443 33 870 33 870 34 638 34 638
Short-term shareholdings
Trading portfolio 248 248 118 118 341 341
Banking portfolio 1 002 1 002 1 133 1 133 1 141 1 141
Nordlandsbanken 359 359 - - - -
Total short-term shareholdings 1 609 1 609 1 251 1 251 1 481 1 481
1) Excluding securities held by Vital
30 June 2003 30 June 200231 Dec. 2002
Major short-term shareholdings as at 30 June 2003 1) Amounts in NOK million Book value Market value
IT Fornebu Eiendom 103 103
Elkem 77 71
Oslo Børs Holding 67 58
Cape Investments 54 54
Euroclear 40 40
Privatbanken 34 26
Industrifinans SMB III 26 16
Viking Ship Finance 25 49
Equity funds, total 295 260
Other, banking portfolio 387 325
Value adjustment (105) -
Total banking portfolio 1 002 1 002 Trading portfolio 248 248
Shares held by Nordlandsbanken:OVDS 84 84
Helgelandske 31 31
Troms Fylkes Dampskibsselskap 31 31
Equity funds, total 112 112
Other, Nordlandsbanken 101 101
Total Nordlandsbanken 359 359
Total 1 609 1 609 1) Excluding shares held by Vital

2. Financial results DnB Group Second quarter 2003
20 DnB Group
Sundry operating income Sundry operating income
Amounts in NOK million 2Q03 1Q03 4Q02 3Q02 2Q02 2003 2002
Operating income on real estate
and rental income 26 23 23 21 20 48 41
Fees on real estate broking 86 62 57 64 84 149 145
Share of profit in associated companies 35 30 5 24 25 65 44
Remunerations 3 4 8 13 2 7 4
Miscellaneous 21 32 58 28 28 53 56
Total sundry ordinary operating income 171 151 151 149 159 322 290 Gain on the sale of fixed assets 0 1 28 1 3 2 6
Total sundry operating income 171 153 179 150 162 323 296
1st half
Sundry operating income
457 511 505
96 72 6980 85
529
30 3546 43 15
407 450
1998 1999 2000 2001 2002
NOK million
Gains on sale and outsourcing of operationsOperating income on real estate and rental incomeTotal sundry ordinary operating incomeGains on the sale of fixed assets
2) 2)
1 149
534571550
1)
626
1) In 2001, gains on the sale and outsourcing of operations consisted of two main items. The gain on the sale of DnB's IT operating
services was NOK 299 million, which was recorded in the P/L in the third quarter of 2001, while the sale of Postbanken's Clearing House gave a gain of NOK 230 million in the first quarter of 2001.
2) Pro forma figures

Second quarter 2003 2. Financial results DnB Group
DnB Group 21
Operating expenses Total operating expenses
Amounts in NOK million 2Q03 1Q03 4Q02 3Q02 2Q02 2003 2002
Total ordinary salaries and other personnel expenses 1 018 1 013 954 997 916 2 030 1 836 Fees 115 101 97 93 120 216 220
EDP expenses 1) 279 295 257 259 290 573 584
Expenses on fixed assets
and rented premises 195 202 172 183 180 397 355
Marketing and public relations 68 60 46 58 57 127 117
Reimbursement to Norway Post 2) 125 117 143 129 109 242 220
Amortisation of goodwill 58 54 43 44 20 112 29
Miscellaneous operating expenses 220 222 245 197 251 442 479
Total ordinary operating expenses 2 077 2 062 1 958 1 960 1 942 4 139 3 839
Write-downs and losses on the
sale of fixed assets 6 20 16 3 1 26 2
Restructuring expenses 13 4 93 46 56 17 56
Allocations to the DnB Employee Fund 0 0 40 0 0 0 0
Total operating expenses 2 095 2 087 2 107 2 009 1 999 4 182 3 897 1) These expenses concern the purchase, operation and maintenance of computers and software together with depreciation. The Group’s total IT expenses are shown on page 23, which in addition to EDP expenses include systems development, remuneration to external consultants, as well as salaries and other operating expenses relating to the Group's IT operations
2) Further reimbursement to the Norwegian postal system is included in interest expenses and fees payable on banking services
1st half
Total operating expenses
3 119 3 265 3 493 3 667 3 788
2 136 2 202 2 304 2 257 2 284
1 447 1 432 1 352 1 376 1 200
486476459481426
13481 75 255787
1998 1999 2000 2001 2002
NOK million
Write-downs, provisions for restructuring measures, allocations to the DnB Employee Fund etc.Total other ordinary operating expensesOrdinary depreciationTotal administrative expensesOrdinary salaries and other personnel expenses
7 263
8 167 7 689 7 851
1) 1)
8 013
1) Pro forma figures

2. Financial results DnB Group Second quarter 2003
22 DnB Group
Ordinary cost/income ratio before goodwill amortisation
58.3
63.662.9
56.155.4
65.8
57.3
65.8 65.4
1 930 1 920 1 9511 889 1 922 1 916 1 916
2 008 2 019
3 598
2 916
3 286
3 518
3 157
3 002
3 370
2 938
2 912
3 0 .0
4 0 .0
5 0 .0
6 0 .0
7 0 .0
8 0 .0
9 0 .0
1 0 0 .0
2Q01 3Q01 4Q01 1Q02 2Q02 3Q02 4Q02 1Q03 2Q031 7 0 0
1 9 0 0
2 10 0
2 3 0 0
2 5 0 0
2 7 0 0
2 9 0 0
3 10 0
3 3 0 0
3 5 0 0
Ordinary cost/income ratio (Per cent)
Ordinary operating income 1)
(NOK million)
Ordinary operating expenses(NOK million)
1) Excluding amortisation of goodwill on the investment in Vital
Changes in ordinary operating expenses Amounts in NOK million 2Q03 Change 2Q02
Ordinary operating expenses 2 077 135 1 942 Of which:
Nordlandsbanken 92
Goodwill amortisation on acquisitions 38
DnB Asset Management 37
Wage settlements and pension payments 34
Streamlining of operations and reduced activity (36)
e-activities and IT (19)
Effects of integration (11) (66)

Second quarter 2003 2. Financial results DnB Group
DnB Group 23
Employees
Full-time positions at end of period 2Q03 2002 2001 2000 1999 1998DnB Group excl. Vital 6 611 6 391 6 313 6 481 6 732 6 900
Life Insurance - Vital 607 632 619 570 553 537
Total 7 218 7 023 6 932 7 052 7 285 7 437
Full year
Full-time positions at end of period 2Q03 Change 2Q02
Total 7 218 84 7 134 Of which:
Corporate Banking 9
Retail Banking (164)
DnB Markets (19)
DnB Asset Management (120)
Life Insurance - Vital (24)
Financial, Payment and Group Services 24
Nordlandsbanken 376
Other 1
IT expenses
Amounts in NOK million 2Q03 1Q03 4Q02 3Q02 2Q02 2003 2002
Operating expenses IT 283 293 267 262 270 576 567
Systems development expenses 150 152 113 133 172 302 314
Total IT expenses 1) 434 445 380 395 442 878 881 1) Including salaries and indirect costs
1st half
Restructuring provisions
Provisions30 June Accrued New upon 31 Dec.
Amounts in NOK million 2003 expenses provisions aquisition 2002 Foreign branches 3 0 0 0 3
Acquisition of Skandia Asset Management 2) 58 51 0 0 108
Acquisition of Nordlandsbanken 68 8 0 76 0
Other restructuring provisions 41 26 17 0 50
Total 170 84 17 76 161
1) Provisions of NOK 76 million relating to the acquisition of Nordlandsbanken were added to the acquisition cost 2) Expenses of NOK 5 million are offset by the impact of exchange rate movement on the balance sheet
1)

2. Financial results DnB Group Second quarter 2003
24 DnB Group
Losses and reversals on loans and guarantees Losses/(reversals) by business area 1)
Amounts in NOK million 2Q03 1Q03 4Q02 3Q02 2Q02 2003 2002Retail Banking
- DnB 12 (22) (9) 1 4 (11) (37) - Postbanken 17 12 24 14 19 29 29 - DnB Kort 29 15 (9) 17 21 44 36
Corporate Banking - Large Corporates 110 6 3 9 (8) 116 (32) - Shipping Division (21) (2) 3 (21) (18) (23) (62) - Regions 194 350 274 119 57 544 73 - Other 13 13 64 16 10 26 (60)
Nordlandsbanken 203 3 - - - 206 0 Other units 2 (7) 12 (0) 2 (5) 13 DnB Group 560 367 363 154 87 927 (39) 1) Expected loan losses were 0.32 per cent of the loan portfolio at the end of 2001 and 2002, and increased to 0.33 per cent at the end of June 2003 due to the acquisition of Nordlandsbanken
1st half
Net losses/(reversals)
Amounts in NOK million 2Q03 1Q03 4Q02 3Q02 2Q02 2003 2002Net losses Nordlandsbanken 203 3 - - - 206 - of which fishing industry 87 0 - - - 87 -Net losses DnB other 357 364 363 154 87 721 (39) of which fishing industry 133 265 131 6 1 398 (3) Net losses/(reversals) on loans, etc. 560 367 363 154 87 927 (39)
1st half
Losses/(reversals) for customer sectors 1)
Amounts in NOK million 2Q03 1Q03 4Q02 3Q02 2Q02 2003 2002Retail customers 60 12 3 46 41 72 10 International shipping (19) (2) (25) (21) (18) (21) (62) Real estate 2 (7) 14 (3) (4) (5) (10) Services 216 12 122 75 (0) 228 (5) Manufacturing 49 48 53 52 64 97 86 Trade 18 21 20 (6) 29 40 16 Transportation and communication 3 21 9 0 5 24 4 Oil and gas (3) (5) (1) (0) (34) (8) (63) Building and construction 6 2 3 6 2 8 (3) Power and water supply (0) (0) (2) (0) (0) (0) (0) Fishing sectors 134 22 36 6 1 155 (3) Other sectors, of which: Central and local government 0 (1) (1) (1) (0) (1) (3) Hotels and restaurants 7 0 1 1 2 7 (1) Agriculture and forestry 2 (1) 29 (1) 0 2 0 Other sectors (0) 0 9 (1) (0) (0) (4) Total customers 474 123 268 154 87 598 (39) Credit institutions 0 0 0 (0) 0 0 0 Repossessed assets 86 244 95 0 0 330 0 Increase in unspecified provisions 0 0 0 0 0 0 0 Total losses/(reversals) 560 367 363 154 87 927 (39)
1) Split according to official industry definitions which may differ from DnB's business area reporting
1st half
Second quarter 2003 2. Financial results DnB Group
DnB Group 25
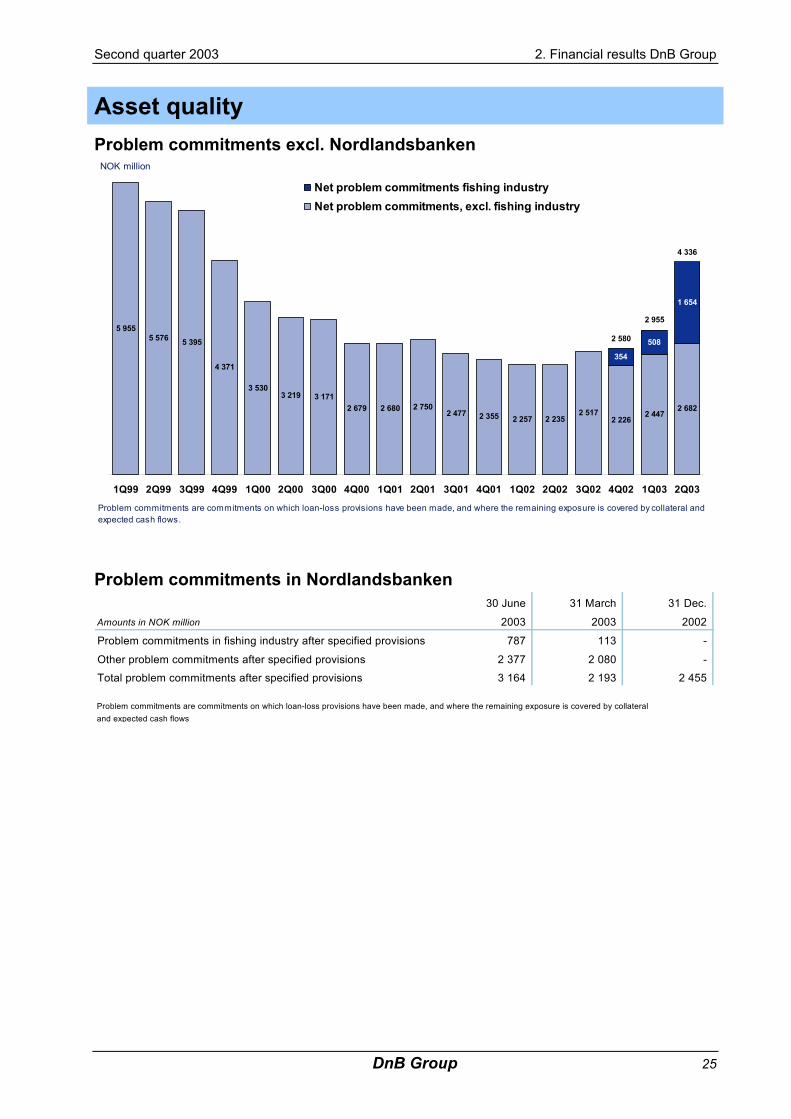
Asset quality Problem commitments excl. Nordlandsbanken
5 9555 576 5 395
4 371
3 5303 219 3 171
2 679 2 680 2 7502 477 2 355 2 257 2 235
2 5172 226
2 4472 682
354
508
1 654
4 336
2 955
2 580
1Q99 2Q99 3Q99 4Q99 1Q00 2Q00 3Q00 4Q00 1Q01 2Q01 3Q01 4Q01 1Q02 2Q02 3Q02 4Q02 1Q03 2Q03
Net problem commitments fishing industryNet problem commitments, excl. fishing industry
Problem commitments are commitments on which loan-loss provisions have been made, and where the remaining exposure is covered by collateral and expected cash flows.
NOK million
Problem commitments in Nordlandsbanken 30 June 31 March 31 Dec.
Amounts in NOK million 2003 2003 2002
Problem commitments in fishing industry after specified provisions 787 113 -
Other problem commitments after specified provisions 2 377 2 080 -Total problem commitments after specified provisions 3 164 2 193 2 455
Problem commitments are commitments on which loan-loss provisions have been made, and where the remaining exposure is covered by collateral and expected cash flows
2. Financial results DnB Group Second quarter 2003
26 DnB Group
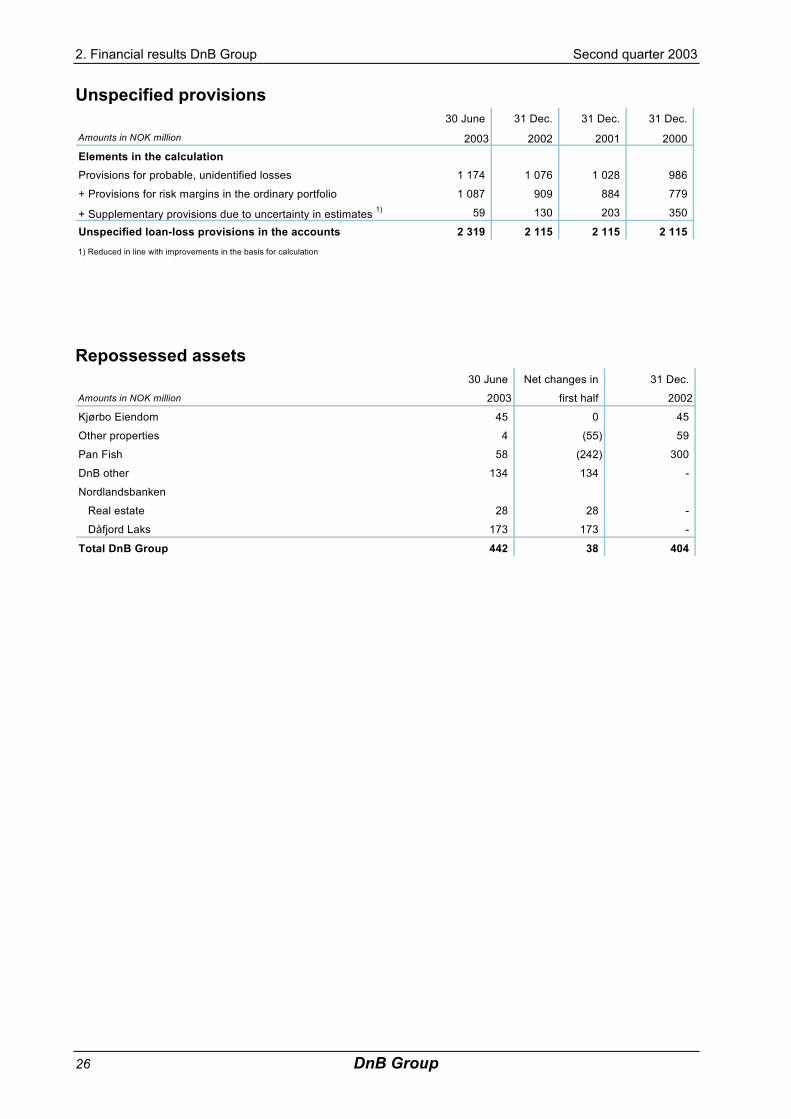
Unspecified provisions 30 June 31 Dec. 31 Dec. 31 Dec.
Amounts in NOK million 2003 2002 2001 2000Elements in the calculationProvisions for probable, unidentified losses 1 174 1 076 1 028 986
+ Provisions for risk margins in the ordinary portfolio 1 087 909 884 779
+ Supplementary provisions due to uncertainty in estimates 1) 59 130 203 350
Unspecified loan-loss provisions in the accounts 2 319 2 115 2 115 2 115 1) Reduced in line with improvements in the basis for calculation
Repossessed assets 30 June Net changes in 31 Dec.
Amounts in NOK million 2003 first half 2002
Kjørbo Eiendom 45 0 45
Other properties 4 (55) 59
Pan Fish 58 (242) 300
DnB other 134 134 -
Nordlandsbanken
Real estate 28 28 -
Dåfjord Laks 173 173 -
Total DnB Group 442 38 404

Second quarter 2003 2. Financial results DnB Group
DnB Group 27
Total assets owned or managed by the DnB Group Total combined assets 1)
358 385436
56
6468 72
7480
21
3540 37
230
272
246313
228190168
344
5249
14
1923
31 Dec.1995
31 Dec.1996
31 Dec.1997
31 Dec.1998
31 Dec.1999
31 Dec.2000
31 Dec.2001
31 Dec.2002
30 June2003
NOK billion
Funds under management
Life insurance
Banking operations
1) Totals are net of inter-company balances2) Vital is included as from 1996, Postbanken as from 1999, Skandia Asset Management as from 2002 and Nordlandsbanken as from 2003
680
460445407
319300257
2) 2)
182
781
2) 2)
DnB Group balance sheets
30 June 31 March 31 Dec. 30 Sept. 30 June 31 Dec.Amounts in NOK billion 2003 2003 2002 2002 2002 2001
Cash and lending to/deposits with credit institutions 42.3 53.7 39.5 29.8 34.1 19.7
Net lending to customers 318.6 312.8 278.7 278.9 277.9 275.2
Commercial paper, bonds, etc. 38.4 34.1 33.9 33.7 34.6 38.8
Shareholdings 6.9 7.0 6.5 6.6 7.1 7.3
Fixed and intangible assets 7.3 7.2 6.1 5.8 5.9 3.4
Other assets 22.9 19.2 20.5 19.7 17.9 13.8
Total assets 436.4 434.1 385.2 374.5 377.6 358.2Loans and deposits from credit institutions 52.4 59.8 49.1 50.1 40.2 34.9
Deposits from customers 213.0 207.9 194.8 186.8 199.7 191.6
Borrowings through the issue of securities 102.2 100.3 74.9 70.4 72.1 75.9
Other liabilities and provisions 28.0 25.6 29.9 30.1 28.8 18.2
Primary capital 40.8 40.4 36.6 37.1 36.8 37.7
Total liablities and equity 436.4 434.1 385.2 374.5 377.6 358.2
Average total assets for the year to date 434.3 431.2 377.6 376.9 376.0 367.4
Ratio of deposits to net lending (per cent) 66.9 66.5 69.9 67.0 71.8 69.6

2. Financial results DnB Group Second quarter 2003
28 DnB Group
Lending to principal sectors 1) 2) 30 June 31 March 31 Dec. 30 Sept. 30 June 31 Dec.
Amounts in NOK billion 2003 2003 2002 2002 2002 2001Retail customers 154.7 148.7 137.3 134.0 131.1 125.6
International shipping 25.3 23.3 21.9 22.3 22.7 26.1
Real estate 38.4 38.2 32.4 30.1 29.8 29.0
Services 26.4 26.6 24.7 29.0 30.4 29.4
Manufacturing 17.4 17.8 17.3 18.0 18.1 18.4
Trade 17.5 16.7 13.7 14.9 15.3 15.1
Transportation and communication 10.7 10.7 8.9 8.8 8.6 8.8
Oil and gas 3.5 3.5 3.5 3.6 3.3 4.1
Building and construction 3.4 3.5 2.6 2.7 2.7 3.3
Power and water supply 5.2 6.0 6.0 4.4 5.9 5.5
Fishing sectors 9.8 9.1 6.5 6.5 6.0 5.5
Other sectors, of which:
Central and local government 1.5 1.7 1.8 2.2 2.3 2.5
Hotels and restaurants 1.9 1.9 1.4 1.4 1.4 1.4
Agriculture and forestry 0.9 0.9 0.7 0.7 0.7 0.7
Other 4.3 6.6 2.1 2.4 1.6 2.0
Total 320.9 315.1 280.9 281.0 280.1 277.3Of which residential mortgages:
Within 80% of collateral value 137.5 133.3 123.3 120.8 118.7 113.8
Above 80% of collateral value 4.5 5.0 3.6 3.5 4.0 4.1
Total 142.1 138.2 126.9 124.3 122.7 117.91) Split according to official industry definitions which may differ from DnB's business area reporting2) Gross lending after deductions for related specified loan-loss provisions
Lending to principal sectors as at 30 June 2003

Second quarter 2003 2. Financial results DnB Group
DnB Group 29
Exposure to certain industries 1) 30 June 31 Dec.
Amounts in NOK billion 2003 2002
Fishing related exposure:
Den norske Bank 9.4 9.7 - of which fishing vessels 3.8 3.4
fish farming 2.7 3.4
fish processing 1.8 2.1
fish trading 0.7 0.8
other 0.4
Nordlandsbanken 2.9 - of which fishing vessels 1.9
fish farming 0.3
fish processing 0.8
fish trading 0.0
Repossessed assets 0.3 0.3 - of which Pan Fish 0.1 0.3
Dåfjord 0.2 -
Total fishing related exposure 12.6 10.0- of which guarantees 0.2
Telecommunications 2.2 2.7Cruise 4.0 2.4Civil aviation 1.2 1.1
1) Loans and guarantees including commitments classified as non-performing or doubtful after related specified loan-loss provisions, and including repossessed assets

2. Financial results DnB Group Second quarter 2003
30 DnB Group
Customer savings Customer savings in DnB companies 1)
91 100 97 108171 175 192 195 2131 1
3 57 7
6
44 48
58 6266 69
74
230
272
5114
19 23 21
403537
31 Dec.1995
31 Dec.1996
31 Dec.1997
31 Dec.1998
31 Dec.1999
31 Dec.2000
31 Dec.2001
31 Dec.2002
30 June2003
NOK billion
Assets under managementVital policyholders' fundsEquity-linked bondsCustomer deposits
264
180
278
1) Totals are net of inter-company balances2) Vital is included as from 1996, Postbanken as from 1999, Skandia Asset Management as from 2002 and Nordlandsbanken as from 2003
495
297
168164
106
562
2) 2) 2) 2)
Deposits from principal sectors 1)
30 June 31 March 31 Dec. 30 Sept. 30 June 31 Dec.Amounts in NOK billion 2003 2003 2002 2002 2002 2001
Retail customers 105.1 98.5 92.5 90.1 94.5 86.4
International shipping 13.0 13.8 13.5 14.0 12.4 16.0
Real estate 7.9 7.3 6.3 6.6 6.6 6.9
Services 31.6 29.9 29.8 28.6 28.9 27.8
Manufacturing 10.1 9.7 9.9 8.4 9.1 11.8
Trade 9.3 9.2 10.6 8.9 9.0 9.7
Transportation and communication 6.8 6.5 6.5 5.5 7.7 6.0
Oil and gas 1.1 2.1 1.5 2.2 1.2 1.3
Building and construction 1.9 2.1 1.9 1.7 1.6 1.8
Power and water supply 3.4 3.7 3.8 3.5 4.1 3.4
Fishing sectors 1.2 1.3 0.9 0.9 0.8 1.2
Other sectors, of which:
Central and local government 10.6 11.2 9.5 8.7 10.5 10.9
Hotels and restaurants 0.5 0.7 0.6 0.5 0.5 0.6
Agriculture and forestry 0.5 0.5 0.5 0.5 0.5 0.5
Other 10.0 11.5 6.9 6.8 12.3 7.3
Total 213.0 207.9 194.8 186.8 199.7 191.61) Split according to official industry definitions

Second quarter 2003 2. Financial results DnB Group
DnB Group 31
Capital adequacy and taxes Development in primary capital and capital ratios
Amounts in NOK million % % % %
Share capital 7 787 7 787 7 696 7 696
Reserves 11 109 12 141 12 858 13 737
Perp. subord. loan capital securities 2 902 2 902 2 902 2 777
Core capital 21 797 7.5 22 830 6.9 23 456 6.5 24 210 7.8
Perpetual subordinated loan capital 4 099 4 199 4 199 3 923
Term subordinated loan capital 5 565 6 615 7 414 5 111
Ineligible subordinated loan capital - - (118) (118)
Net supplementary capital 9 664 10 814 11 495 8 916
Deductions 872 1 113 1 181 1 092
Total eligible primary capital 30 589 32 531 33 770 32 034
Total risk-weighted assets 290 048 332 193 359 791 312 230
Capital ratio 10.5 9.8 9.4 10.3
Core capital ratio incl. 50 per cent of
profit for the period 7.7 7.1 6.7
Capital ratio incl. 50 per cent of
profit for the period 10.8 10.0 9.6
1) The reduction in the core capital ratio in 2003 is due to the acquisition of Nordlandsbanken
ASA, consolidated
Den norske Bank
ASA
Den norske Bank DnB Group
30 June2003
30 June2003
30 June2003
31 Dec.2002
1)
1)
1)
1)
1)
1)
1)
1)
Taxes In the second quarter of 2003, the Central Tax Office for Large Companies, which is responsible for the tax assessment of Den norske Bank ASA, informed the bank that it accepted adjustments in the tax assessment for the 1995 and 1996 financial years, which reduced the bank's tax charge by a total of around NOK 180 million. In consequence of the decision to adjust the tax assessment, the tax charge for the bank and the DnB Group for the second quarter of 2003 was reduced by a corresponding amount. The matter concerned the distribution of debt interest in the taxation of the bank's Norwegian operations and its international branches. In 1997, the bank received approval for its interpretation of the rules concerning the distribution of taxes. The bank has later worked to ensure the full application of this interpretation for operations in all international branches also for the 1995 and 1996 financial years. By adjusting the tax assessment, the Central Tax Office has accepted this view.
DnB's expected future tax rate is estimated at 26 per cent.
2. Financial results DnB Group Second quarter 2003
32 DnB Group
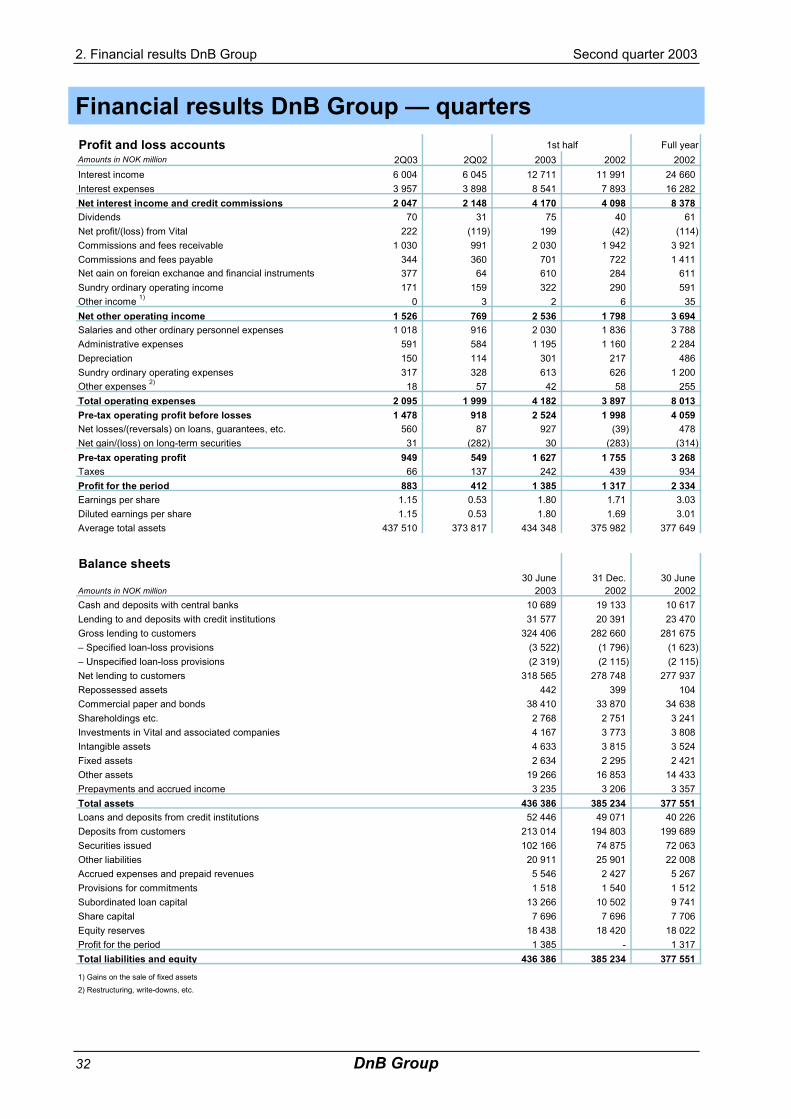
Financial results DnB Group — quarters Profit and loss accounts Full yearAmounts in NOK million 2Q03 2Q02 2003 2002 2002Interest income 6 004 6 045 12 711 11 991 24 660 Interest expenses 3 957 3 898 8 541 7 893 16 282 Net interest income and credit commissions 2 047 2 148 4 170 4 098 8 378 Dividends 70 31 75 40 61 Net profit/(loss) from Vital 222 (119) 199 (42) (114) Commissions and fees receivable 1 030 991 2 030 1 942 3 921 Commissions and fees payable 344 360 701 722 1 411 Net gain on foreign exchange and financial instruments 377 64 610 284 611 Sundry ordinary operating income 171 159 322 290 591 Other income 1) 0 3 2 6 35 Net other operating income 1 526 769 2 536 1 798 3 694 Salaries and other ordinary personnel expenses 1 018 916 2 030 1 836 3 788 Administrative expenses 591 584 1 195 1 160 2 284 Depreciation 150 114 301 217 486 Sundry ordinary operating expenses 317 328 613 626 1 200 Other expenses 2) 18 57 42 58 255 Total operating expenses 2 095 1 999 4 182 3 897 8 013 Pre-tax operating profit before losses 1 478 918 2 524 1 998 4 059 Net losses/(reversals) on loans, guarantees, etc. 560 87 927 (39) 478 Net gain/(loss) on long-term securities 31 (282) 30 (283) (314) Pre-tax operating profit 949 549 1 627 1 755 3 268 Taxes 66 137 242 439 934 Profit for the period 883 412 1 385 1 317 2 334 Earnings per share 1.15 0.53 1.80 1.71 3.03Diluted earnings per share 1.15 0.53 1.80 1.69 3.01Average total assets 437 510 373 817 434 348 375 982 377 649
Balance sheets30 June 31 Dec. 30 June
Amounts in NOK million 2003 2002 2002 Cash and deposits with central banks 10 689 19 133 10 617 Lending to and deposits with credit institutions 31 577 20 391 23 470 Gross lending to customers 324 406 282 660 281 675 – Specified loan-loss provisions (3 522) (1 796) (1 623) – Unspecified loan-loss provisions (2 319) (2 115) (2 115) Net lending to customers 318 565 278 748 277 937 Repossessed assets 442 399 104 Commercial paper and bonds 38 410 33 870 34 638 Shareholdings etc. 2 768 2 751 3 241 Investments in Vital and associated companies 4 167 3 773 3 808 Intangible assets 4 633 3 815 3 524 Fixed assets 2 634 2 295 2 421 Other assets 19 266 16 853 14 433 Prepayments and accrued income 3 235 3 206 3 357 Total assets 436 386 385 234 377 551 Loans and deposits from credit institutions 52 446 49 071 40 226 Deposits from customers 213 014 194 803 199 689 Securities issued 102 166 74 875 72 063 Other liabilities 20 911 25 901 22 008 Accrued expenses and prepaid revenues 5 546 2 427 5 267 Provisions for commitments 1 518 1 540 1 512 Subordinated loan capital 13 266 10 502 9 741 Share capital 7 696 7 696 7 706 Equity reserves 18 438 18 420 18 022 Profit for the period 1 385 - 1 317 Total liabilities and equity 436 386 385 234 377 551
1) Gains on the sale of fixed assets2) Restructuring, write-downs, etc.
1st half

Second quarter 2003 2. Financial results DnB Group
DnB Group 33
Financial results DnB Group 1998-2002 Profit and loss accountsAmounts in NOK million 2002 2001 2000 1999 1) 1998 1)
Interest income 24 660 25 474 22 987 21 411 19 532 Interest expenses 16 282 17 475 15 767 14 330 13 053 Net interest income 8 378 7 999 7 221 7 081 6 480 Dividends 61 60 242 146 145 Net profit/(loss) from Vital (114) 238 345 350 183 Net commissions and fees receivable on banking services 2 510 2 434 2 842 2 371 2 070 Net gain on foreign exchange and financial instruments 611 1 168 1 517 1 256 387 Sundry ordinary operating income 591 1 120 519 528 504 Net other ordinary operating income 3 659 5 019 5 465 4 651 3 289 Salaries and other ordinary personnel expenses 3 788 3 667 3 493 3 265 3 119 Administrative expenses 2 284 2 257 2 304 2 202 2 136 Depreciation on fixed assets 486 476 459 481 426 Sundry ordinary operating expenses 1 200 1 376 1 352 1 432 1 447 Total ordinary operating expenses 7 758 7 776 7 608 7 379 7 129 Pre-tax ordinary operating profit before losses 4 279 5 242 5 078 4 352 2 639 Other income 2) 35 30 15 43 46 Other expenses 3) 255 75 81 787 134 Pre-tax operating profit before losses 4 059 5 196 5 012 3 608 2 552 Net losses/(reversals) on loans, guarantees, etc. 478 178 (241) (15) 1 178 Net gain/(loss) on long-term securities (314) (332) (5) 14 (0) Pre-tax operating profit 3 268 4 687 5 248 3 636 1 373 Taxes 934 587 1 230 511 422 Profit for the year 2 334 4 100 4 018 3 125 952 Earnings per share (NOK) 3.03 5.29 5.16 4.01 1.22Average total assets 377 649 367 366 341 428 325 160 317 202
Balance sheets 31 Dec. 31 Dec. 31 Dec. 31 Dec. 31 Dec.2)
Amounts in NOK million 2002 2001 2000 1999 1998 Cash and deposits with central banks 19 133 2 820 8 387 13 094 3 665 Lending to and deposits with credit institutions 20 391 16 854 20 798 15 572 13 383 Gross lending to customers 282 660 279 101 256 693 231 646 229 965 - Specified loan-loss provisions (1 796) (1 764) (1 871) (2 636) (3 290) - Unspecified loan-loss provisions (2 115) (2 115) (2 115) (2 085) (2 163) Net lending to customers 278 748 275 222 252 707 226 924 224 513 Repossessed assets 399 98 76 75 60 Commercial paper and bonds. 33 870 38 809 35 439 33 937 48 507 Shareholdnings etc. 2 751 3 453 2 711 3 920 3 572 Investments in Vital and associated companies 3 773 3 825 3 616 3 289 3 038 Intangible assets 3 815 929 1 375 1 239 1 560 Fixed assets 2 295 2 512 2 866 2 688 3 262 Other assets 16 853 10 450 12 565 9 623 9 188 Prepayments and accrued income 3 206 3 217 3 667 3 022 4 040 Total assets 385 234 358 190 344 208 313 385 314 788 Loans and deposits from credit institutions 49 071 34 920 51 322 45 498 47 607 Deposits from customers 194 803 191 575 175 430 170 900 166 771 Securities issued 74 875 75 878 63 919 50 011 56 851 Other liabilities 25 901 14 420 17 578 14 585 12 577 Accrued expenses and prepaid revenues 2 427 2 330 2 747 2 004 2 885 Provisions for commitments 1 540 1 412 1 192 1 363 1 013 Subordinated loan capital 7 725 8 219 8 105 7 344 6 838 Perpetual subordinated loan capital securities 2 777 3 601 0 0 0 Equity 26 117 25 836 23 914 21 679 20 247 Total liabilities and equity 385 234 358 190 344 208 313 385 314 788 Total risk-weighted volume 312 230 313 389 292 279 255 146 252 148
1) Pro forma figures2) Gains on the sale of fixed assets, etc.3) Restructuring, write-downs, etc.

2. Financial results DnB Group Second quarter 2003
34 DnB Group
Key figures — quarters DnB Group 1)
Amounts in NOK million 2Q03 1Q03 4Q02 3Q02 2Q02 2003 2002Interest rate analysis
1 Combined average spread for lending and deposits (%) 2.49 2.58 2.65 2.65 2.53 2.52 2.502 Spread for ordinary lending to customers (%) 1.70 1.70 1.41 1.16 1.26 1.69 1.343 Spread for deposits from customers (%) 0.79 0.88 1.24 1.50 1.26 0.83 1.16
Rate of return/profitability4 Net other operating income, % of total income 42.7 32.2 34.0 26.9 26.4 37.8 30.55 Cost/income ratio (%) 58.6 66.6 64.1 69.5 68.5 62.4 66.16 Ordinary cost/income ratio excl. goodwill amortisation(%) 56.1 63.6 58.3 65.8 65.4 59.6 64.17 Return on equity (%) 13.0 7.6 8.3 6.5 6.1 10.4 9.98 Return on equity excl. goodwill amortisation (%) 14.3 8.8 9.3 7.5 6.8 11.6 10.59 Goodwill amortisation (NOK million) 86 80 68 69 46 166 80
10 Average equity (NOK million) 27 071 26 369 27 714 27 254 26 881 26 753 26 533 Financial strength
11 Core (Tier 1) capital ratio at end of period (%) 6.5 6.8 7.8 8.0 7.9 6.5 7.912 Core (Tier 1) capital ratio incl. 50 per cent of profit for the period (%) 6.7 6.9 - 8.3 8.1 6.7 8.113 Capital adequacy ratio at end of period (%) 9.4 9.7 10.3 10.2 10.0 9.4 10.014 Capital adequacy ratio incl. 50 per cent of profit for the period (%) 9.6 9.8 - 10.5 10.2 9.6 10.215 Core capital at the end of period (NOK million) 23 456 23 592 24 210 24 531 24 422 23 456 24 422 16 Total eligible primary capital at the end of period (NOK million) 33 770 33 594 32 034 31 332 31 040 33 770 31 040 17 Risk-weighted volume at the end of period (NOK million) 359 791 345 287 312 230 307 669 310 192 359 791 310 192
Loan portfolio and loan-loss provisions18 Loan-loss ratio (%) 0.18 0.12 0.13 0.06 0.03 0.29 (0.01)19 Problem commitments, % of total lending 2.36 1.63 0.92 0.90 0.80 2.36 0.8020 Loan-loss provisions relative to total gross lending (%) 1.89 1.85 1.38 1.36 1.33 1.89 1.3321 Problem commitments at end of period (NOK million) 7 571 5 148 2 580 2 517 2 235 7 571 2 235
Liquidity22 Ratio of customer deposits to net lending to customers at end of period (%) 66.9 66.5 69.9 67.0 71.8 66.9 71.8
Total combined assets23 Average total combined assets (NOK billion) 765 729 673 679 539 746 506 24 Total combined assets at end of period (NOK billion) 781 749 680 666 693 781 693 25 Customer savings at end of period (NOK billion) 562 528 495 486 522 562 522
Staff26 Number of full-time positions at end of period 7 218 7 323 7 023 7 068 7 134 7 218 7 134 27 - of which in Vital 607 621 632 635 631 607 631
The DnB share28 Number of shares at end of period (1 000) 769 630 769 630 769 630 769 630 770 591 769 630 770 591 29 Average number of shares (1 000) 769 630 769 630 769 630 770 270 770 591 769 630 770 591 30 Average number of shares - fully diluted (1 000) 770 399 769 630 774 531 775 700 777 066 769 630 777 066 31 Earnings per share (NOK) 1.15 0.65 0.75 0.57 0.53 1.80 1.7132 Earnings per share excl. goodwill amortisation (NOK) 1.26 0.76 0.84 0.66 0.59 2.01 1.8133 Earnings per share fully diluted (NOK) 1.15 0.65 0.74 0.57 0.53 1.80 1.6934 Equity per share (NOK) 35.76 34.59 36.34 35.68 35.10 35.76 35.1035 Share price at end of period (NOK) 35.60 28.70 32.60 32.40 40.90 35.60 40.9036 Price/book value 1.00 0.83 0.90 0.91 1.17 1.00 1.1737 Market capitalisation (NOK billion) 27.4 22.1 25.1 24.9 31.5 27.4 31.5
1) Asset management operations acquired from Skandia are included in the figures as from 1 June 2002 and Nordlandsbanken are included in the figures as from 1 January 2003.
Definitions7 Profit for the period as a percentage of average equity.
18 Net losses on loans (excluding guarantees) as a percentage of lending after the deduction of specified loan-loss provisions at end of period.19 Problem commitments after the deduction of specified loan-loss provisions relative to lending after the deduction of specified loan-loss
provisions. Figures at end of period.20 Accumulated specified and unspecified loan-loss provisons relative to gross lending at end of period.31 Profit for the period divided by the average number of shares.36 The last quoted share price on the Oslo Stock Exchange at end of period relative to the book value of equity at end of period.37 Number of shares times share price at end of period
1st half

Second quarter 2003 2. Financial results DnB Group
DnB Group 35
Key figures 1998-2002 DnB Group 1)
Amounts in NOK million 2002 2001 2000 1999 1998Interest rate analysis
1 Combined average spread for lending and deposits (%) 2.58 2.62 2.79 3.08 3.052 Spread for ordinary lending to customers (%) 1.31 1.27 1.20 1.39 1.223 Spread for deposits from customers (%) 1.27 1.35 1.58 1.68 1.84
Rate of return/profitability4 Net other operating income, % of total income 32.0 40.0 44.3 41.1 35.55 Cost/income ratio (%) 65.6 60.3 60.6 69.0 73.36 Ordinary cost/income ratio excl. goodwill amortisation(%) 63.7 59.8 60.1 62.9 72.37 Return on equity (%) 8.6 15.8 17.0 14.4 4.68 Return on equity excl. goodwill amortisation (%) 9.4 16.3 17.6 15.1 5.49 Goodwill amortisation (NOK million) 217 138 134 148 160
10 Average equity (NOK million) 27 005 26 003 25 576 21 645 20 659 Financial strength
11 Core (Tier 1) capital ratio at end of period (%) 7.8 8.8 7.5 7.8 7.412 Capital adequacy ratio at end of period (%) 10.3 11.4 10.6 10.5 9.813 Core capital at the end of period (NOK million) 24 210 27 728 21 915 19 787 18 643 14 Total eligible primary capital at the end of period (NOK million) 32 034 35 677 30 867 26 916 24 812 15 Risk-weighted volume at the end of period (NOK million) 312 230 313 389 292 279 255 146 252 148
Loan portfolio and loan-loss provisions 16 Loan-loss ratio (%) 0.16 0.06 (0.11) 0.00 0.5317 Problem commitments, % of total lending 0.90 0.84 1.05 1.91 2.4018 Loan-loss provisions relative to total gross lending (%) 1.38 1.39 1.55 2.04 2.3719 Problem commitments at end of period (NOK million) 2 580 2 355 2 678 4 371 5 433
Liquidity20 Ratio of customer deposits to net lending to customers at end of period (%) 69.9 69.6 69.4 75.3 74.3
Total combined assets21 Average total combined assets (NOK billion) 588 453 426 363 310 22 Total combined assets at end of period (NOK billion) 680 460 445 407 319 23 Customer savings at end of period (NOK billion) 495 297 278 264 180
Staff24 Number of full-time positions at end of period 7 023 6 932 7 052 7 285 7 437 25 - of which in Vital 632 619 570 553 537
The DnB share26 Number of shares at end of period (1 000) 769 630 770 590 778 658 778 658 778 658 27 Average number of shares (1 000) 770 155 774 773 778 658 778 658 778 658 28 Average number of shares - fully diluted (1 000) 774 531 779 972 781 400 778 658 778 658 29 Earnings per share (NOK) 3.03 5.29 5.16 4.01 1.2230 Earnings per share excl. goodwill amortisation (NOK) 3.31 5.47 5.33 4.25 1.4331 Earnings per share fully diluted (NOK) 3.01 5.26 5.14 4.01 1.2232 Equity per share (NOK) 36.34 33.53 30.71 27.84 24.2433 Share price at end of period (NOK) 32.60 40.40 47.50 32.90 26.3034 Price/book value 0.90 1.20 1.55 1.18 1.0835 Market capitalisation (NOK billion) 25.1 31.1 37.0 25.6 16.836 Dividend per share (NOK) 2.40 2.40 2.25 1.75 1.3537 "RISK" adjustment (NOK) 2) 3.52 (3.66) 2.64 (0.39) (0.98)
1) All figures have been prepared in accordance with the DnB Group's accounting principles as at 30 June 2003. All figures prior to 2000 represent the combined business of DnB and Postbanken (pro forma accounts). Asset management operations acquired from Skandia are included in the figures as from 1 June 2002 and Nordlandsbanken as from 1 January 2003.
2) Estimated "RISK" adjustment for 2002 3) Excluding Postbanken
Definitions7 Profit for the period as a percentage of average equity.
16 Net losses on loans (excluding guarantees) as a percentage of lending after the deduction of specified loan-loss provisions at end of period.17 Problem commitments after the deduction of specified loan-loss provisions relative to lending after the deduction of specified loan-loss
provisions. Figures at end of period.18 Accumulated specified and unspecified loan-loss provisons relative to gross lending at end of period.29 Profit for the period divided by the average number of shares.34 The last quoted share price on the Oslo Stock Exchange at end of period relative to the book value of equity at end of period.35 Number of shares times share price at end of period
3)

2. Financial results DnB Group Second quarter 2003
36 DnB Group

DnB Group 37
Section 3
DnB Group and business areas

3. DnB Group and business areas Second quarter 2003
38 DnB Group
Group strategy Targets DnB's primary goal is to enhance shareholder value through an attractive and competitive return in the form of dividends and increases in the DnB share price. DnB's strategy targets areas where the Group has or can achieve lasting competitive advantages. DnB aspires to be the preferred partner for Norwegian and selected Nordic customers and international companies' preferred partner in Norway, and will capitalise on its special expertise within selected areas outside the Nordic region. Alongside profitability, a long-term perspective and team spirit are key strategic elements. DnB's operations should generate added value for shareholders. A long-term approach to customer relationships and market activities will strengthen the Group's customer franchise and provide customer service of superior value. Positive team spirit will give a further impetus to achieving performance targets. Profitable growth, a more efficient cost base and optimal utilisation of the Group's capital base are vital to the success of this strategy. Strategic position DnB has a leading position relative to Norwegian retail and corporate customers. The Group will further consolidate this position by being the best partner to meet customers' financial needs. This partnership will be based on building sound relationships between DnB and customers through distribution and dialogue, providing the best advisory and customer services and offering competitive prices on good overall solutions. With a wide array of products, DnB is able to fulfill large international companies' financial needs in Norway. On the basis of Norway's position as a shipping nation, DnB has become one of the world's foremost shipping banks. A corresponding position has been built up within the energy sector based on activities in the North Sea. The establishment of DnB Asset Management provides additional opportunities for growth in selected global areas. Strategic measures Continual improvement of the product range is essential to ensuring the quality of DnB's customer relationships. DnB will consider offering solutions from other providers of financial services and seeking alliances with other market players to boost efficiency or develop leading products and services in the market. DnB will develop electronic distribution channels to provide ready access for customers. Within certain areas, DnB will be able to offer products included in other service providers' market offerings. DnB will seek to become an even better supplier of niche products in international markets. The Group will work to increase cost efficiency through continued everyday improvements in operational procedures, effective purchasing routines, the elimination of products and services and strict priorities with respect to development projects. DnB will consider expanding and adjusting its customer franchise and range of products and services through structural measures provided that this will lead to increased long-term shareholder value. Additional acquisitions may be an option if such moves would help DnB achieve its long-term targets.

Second quarter 2003 3. DnB Group and business areas
DnB Group 39
Legal structure In accordance with the requirements of the Norwegian regulatory authorities, the banking, asset management and life insurance activities of the DnB Group are organised in separate limited companies under the holding company DnB Holding ASA. Banking activities are organised in Den norske Bank ASA, while asset management activities are organised in two companies: DnB Asset Management Holding AS and DnB Asset Management Holding (Sweden) AB. Life insurance activities are carried out by two separate companies: Vital Forsikring ASA (traditional life and pension products) and Fondsforsikringsselskapet Vital Link AS (unit linked products). Vital Skade AS offers non-life insurance as part of a total product package for retail and corporate clients and operates as an agent for foreign insurance underwriters.
DnB Group - corporate structure
DnB Holding ASADnB Holding ASA
Nordlandsbankenand other subsidiaries
Den norskeBank ASA
Den norskeBank ASA
subsidiaries
Vital SkadeAS
Vital SkadeAS
DnB Asset Management
Holding (Sweden) AB
DnB Asset Management
Holding (Sweden) AB
DnB Asset ManagementHolding AS
Vital Forsikring ASA
Vital Forsikring ASA
subsidiaries
Vital Link AS
subsidiaries

3. DnB Group and business areas Second quarter 2003
40 DnB Group
Group structure DnB is organised into five business areas with responsibility for underlying divisions, departments and subsidiaries. The business areas are independent profit centres subject to specific profit requirements. Corporate Banking serves small and medium-sized companies as well as large Norwegian corporations, shipping companies and international corporate customers; Retail Banking serves private customers and smaller companies; DnB Markets is the Group´s capital markets arm; Life Insurance (Vital) represents the Group´s life insurance operations and DnB Asset Management comprises the Group's global asset management operation. In addition, the Group has support and staff functions organised into separate units. Efforts to increase cross-sales and boost efficiency in the internal supply of products and services are key strategic elements.
DnB Group - organisation chart as at 30 June 2003
CorporateCommunications
Jarl Veggan
E-development
Nikolai Stefanovic
E-development
Nikolai Stefanovic
DnB Markets
Ottar Ertzeid
DnB Markets
Ottar Ertzeid
DnB Asset Management
Anders Kvist
DnB Asset Management
Anders Kvist
CorporateBanking
Leif Teksum
•Large Corporates•Shipping•Small and Medium-sized
Enterprises•DnB Finans•DnB Næringsmegling•Regions•International Branches•Nordlandsbanken
Corporate
•Customers FX/Treasury•Trading FX/Treasury•Equities Trading/Research•Corporate Finance•Securities Services•DnB Markets Online•Domestic Treasury•Equity Investments
•DnB Consulting
•DnB Asset Management•DnB Investor•Carlson Investment
Management
Group Staff
Tom Grøndahl
•Financial Reporting•Risk Management•Credit•Legal Department•Company Secretariat•Investor Relations
Financial, Payment andGroup Services
Evlyn Raknerud
RetailBanking
Petter Jansen
LifeInsurance -
Vital
Bjørn Østbø
LifeInsurance -
Vital
Bjørn Østbø
•Vital Forsikring•Vital Link•Vital Eiendomsforvaltning•Vital Pekon
•Postbanken•DnB Retail•Postbanken
Eiendomsmegling•DnB Eiendom•DnB Meglerservice•DnB PrivatBank•Internet Banking•Telephone Banking•Credit Production•Vital Skade•Nordlandsbanken Retail
President and CEOSvein Aaser

Second quarter 2003 3. DnB Group and business areas
DnB Group 41
Business areas Operating results and key financial data for main business areas (pro forma figures) The business area reporting is based on internal management reporting to the Board of Directors and group chief executive. Extracts from profit and loss accounts 1)
Amounts in NOK million 2003 2002 2003 2002 2003 2002 2003 2002 2003 2002 2003 2002
Corporate Banking 1 851 1 954 783 722 1 174 1 166 1 461 1 511 655 (81) 805 1 592
Retail Banking 1 836 1 714 688 657 1 938 1 891 586 479 78 47 507 432
DnB Markets 252 340 790 600 452 462 590 478 0 0 590 478
Life Insurance - Vital 0 0 301 3 0 0 301 3 0 0 301 3
DnB Asset Management 37 8 283 175 248 202 72 (19) 0 0 72 (19)
Nordlandsbanken 2) 279 89 189 179 206 (27)
Other operations (85) 82 (398) (359) 181 177 (665) (454) (43) 277 (622) (731)
DnB Group 4 170 4 098 2 536 1 798 4 182 3 897 2 524 1 998 897 243 1 627 1 755
Pre-tax operating profit/(loss) before
lossesNet interest income Net other operating
income Operating expensesNet losses on loans
and long-term securities
Pre-tax operating profit/(loss)
First half First halfFirst half First half First half First half
Main balance sheet items, average balances 1)
Amounts in NOK billion 2003 2002 2003 2002 2003 2002 2003 2002
Corporate Banking 153.9 153.6 102.9 101.9 12.6 12.0
Retail Banking 138.2 126.2 102.0 95.8 3.4 3.2
DnB Markets 1.3 1.0 10.0 8.8 1.5 1.3
Life Insurance - Vital 71.2 67.9 4.1 4.9
DnB Asset Management 313.0 128.8 1.1 0.4
Nordlandsbanken 2) 24.0 9.1 2.2
Other operations 0.4 0.6 (7.5) (7.7) (66.4) (63.7) 1.8 4.7
DnB Group 317.8 281.5 216.5 198.8 317.8 133.0 26.8 26.5
First half
Assets under management Allocated capital 3)Net lending to
customersCustomer deposits
First half First half First half
Key figures
Per cent 2003 2002 2003 2002 2003 2002 2003 2002
Corporate Banking 44.4 43.4 66.9 66.4 9.3 19.2 1 585 1 576
Retail Banking 76.3 79.2 73.8 75.9 21.4 19.7 2 496 2 660
DnB Markets 43.3 49.1 57.9 53.0 411 431
Life Insurance - Vital 12.5 0.1 607 631
DnB Asset Management 77.5 110.2 9.4 (7.0) 263 383
Nordlandsbanken 2) 51.3 38.0 (1.8) 376
Other operations 1 480 1 455
DnB Group 60.2 65.1 68.1 70.6 10.4 9.9 7 218 7 134
Cost/income ratio excl. goodwill amortisation
Ratio of deposits to lending
Returnon equity 4)
Full-time positions(end of period)
First half First half First half First half
5)

3. DnB Group and business areas Second quarter 2003
42 DnB Group
1) The DnB Group's income, expenses and balance sheet volumes are allocated to the business areas. In the above table some of the income generated in DnB Markets related to foreign exchange/treasury instruments, sales of securities in the primary market, as well as custodial services, is also included in the net other operating income of Retail Banking and Corporate Banking. These double entries are included in the "Other operations" line along with other eliminations and the Group Centre as well as gain/(loss) on DnB's equity investments. The "Other operations" line can be split into the following components:
Amounts in NOK million 2003 2002 2003 2002 2003 2002 2003 2002 2003 2002 2003 2002
Group Centre 10 194 (66) (98) 240 231 (295) (135) (21) (2) (274) (133)
Gain/(loss) on DnB's equity investments (24) (107) (24) (107) (22) 281 (2) (388)
Double entries 5 (8) (299) (279) (13) (12) (282) (275) 0 0 (282) (275)
Eliminations (100) (103) (9) 125 (45) (42) (63) 64 0 (1) (63) 65
Total (85) 82 (398) (359) 181 177 (665) (454) (43) 277 (622) (731)
Net losses on loans and long-term
securities
Pre-tax operating profit/(loss)
Net interest income Net other operating income
Operating expensesPre-tax operating profit/(loss) before
losses
First half First halfFirst half First half First half First half
The Group Centre line comprises Financial, Payment and Group Services and Group Staff, investments in IT infrastructure and shareholder-related expenses.
Amortisation of goodwill for the Group’s acquisition of Nordlandsbanken, Skandia Asset Management, Vital and similar fair value adjustments relating to the Postbanken acquisition are not allocated to the business areas. Goodwill related to the acquisition of Nordlandsbanken amounted to NOK 531 million and is amortised over 10 years starting in January 2003. Goodwill related to the acquisition of Skandia Asset Management amounted to SEK 3 402 million and is amortised over 20 years starting in January 2002. Amortisation for the period January-May has been charged to equity. Goodwill in Vital is amortised by NOK 25 million each quarter, ending in 2005. The amortisation of Postbanken’s fair value adjustments amounts to NOK 12 million per quarter, ending in 2004.
2) Figures are presented according to group principles and assessments and comprise all previous
Nordlandsbanken assets and liabilities, including those transferred to other DnB units. 3) Allocation of equity to the business areas is based on DnB’s internal risk assessment model, which assigns risk
capital for credit, market, insurance, liquidity and operational risk to the various areas of the Group. The Group’s additional equity is mainly a consequence of official capital requirement regulations, but also a necessary cushion for uncertainty in the risk estimates and a buffer to meet future requirements.
4) Calculations of return on equity are based on profits after taxes. A 28 per cent tax rate is used for Corporate
Banking, Retail Banking, DnB Markets, DnB Asset Management and Nordlandsbanken. The tax rate used for Life Insurance - Vital was 10 per cent for the first half of 2002 and 15 per cent for 2003, which represents the expected tax rate.
5) If the SME segment is included under Retail Banking, the cost/income ratio will be 71.0 per cent. Such adjustment
is appropriate when comparing DnB's financial figures with those of international competitors. .

Second quarter 2003 3. DnB Group and business areas
DnB Group 43
Corporate Banking Corporate Banking serves small, medium-sized and large companies. The business area is organised in three divisions; Large Corporates (incl. DnB Næringsmegling), Shipping and Regions, and one subsidiary: DnB Finans. The business area is headed by Leif Teksum, group executive vice president. Corporate Banking's strategy is to be the best financial partner for Norwegian and selected Nordic companies. Within special sectors such as shipping, oil and energy DnB also provides services outside the Nordic region. In addition, the business area wishes to offer DnB's products and expertise to international companies in Norway. Financial performance
Amounts in NOK million 2Q03 1Q03 4Q02 3Q02 2Q02 2003 2002Net interest income 922 929 966 1 027 1 067 1 851 1 954 Net other operating income 433 350 404 283 351 783 722 Total income 1 355 1 279 1 370 1 310 1 418 2 634 2 677 Operating expenses 590 584 566 575 587 1 174 1 166 Pre-tax operating profit before losses 765 695 804 735 831 1 461 1 511 Net losses/(reversals) 289 366 344 123 42 655 (81) Pre-tax operating profit 476 329 461 611 789 805 1 592
Net lending to customers (NOK billion) 156.5 151.3 151.0 151.0 153.3 153.9 153.6 Deposits from customer (NOK billion) 101.5 104.4 100.2 97.6 97.9 102.9 101.9
Cost/income ratio excl. goodwill (%) 43.4 45.5 41.2 43.8 41.3 44.4 43.4
Ratio of deposits to lending (%) 64.8 69.0 66.3 64.6 63.8 66.9 66.4
Return on equity (% p.a.) 10.8 7.7 10.6 14.1 18.8 9.3 19.2
First half
Comments to the financial performance for the first half of 2002/2003
• Performance reflected sound operations and stringent cost control • Adjusted for exchange rate movements, there was an increase of 8.9 per cent in loans and
guarantees on the corresponding period the previous year • In cooperation with DnB Markets, a total of NOK 30.7 billion in syndicated credits was arranged
for customers, in addition to NOK 23 billion in commercial paper and bond issues • New lending targeted customers with low credit risk, and the quality of the loan portfolio is still
considered satisfactory although risk has risen somewhat • Deposits were up 0.6 per cent from December 2002 • Net losses on loans and guarantees in the first half of 2003 amounted to NOK 666 million
excluding gains on long-term securities of NOK 10 million Customers and market development
• The domestic bank market reflected fierce competition with low demand and pressure on margins
• Developments in the Norwegian economy in the first half of 2003 continued the trend from 2002, undermining the financial position of an increasing number of the business area's customers
• The economic challenges facing the Norwegian business sector are expected to continue throughout 2003, particularly for exposed industries
• Corporate Banking will thus devote extensive resources to following up asset quality, and will seek growth in the high-quality end of the Norwegian business sector
• Large Corporates leads the market for large Norwegian corporates, offering services in New York, London and Singapore in addition to the domestic market
• Around 60 per cent of Norway's largest corporations used DnB as their main banker in the first half of 2003

3. DnB Group and business areas Second quarter 2003
44 DnB Group
• DnB is one of the world's largest shipping banks and serves Norwegian and international shipping and offshore clients from offices in Oslo, Bergen, London, New York and Singapore
• Corporate Banking activities in domestic regions target primarily small and medium-sized companies
• In the first six months of 2003, DnB continued to consolidate its position in this market, and surveys show growing customer satisfaction
• DnB Nettregnskap, an Internet accounting service which includes customers' payment transactions and other information relating to the accounts, was launched in June, and the first agreements with customers have been signed
Corporate Banking market shares
31 May 31 March 31 Dec. 30 Sept. 30 JunePer cent 2003 2003 2002 2002 2002
Of total lending to corporates 1) 9.1 9.3 9.3 9.6 9.8- of which commercial and savings banks 22.9 23.1 22.9 23.4 23.8
Of deposits from corporates 2) 25.2 24.0 23.9 23.4 24.6
1) Overall lending includes all credits given to Norwegian customers by domestic commercial and savings banks, state banks, insurance companies,finance companies, bonds, commercial paper, money market loans and foreign institutions
2) Domestic savings and commercial banks
Source: Norges Bank, DnB Development in risk classification
206
53
7
200
53
8
1-4 5-6 7-10
30 June 200230 June 2003
NOK billion
Based on DnB's risk classification system where 1 represents the lowest risk and 10 the highest risk Products and organisation Corporate Banking is organised in three divisions:
• Large Corporates serves large Norwegian corporates, the public sector, international companies doing business in Norway, international customers within oil and energy as well as financial institutions
• The Shipping Division serves Norwegian and international shipping and offshore clients • Regions serves businesses divided into two different segments: - Large companies with a turnover above NOK 40 million - Small and medium-sized enterprises with a turnover of up to NOK 40 million
Corporate Banking offers customers a broad range of financial services, including lending, bond issues, syndicated loans, deposits, cash management, corporate finance and acquisition finance.

Second quarter 2003 3. DnB Group and business areas
DnB Group 45
Staff
• Corporate Banking is committed to systematic competence building to ensure that customers receive the best advisory services and derive the full benefit of DnB's products and services, including expertise within online solutions for corporate customers
• Specialised training in credit rating and risk and profitability analyses is given high priority • At the end of the first half of 2003, the business area had a staff of 1 585 full-time positions, with
1 456 in Norway, of which 371 in subsidiaries, as well as 129 full-time positions located abroad Cooperation with other group entities Through extensive cooperation with other business areas and support functions in the Group, particularly within corporate finance and FX and interest rate instruments, corporate customers are offered a broad range of financial services and life insurance products. Financial performance in Corporate Banking divisions
Amounts in NOK million 2003 2002 2003 2002 2003 2002 2003 2002Net interest income 456 616 304 269 818 813 270 254 Net other operating income 351 260 85 112 361 350 51 46 Total income 807 876 390 380 1 180 1 163 321 301 Operating expenses 280 259 122 119 578 590 166 164 Pre-tax operating profit before losses 527 617 267 261 601 573 155 136 Net losses/(reversals) 105 (32) (23) (62) 544 73 28 (60) Pre-tax operating profit/(loss) 421 650 290 324 57 500 127 196
Net lending to customers (NOK billion) 47.2 48.9 28.4 28.7 64.6 62.5 14.3 13.7
Deposits from customer (NOK billion) 44.1 40.3 14.6 15.5 44.4 46.2 0.0 0.0
Cost/income ratio excl. goodwill (%) 34.7 29.5 31.4 31.3 49.0 50.7 51.2 53.5
Ratio of deposits to lending (%) 93.4 82.3 51.3 54.2 68.8 73.9 - -
Return on equity (% p.a.) 15.2 23.2 19.2 24.4 1.5 14.2 18.6 30.0
First half First half First half First halfLarge Corporates Shipping Regions DnB Finans

3. DnB Group and business areas Second quarter 2003
46 DnB Group
Large Corporates Average volumes 1)
Amounts in NOK billion 2Q03 1Q03 4Q02 3Q02 2Q02 2003 2002Net lending to customers 47 47 46 46 48 47 48Guarantees 21 22 17 16 16 22 16Customer deposits 43 45 39 39 38 44 40
First half
1) Average figures for the period Lending according to sector 1) Risk classification of portfolio 1)
Real estate
Public sector
Trade
Telecom/IT
Oil and gas
Finance
Energy
Manu- facturing
11%
9%
24%
8%
16%
13%
6%
14%
(12%) (13%)
(14%)
(5%)
(17%)
(7%)
(22%)
(10%)
90%
8%2%
Normalised losses< 0.25 %
Normalised losses0.25 - 0.75 %
Normalised losses> 0.75 %
(17%)
(3%)
(80%)
1) Percentages as at 30 June 2002 in parentheses Business profile
• Serving large Norwegian corporates, the public sector, international companies doing business in Norway, international customers within oil and energy as well as financial institutions
• Around 60 per cent of Norway's biggest corporations used DnB as their main banker in the first half of 2003, and DnB provided one or more financial products to 73 per cent of the companies for which it was not principal banker

Second quarter 2003 3. DnB Group and business areas
DnB Group 47
Shipping Division Average volumes 1)
Amounts in NOK billion 2Q03 1Q03 4Q02 3Q02 2Q02 2003 2002Net lending to customers 31 26 27 27 28 28 28Guarantees 10 9 9 9 9 9 9Customer deposits 14 15 15 14 15 15 15
First half
1) Average figures for the period Lending according to sector 1) Risk classification of portfolio 1)
Offshore
Dry cargo
Other shipping
Other non-shipping
Cruise/Ferry
Aviation
RoRo/ Container/
PCC
TankersProducttankers
Shuttletankers
Chemicaltankers
22%
14%
12%
6%
6%
4%
6%
8%
11%8%
(21%)
(15%)
(10%)(6%)(12%)
(7%)
(4%)
(8%)
(7%)
(10%)
3%
(0%)
65%
32%
3%
Normalised losses< 0.25 %
Normalised losses> 0.75 %
Normalised losses0.25 - 0.75 %(19%)
(2%)
(79%)
1) Percentages as at 30 June 2002 in parentheses Business profile
• Among the world’s leading shipping and offshore banks • Provides commercial and investment banking services to high-quality Norwegian and
international shipping and offshore clients from offices in Oslo, Bergen, London, New York and Singapore
• Strong and proactive client focus and long-term relationship perspective Activity in shipping markets was generally high during the first half of 2003. Both tanker and bulk markets were strong with high rates through the first half of 2003. However, there is uncertainty related to future rates. Changes in the competitive climate lead to increased competition for the best clients and thus pressure on margins. In connection with Aequitas Holdings AS' offer to acquire all shares in Leif Høegh & Co., DnB Markets acted as financial advisor and DnB Shipping acted as Arranger and Agent for the financing of the transaction.
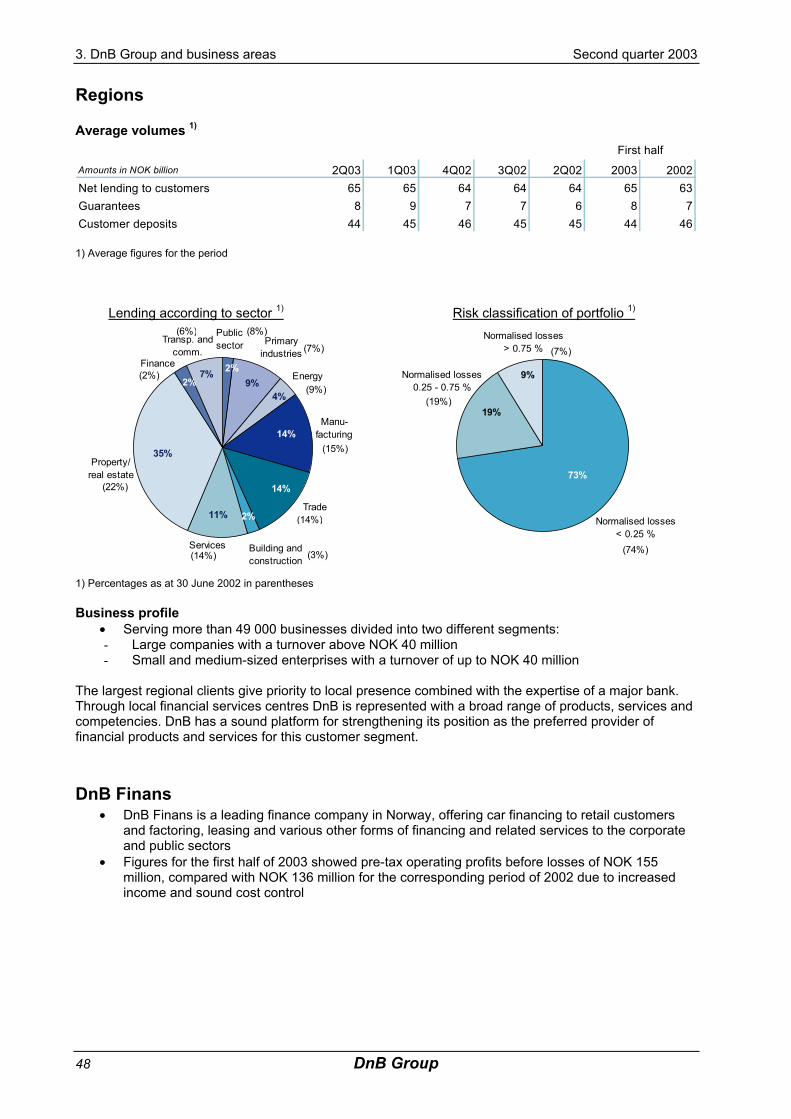
3. DnB Group and business areas Second quarter 2003
48 DnB Group
Regions Average volumes 1)
Amounts in NOK billion 2Q03 1Q03 4Q02 3Q02 2Q02 2003 2002Net lending to customers 65 65 64 64 64 65 63Guarantees 8 9 7 7 6 8 7Customer deposits 44 45 46 45 45 44 46
First half
1) Average figures for the period Lending according to sector 1) Risk classification of portfolio 1)
Manu- facturing
Energy
Publicsector Primary
industries
Trade
Building and construction
Finance
Transp. and comm.
Services
Property/ real estate
2%9%
4%
14%
14%
2%11%
35%
7%2%
(22%)
(14%) (3%)
(14%)
(15%)
(9%)
(7%)
(8%)(6%)
(2%)
73%
19%
9%
Normalised losses< 0.25 %
Normalised losses> 0.75 %
Normalised losses0.25 - 0.75 %
(19%)
(7%)
(74%)
1) Percentages as at 30 June 2002 in parentheses Business profile
• Serving more than 49 000 businesses divided into two different segments: - Large companies with a turnover above NOK 40 million - Small and medium-sized enterprises with a turnover of up to NOK 40 million
The largest regional clients give priority to local presence combined with the expertise of a major bank. Through local financial services centres DnB is represented with a broad range of products, services and competencies. DnB has a sound platform for strengthening its position as the preferred provider of financial products and services for this customer segment.
DnB Finans • DnB Finans is a leading finance company in Norway, offering car financing to retail customers
and factoring, leasing and various other forms of financing and related services to the corporate and public sectors
• Figures for the first half of 2003 showed pre-tax operating profits before losses of NOK 155 million, compared with NOK 136 million for the corresponding period of 2002 due to increased income and sound cost control
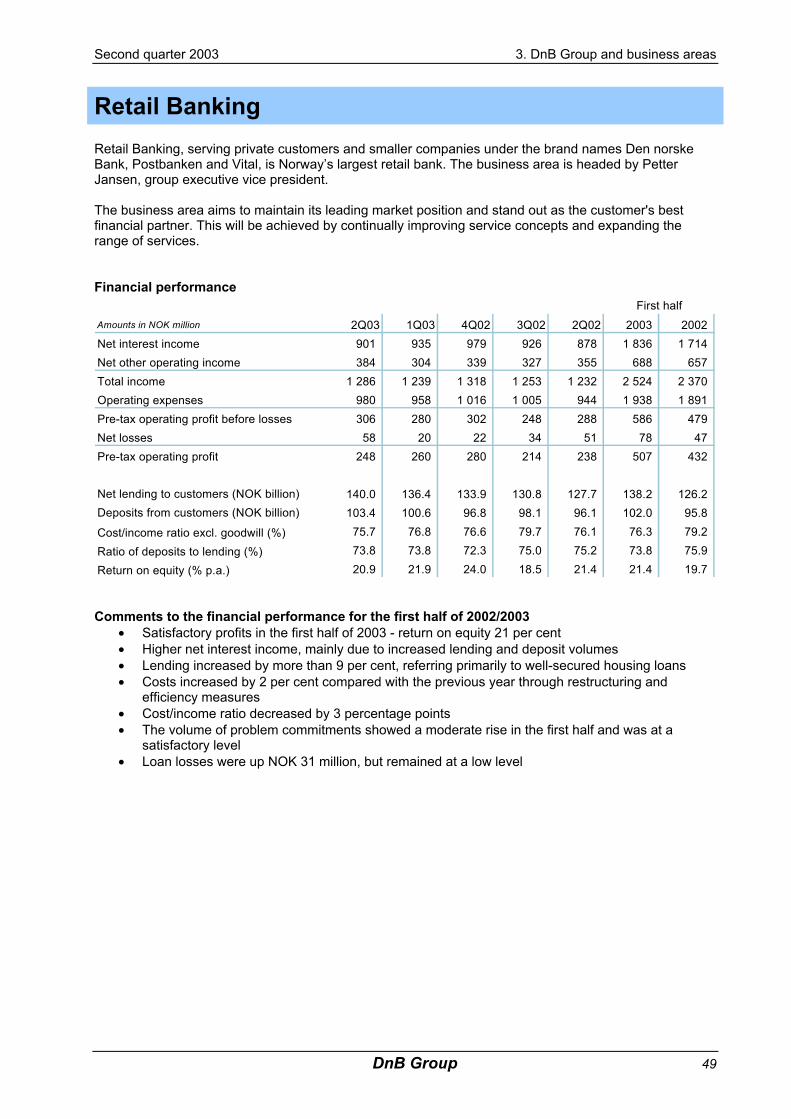
Second quarter 2003 3. DnB Group and business areas
DnB Group 49
Retail Banking Retail Banking, serving private customers and smaller companies under the brand names Den norske Bank, Postbanken and Vital, is Norway’s largest retail bank. The business area is headed by Petter Jansen, group executive vice president. The business area aims to maintain its leading market position and stand out as the customer's best financial partner. This will be achieved by continually improving service concepts and expanding the range of services. Financial performance
Amounts in NOK million 2Q03 1Q03 4Q02 3Q02 2Q02 2003 2002Net interest income 901 935 979 926 878 1 836 1 714 Net other operating income 384 304 339 327 355 688 657 Total income 1 286 1 239 1 318 1 253 1 232 2 524 2 370 Operating expenses 980 958 1 016 1 005 944 1 938 1 891 Pre-tax operating profit before losses 306 280 302 248 288 586 479 Net losses 58 20 22 34 51 78 47 Pre-tax operating profit 248 260 280 214 238 507 432
Net lending to customers (NOK billion) 140.0 136.4 133.9 130.8 127.7 138.2 126.2 Deposits from customers (NOK billion) 103.4 100.6 96.8 98.1 96.1 102.0 95.8 Cost/income ratio excl. goodwill (%) 75.7 76.8 76.6 79.7 76.1 76.3 79.2 Ratio of deposits to lending (%) 73.8 73.8 72.3 75.0 75.2 73.8 75.9 Return on equity (% p.a.) 20.9 21.9 24.0 18.5 21.4 21.4 19.7
First half
Comments to the financial performance for the first half of 2002/2003
• Satisfactory profits in the first half of 2003 - return on equity 21 per cent • Higher net interest income, mainly due to increased lending and deposit volumes • Lending increased by more than 9 per cent, referring primarily to well-secured housing loans • Costs increased by 2 per cent compared with the previous year through restructuring and
efficiency measures • Cost/income ratio decreased by 3 percentage points • The volume of problem commitments showed a moderate rise in the first half and was at a
satisfactory level • Loan losses were up NOK 31 million, but remained at a low level

3. DnB Group and business areas Second quarter 2003
50 DnB Group
Residential mortgages 1)
1) Adjusted definitions Customers/markets
• Serving around 1.7 million private individuals • More than 230 000 customers use telephone payment services (telegiro) • 251 000 customers subscribe to customer benefits programmes • 599 000 clients use the Group's Internet banks • More than 8.6 million payment transactions were carried out in the first half of 2003, an increase
of 12.6 per cent compared with the first half of 2002 Retail banking market shares
31 May 31 March 31 Dec. 30 Sept. 30 JunePer cent 2003 2003 2002 2002 2002Bank lending to households 20.2 20.1 20.1 20.1 20.3 Bank deposits from households 21.9 21.9 21.9 22.3 22.8
Source: Norges Bank, DnB Organisation and distribution Through Norway's largest distribution network, Retail Banking offers a wide range of financial products and services to its customers. The major distribution channels are:
• Den norske Bank and Postbanken's branch offices • The postal network • Internet and telephone banking • Private banking targeting customers in need of more sophisticated financial advisory services,
production, staff and support functions are largely centralised in cost-efficient joint units Den norske Bank ASA and Norway Post have a master agreement relating to the distribution of financial services through the postal network, which is effective until 31 December 2005. The agreement is mainly based on transaction-specific prices and a common aim to increase the number of financial services distributed through the postal network.
• Postbanken and Norway Post have established joint service solutions provided through more than 1 100 in-store postal outlets, where customers can carry out everyday banking transactions in their local stores
• Payment transactions through these channels rose by 27 per cent to more than 4 million transactions from the first half of 2002 to 2003
73
8 29 0
9 6
2 7 2 8 2 8 2 8
5 5 5 7
31 Dec. 2000 31 Dec. 2001 31 Dec. 2002 30 June 2003
NOK billion
Mortgage w ithin 60 per cent of appraised value
Mortgage betw een 60 and 80 per cent of appraised value
Mortgage above 80 per cent of appraised value

Second quarter 2003 3. DnB Group and business areas
DnB Group 51
New products • More than 180 000 customers have accepted to receive notices such as account statements via
e-mail • New index-linked investment products and equity-linked deposits • More than 60 000 customers subscribe to Postbanken's new customer loyalty program:
Postbanken Leve, offering customers a range of basic banking services at favourable terms • Two new investment funds were launched in the second quarter: DnB Kompass and Postbanken
Folkefond. These funds have flexible investment strategies including equity and money market funds and bonds
Employees
• The number of full-time positions has been reduced by 164 to 2 496 through restructuring and efficiency measures
• Changing customer needs and the introduction of new products make it vital to upgrade professional skills
• Upgrading of professional skills is achieved partly by educating and reallocating the existing workforce and partly by recruiting new staff
• More efficient production and distribution of services through new and better IT solutions, telephone and Internet banking is likely to lead to further reductions in the number of employees in the coming years
Cooperation with other group entities Cross selling of products is one of the major strengths of the DnB Group. Through its distribution network Retail Banking offers:
• Asset management services (DnB Asset Management) • Insurance (Vital) • Financial instruments (DnB Markets)
Residential real estate broking DnB Eiendom and Postbanken Eiendomsmegling are two of Norway’s leading residential real estate broking operations: Properties sold/market shares
Properties sold 2Q03 1Q03 4Q02 3Q02 2Q02 2003 2002DnB Eiendom 2.242 1.567 1.352 1.702 2.177 3.809 3.898 Postbanken Eiendom 2.708 2.373 2.045 2.244 2.750 5.081 5.056 Total properties sold 4.950 3.940 3.397 3.946 4.927 8.890 8.954
Market share (%) 1) 19 19 18 18 18 19 18
First half
1) Management's estimates
• DnB Eiendom had 46 outlets located in Den norske Bank branches as at 30 June 2003 • Postbanken Eiendomsmegling operates through 61 franchises owned by independent real estate
brokers • In addition to broking income, the real estate broking operations generate business in the form of
residential mortgages and savings • The time elapsed from an assignment is received to the property is sold increased somewhat in
parts of the country in the first half of 2003

3. DnB Group and business areas Second quarter 2003
52 DnB Group
Consumer finance • DnB Kort is responsible for the DnB Group's card-based services and consumer finance products • DnB Kort showed healthy profits in the first half of 2003. Pre-tax operating profits increased by
NOK 42 million or 66 per cent compared with the previous year to NOK 106 million • Average lending volume rose NOK 766 million to NOK 4 434 million from the first half of 2002,
stemming in part from increased sales of consumer loans • During the same period there was a slight increase in non-performing loans in line with
expectations, but from a low level • As at 30 June 2003, the DnB Group had issued more than 1.7 million cards • Postbanken's new customer loyalty programme Postbanken Leve includes a Visa card (debit
card) and a MasterCard (credit card) and has been well received by the customers
Non-life insurance In 2002, Vital Skade, the Group's non-life insurance operation, was transferred to Retail Banking, which in addition to Internet is the company's primary distribution channel. Products are sold on a commission basis. Vital Skade assumes no risk on its own, but operates as an agent. The reorganisation has led to more effective marketing. Brisk sales through the Internet banks and several new cooperation agreements with employee organisations increased net operating income from NOK 17 million in the first half of 2002 to NOK 27 million in 2003. Costs were at level with the previous year.

Second quarter 2003 3. DnB Group and business areas
DnB Group 53
Capital markets DnB Markets, the capital markets arm of DnB, is Norway's largest capital markets operation and offers a wide range of securities and investment services. DnB Markets comprises the following units: Sales FX/Treasury, Trading FX/Treasury, Equities (Sales/Research), Corporate Finance and Securities Services. The Group Treasury and Equity Investments are organisationally part of DnB Markets though profits and losses for these units are not recorded under this business area. Ottar Ertzeid, group executive vice president, is head of DnB Markets. DnB Markets aims to be the leading capital markets operation providing foreign exchange, interest rate and debt and equity financing services to Norwegian and Norwegian-related clients, as well as offering international customers services relating to Norway and the Norwegian krone. Financial performance
Amounts in NOK million 2Q03 1Q03 4Q02 3Q02 2Q02 2003 2002Net interest income 119 133 170 158 156 252 340 Net other operating income 409 381 307 278 280 790 600 Total income 528 514 477 435 436 1 042 940 Operating expenses 222 229 224 220 227 452 462 Pre-tax operating profit before losses 306 284 253 216 209 590 478 Net losses/(reversals) 0 0 (38) 0 0 0 0 Pre-tax operating profit 306 284 291 216 209 590 478
Cost/income ratio excl. goodwill (%) 42.0 44.7 47.0 50.5 52.1 43.3 49.1
Return on equity (% p.a.) 61.1 54.9 60.7 46.0 46.1 57.9 53.0
First half
Comments to the financial performance for the first half of 2002/2003
• DnB Markets achieved record profits in the first half of 2003 due to increased turnover in most areas
• Falling interest rates and substantial changes in the NOK exchange rate throughout the period led to increased demand for currency and interest rate hedging products and fixed-income securities
• The positive trend in the stock market stimulated activity within equities broking, and activity was brisk within corporate finance
Income distribution DnB Markets 1)
327 321360 385
87 91 92 120 125
414 411452
491 510
371
2Q02 3Q02 4Q02 1Q03 2Q03Income on customer business Income on trading / market making Total income
NOK million
1) Excluding interest on allocated capital

3. DnB Group and business areas Second quarter 2003
54 DnB Group
Customers/markets • DnB Markets is Norway's largest capital markets operation • Market share of over 30 per cent in terms of revenues • The market is served from 12 cities in Norway, branches in London, New York and Singapore
and over the Internet. DnB Markets' 12th sales desk in Norway was established during the second quarter of 2003 in connection with DnB's acquisition of Nordlandsbanken
• In addition, certain products are sold through other business areas in the Group as well as through external agents
• Leading FX-provider and adviser to Norwegian corporate customers • Business from retail customers and small and medium-sized corporate clients has grown in
significance • Leading arranger of debt financing in capital markets for Norwegian borrowers • Leading position within derivatives and structured products in Norway • Leading within equities sales in the retail market in Norway • The investment firm with the highest number of equity transactions on the Oslo Stock Exchange
(OSE) • Leading within domestic securities services with settlement for foreign OSE members
(end of June market share of 61 per cent of the number of trades and 73 per cent of the turnover for these members)
Products
• Foreign exchange, money market instruments and derivatives • Fixed-income instruments and loan syndications • Equities, research and corporate finance services • Other investment products • Securities and custodial services
Employees
• DnB Markets has close to 500 employees located in offices in Norway and abroad • The organisation and staff assignments have been continually adapted to developments in the
various market segments and product areas
Cooperation with other group entities Maintaining a broad distribution network and effective cooperation with other business areas in the Group, such as Corporate Banking and Retail Banking, are key priorities for DnB Markets. Revenues within various segments
Amounts in NOK million 2Q03 1Q03 4Q02 3Q02 2Q02 2003 2002FX & intererest rate derivatives 184 182 190 134 138 365 296 Investment products 119 108 101 130 110 227 168 Corporate finance 47 46 35 24 42 93 97 Securities services 36 35 34 33 37 71 76 Total customer revenues 385 371 360 321 327 756 637 Total market making/trading revenues 125 120 92 91 87 245 260 Interest income on allocated capital 18 23 24 24 22 41 43 Total revenues 528 514 477 435 436 1 042 940
First half

Second quarter 2003 3. DnB Group and business areas
DnB Group 55
Distribution of revenues over the 128 trading days up to 30 June 2003
0 0 0 0 0 0 0 0 0 0
6
0
19 18
30
13
19
10
6
2 14
Less
-25
000
-22
500
-20
000
-17
500
-15
000
-12
500
-10
000
-7 5
00
-5 0
00
-2 5
00 0
2 50
0
5 00
0
7 50
0
10 0
00
12 5
00
15 0
00
17 5
00
20 0
00
22 5
00
>25
000
NOK thousand
Number of days
The value of items on and off the balance sheet is affected by interest rate movements. The table below shows potential losses for DnB resulting from parallel one-percentage point changes in all interest rates. The calculations are based on a hypothetical situation where interest rate movements in all currencies are unfavourable for DnB relative to the Group's positions. Also, all interest rate movements within the same interval are assumed to be unfavourable for the Group. In the trading portfolio, such losses will be charged to the accounts as they occur. In the banking portfolio, the losses will be amortised over the remaining maturity. The calculations are based on the Group's positions as at 30 June 2003 and market rates on the same date.
Amounts in NOK millionUp to
1 month
From1 month
to 3 months
From3 monthsto 1 year
From1 year
to 5 yearsOver
5 years Total
Trading portfolioNOK 3 8 6 18 6 0
USD 8 29 38 1 5 5
EURO 3 0 5 8 4 3
GBP 0 0 0 0 0 0
Other currencies 1 9 12 6 1 11
Banking portfolio 0 0 0 0 0 0
NOK 2 17 87 28 61 102
Total 0 0 0 0 0 0
NOK 1 25 81 11 55 101
USD 8 29 38 1 5 5
EURO 0 0 0 0 0 0
GBP 0 0 0 0 0 0
Other currencies 1 9 12 6 1 11
The table does not include adminstrative interest rate risk and interest rate risk relating to non-interest-earning assets

3. DnB Group and business areas Second quarter 2003
56 DnB Group
Life Insurance - Vital Vital Forsikring offers group pension schemes to businesses and the public sector. In the retail market, long-term savings alternatives are offered in the form of individual pension agreements and annuities.
Life insurance operations in the DnB Group are represented by Vital Forsikring ASA including subsidiaries and the sister company Vital Link AS. Figures below refer to Life insurance operations in the DnB Group, if not stated otherwise. Bjørn Østbø, group executive vice president, is the head of Life Insurance - Vital.
Vital aspires to build a leading position within pension savings in Norway. Alone or in cooperation with others, the company will, in a cost-efficient manner, develop, sell and deliver the best savings and insurance solutions for companies, retail customers and the public sector. Financial performance
Amounts in NOK million 2Q03 1Q03 4Q02 3Q02 2Q02 2003 2002
Interest result 1) 1 283 110 69 (5) (602) 1 393 (59)
Risk result 2) (140) (24) (29) (6) 112 (164) 75
Administration result (25) (8) (80) (27) (2) (32) (31)
Other 2 (42) (3) (13) - (40) (23)
Transferred from / (to) security reserve 3) 0 (1) 69 - (1) (1) (4)
Profit for allocation 4) 1 119 36 26 (51) (494) 1 155 (42)
Funds transferred to policyholders 827 51 (2) - (331) 878 3
Tax charge / (revenues) 42 (17) (17) (8) (78) 25 (63)
Profit Vital Forsikring 250 2 45 (42) (85) 252 17
Net profit/(loss) in Vital Link (2) 0 (18) (7) (9) (2) (8)
Net profit/(loss) from Vital 248 2 27 (49) (94) 250 9
Goodwill amortisation Vital Forsikring 25 25 25 25 25 51 51 Net profit/(loss) from Vital in the group accounts 222 (23) 1 (74) (119) 199 (42)
+ Goodwill amortisation Vital Forsikring 25 25 25 25 25 51 51 +Adjustment of allocated capital in excess of recorded
capital 5) 9 18 14 20 30 27 60
+ Taxes 41 (17) (24) (11) (81) 24 (66)
Pre-tax operating profits for the business area 298 3 17 (39) (145) 301 3
First half
1) For developments in financial result, the asset mix and returns, see tables pages 55, 57 and 58 2) Disability provisions are expected to be increased by around NOK 600 million in the course of 2003, of which NOK 147 million and 146 million was charged to the first-quarter and second-quarter accounts, respectively 3) After approval by the Banking, Insurance and Securities Commission, Vital transferred funds exceeding the minimum requirement from the security reserve in 2002. The remaining security reserve totaled NOK 106 million at the end of June 2003 4) Profit for allocation to the owner and taxes for products subject to profit sharing includes: - return on equity, subordinated loan capital and the security reserve, calculated as the company's return on capital, less accrued interest on subordinated loans and allocations to the security reserve - 0.38 per cent of policyholders' funds - 12 per cent of effective risk premium adjusted for survival risk on contracts providing sufficient profits Profit for allocation to the owner and taxes cannot exceed 35 per cent of total profits for allocation to policyholders, the owner and taxes. If this figure is negative, the entire amount should be charged to the owner. Profit for allocation to the owner and taxes includes profits from operations not subject to profit sharing 5) Allocated capital represents ownership risk for Vital and is based on DnB's risk assessment model

Second quarter 2003 3. DnB Group and business areas
DnB Group 57
Extracts from balance sheets and key figures 1)
Amounts in NOK million 2Q03 1Q03 4Q02 3Q02 2Q02 2003 2002
Policyholders' funds 2) 73 949 71 060 68 501 68 607 68 593 73 949 68 593
Solvency capital 3) 8 778 6 158 5 701 4 580 5 389 8 778 5 389
Return on equity 4) 25.3 0.3 1.5 (3.3) (10.7) 12.5 0.1
Costs in per cent of policyholders' funds 2) 1.05 1.02 1.40 1.16 0.90 1.02 1.00
1) Figures refer to the end of the accounting periods2) Policyholders' funds consists of insurance provisions, result for the period and 75 per cent of security adjustment reserve3) Vital Forsikring. For the composition of solvency capital, see table on page 594) Calculations of return on equity is based on allocated capital and after tax charges
First half
Financial result – Vital Forsikring
Amounts in NOK million 2Q03 1Q03 4Q02 3Q02 2Q02 2003 2002
Net result from equities 1 365 (392) 220 (2 432) (3 387) 973 (3 166)
Net result from other asset classes 1 432 1 122 1 191 2 000 2 059 2 554 2 921
Value-adjusted financial result 1) 2 797 730 1 411 (432) (1 328) 3 527 (245)
Guaranteed return on policyholders' funds 632 620 651 602 586 1 252 1 179
Financial result 2 165 110 760 (1 034) (1 914) 2 275 (1 424)
+ From securities adjustment reserve (882) 0 0 0 0 (882) 53
+ Covered by/(transferred to) additional allocations 2) 0 0 (691) 1 029 1 312 0 1 312
Recorded interest result 1 283 110 69 (5) (602) 1 393 (59)
1) Before changes in unrealised gains / (losses) on long-term securities2) In accounting for the expected contribution from Vital, DnB in 2002 took account of Vital's opportunity to cover part of the losses through the reversal of additional allocations in year-end adjustments.
First half
Comments to the financial performance for the first half of 2002/2003
• The stock market upturn and falling interest rates ensured a sound financial result • NOK 882 million was accumulated in the securities adjustment reserve • Increase in premium income • Net inflow of transfers • Increase in solvency capital • The risk result includes a NOK 293 million increase in disability provisions
Premium income
Amounts in NOK million 2Q03 1Q03 4Q02 3Q02 2Q02 2003 2002
Single premiums 704 975 700 936 618 1 680 1 239
Annual premiums 726 2 052 414 732 447 2 777 2 468
Total premiums due 1 430 3 027 1 114 1 668 1 065 4 457 3 707 Inflow of reserves 1) 274 779 657 407 393 1 053 1 342
Outflow of reserves 229 342 340 243 197 570 429
Net premiums paid 1 475 3 464 1 431 1 832 1 261 4 940 4 620 Outflow of premiums 229 342 340 243 197 570 429 Total premium income 1 703 3 805 1 771 2 075 1 458 5 510 5 049 Sale of individual policies through DnB's
distribution network (%) 46.6 37.9 45.2 39.0 46.2 42.0 44.0
1) of which transferred from Vital Forsikringto Vital Link 90 175 116 42 67 265 173
First half

3. DnB Group and business areas Second quarter 2003
58 DnB Group
Market shares 31 March 31 Dec. 30 Sept. 30 June 31 March
Per cent 2003 2002 2002 2002 2002Of total premiums due 23.8 17.1 17.7 21.2 24.8Of total premium plus inflow of premium reserves 23.8 18.5 18.5 22.2 24.5Of new business 31.4 36.5 33.1 29.3 27.2Of insurance funds 19.0 18.9 18.9 19.3 19.4Of insurance funds for unit linked products 36.3 35.5 34.0 34.4 35.1All premiums include reserves transferred from other life insurance companies
Source: Association of Norwegian Financial Managers in the Finance Sector / FNH / DnB Products and organisation Vital offers:
• Group pension schemes to businesses, adapted to customer needs for defined-benefit, defined-contribution and single premium pension schemes
• Long-term savings alternatives in the form of individual pension agreements and annuities in the retail market
• Products are offered with guaranteed returns or provided by Vital Link with a choice of investment profile (unit linked)
• Group life, endowment and personal insurance • Savings products from other units in the DnB Group, including investment funds from DnB
Investor and equity-linked bonds from DnB Markets
Vital is represented nationwide through its sales offices, on the Internet, through DnB and Postbanken's distribution networks and independent agents. Changes made in the management structure of life insurance operations in 2002 included the establishment of business units for corporate clients, individual clients and the public sector as profit centres. Employees
• Vital gives priority to retaining skilled employees and developing high levels of competence within insurance products, management and other relevant areas of expertise
• Vital staff comprised 607 full-time positions as at 30 June 2003, down from 631 a year earlier Development in full-time positions:
30 June 31 March 31 Dec. 30 Sept. 30 June2003 2003 2002 2002 2002
Vital Forsikring 578 591 602 604 604 Vital Link 29 30 30 31 27 Total 607 621 632 635 631 Cross-sales/cooperation
• By taking advantage of the strength of the DnB Group's total distribution network, Vital will be well placed to enjoy continued market progress
• Vital's growth in the retail market is not least due to the company's extensive distribution network, where DnB channels play a principal role
• In the first half of 2003, DnB accounted for 42 per cent of the sales of Vital's products in the retail market, compared with 44 per cent in the same period in 2002

Second quarter 2003 3. DnB Group and business areas
DnB Group 59
Balance sheets – Vital Forsikring 30 June 31 March 31 Dec. 30 Sept. 30 June
Amounts in NOK million 2003 2003 2002 2002 2002Financial assets
Norwegian equities 1) 4 107 3 228 3 544 3 477 4 671
International equities 1) 4 235 3 757 3 856 3 851 8 415 Norwegian bonds 9 470 8 050 7 484 8 171 8 091 International bonds 11 236 9 881 9 119 9 090 12 182 Money market instruments 9 064 12 626 15 039 14 421 10 254 Bonds held to maturity 22 617 19 598 17 398 14 878 13 466 Real estate 9 093 9 130 7 735 7 699 7 579 Other 4 142 5 097 5 268 6 507 4 239 Total assets 73 964 71 367 69 443 68 093 68 895 Equity 3 267 3 016 3 014 628 1 699 Subordinated loan capital 1 304 1 298 1 349 1 423 1 424 Securities adjustment reserve 882 0 0 0 0 Insurance provisions Premium reserve 63 324 61 755 59 774 59 010 57 828 Additional allocations 713 720 726 2 387 2 400 Premium fund and pension regulation fund 2 961 3 035 3 408 3 382 4 186 Security reserve 106 106 105 175 175 Other reserves 517 494 127 293 279 Other liabilities 890 943 940 795 904 Total equity and liabilities 73 964 71 367 69 443 68 093 68 895 1) Net equity exposure in Vital Forsikring after entering into derivative contracts
7 670 6 397 5 870 5 264 12 350
Balance sheet – Vital Forsikring
30 June 2002 30 Sept 2002 31 Dec. 2002 31 March 2003 30 June 2003
Other
Real estate
Bonds held to maturity
Money market instruments
Bonds, international
Bonds, Norwegian
Equities, international 1)
Equities, Norwegian 1)
68 093 69 443 6 %
11 %
15 %
12 %
12 %
11 %
25 %
22 %
11 %
5 %
11 %
12 %
13 %
21 %
22 %
6 %
5 %
68 895
7 %
18 %
20 %
6 %
13 %
Per cent
5 %5 %
11 %
14 %
13 %
71 367 73 964
6 %
13 %
15 %
18 %
27 %
12 %
31 %
12 %
6 %
10 %8 %
7 %6 %
1) After entering into derivative contracts, Vital's equity exposure as at 30 June 2003 was 10 per cent.

3. DnB Group and business areas Second quarter 2003
60 DnB Group
Return on assets – Vital Forsikring
Per cent 2Q03 1Q03 4Q02 3Q02 2Q02 2003 2002
Financial assets
Norwegian equities 1) 27.0 (10.2) 3.8 (23.7) (17.2) 16.8 (10.7)
International equities 1) 14.3 (1.2) 1.1 (19.4) (23.2) 13.1 (24.7) Norwegian bonds 5.5 3.4 3.1 4.2 1.3 9.1 1.2 International bonds 2.9 2.9 3.0 5.4 3.8 5.8 4.9 Money market instruments 2.0 1.7 2.1 1.9 1.5 3.7 2.7 Bonds held to maturity 1.6 1.7 1.5 1.7 1.7 3.3 3.5 Real estate 1.9 1.8 2.4 2.8 2.1 3.7 4.5
Recorded return on total assets 1) 2.7 1.1 2.1 (0.6) (1.8) 3.8 (0.2)
Value-adjusted return on assets I 2) 4.0 1.1 2.1 (0.6) (1.8) 5.1 (0.3)
Value-adjusted return on assets I, annualised 2) 16.8 4.3 8.6 (2.4) (7.0) 10.5 (0.6)
Value-adjusted return on assets II, annualised 3) 20.2 7.3 12.0 (0.8) (7.7) 13.7 (1.7)
1) Excluding changes in unrealised gains on financial assets and changes in value of bonds held to maturity.2) Excluding changes in value of bonds held to maturity.3) Including changes in value of bonds held to maturity.
First half
Solvency capital 1) – Vital Forsikring
30 June 31 March 31 Dec. 30 Sept. 30 JuneAmounts in NOK million 2003 2003 2002 2002 2002
Securities adjustment reserve 882 - - - - Interim profit/(loss) 1 155 36 - (2 366) (1 295) Additional allocations 713 720 726 2 387 2 400 Unrealised gains 1 603 1 018 506 (33) (309) Security reserve 106 106 105 175 175 Subordinated loan capital 1 305 1 298 1 349 1 423 1 424 Equity 3 014 3 014 3 014 2 994 2 994 Solvency capital 8 778 6 192 5 701 4 580 5 389 Buffer capital in excess of the 8 per cent minimum capitalrequirement and additional allocations, and securityadjustment reserve
4 286 2 406 2 428 1 731 2 508
1) The table above shows the composition of and development in the solvency capital. All these elements, with the exception of part of the security reserve, can be used to meet the guaranteed rate of return on policyholders' funds.

Second quarter 2003 3. DnB Group and business areas
DnB Group 61
Capital adequacy and solvency margin capital – Vital Forsikring
30 June 31 March 31 Dec. 30 Sept. 30 June
Amounts in NOK million 2003 2003 2002 2002 2002
Capital adequacy 1)
Total eligible primary capital 3 893 3 864 3 927 4 062 4 122 Capital ratio (%) 13.2 14.0 14.8 15.3 13.1Core capital 2 775 2 772 2 767 2 832 2 872 Core capital (%) 9.4 10.0 10.4 10.7 9.1
Solvency margin capital 2)
Solvency margin capital 4 303 4 272 4 337 4 177 4 759 Solvency margin capital exceeding minimum requirement 1 340 1 476 1 542 1 519 2 092
Solvency margin capital in per cent of solvency margin capital requirement (%) 145 153 155 157 178
1) Capital adequacy regulations regulate the relationship between the company's primary capital and the investment exposure on the asset side of the balance sheet. Life insurance companies are subject to a minimum capital adequacy requirement of 8 per cent 2) Solvency margin capital is measured against the solvency margin requirement, which is linked to the company's insurance commitments on the liabilities side of the balance sheet. The solvency margin requirements for Norwegian life insurance companies are subject to regulations on the calculation of solvency capital requirements and solvency margin capital, as laid down by the Ministry of Finance on 19 May 1995

3. DnB Group and business areas Second quarter 2003
62 DnB Group
Asset management DnB Asset Management provides investment fund and discretionary portfolio management services to Norwegian and Nordic corporate customers, the public sector, private pension funds and retail customers. Anders Kvist, group executive vice president, heads the business area. DnB Asset Management seeks to provide first-class returns on customer funds within the preferred risk profile and investment horizon. DnB aspires to be the leading asset manager for customers in the Nordic region, providing sound long term returns and a high level of service based on a thorough understanding of customer needs. Extracts from profit and loss accounts 1)
ProformaFirst half First half First half
Amounts in NOK million 2Q03 1Q03 2Q02 1Q02 2003 2002 2002Net interest income 18 19 4 4 37 8 42 Commision income and other income
- from retail customers 46 37 83 - from institutional clients 94 106 200
Total income 158 162 116 67 320 183 357 Operating expenses 119 129 119 82 248 202 331 Pre-tax operating profit/(loss) 39 33 (3) (15) 72 (19) 26
Assets under management 2)
Institutional 319 290 290 81 319 290 290
- of which Vital 68 64 62 63 68 62 62 Retail 21 19 21 20 21 21 21 Total 340 308 310 101 340 310 310
Key figures
Cost/income ratio excl. goodwill 75.6 79.4 103.0 122.5 77.5 110.2 92.6
Return on equity (% p.a.) 10.0 8.7 (0.8) (13.9) 9.4 (7.0) 3.4
1) Including SAM as from 1 June 2002.2) Assets under management at end of period.3) Profits from SAM have been annualised.
175 64 112 315
Income
• Commission income increased by NOK 100 million relative to the first half of 2002. This was due to the acquisition of SAM, which was included in the accounts as from 1 June 2002
• Relative to comparable operations in the first half of 2002, commission income was down NOK 40 million. This was mainly due to the negative equity market development in 2002, which continued through the first quarter of 2003
• Gross margins have decreased due to a higher relative share of investments in lower margin money market funds from retail customers
Operating expenses
• Operating expenses in the first half of 2003 were NOK 248 million, which was NOK 80 million below expenses for comparable operations in the first half of 2002. This is due to a significant global restructuring effort implemented ahead of plan, which will be finalised in 2003
• During the first half of 2003, NOK 51 million of restructuring provisions were utilised, leaving NOK 58 million in such provisions at the end of June

Second quarter 2003 3. DnB Group and business areas
DnB Group 63
Assets under management
271 290319
20
2121 20
1921
265290
81
31 March 2002 30 June 2002 30 Sept. 2002 31 Dec. 2002 31 March 2003 30 June 2003
Institutional clients Retail market
NOK billion
101
310286 291 308
The increase in assets under management as at 30 June 2002 relates to the acquisition of Skandia Asset Management
340
Changes in assets under management Net inflow
Amounts in NOK million 2Q03 1Q03 2Q02 1Q02 1H03 1H02 2002 Proforma2002
Retail market (273) (417) 2 870 619 (690) 3 489 (225) (157)
Institutional clients 2 200 4 892 3 070 835 7 092 3 905 3 069 (773)
Total 1 927 4 475 5 940 1 454 6 402 7 394 2 844 (930)
Full year
1) Exclusive dividends of NOK 957 million, of which NOK 650 million refers to retail and NOK 307 million to institutional clients
• Assets under management increased by NOK 49 billion or 17 per cent in the first half of 2003 • The net inflow of new funds increased assets under management by NOK 6.4 million or 2.2 per
cent (non-annualised) • New institutional mandates won in both Sweden and Norway • Market developments led to a NOK 16.3 billion increase in assets under management,
representing a 5.8 per cent increase measured in the customers' base currencies • The depreciation of NOK against other currencies, especially SEK, increased assets under
management by NOK 26.6 billion or 9 per cent • During the first half of 2003 Morgan Stanley's global equity index (MSCI World) increased by 7.5
per cent measured in local currency, and by 16.1 per cent in NOK • The stock exchanges in Stockholm (OMX) and Oslo (OSEBX) increased by 0.8 and 16.5 per cent
respectively Investment returns on assets under management
• Returns on a number of major client portfolios and funds outperformed relevant benchmarks. This applies among others to Vital Forsikring's total equity and bond investments and major Swedish equity portfolios, as well as DnB Asset Management's Healthcare and Eastern European funds

3. DnB Group and business areas Second quarter 2003
64 DnB Group
Customers/markets • DnB Asset Management serves the Norwegian and Swedish savings markets, offering domestic
and international asset management services • Brand names - DnB Asset Management in the Norwegian and Swedish institutional markets - DnB Investor in the Norwegian retail market - Carlson in the Swedish institutional and retail markets
• Around 400 institutional clients and a leading position in the institutional market in both Norway and Sweden
• The largest clients are Skandia Liv and Vital • The number of customer relationships in the retail market, calculated as the aggregate number of
investments made or mandates per customer, was over 763 000 at the end of June 2003. This includes more than 170 000 savings agreements
• Market shares - DnB Investor (mutual funds in Norway) 22.9 per cent, being the largest mutual fund manager in
Norway, Carlson Fonder (mutual funds in Sweden) is among the ten largest mutual fund managers in Sweden
Products
• Mutual funds and Absolute Return Products - 33 of 105 DnB managed funds managed by DnB have received the top or second highest
ranking from the rating company Morningstar - DnB launched two new retail funds in May, DnB Kompass and Postbanken Folkefond.
• Discretionary portfolio management • Management and monitoring of investment portfolios • Advising customers with respect to asset allocation and risk levels
Organisation
• The implementation of a unified international asset management operation and a global organisation of operating and support functions is ahead of plan and is expected to be completed by the end of 2003
• A combination of regional and sector-oriented management teams with a presence in all major financial markets
• While customer activity is concentrated in Norway and Sweden, in order to provide competitive global asset management, investment operations have also been established in London, New York, Hong Kong and India
• Asset management services are provided through channels adapted to the various markets:
Retail customers in Norway DnB's extensive network of branches, post offices and regional financial services centres
The Internet External channels including brokers and
investment advisors Retail customers in Sweden and Germany
Local distributors
Institutional market in Sweden and Norway
The business area's own sales force and, in Norway, through cooperation with Corporate Banking
Employees
• Staff cuts corresponding to 70 full-time positions in the first half of 2003 • Additional staff reductions of 29 full-time positions will be implemented in 2003 • 263 full-time positions at end of period • Subsequent to the staff reductions, around 60 per cent of the employees work within investment
management, analysis, advisory services and sales

Second quarter 2003 3. DnB Group and business areas
DnB Group 65
Cooperation with other group entities • DnB's extensive network represents the major distribution channel to the Norwegian retail market • DnB Asset Management and Corporate Banking cooperate in providing a complete range of
financial services to corporate customers • DnB Asset Management manages Vital's equity and bond portfolios • DnB Asset Management cooperates with other group entities in developing products adapted to
the various markets
DnB Investor Fund capital and market shares
Amounts in NOK million 1) and per cent 2)
Fund capital
Market share
Fund capital
Market share
Fund capital
Market share
Fund capital
Market share
Fund capital
Market share
Equity funds (Norwegian) 4 723 24.6 3 729 25.0 4 432 20.2 4 211 19.9 5 883 20.2
Equity funds (international) 4 572 13.1 3 942 14.6 4 142 19.7 4 322 18.1 5 753 17.8
Balanced funds 1 150 41.6 1 005 43.7 1 096 42.9 1 212 46.3 1 510 46.5
Fixed-income funds 2 614 17.0 1 811 12.6 1 622 12.8 1 607 13.4 1 968 16.4
Money market funds 14 882 30.0 14 811 31.3 14 646 31.7 14 661 31.3 14 062 31.4
Total mutual funds 27 940 22.9 25 299 23.9 25 939 24.2 26 013 24.4 29 175 24.1
of which Skandia Fondsforvaltning AS 3) 3 363 3.2 4 129 3.4
1) Including mutual funds acquired in connection with the acquisition of Skandia Asset Management as from 1 June 2002.
2) Source: Norwegian Mutual Fund Association
3) Skandia Fondsforvaltning AS was merged with DnB Investor AS on 1 October 2002.
30 June 2003 31 March 2003 31 Dec. 2002 30 Sept. 2002 30 June 2002

3. DnB Group and business areas Second quarter 2003
66 DnB Group
Nordlandsbanken Nordlandsbanken, headed by Morten Støver, serves shipping customers, small and medium-sized companies and the retail market. Operations focus on the market in the county of Nordland in Northern Norway, and the bank will be a regional bank headquartered in Bodø, aiming to become the best financial partner for customers in Nordland by combining local presence, DnB and Nordlandsbanken's joint expertise and DnB's extensive product range. Measures to realise cost synergies were pursued, including moving operations to common premises in several cities, establishing a joint infrastructure for banking operations in Nordland and centralising collateral functions and loan administration to Bodø. Figures for Nordlandsbanken presented below are based on DnB's valuation of Nordlandsbanken's balance sheet as at 31 December 2002 and are prepared in accordance with DnB's accounting principles for business areas. See section 1 for details concerning the accounting treatment of the acquisition. Financial performance 1)
First halfAmounts in NOK million 2Q03 1Q03 2003Net interest income 131 148 279 Net other operating income 55 35 89 Total income 186 183 368 Operating expenses 92 97 189 Pre-tax operating profit before losses 94 85 179 Net losses 203 3 206 Pre-tax operating profit (109) 82 (27)
Key FiguresNet lending to customers (NOK billion) 23.6 24.4 24.0
Deposits from customer (NOK billion) 9.1 9.2 9.1
Cost/income ratio excl. goodwill (%) 49.4 53.3 51.3
Ratio of deposits to lending (%) 38.6 37.5 38.0
Return on equity (% p.a.) (18.6) 11.0 (1.8) 1) Excluding amortisation of goodwill and funding costs related to the acquisition and including interest on allocated equity. Comments to the financial performance for the first half of 2003
• Satifactory pre-tax operating profit before losses in the first half of 2003 • The combined interest spread was 2.8 per cent for the January through June period • Positive trend in cost/income ratio due to integration of operations • Weak developments in parts of the corporate segment resulted in a high level of loan losses • Net problem commitments amounted to NOK 3.2 billion as at 30 June 2003
Customers and market development
• Around 8 000 active corporate customers • Around 54 000 active retail customers • The market situation continued to represent major challenges for some of Nordlandsbanken's
customers in the second quarter • Price trends for salmon and the competitive situation in the Norwegian business community will
have a pronounced impact on future developments

Second quarter 2003 3. DnB Group and business areas
DnB Group 67
• The process of implementing DnB's credit policy and processes continued in the second quarter, and a review was made of potential problem commitments in the credit portfolio. However, uncertainty remains regarding estimated losses in the acquired portfolio. High priority was given to securing values, especially within fish-farming
• Nordlandsbanken acquired all the shares in the fish-farming and processing company Dåfjord Laks in the first quarter of the year, repossessed the pledged assets in the second quarter and took over Nordea's commitment in July
Staff
• 376 full-time positions as at 30 June 2003, including 40 positions in subsidiaries Cooperation with other group entities The integration of Nordlandsbanken with DnB's other operations will ensure close cooperation with respect to products and markets, and the transition to DnB's routines and systems. Priority will be given to fully adopting DnB's credit policy and processes.

3. DnB Group and business areas Second quarter 2003
68 DnB Group

DnB Group 69
Section 4
Shareholder information

4. Information on the DnB share Second quarter 2003
70 DnB Group
Equity-related data
Key figures First half
2003 2002 2001 2) 2000 1999 1)
Shares outstanding at end of period (1 000) 769 630 769 630 770 591 778 658 778 658 Average number of shares (1 000) 769 630 770 155 774 773 778 658 652 013 Average no. of shares - accounting basis (1 000) 769 630 770 155 774 773 778 658 675 039 Average no. of shares - fully diluted (1 000) 4) 769 630 774 531 779 972 781 400 - Earnings per share (NOK) 1.80 3.03 5.29 5.16 4.01 EPS excluding goodwill (NOK) 2.01 3.31 5.47 5.33 4.25 EPS fully diluted (NOK) 1.80 3.01 5.26 5.14 - Return on equity (per cent) 10.4 8.6 15.9 17.0 14.4 RARORAC (per cent) 13.2 10.4 14.3 15.7 14.5 Price at the end of the period 35.6 32.6 40.4 47.5 32.9 Price/earnings ratio 5) 9.89 8.07 7.63 9.21 8.20 Price/book value 1.00 0.90 1.20 1.55 1.18 Dividend per share (NOK) n/a 2.40 2.40 2.25 1.75 Dividend yield (per cent) 5) n/a 7.36 5.94 4.74 5.32 Equity per share (NOK) 35.76 36.34 33.53 30.71 27.84 1) Pro forma figures
2) Including the effect of the cancellatoin of shares at the AGM 2002 (8 067 420 shares)
3) An average of 652 013 158 shares were outstanding in 1999
4) Based on the dilution effect of 26 425 000 shares from an employee option scheme linked to a Nordic financial institution index which includes
Gjensidige NOR, Sparebanken Midt-Norge, Danske Bank, SEB, Svenska Handelsbanken and Nordea
5) Based on share price at end of period, and annualised EPS.
3)
Share price development
-
10
20
30
40
50
31. des.1992
31. des.1993
31. des.1994
31. des.1995
31. des.1996
31. des.1997
31. des.1998
31. des.1999
31. des.2000
31. des.2001
31. des.2002
DnB shareOSEBX all-share-index (rebased as from 31 Dec. 1993)
NOK

Second quarter 2003 4. Information on the DnB share
DnB Group 71
Shareholder structure as at 30 June 2003
Major shareholders Shares in 1 000 Ownership in %
Government Bank Investment Fund 368 158 47.78 State Street Bank, clients omnibus D 29 555 3.84 JPMorgan Chase Bank, treaty acc. NOM 27 726 3.60 Folketrygdfondet 24 765 3.21 The Northern Trust, treaty acc. NOM 17 715 2.30 The Northern Trust, USL Exemp Account NOM 15 744 2.04 Fidelity funds, Europe fund 15 079 1.96 Citibank, UK Residents Client Acc. NOM 13 828 1.79 Orkla ASA 12 919 1.68 Boston Safe Dep & Trust 11 438 1.48 Deutsche Bank Trust, US Treaty 10 550 1.37 DnB Employee Fund 8 000 1.04 Fidelity Lending Acc 6 075 0.79 MSF - Mutual Discovery Fund 5 158 0.67 Goldman Sachs International NOM 4 952 0.64 The Northern Trust, USL Treaty acc. 4 949 0.64 Fidelity Low Price Fund 4 650 0.60 Deutsche Bank, Gulf 1 4 264 0.55 Fidelity Funds International Fund 3 934 0.51 Nordstjernen Holding 3 556 0.46 Total largest shareholders 593 015 76.96 Other 177 575 23.04 Total 770 590 100.00
Shareholder structure
Norwegian government
Other Norwegian investors
UKinvestors
USinvestors
Othercountries
47.8%
14.9%
14.9%
13.1%
9.3%

4. Information on the DnB share Second quarter 2003
72 DnB Group

DnB Group 73
Section 5
The Norwegian economy
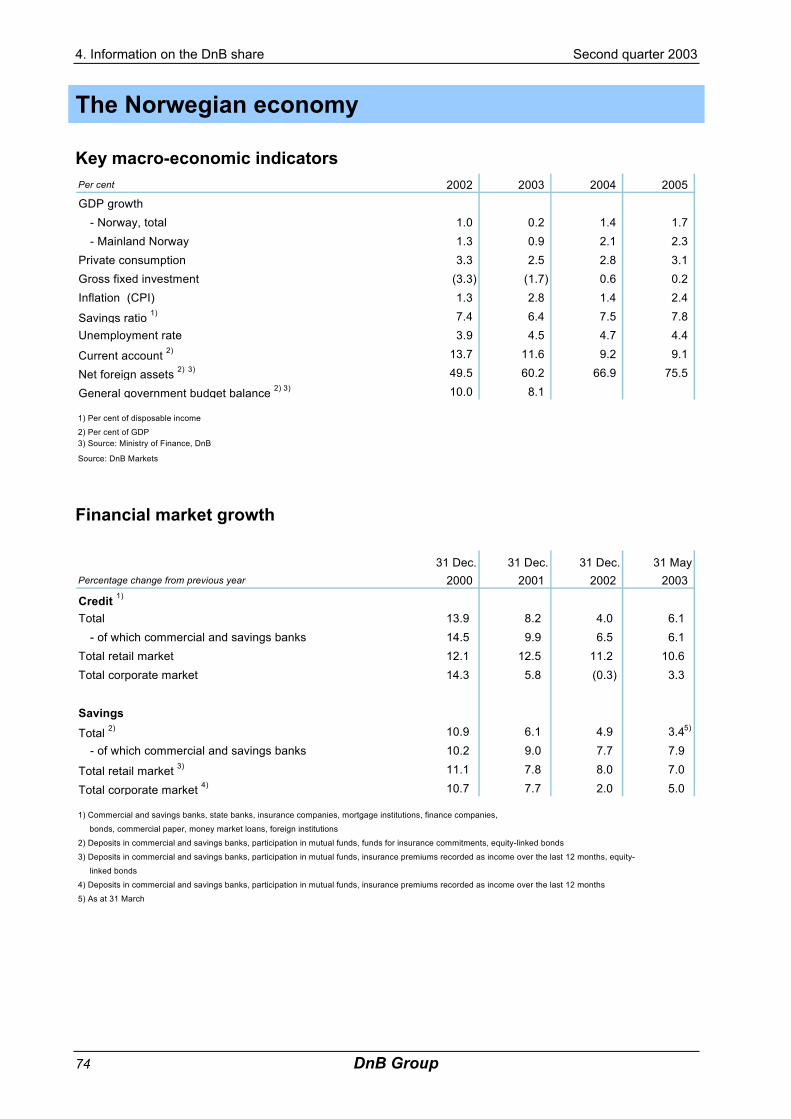
4. Information on the DnB share Second quarter 2003
74 DnB Group
The Norwegian economy
Key macro-economic indicators Per cent 2002 2003 2004 2005GDP growth
- Norway, total 1.0 0.2 1.4 1.7- Mainland Norway 1.3 0.9 2.1 2.3
Private consumption 3.3 2.5 2.8 3.1Gross fixed investment (3.3) (1.7) 0.6 0.2Inflation (CPI) 1.3 2.8 1.4 2.4
Savings ratio 1) 7.4 6.4 7.5 7.8Unemployment rate 3.9 4.5 4.7 4.4
Current account 2) 13.7 11.6 9.2 9.1
Net foreign assets 2) 3) 49.5 60.2 66.9 75.5
General government budget balance 2) 3) 10.0 8.1
1) Per cent of disposable income
2) Per cent of GDP3) Source: Ministry of Finance, DnB
Source: DnB Markets
Financial market growth
31 Dec. 31 Dec. 31 Dec. 31 MayPercentage change from previous year 2000 2001 2002 2003
Credit 1)
Total 13.9 8.2 4.0 6.1 - of which commercial and savings banks 14.5 9.9 6.5 6.1
Total retail market 12.1 12.5 11.2 10.6 Total corporate market 14.3 5.8 (0.3) 3.3
SavingsTotal 2) 10.9 6.1 4.9 3.4
- of which commercial and savings banks 10.2 9.0 7.7 7.9
Total retail market 3) 11.1 7.8 8.0 7.0
Total corporate market 4) 10.7 7.7 2.0 5.0
1) Commercial and savings banks, state banks, insurance companies, mortgage institutions, finance companies, bonds, commercial paper, money market loans, foreign institutions
2) Deposits in commercial and savings banks, participation in mutual funds, funds for insurance commitments, equity-linked bonds3) Deposits in commercial and savings banks, participation in mutual funds, insurance premiums recorded as income over the last 12 months, equity- linked bonds4) Deposits in commercial and savings banks, participation in mutual funds, insurance premiums recorded as income over the last 12 months5) As at 31 March
5)

Second quarter 2003 4. Information on the DnB share
DnB Group 75
General government's financial position 1) (Per cent of GDP)
-10
0
10
20
30
40
50
60
70
80
90
100
110
1980 1982 1984 1986 1988 1990 1992 1994 1996 1998 2000 2002
Net financial assets
-2
0
2
4
6
8
10
12
14
16
18
Budget balance
General government net financial assets General government budget balance
Source: Ministry of Finance
Current account and net foreign assets (incl. private sector) 1) (Per cent of GDP)
-30
-20
-10
0
10
20
30
40
50
60
70
80
1980 1982 1984 1986 1988 1990 1992 1994 1996 1998 2000 2002 2004 2006
Net foreign assets
-8
-6
-4
-2
0
2
4
6
8
10
12
14
16
18
20Current account
Net foreign assets Current account
Source: Ministry of Finance 1) The projections are based on an assumed oil price of NOK 198 per barrel in 2002, NOK 190 in 2003 and
NOK 146 in 2006. (The oil price in December 2002 was NOK 197 per barrel and in June 2003 NOK 190)
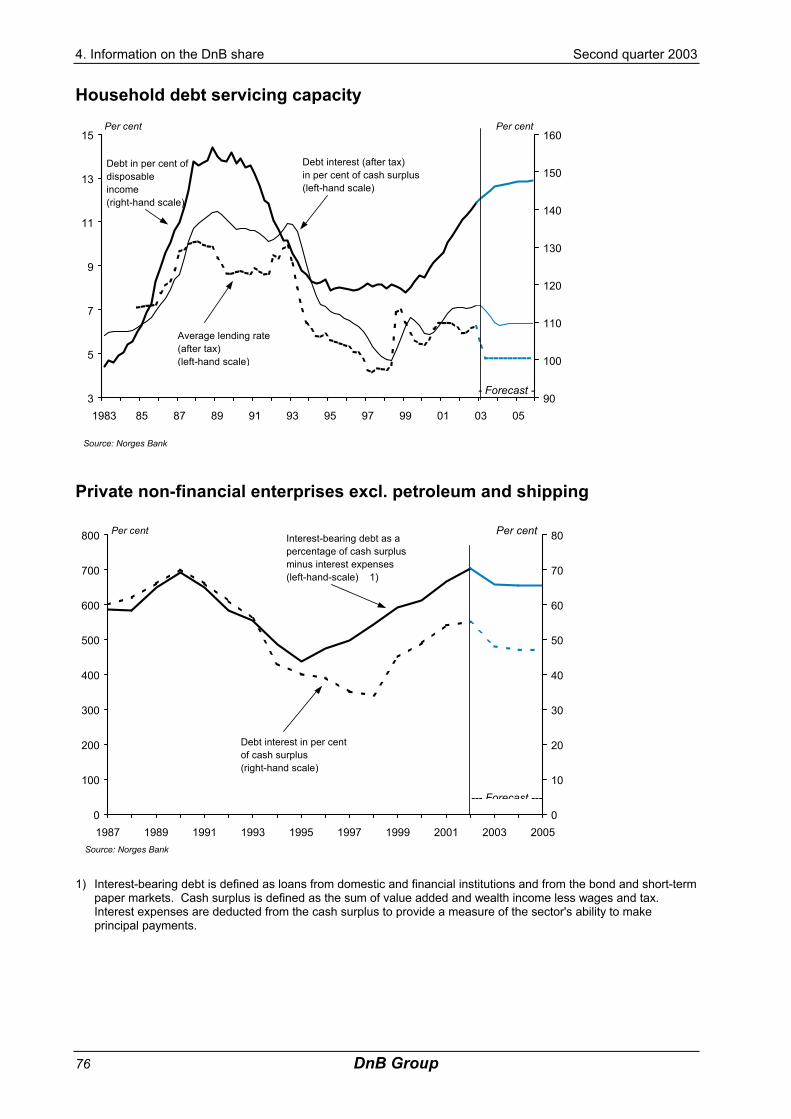
4. Information on the DnB share Second quarter 2003
76 DnB Group
Household debt servicing capacity
3
5
7
9
11
13
15
1983 85 87 89 91 93 95 97 99 01 03 05
Per cent
90
100
110
120
130
140
150
160Per cent
Source: Norges Bank
Debt in per cent of disposableincome (right-hand scale)
Debt interest (after tax)in per cent of cash surplus (left-hand scale)
Average lending rate(after tax)(left-hand scale)
- Forecast -
Private non-financial enterprises excl. petroleum and shipping
0
100
200
300
400
500
600
700
800
1987 1989 1991 1993 1995 1997 1999 2001 2003 2005
Per cent
0
10
20
30
40
50
60
70
80Per cent
Source: Norges Bank
--- Forecast ---
Interest-bearing debt as apercentage of cash surplusminus interest expenses(left-hand-scale) 1)
Debt interest in per centof cash surplus(right-hand scale)
1) Interest-bearing debt is defined as loans from domestic and financial institutions and from the bond and short-term
paper markets. Cash surplus is defined as the sum of value added and wealth income less wages and tax. Interest expenses are deducted from the cash surplus to provide a measure of the sector's ability to make principal payments.

DnB Group 77
Section 6
DnB NOR Group

6. DnB NOR First quarter 2003
78 DnB Group
Merger with Gjensidige NOR Following approval by the General Meetings of the merger plan between DnB and Gjensidige NOR, the parties have intensified the planning process for the merger. A number of sub-projects have been initiated to pave the way for the merger process in the various business areas, define their strategies and work out plans for organising efforts and carrying out the integration. The organisational structure is about to be forged, and the boards of directors' synergy estimates for the merger have been quantified and specified in detail. The merger is expected to be implemented during the fourth quarter of the year. DnB and Gjensidige NOR will work in close cooperation with the concession authorities to ensure optimal efficiency in carrying out the merger. Pro forma profit and loss accounts (selected items) 1) NOK million 2Q03 1Q03Net interest income 3 471 3 480 Net other operating income 1 921 1 641 Profit from life insurance operations 297 15 Total income 5 688 5 136 Operating expences 3 299 3 306 Operating profit 2 390 1 829 Net losses on loans and guarantees 811 448 Net gain/(loss) on long-term investments 31 (1)
Taxes 232 365
Profit for the period 1 377 1 015 1) Note: preliminary and unadited figures Pro forma balance sheet and key figures (selected items) 1)
31 June 31 March
NOK billion 2 003 2 003Net lending to customers 541 529 Deposits from customers 336 331 Equity 42 41 Total assets 699 695 Total combined assets 1 171 1 129
2Q03 1Q03Earnings per share before goodwill amortisation (NOK) 1.18 0.90Earnings per share after goodwill amortisation (NOK) 1.05 0.78Return on equity (per cent) 13.3 10.1 1) Note: preliminary and unadited figures


![Analysts/ Institutional Investors Presentation [Company Update]](https://static.fdocuments.net/doc/165x107/577ca7741a28abea748c67cb/analysts-institutional-investors-presentation-company-update.jpg)
![Investors/Analysts' Presentation [Company Update]](https://static.fdocuments.net/doc/165x107/577c7e161a28abe054a08404/investorsanalysts-presentation-company-update.jpg)


![Investors & Analysts Presentation [Company Update]](https://static.fdocuments.net/doc/165x107/577c7c231a28abe0549972fe/investors-analysts-presentation-company-update.jpg)


