SUPPLEMENTARY HEALTH AND...
34
SUPPLEMENTARY HEALTH AND REGULATION Sector Development Department - DIDES/ANS
Transcript of SUPPLEMENTARY HEALTH AND...

SUPPLEMENTARY HEALTH AND REGULATION
Sector Development Department - DIDES/ANS

2
Why does the government participate in the sector?
• Basic assumptions
The best way to obtain better prices and qualityfor consumers is free competition.
Economic Regulation is justified by marketflaws.
2

3
Why does the government participate in the sector?
• Basic assumptions
The best way to obtain better prices and qualityfor consumers is free competition.
Economic Regulation is justified by marketflaws.
3

4
Why does the government participate in the sector?
• Arrow, 1963
Characteristics of the market for health services thatdiffer from the competitive market
Nature of demand (irregular and unpredictable)
Expected physician’s behavior (unselfish, based onreputation, problem of the agent/principal)
Product uncertainty (the result is stochastic)
Supply conditions (physician supply is regulated)
Price practice (fee for service)
4
5
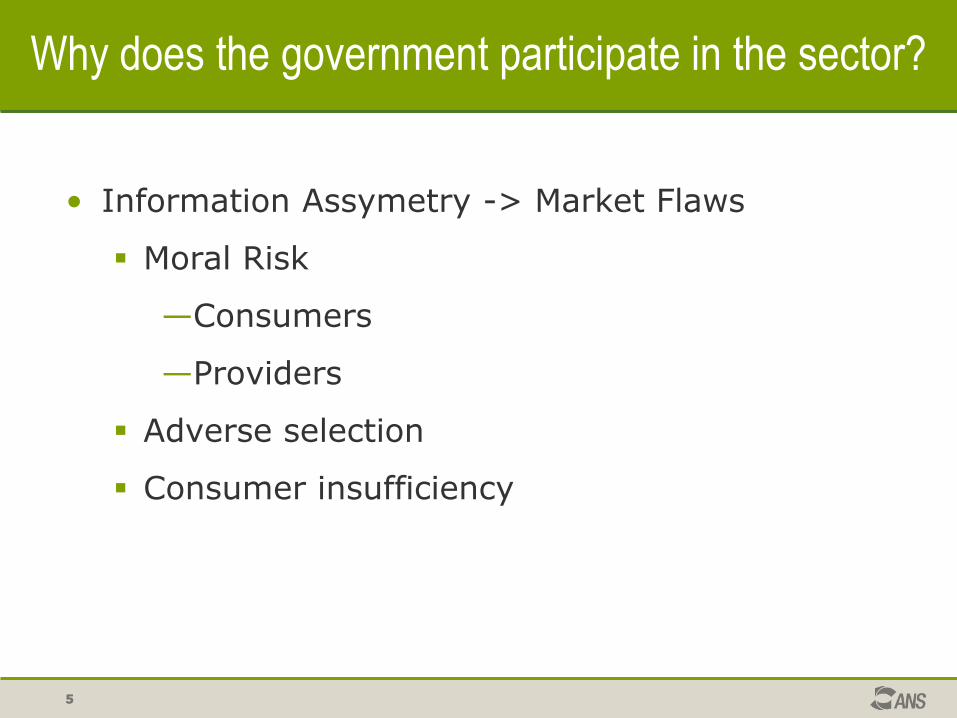
Why does the government participate in the sector?
• Information Assymetry -> Market Flaws
Moral Risk
—Consumers
—Providers
Adverse selection
Consumer insufficiency
5

6
Regulatory Actions
• Determination of maximum consultation waitingperiod
• Definition of criteria for the analysis of sufficiencyof
• Oversight of negative coverage – NIP
• Visit and Technical Direction
6

7
Regulatory Actions
Clearly define the parameters of the collectivenegotiation (jointly with the SBDC).
Seek the (technical) hierarchization of the procedures.
Facilitation of dialog by the ANS on an case by case basis.
Encourage an alternative compensation model.
Consolidating the relationship on an contractual basis.
Supplementary Health Information Exchange (TISS) and Supplementary Health Unified Terminology (TUSS).
7

8
Regulatory Actions
• Health plan products with mixed mutualism and capitalization alternatives
• Analyze the Actuarial Technical Product Invoice.
• Assess the consequences of the currentintergenerational pact (six times between thelower and the higher age group)
• Debate: ―compulsory nature‖ of the system.
8

9
Consumer InsufficiencyRegulatory Actions
9
• Supplementary Health Performance Index (IDSS) – comparison of health plan providers.
• Consumer satisfaction index.
• Supplementary Health Financial Map.
• Waiting period portability.
• Operator accreditation program.
• Service provider qualification program.
• Qualiss.
• Georeferencing of the service provider network (Google).
• Electronic Health Records.
• Promoting health, preventing diseases and active aging
• Pursuit: possibility of comparing plans.

10
Topic 1 Sector Finaning Model;
Topic 2 Quality Guarantee and Assistencial Access;
Topic 3 Model of Payment to Service Providers;
Topic 4 Pharmaceutical Assistance;
Topic 5 Incentive to Competition;
Topic 6 Guarantee of Access to Information;
Topic 7 Old Agreements;
Topic 8 Assistance to the Elderly;
Topic 9 Integration of Supplementary Health with SUS.
Regulatory Agenda
Agenda 2011/2012ANS’ Commitment to Society
Regulatory

11
Returning to the assumptions.
• Regulatory action
Transparent
Efficient – do more with less (taxpayer $$)
Preferably inducing.
Pro-competitive.
Focused on the solution/reduction of the MARKET FLAW.
The regulation cannot be self-centered and...
... it needs to be self-destructive.
11

SECTOR DATA
Sector Development Department - DIDES/ANS

13
Health plan coverage ratio according to income groups (Brazil
– 1998, 2003 and 2008)
Source: IBGE, Department of Research, Work Coordination and Income, National Household Sample Survey 1998, 2003 and 2008. Access to and Use of Health Services.
Note: Excluding the income of people under 10 years of age and people, lodgers, maids and maids’ relatives.(2) Including people who received only in benefits.
2,64,8
9,4
18,6
34,7
54,0
76,2
2,96,7
14,1
24,9
83,8
3,8
8,7
24,5 24,6
65,8
43,8
83,2
25,9
69,2
47,4
27,1
15,9
0,0
20,0
40,0
60,0
80,0
100,0
Total Até 1 salário
mínimo
Mais de 1 a 2
salários mínimos
Mais de 2 a 3
salários mínimos
Mais de 3 a 5
salários mínimos
Mais de 5 a 10
salários mínimos
Mais de 10 a 20
salários mínimos
Mais de 20
salários mínimos
1998 2003 2008
To 1 minimum
wage
More than 1 to
2 minimum
wages
More than 2 to
3 minimum
wages
More than 3 to
5 minimum
wages
More than 5 to
10 minimum
wages
More than 10
to 20 minimum
wages
More than 20
minimum
wages
Total

14
Beneficiaries of private health plans by coverage of the plan(Brazil - 2000-2011)
Source: Beneficiary Information System – ANS/MS – 05/2011
30,7 31,1 31,1 31,833,7
35,036,8
38,540,4
41,7
45,446,6
2,8 3,2 3,8 4,4 5,5 6,17,3
8,810,4
12,714,6
15,8
0,0
5,0
10,0
15,0
20,0
25,0
30,0
35,0
40,0
45,0
50,0
dez/00 dez/01 dez/02 dez/03 dez/04 dez/05 dez/06 dez/07 dez/08 dez/10 dez/10 mai/11
Milh
ões
Assistência médica com ou sem odontologia
Exclusivamente odontológico
Health Care whith or without Dental Care
Only Dental Care
Mil
lio
n

15
Beneficiaries of health care plans by type of plan (Brazil 2000-2011)
Source: Beneficiary Information System – ANS/MS – 05/2011
0,0
5,0
10,0
15,0
20,0
25,0
30,0
35,0
dez/00 dez/01 dez/02 dez/03 dez/04 dez/05 dez/06 dez/07 dez/08 dez/09 dez/10 mai/11
Milh
ões
Coletivo empresarial Coletivo por adesão Individual Não InformadoCollective Corporate Collective Group Individual Not Informed
Mil
lio
n

16
Beneficiaries of collective health care plans by selected state(Brazil 2000-2011)
Source: Beneficiary Information System – ANS/MS – 05/2011
0,0
2,0
4,0
6,0
8,0
10,0
12,0
14,0
16,0
mar/00 mar/01 mar/02 mar/03 mar/04 mar/05 mar/06 mar/07 mar/08 mar/09 mar/10 mar/11
Milh
ões
RJ SP
RS MG
PE CE
Mill
ion

17
Coverage ratio of private health care plans by state (Brazil –May/2011)
Sources: Beneficiary Information System – ANS/MS – 05/2011 and Population – IBGE/DATASUS/2010
Up to 5%
Between 5% and 10%
Between 10% and 20%
Between 20% and 30%
More than 30%
18
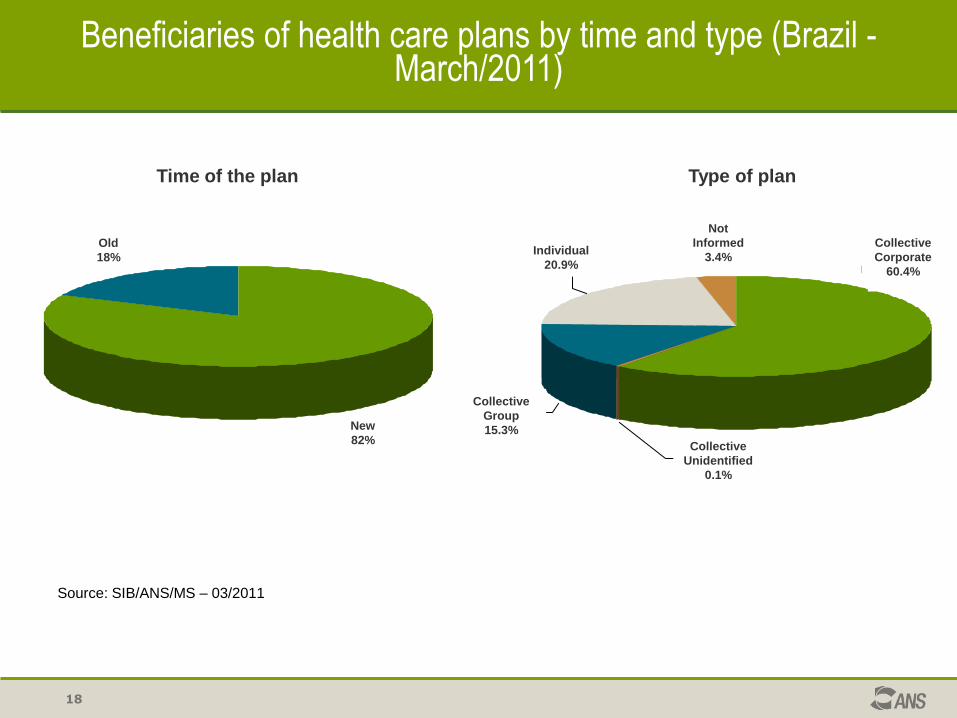
Beneficiaries of health care plans by time and type (Brazil -March/2011)
Source: SIB/ANS/MS – 03/2011
Time of the plan Type of plan
Novo
82%
Antigo
18%Coletivo
Empresarial
60,4%
Coletivo Não
identif icado
0,1%
Individual
20,9%
Não Informado
3,4%
Coletivo por
adesão
15,3%New
82%
Old
18%
Collective
Corporate
60.4%
Collective
Unidentified
0.1%
Collective
Group
15.3%
Individual
20.9%
Not
Informed
3.4%
19
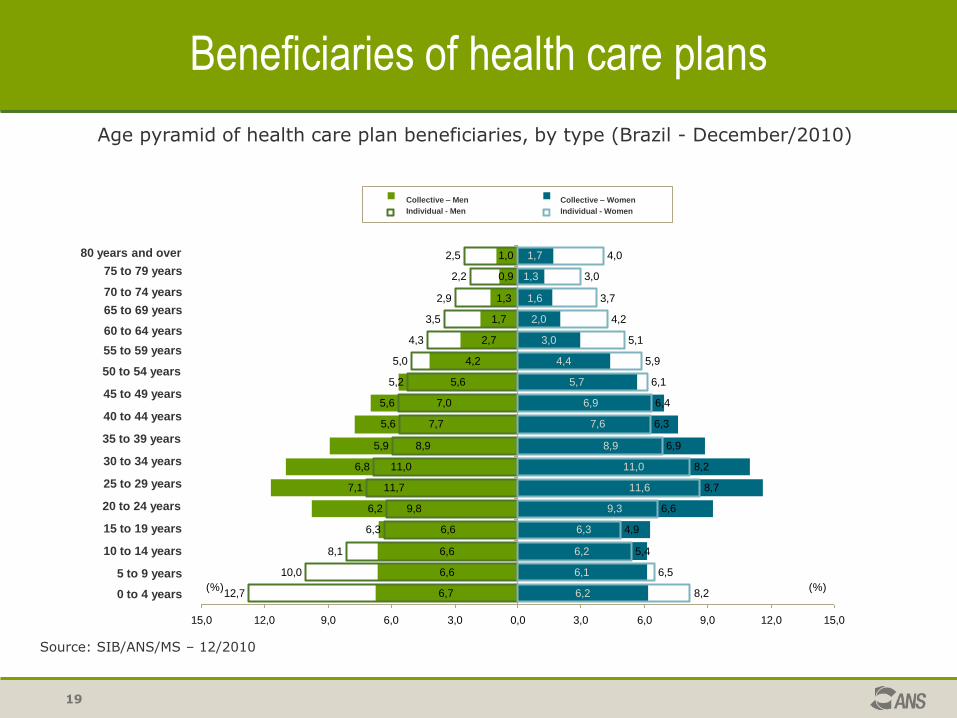
Beneficiaries of health care plans
Age pyramid of health care plan beneficiaries, by type (Brazil - December/2010)
Source: SIB/ANS/MS – 12/2010
6,7
6,6
6,6
6,6
9,8
11,7
11,0
8,9
7,7
7,0
5,6
4,2
2,7
1,7
1,3
0,9
6,2
6,1
6,2
6,3
9,3
11,6
11,0
8,9
7,6
6,9
5,7
4,4
3,0
2,0
1,6
1,3
1,7
12,7
10,0
8,1
6,3
6,2
7,1
6,8
5,9
5,6
5,6
5,2
5,0
4,3
3,5
2,9
2,2
2,5
8,2
6,5
5,4
4,9
6,6
8,7
8,2
6,9
6,3
6,4
6,1
5,9
5,1
4,2
3,7
3,0
4,01,0
15,0 12,0 9,0 6,0 3,0 0,0 3,0 6,0 9,0 12,0 15,0
0 a 4 anos
5 a 9 anos
10 a 14 anos
15 a 19 anos
20 a 24 anos
25 a 29 anos
30 a 34 anos
35 a 39 anos
40 a 44 anos
45 a 49 anos
50 a 54 anos
55 a 59 anos
60 a 64 anos
65 a 69 anos
70 a 74 anos
75 a 79 anos
80 anos ou mais
Coletivo - Homens Coletivo - Mulheres
Individual - Homens Individual - Mulheres
(%)(%)0 to 4 years
5 to 9 years
10 to 14 years
15 to 19 years
20 to 24 years
25 to 29 years
30 to 34 years
35 to 39 years
40 to 44 years
45 to 49 years
50 to 54 years
55 to 59 years
60 to 64 years
65 to 69 years
70 to 74 years
75 to 79 years
80 years and over
Collective – Men
Individual - Men
Collective – Women
Individual - Women

1
2
3
7
10
19
37
91
491
0 50 100 150 200 250 300 350 400 450 500
30,1%
36,9%
41,1%
54,5%
60,3%
70,5%
80,3%
90,5%
100,0%
4.761.976
5.843.371
6.496.129
8.620.029
11.155.705
12.640.830
15.821.230
9.541.037
Número de operadoras
Pe
rce
ntu
al d
e b
en
efic
iário
s
14.323.375
20
Distribution of beneficiaries among the operators (Brazil – May/2011)
Health care beneficiaries Dental plan beneficiaries only
Sources: SIB/ANS/MS – 05/2011 and CADOP/ANS/MS – 05/2011
2
5
10
18
34
64
111
191
341
1.032
0 200 400 600 800 1.000 1.200
10,2%
20,0%
30,0%
40,0%
50,0%
60,2%
70,2%
80,1%
90,1%
100,0%
4.737.606
9.343.033
14.005.400
18.644.862
28.046.559
32.711.386
37.360.510
46.619.931
23.309.985
Número de operadoras
Pe
rce
ntu
al d
e b
en
eficiá
rio
s
41.991.473
Perc
enta
ge o
f B
eneficia
ries
Perc
en
tag
e o
f B
en
efi
cia
rie
s
Number of ProvidersNumber of Providers

21
Compensation revenue and assistencial expense of medical hospital operators (Brasil – 2003-2010)
Sources: DIOPS/ANS/MS – 08/19/2011 and FIP – 12/2006
Revenue (R$ billion)
Assistencial expense (R$ billion)
Loss Ratio (%)
22
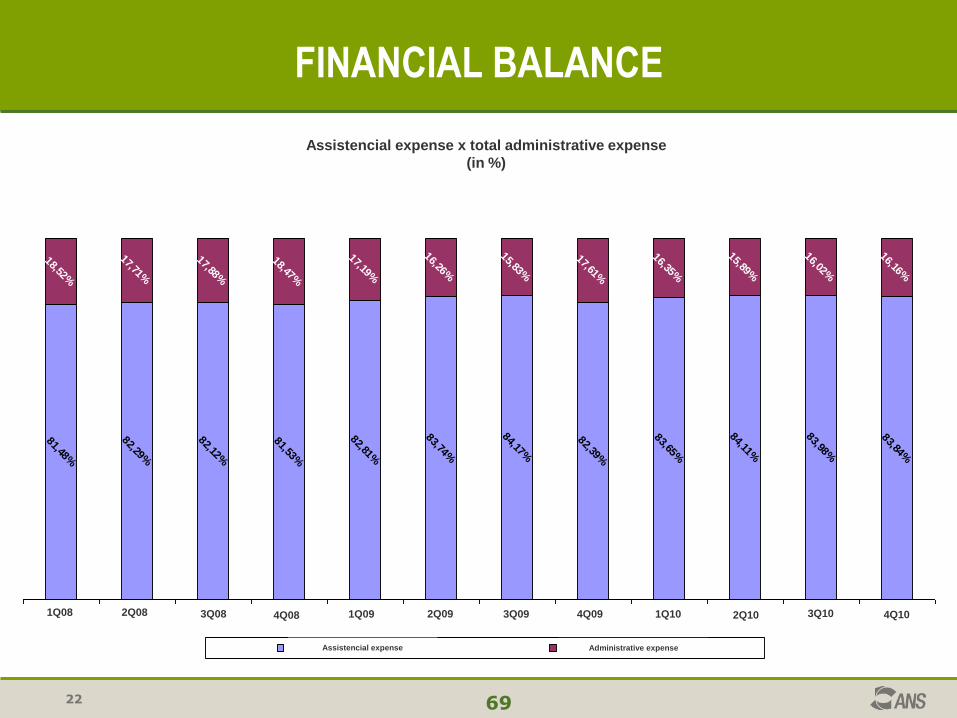
Efeitos Potenciais da Insolvência de OperadorasFINANCIAL BALANCE
69
Despesa Assistencial x Despesa Administrativa Total
(em %)
81,48%
82,29%
82,12%
81,53%
82,81%
83,74%
84,17%
82,39%
83,65%
84,11%
83,98%
83,84%
18,52%
17,71%
17,88%
18,47%
17,19%
16,26%
15,83%
17,61%
16,35%
15,89%
16,02%
16,16%
1ºtri08 2ºtri08 3ºtri08 4ºtri08 1ºtri09 2ºtri09 3ºtri09 4ºtri09 1ºtri10 2ºtri10 3ºtri10 4ºtri10
Despesa Assistencial Despesa Administrativa
Assistencial expense x total administrative expense
(in %)
Assistencial expense Administrative expense
1Q08 2Q08 3Q08 4Q08 1Q09 2Q09 3Q09 4Q09 1Q10 2Q10 3Q10 4Q10

23
Efeitos Potenciais da Insolvência de OperadorasFINANCIAL BALANCE
73
MEDICINA DE GRUPO
Despesa Assistencial x Despesa Administrativa
83,05%
83,30%
82,25%
82,48%
82,85%
83,67%
83,62%
80,98%
83,93%
84,95%
83,46%
81,50%
16,95%
16,70%
17,75%
17,52%
17,15%
16,33%
16,38%
19,02%
16,07%
15,05%
16,54%
18,50%
1ºtri08 2ºtri08 3ºtri08 4ºtri08 1ºtri09 2ºtri09 3ºtri09 4ºtri09 1ºtri10 2ºtri10 3ºtri10 4ºtri10
Despesa Assistencial Despesa Administrativa
1Q08 2Q08 3Q08 4Q08 1Q09 2Q09 3Q09 4Q09 1Q10 2Q10 3Q10 4Q10
GROUP MEDICINE
Assistencial Expense x Administrative Expense
Assistencial expense Administrative expense

24
Efeitos Potenciais da Insolvência de OperadorasFINANCIAL BALANCE
76
SEGURADORA
Despesa Assistencial x Despesa Administrativa
89,27%
89,52%
91,32%
90,35%
90,87%
91,83%
92,03%
91,54%
92,31%
91,89%
92,14%
91,18%
10,73%
10,48%
8,68%9,65%
9,13%
8,17%
7,97%
8,46%
7,69%
8,11%
7,86%8,82%
1ºtri08 2ºtri08 3ºtri08 4ºtri08 1ºtri09 2ºtri09 3ºtri09 4ºtri09 1ºtri10 2ºtri10 3ºtri10 4ºtri10
Despesa Assistencial Despesa Administrativa
1Q08 2Q08 3Q08 4Q08 1Q09 2Q09 3Q09 4Q09 1Q10 2Q10 3Q10 4Q10
Assistencial expense Administrative expense
INSURANCE COMPANY
Assistencial Expense x Administrative Expense

25
Efeitos Potenciais da Insolvência de OperadorasFINANCIAL BALANCE
61
Liquidez Corrente
1,19
1,14
1,18
1,49 1,49 1,491,52
1,54
1,811,79
1,98
1,25 1,241,20
1,181,21
1,15
1,231,211,21
1,48
1,401,37
1,81
1ºtri08 2ºtri08 3ºtri08 4ºtri08 1ºtri09 2ºtri09 3ºtri09 4ºtri09 1ºtri10 2ºtri10 3ºtri10 4ºtri10
Médico Hospitalar (exclui Autogestão) Odontológicas
Fonte: Relatório PRISMA/ANS
Current Liquidity
Medical Hospital (excludes self-management) Dental
Source: PRISMA Report/ANS
1Q08 2Q08 3Q08 4Q08 1Q09 2Q09 3Q09 4Q09 1Q10 2Q10 3Q10 4Q10

26
Efeitos Potenciais da Insolvência de OperadorasFINANCIAL BALANCE
60
Endividamento
0,62
0,68
0,53
0,62
0,67
0,640,68
0,69
0,65
0,66
0,660,640,67
0,600,57
0,58
0,58 0,58 0,59 0,59
0,62
0,56 0,56
0,54
1ºtri08 2ºtri08 3ºtri08 4ºtri08 1ºtri09 2ºtri09 3ºtri09 4ºtri09 1ºtri10 2ºtri10 3ºtri10 4ºtri10
Médico Hospitalar (exclui Autogestão) Odontológicas
Fonte: Relatório PRISMA/ANS
Debt
Medical Hospital (excludes self-management) Dental
Source: PRISMA Report/ANS
1Q08 2Q08 3Q08 4Q08 1Q09 2Q09 3Q09 4Q09 1Q10 2Q10 3Q10 4Q10

27
Efeitos Potenciais da Insolvência de OperadorasPROFITABILITY
78
Retorno sobre o Ativo
0,010
0,005 0,005 0,005
0,0080,006
0,033
0,020
0,023
0,012
0,046
0,012
0,026
0,016
0,020
0,0040,005
0,010
0,021
0,015
0,027
0,0120,013
0,013
1ºtri08 2ºtri08 3ºtri08 4ºtri08 1ºtri09 2ºtri09 3ºtri09 4ºtri09 1ºtri10 2ºtri10 3ºtri10 4ºtri10
Médico Hospitalar (exclui Autogestão) Odontológicas
Fonte: Relatório PRISMA/ANS
Return on Assets
Medical Hospital (excludes self-management) Dental
Source: PRISMA Report/ANS
1Q08 2Q08 3Q08 4Q08 1Q09 2Q09 3Q09 4Q09 1Q10 2Q10 3Q10 4Q10

28
Efeitos Potenciais da Insolvência de OperadorasPROFITABILITY
79
Retorno sobre o PL
0,014
0,025 0,0230,020
0,022
0,0280,033
0,075
0,057
0,069
0,051
0,114
0,046
0,0390,055
0,072
0,029
0,018
0,050
0,051
0,042
0,0380,034
0,066
1ºtri08 2ºtri08 3ºtri08 4ºtri08 1ºtri09 2ºtri09 3ºtri09 4ºtri09 1ºtri10 2ºtri10 3ºtri10 4ºtri10
Médico Hospitalar (exclui Autogestão) Odontológicas
Fonte: Relatório PRISMA/ANS
Return on Equity
Medical Hospital (excludes self-management) Dental
Source: PRISMA Report/ANS
1Q08 2Q08 3Q08 4Q08 1Q09 2Q09 3Q09 4Q09 1Q10 2Q10 3Q10 4Q10

29
Efeitos Potenciais da Insolvência de OperadorasPROFITABILITY
80
Margem de Lucro Líquido
0,02
0,01
0,02
0,010,01
0,010,02
0,020,02
0,06
0,04
0,06
0,040,05
0,03
0,02
0,10
0,04
0,03
0,06
0,04
0,04 0,03
0,04
1ºtri08 2ºtri08 3ºtri08 4ºtri08 1ºtri09 2ºtri09 3ºtri09 4ºtri09 1ºtri10 2ºtri10 3ºtri10 4ºtri10
Médico Hospitalar (exclui Autogestão) Odontológicas
Fonte: Relatório PRISMA/ANS
Net Margin
Medical Hospital (excludes self-management) Dental
Source: PRISMA Report/ANS
1Q08 2Q08 3Q08 4Q08 1Q09 2Q09 3Q09 4Q09 1Q10 2Q10 3Q10 4Q10

30
Efeitos Potenciais da Insolvência de OperadorasRISK
85
Prazo Médio
(em dias)
15,0614,70
23,79
25,8126,25
24,5025,09
22,3422,85
21,5120,91
21,56
19,4218,66
16,59
17,56
19,49
27,03
26,1025,74
26,89
25,3524,63
24,31
1ºtri08 2ºtri08 3ºtri08 4ºtri08 1ºtri09 2ºtri09 3ºtri09 4ºtri09 1ºtri10 2ºtri10 3ºtri10 4ºtri10
Contraprestrações a Receber Pagamento de Eventos
Fonte: Relatório PRISMA/ANS
Average Term
(in days)
Compensation receivable Payment of events
Source: PRISMA Report/ANS
1Q08 2Q08 3Q08 4Q08 1Q09 2Q09 3Q09 4Q09 1Q10 2Q10 3Q10 4Q10

31
Efeitos Potenciais da Insolvência de OperadorasRISK
86
Ativos Garantidores
(em R$ milhões)
5.114,02 5.083,785.505,44 5.384,11 5.108,09 5.223,39
6.091,035.465,74
1.183,08 1.269,841.286,71 1.270,19
1.238,24 1.253,05
1.301,65
1.327,51
1.245,02 1.467,78
1.585,762.395,35 2.710,68
2.925,90
2.459,58
2.583,08480,88
515,12
527,10
624,07
-
-
-
-
1ºtri09 2ºtri09 3ºtri09 4ºtri09 1ºtri10 2ºtri10 3ºtri10 4ºtri10
Títulos e V. Mobiliários Privados (CETIP) Títulos Públicos (SELIC) Fundos Dedicados (CONVÊNIOS) Imóveis
Fonte: CETIP, SELIC, CBLC
Guaranteeing assets(in R$ million)
Private securities Government bonds (SELIC) Dedicated funds (PARTNERSHIPS)
Source: Cetip, Selic, CBLC
RealEstateProperty
1Q09 2Q09 3Q09 4Q09 1Q10 2Q10 3Q10 4Q10

32
Efeitos Potenciais da Insolvência de OperadorasRISK
87
Ativos Garantidores
(em nº de operadoras)
419491
745
565648 666
761717
564492
238
418335 317
222266
1ºtri09 2ºtri09 3ºtri09 4ºtri09 1ºtri10 2ºtri10 3ºtri10 4ºtri10
Regulares Insuficientes
Fonte: ANS
Guaranteeing assets(in number of providers)
Regular Insufficient
Source: ANS
1Q09 2Q09 3Q09 4Q09 1Q10 2Q10 3Q10 4Q10

33
Efeitos Potenciais da Insolvência de OperadorasRISK
89
Provisões Técnicas
(em nº de operadoras)
818 850 840907 889 884 888
938
165 133 14376 94 99 95
45
1ºtri09 2ºtri09 3ºtri09 4ºtri09 1ºtri10 2ºtri10 3ºtri10 4ºtri10
Regulares Insuficientes
Fontes: SAGA e controles internos/ANS
Technical Provisions(in number of providers)
Regular Insufficient
Source: SAGA and internal controls/ANS
1Q09 2Q09 3Q09 4Q09 1Q10 2Q10 3Q10 4Q10

Thank you
Bruno Sobral Sector Development Officer
Diretoria de Desenvolvimento Setorial - DIDES/ANS