Transcriptomic responses of Emiliania huxleyi to Ocean Acidification
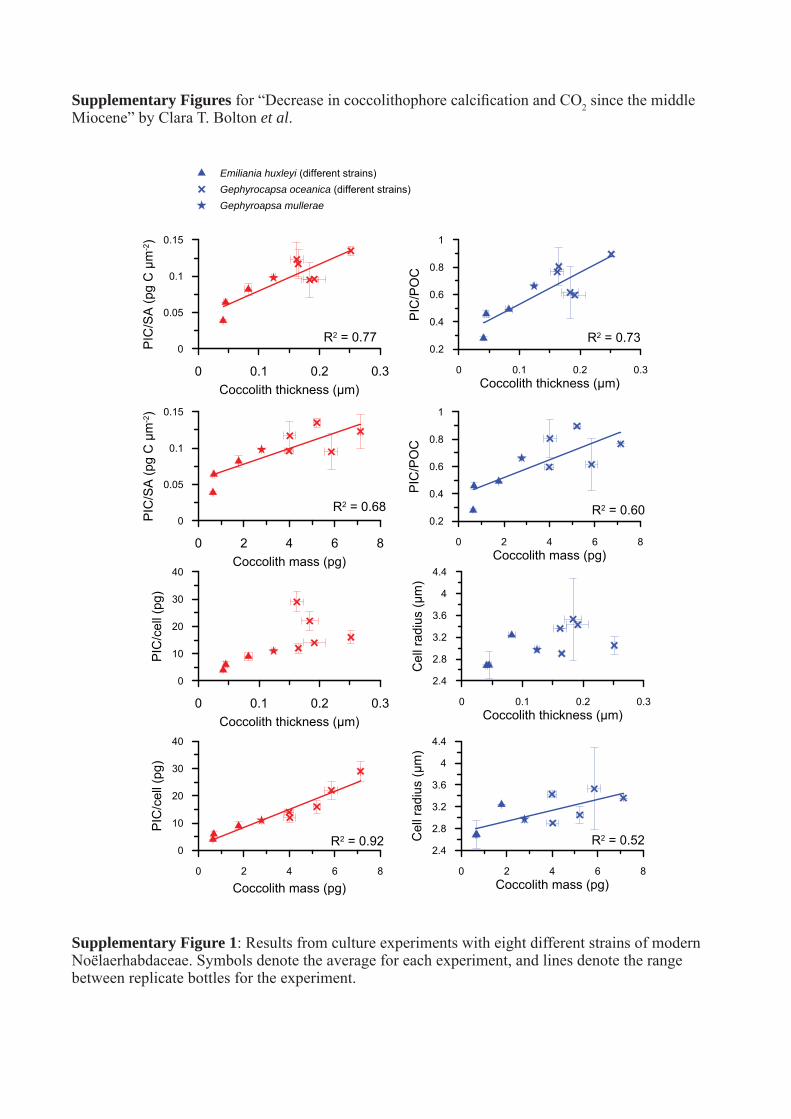
Supplementary Figures for “Decrease in coccolithophore calcification and CO2 since the middle Miocene” by Clara T. Bolton et al.
Supplementary Figure 1: Results from culture experiments with eight different strains of modern Noëlaerhabdaceae. Symbols denote the average for each experiment, and lines denote the range between replicate bottles for the experiment.
R2 = 0.77 R2 = 0.73
0 2 4 6 8Coccolith mass (pg)
2.4
2.8
3.2
3.6
4
4.4
Cel
l rad
ius
(μm
)
0
10
20
30
40
PIC
/cel
l (pg
)
0 2 4 6 8
Coccolith mass (pg)
0 0.1 0.2 0.3Coccolith thickness (μm)
2.4
2.8
3.2
3.6
4
4.4
Cel
l rad
ius
(μm
)
0
10
20
30
40
PIC
/cel
l (pg
)
0 0.1 0.2 0.3Coccolith thickness (μm)
0 2 4 6 8Coccolith mass (pg)
0.2
0.4
0.6
0.8
1P
IC/P
OC
0
0.05
0.1
0.15
PIC
/SA
(pg
C μ
m-2)
0 2 4 6 8Coccolith mass (pg)
0 0.1 0.2 0.3Coccolith thickness (μm)
0.2
0.4
0.6
0.8
1
PIC
/PO
C
0
0.05
0.1
0.15
PIC
/SA
(pg
C μ
m-2)
0 0.1 0.2 0.3Coccolith thickness (μm)
Emiliania huxleyi (different strains)Gephyrocapsa oceanica (different strains)Gephyroapsa mullerae
R2 = 0.60R2 = 0.68
R2 = 0.92 R2 = 0.52

Supplementary Figure 2: ks and thickness values for modern placolith (Coccolithus, Calcidiscus, Emiliania, Gephyrocapsa, Umbilicosphaera, Oolithus) coccoliths plotted versus mean coccolith length. ks data are from ref. 1. Thickness was calculated using ks values and mean lengths from ref. 1.Coccolith widths, also required to calculate thickness, were estimated using published estimates of circularity (ref. 2) and estimates of E. huxleyi and Gephyrocapsa oceanica circularity from our culture experiments reported in this paper.
Supplementary Figure 3: Mean coccolith thickness for all coccoliths 2-5 μm, at a: Site NGHP-01-01A, and b: ODP Site 925. Thickness (black symbols, line) and fragmentation-corrected thickness (pink symbols) are shown.
0 2 4 6 8 10 12 14Age (Ma)
mean fragmentation-corrected coccolith thicknessmean coccolith thickness
0
0.2
0.4
0.6
mea
n co
ccol
ith th
ickn
ess
(μm
)
0 2 4 6 8 10 12 14Age (Ma)
0
0.2
0.4
0.6
0.8
1
mea
n co
ccol
ith th
ickn
ess
(μm
) ODP Site 925 (2-5 μm)Site NGHP-01-01A (2-5 μm)a b
0 2 4 6 8 10mean coccolith length (μm)
0
0.02
0.04
0.06
0.08
k s v
alue
Calcidiscus leptoporusCoccolithus pelagicusEmiliania huxleyi (different morphotypes)Gephyrocapsa oceanica & G. muelleraeOolithotus antillarumUmbilicosphaera species
2 4 6 8 10mean coccolith length (μm)
0
0.2
0.4
0.6
0.8
cocc
olith
thic
knes
s (v
ol/li
th a
rea)
μm

Supplementary Figure 4: SEM plate illustrating the variety of Noëlaerhabdaceae coccolith morphology found at ODP Site 925.

Supplementary Figure 5: SEM plate illustrating the variety of Noëlaerhabdaceae coccolith morphology found at Site NGHP-01-01A.

Supplementary Figure 6: a: pH estimates for glacial and interglacial endmembers3, b: pCO2 estimates for glacial and interglacial end-members (compiled in ref. 4) and the assumption of constant glacial pCO2 prior to the ice core record, c: estimated surface alkalinity at ODP Site 668 in the tropical Atlantic based on these two parameters, following calculations described in the Methods section, d: size-normalised coccolith thickness (2-5 μm) and G. sacculifer δ18O data at Site NGHP 01-01A, e: size-normalised coccolith thickness (2-5 μm) and G. sacculifer δ18O data at Site 925. In d and e, the green bar on the right shows the last glacial (G) to current interglacial (IG) range in G. sacculifer δ18O for nearby sites where high-resolution data are available: equatorial Indian Ocean data from ODP Site 758 (ref. 5) and western equatorial Atlantic data from Site EW9209-1JPC (ref. 6).
0 500 1000 1500 2000 2500Age (ka)
8
8.1
8.2
8.3
8.4
pH
160
200
240
280
320
pCO
2 (pp
mv)
GG (interpolated)IG
0 500 1000 1500 2000 2500Age (ka)
1750
2000
2250
2500
Alk
alin
ity (μ
mol
/kg)
G (using ice core pCO2)
0.1
0.2
0.3
0.4
cocc
olith
thic
knes
s (μ
m)
coccolith thickness
-2
-1
0
1
δ18 O
G. s
accu
lifer
0.1
0.2
0.3
0.4
cocc
olith
thic
knes
s (μ
m)
-2
-1
0
1
δ18 O
G. s
accu
lifer
G. sacculifer 18O
IG
EW9209-1JPCG. sacculifer
G
IG
ODP 758G. sacculifer
G
e: ODP Site 925
d: Site NGHP-01-01A
c: calculated (ODP Site 668)
b: Antarctic ice
a: ODP Site 668

Supplementary Figure 7: a: Long-term changes (16-2 Ma) in carbonate ion concentration (ref. 7) and alkalinity (calculated from [CO3
2-] (ref. 7) and [CO2aq] determined in this study as described in the Methods section), b: measured (boron isotopes) and calculated (using [CO3
2-] (ref. 7) and [CO2aq]) pH changes over the interval 16-0 Ma (references 8-10).
Supplementary Figure 8: Calculated E. huxleyi coccolith mass versus [CO2aq]. Original data (carbonate chemistry and % overcalcified E. huxleyi) from reference 11, in which water samples from the Bay of Biscay were analysed monthly between September 2008 and August 2009. Here, we estimate mean coccolith mass using the percentage of overcalcified E. huxleyi in each sample (ref. 11) and published mean coccolith mass values for E. huxleyi Type A overcalcified (4.6 pg) and E. huxleyi Type A undercalcified (1.2 pg)1.
2 4 6 8 10 12 14 16Age (Ma)
80
120
160
200
[CO
32-] (μm
ol/k
g)
CO32-
1200
1600
2000
2400
Tota
l alk
alin
ity (μ
mol
/kg)
Calculated total alkalinity
0 2 4 6 8 10 12 14 16Age (Ma)
7.6
7.8
8
8.2
8.4
pH
pH pH Calculated pHpH
a
b
10 12 14 16 18aqueous [CO2] (μM)
1
2
3
4
5
6
Est
imat
ed m
ean
cocc
olith
mas
s (p
g)
0.01
0.02
0.03
0.04
0.05
k s v
alue
E. huxleyi (Bay of Biscay)

Supplementary Figure 9: Results from a constant [CO2] experiment with Emiliania huxleyi12, showing the increase in calcification (illustrated as cellular PIC per cell surface area calculated from POC) with increasing pH and increasing alkalinity.
7.4 7.6 7.8 8 8.2 8.4pH (total scale)
0
0.04
0.08
0.12
0.16P
IC/S
A (p
g C
/μm
2 )
0 1500 3000 4500 6000Alkalinity (μmol/kg SW)
0
0.04
0.08
0.12
0.16
PIC
/SA
(pg
C/μ
m2 )
Constant [CO2] experiment (~15 μmol/kg), Bach et al 2013.

Supplementary Figure 10: Coccolithophore PIC to POC ratios versus cell size in culture. a: The theoretical relationship between PIC to POC ratio and cell size assuming constant coccolith thickness. b to i: PIC/POC ratios vs cell diameter from published culture experiments with different species and strains (note different scales). All cell diameters (except h where cell size was measured by the authors) were calculated from POC per cell measurements in the experiments, using the well-constrained relationship between cell size and POC from ref. 13. Most experiments show a decrease in PIC to POC with increasing cell size, as predicted in a. Data are from refs. 14 to 21. Not all studies indicate timing of sampling relative to the cell division cycle.
3.5 4 4.5 5 5.5 6Cell diameter (μm)
0.2
0.4
0.6
0.8
1
1.2
1.4
PIC
/PO
C
24 PFD 1524 PFD 3016/8 PFD 3024 PFD 8024 PFD 15016/8 PFD 8016/8 PFD 150
7 8 9 10Cell diameter (μm)
0.2
0.4
0.6
0.8
1
1.2
1.4
PIC
/PO
C0 4 8 12 16
Cell diameter (μm)
0
1
2
3
4
PIC
/PO
C
Gephyrocapsa oceanica(Rickaby et al., 2010)
Emiliania huxleyisingle strain(Rost et al., 2002)
Low light
High light
9.5 10 10.5 11Cell diameter (μm)
0.4
0.8
1.2
1.6
2
2.4
2.8
PIC
/PO
C
4.5 5 5.5 6 6.5Cell diameter (μm)
0.4
0.6
0.8
1
1.2
1.4
PIC
/PO
C
RCC1256
RCC1212
RCC1238
RCC1216
9 10 11 12 13 14 15Cell diameter (μm)
0.4
0.8
1.2
1.6
2
2.4
2.8
PIC
/PO
C
Calcidiscus leptoporus(Langer et al., 2006)
Emiliania huxleyimultiple strain(Langer et al., 2009)
Calcidiscus leptoporus(Langer & Bode, 2011)
4 4.5 5 5.5 6Cell diameter (μm)
0.40.81.21.6
22.42.83.23.6
PIC
/PO
C
13°C18°C
Emiliania huxleyi(De Bodt et al., 2010)
3.5 4 4.5 5Cell diameter (μm)
0
0.4
0.8
1.2
1.6
2
PIC
/PO
C
N repleteN limited
Emiliania huxleyi(Müller et al., 2012)
3.5 4 4.5 5 5.5 6Cell diameter (μm)
0.6
0.7
0.8
0.9
1
PIC
/PO
C
Emiliania huxleyi(Iglesias Rodriguez et al., 2008)
a b
e f
c
d
g h i

Supplementary Figure 11: A comparison of coccolith mass data derived from three recently published variations on the birefringence method. We include our data from ~0.3 Ma samples at ODP Site 925 (pink crosses) and Site NGHP-01-01A (black crosses), which are both exclusively composed of Gephyrocapsa coccoliths and measured following ref. 22. Also plotted are Holocene coccolith mass data for Gephyrocapsa mullerae and G. oceanica (blue triangles) and E. huxleyi (green triangles), published in ref. 23. Additionally, data for mixed Gephyrocapsa sp. and E. huxleyi coccoliths grown in culture and measured according to ref. 24 are shown (grey circles; L. Beaufort, unpublished data, 2014). Whereas the methods of ref. 22 and ref. 23 photograph coccoliths using circular polarised light, in ref. 24 coccoliths are imaged under cross-polarised light at three specific orientations and create a composite image so as to eliminate the extinction cross. Taking into account the expected variability in mass for coccoliths of a given size resulting from variable geographical locations, ages and growth conditions in the datasets we compare, there is very good agreement between Noëlaerhabdaceae coccolith mass values for the three birefringence-based methods. Calibrations applied to convert grey level to thickness also differ slightly between methods. A sensitivity test performed on our data to account for the sigmoidal shape of the grey level-thickness relationship in the newest published calibrations showed an increase in absolute thickness values, particularly for the smallest coccoliths, but no change in the temporal thickness trends at either site meaning that our interpretations are not affected.
2 3 4 5Coccolith length (μm)
0
10
20
30
Coc
colit
h m
ass
(pg)
Site NGHP-01-01A 1h1 Gephyrocapsa sp. (this study)Gephyrocapsa sp. (Bollmann, 2014)ODP Site 925 2h4 Gephyrocapsa sp. (this study)Emiliania huxleyi (Bollmann, 2014)cultured E. huxleyi +Gephyrocapsa sp. (L. Beaufort, unpublished)
Late Pleistocene and cultured small Noelaerhabdaceae placoliths (2-5 μm)

Supplementary Figure 12: Benthic and planktic foraminiferal δ13C data from ODP Site 999. G. sacculifer data are from Groeneveld & Steph (unpublished), Bickert (unpublished) and this study (Supplementary Data 2). The ODP Site 999 benthic record (Black line, refs 25, 26) was extended using a North Atlantic compilation (Purple line, ref. 27) corrected for an offset of -0.3‰. Diamonds show G. sacculifer values used to estimate δ13CDIC.
2 4 6 8 10 12 14 16Age (Ma)
-0.5
0
0.5
1
1.5
2
2.5
3
13
Site 999 benthic δ13C (Cibicidoides)δ13C North Atlantic benthic stack (Cibicidoidesδ13C benthic value usedSite 999 δ13C G. sacculifer (Groeneveld/Steph, unpub.)Site 999 δ13C G. sacculifer (Bickert, unpub.)Site 999 δ13C G. sacculifer (this study)Site 999 δ13C G. sacculifer estimated

Supplementary Figure 13: (diagram modified from reference 28). Illustration of mass balance of carbon, and isotopic composition in coccolithophore cell keyed to the relevant mass balance equations using the ACTI-CO model, as described in reference 28. Fractionation factors are identical to reference 28. CHL indicates chloroplast and CV is coccolith vesicle. Labelling of fluxes and isotopic compositions follows the convention of reference 29 with the addition of the subscript v to denote fluxes within and to the CV, such that e, i, x, and v denote respectively external, intracellular (cytosol), chloroplast, and CV, and u and o refer to uptake and outflux, respectively. Notation is as in reference 29.
(1) Chloroplast CO2 :
(2) Chloroplast HCO3
- :
(3) Coccolith vesicle CO2 :
(4) Coccolith vesicle HCO3
- :
(5) Cytosol CO2 :
(6) Cytosol HCO3- :

Supplementary Table 1: Coccolithophore strains cultured for this study
Supplementary Table 2: Correlation between coccolith mass and thickness and cell size and calcification parameters
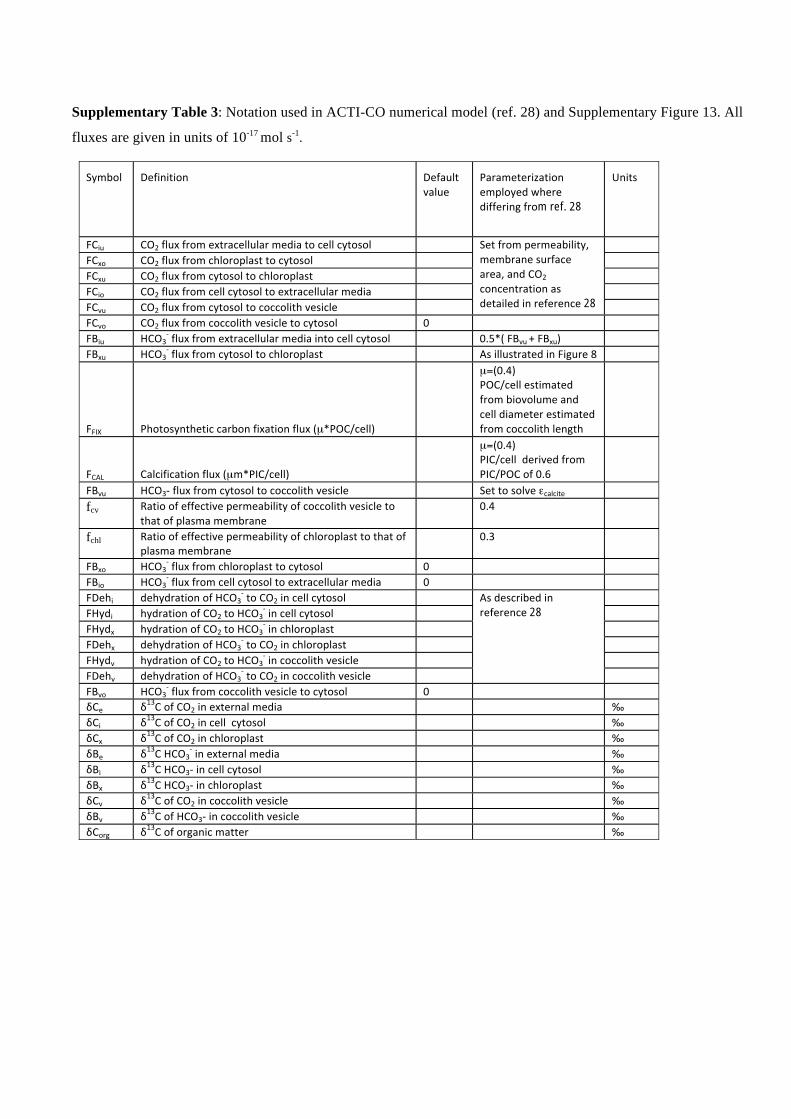
Supplementary Table 3: Notation used in ACTI-CO numerical model (ref. 28) and Supplementary Figure 13. All
fluxes are given in units of 10-17 mol s-1.
m ref. 28
28
μ
μ=
μ
μ=
εfcv
fchl
28

Supplementary Methods Carbon isotopes in alkenones and εp and [CO2aq] calculations Lipids were extracted from sediments and alkenones subsequently isolated as described in ref. 8. Gas chromatography (GC) was performed with an Agilent 7890A chromatograph equipped with a flame ionisation detector and an Agilent J&W HP-1 fused silica column (19091Z-015, 50 m x 0.32 mm internal diameter) coated with CP Sil5-CB stationary phase (dimethylpolysiloxane equivalent, 0.12 µm film thickness). The oven temperature was programmed from 70 to 130 °C at 20 °C min−1, to 300 °C (held 25 min) at 4 °C and H2 was used as carrier gas. Compounds were quantified using a C36n-alkane that had been added to the alkenone sub-fraction prior to injection. Compound-specific isotope analyses were performed using a GC-combustion-isotope ratio mass spectrometer (GC–C–IRMS) with an Agilent 7890A GC coupled to a Nu Instruments Perspective IRMS. The GC column and temperature programme were as for GC analysis. The internal standard added to the alkenone sub-fraction was of known isotopic composition to ensure instrument stability8. Isotope ratio values are reported as δ values (δ13C, ‰) and reproducibility was better than 0.7 ‰. εp37:2 values (hereafter εp) were calculated from δ13C values of di-unsaturated alkenones and calcite tests of planktic foraminifers (G. sacculifer) (Supplementary Data 2) measured in samples from ODP Site 999 (12°44’ N, 78°44’ W; water depth 2830 m, Fig. 1) to extend a previously published record8. εp trends are predominantly driven by changes in alkenone δ13C. εp was calculated using the equation: εp37:2 = [(δCO2(aq) + 1000) / (δ13Chaptophyte biomass + 1000)-1]*1000 (1) where δCO2(aq) is calculated from the δ13C of the foraminifer G. sacculifer, the temperature-dependent relationship between δCO2(aq) and δCaCO3 (see ref. 8 and refs therein) and estimated mixed layer temperatures. For samples at 4 and 5 Ma, G. sacculifer data are from J. Groeneveld & S. Steph (unpublished). From 6 Ma to 8 Ma, G. sacculifer data are from T. Bickert (unpublished). All other G. sacculifer δ13C values were generated for this study (as described above for the other sites) (Supplementary Data 2). For three samples in the older part of the record, G. sacculifer could not be extracted in sufficient numbers for reliable isotopic analysis, hence we estimated G. sacculifer δ13C
from benthic foraminiferal δ13C, using the average δ13C gradient between Cibicidoides sp. and G. sacculifer at ODP Site 999 (1.4 ‰). Benthic foraminiferal δ13C (Cib.) for ODP Site 999 extends back to 8.4 Ma25,26 and was extended to older periods using a compilation of North Atlantic sites (ODP/DSDP Sites 553, 558, 563, 607, 608, and 959) taken from ref. 27 (Supplementary Fig. 12). The North Atlantic compilation was adjusted by -0.3‰ to account for the mean offset relative to ODP Site 999 benthic δ13C during the interval where the two records overlap (2-8.4 Ma) (Supplementary Fig. 12). For one sample corresponding to 13.1 Ma, planktic foraminferal δ13C shows no gradient compared to benthic δ13C. Since there is no independent evidence for homogenization of the water column at this time (e.g. in coccolith assemblages), we infer that planktic foraminifers may be altered by recrystallization in the deep-water or sediment environment. Hence for this sample, we also use a value for G. sacculifer δ13C calculated assuming a planktic-benthic gradient of 1.4 ‰. Given the absence of tri-unsaturated alkenones in sediments samples, it was not possible to estimate sea surface temperatures (SSTs) from the Uk
37' index, and therefore maximum and minimum SST estimates for ODP Site 99928 were used in εp calculations to calculate δ13CCO2(aq)
8.

Propagated analytical uncertainty of εp for maximum and minimum SST scenarios (error bars in Figure 7a) = √((1 SD δ13Chaptophyte biomass
2)+(0.052)). (2) Calculations of aqueous CO2 concentrations from εp and the various approaches we use to constrain temporal variation in b, thus isolating the component of variation in εp driven by [CO2aq], are described in the main text. The absolute values of b and [CO2aq] are much more poorly constrained than the trends, imparting a greater uncertainty in the absolute values of [CO2aq] and atmospheric pCO2 than in the temporal trend. To correct for cell size changes, given that the trend in Noëlaerhabdaceae coccolith size observed in our sites is similar to that found in other tropical sites30,31, we use our record of the mean length of coccoliths from the ODP Site 925 and NGHP-01-01A records because these precise determinations incorporate all the suspected calcifying alkenone-producing taxa (all Noëlaerhabdaceae), unlike the published record for the time interval from ODP Site 99930. To calculate the effect of size change on b, we apply the correction approach suggested by refs 32,33 using a reference b value = 150, to the size record of ODP 925 and NGHP-01-01A. This record of b from each site is then linearly interpolated to the sample ages of εp determinations at Site 999. The single exception is the 9.31 Ma point for ODP 925 because the adjacent ages (9.82 Ma, 8.42 Ma) straddle the major transition in cell size, whereas the 8.78 Ma sample in NGHP-01-01A precedes the size transition, suggesting that at 9.31 Ma large sizes prevailed. Therefore for 9.31 Ma at ODP 925, we estimate a b value 0.95 * the b value at 10.3 Ma - the scaling observed in b between these ages at Site NGHP-01-01A. With our choice of reference b = 150, the size-scaled b values range from 164 to 89 for NGHP-01-01A and 74 to 149 for ODP 925. As our focus is on ascertaining the trends, rather than absolute values, of b, we compensate for the difference in absolute values by adding 8.45 (the average offset between the two sites over the whole time interval) to the b estimate of ODP 925. The deviations in trend between the two sites are shown by the maximum and minimum b estimates in Figure 7d (error bars). This formulation describes the influence of cell size on εp assuming that changing cell size does not entail a change in maximum growth rate. Its use is consistent with the observation that for coccolithophores, the size dependence of growth rates is very small, equivalent to less than a 5 % increase in growth rate for the observed reduction in cell diameter from 4 to 2.7 µm, based on a comparison of coccolithophore growth rates in multiple culture studies34. The potential effect of changing growth rates on εp and calculated [CO2aq] is evaluated via changes in the b value, following previous studies8. As indicators of potential variations in growth rates, we examine variations in coccolith Sr/Ca ratios suggested to correlate positively with growth rate and the “b” physiological coefficient35, and alkenone accumulation rates in sediment that may serve as a proxy for productivity of alkenone producers, particularly in situations where preservation potential is stable36. Given stable seawater Sr ratios over this time period37, coccolith Sr/Ca might be expected to track growth rates of alkenone producers. We use Sr/Ca data from ODP Site 999, from the size fraction dominated by coccoliths from the alkenone-producing Noëlaerhabdaceae family28. Highest coccolith Sr/Ca occurs from 13-10 Ma, coinciding with a local maximum in alkenone mass accumulation rates (Fig. 7c), although the magnitude of Sr/Ca change in this interval may be amplified somewhat by a higher relative contribution of detrital Sr due to the low CaCO3 content of sediments during the “carbonate crash”. In addition, a peak in alkenone accumulation rate occurs at 8 Ma. The higher resolution alkenone mass accumulation rate data for the last 5 Ma8 evidences higher

frequency variability. From these two indicators, we normalised the variation in each indicator and averaged these normalised variations to establish a composite growth rate curve for the interval 16-6 Ma to estimate temporal variation in b (Fig. 7d). There is as yet no calibration of the magnitude of growth rate change implied by either indicator; we use an amplitude of 25, consistent with that explored in ref. 8 and which is within the large uncertainty in the slope of relationship between Sr/Ca and b value in the Equatorial Pacific35. To illustrate the sensitivity of b to this choice, we also show growth rate variations with amplitude 20 % lower and higher (i.e., range of b of 20 or 30; error bars in Figure 7d). For the period studied in ref. 8, where εp data are not accompanied by Sr/Ca measurements, we do not simulate variations in growth rate. Adding this estimated variation in b to that inferred to result from cell size changes results in a range of b of 87 to 167 (Fig. 7d). Choice of an alternate reference b value produces very similar temporal trends of the reconstructed [CO2aq] record but different absolute values; higher b reference values of 190 yields a decline in [CO2aq] from 16 to 8 µM; assumption of lower b reference values of 138 yields a decline in [CO2aq] from 11 to 6 µM. Maximum and minimum [CO2aq] estimates, calculated using data from Site 999 (this study and ref. 8), are shown as shading in Figure 7e and include uncertainty in εp as illustrated in Figure 7a, as well as uncertainty in estimates of b, as illustrated in Figure 7d. For size corrected data, maximum [CO2aq] was calculated using the upper limit of εp (calculated using SST max, G. sacculifer δ13C +1SD, and δ13Chaptophyte biomass -1SD; see error bars in Fig. 7a), and the upper limit of b; whereas minimum [CO2aq] was calculated using the lower limit of εp (calculated using SST min, G. sacculifer δ13C -1SD, and δ13Chaptophyte biomass +1SD, see error bars in Fig. 7a) and the lower limit of b (orange shading in Fig. 7e). For the size and growth-rate corrected data, the maximum and minimum [CO2aq] were calculated analogously but using the b, which incorporates both size and growth rate terms (pink shading in Fig. 7e). The effect of changing active uptake on [CO2aq] estimates To illustrate the potential impact of changes in active uptake of carbon on εp and calculated [CO2aq], we use the ACTI-CO cell model of carbon fluxes in coccolithophores28 (Supplementary Figure 13 and Supplementary Table 3). We impose several possible dependencies of active HCO3
- transport to the chloroplast as a function of [CO2aq], and for each, solve for the [CO2aq] required to match observed εp at ODP 999. Laboratory culture experiments suggest that active HCO3
- transport to the chloroplast becomes more significant at low [CO2aq], with the ratio of chloroplast HCO3
- transport to diffusive CO2 uptake following a logarithmic dependence28,38. The resource-replete laboratory experiments likely give an upper limit of the significance of active uptake, because high light intensity leads to high rates of active uptake38 and laboratory experiments typically feature much higher light intensities than those that characterise the deep chlorophyll maximum at which Noelaerhabdaceae density is highest in the oligotrophic open ocean ocean39. In fact, this more limited influence of active uptake in the deep oligotrophic ocean has been identified in measurements of εp on alkenones through depth profiles in the water column40. A first simulation employs a logarithmic dependence of chloroplast HCO3
- transport on [CO2aq], with a slope similar to that observed in cultures but an intercept half that observed in cultures to account for lower light intensity (Fig. 8). A second simulation supplements HCO3
- supply to the chloroplast in terms of reallocation of HCO3
- from calcification to photosynthesis. The HCO3- available for reallocation to
the chloroplast is estimated as the difference between the HCO3- flux to the coccolith vesicle which

would be required to match εcoccolith if coccolith calcification remained constant, from that required to match εcoccolith for the observed situation of reduced calcification per cell surface area in the last 8 Ma (reduced PIC/POC) for the coccoliths less than 5 µm. Both simulations parameterize HCO3
- uptake across the cytosol as 0.5x the sum of HCO3
- transport to the coccolith vesicle and chloroplast, analogous to previously published simulations28. Large cells also show evidence of shifts in HCO3
-
allocation to calcification: a major decrease in εcoccolith, an indicator of coccolith vesicle HCO3- influx
relative to calcification, occurs after 8 Ma (Fig. 5). This reallocation in large coccolithophores probably had a minimal effect on the alkenone εp record, because by 8 Ma mean Noëlaerhabdaceae size has already decreased significantly, implying that the majority of alkenones were produced by small cells rather than large cells. However, in both large and small cells, the 10-6 Ma onset of this potential HCO3
- reallocation to the chloroplast is similar to the onset inferred for increased HCO3- to
the chloroplast from a simple dependence of active uptake on CO2 concentrations described as simulation 1, so would be unlikely to modify the simulations of active uptake. Calculating constraints on past ocean pH and alkalinity We assess the constraints on the magnitude of potential surface alkalinity increase which are provided by pH estimates from ref. 3 for the last 2 Ma and pCO2 values from Vostok ice cores for the last 800 ka4,41,42 (Supplementary Fig. 6). We use pH determinations made at ODP Site 668 in the eastern equatorial Atlantic, a region with CO2 in equilibrium with the atmosphere3. Over the last 800 ka, atmospheric CO2 during glacial maxima consistently declines to 180 ± 10 ppmv4, coherent with glacial temperature anomalies in Antarctica. If this 180 ppmv level of pCO2 were characteristic of glacial maxima during the preceding 1200 kyr, then pH and CO2 could be used to estimate surface alkalinity at the location of ODP 688 during glacial times. Calculations were performed with the programme CO2sys43, using constants of ref. 44. Under these assumptions, surface alkalinity at this site could have increased substantially during glacials since the mid-Pleistocene, from 1800 to 2300 µmol kg-1, an increase of nearly 30 % over the last 0.6 Ma (Supplementary Fig. 6c). Among interglacials of the past 800 ka, pCO2 has varied much more significantly from 240 to 300 ppmv, with higher interglacial pCO2 in the last 500 ka. Consequently, one cannot make an analogous assumption of uniform interglacial CO2 prior to the ice core record to estimate long-term interglacial alkalinity changes prior to 800 ka. During the period of direct pCO2 determinations in ice cores, calculated alkalinity during interglacials is lower than that during glacial periods. As estimates of surface water pH from B isotopic ratios of monospecific foraminiferal samples are available only discontinuously over the last 15 Ma, as shown in Figure 7f, we employ the more complete records of variation in ocean carbon chemistry are available for [CO3
-2] to estimate long term alkalinity change. Long term variations in surface ocean [CO3
-2] have been derived from coupled records of seawater calcium concentration and the history of the carbonate compensation depth (CCD)7. These estimates are subject to some uncertainty due to the potential decoupling of the CCD and the carbonate saturation horizon which is the parameter strictly regulated by [CO3
-2]45. Overall this record suggests increasing [CO3
-2] over the last 15 Ma (Supplementary Fig. 7). The combination of [CO2aq] records with these [CO3
-2] reconstructions suggests a relatively stable total alkalinity from about 15 to 2 Ma and a progressively increasing surface ocean pH (Supplementary Fig. 7). For discrete intervals between 15 to 12 Ma, available direct pH estimates from planktic

foraminifera δ11B suggest the potential for more dynamic carbon system variations over timescales of a few million years. Therefore, within the uncertainties of existing data between 15 and 2 Ma, we cannot rule out the possibility of variations in alkalinity that may have contributed to changes in SN coccolith thickness during this interval. Supplementary References 1 Young, J. & Ziveri, P. Calculation of coccolith volume and its use in calibration of carbonate
flux estimates. Deep Sea Research Part II 47, 1679–1700 (2000). 2 Henderiks, J. Coccolithophore size rules - Reconstructing ancient cell geometry and cellular
calcite quota from fossil coccoliths. Marine Micropaleontology 67, 143-154 (2008). 3 Hönisch, B., Hemming, N. G., Archer, D., Siddall, M. & McManus, J. F. Atmospheric
carbon dioxide concentration across the mid-Pleistocene transition. Science 324, 1551-1554 (2009).
4 Lüthi, D. et al. High-resolution carbon dioxide concentration record 650,000–800,000 years before present. Nature 453 379-382 (2008).
5 Chen, M.-T. Late Quaternary paleoceanography of the equatorial Indo-Pacific Ocean: A quantitative analysis based on marine micropaleontological data; PhD thesis, Brown Univeristy (1994).
6 Curry, W. B. & Oppo, D. W. Synchronous, high-frequency oscillations in tropical sea surface temperatures and North Atlantic Deep Water productivity during the last glacial cycle. Paleoceanography 12, 1-14 (1997).
7 Tyrrell, T. & Zeebe, R. E. History of carbonate ion concentration over the last 100 million years. Geochimica et Cosmochimica Acta 68, 3521-3530 (2004).
8 Seki, O. et al. Alkenone and boron-based Pliocene pCO2 records. Earth and Planetary Science Letters 292, 201–211 (2010).
9 Hönisch, B., Hemming, N. G., Archer, D., Siddall, M. & McManus, J. F. Atmospheric carbon dioxide concentration across the mid-Pleistocene transition. Science 324, 1551-1554 (2009).
10 Foster, G. L., Lear, C. H. & Rae, J. W. B. The evolution of pCO2, ice volume and climate during the Middle Miocene. Earth and Planetary Science Letters 341-344, 243-254 (2012).
11 Smith, H. E. K. et al. Predominance of heavily calcified coccolithophores at low CaCO3 saturation during winter in the Bay of Biscay. Proceedings of the National Academy of Sciences USA 109, 8845-8849 (2012).
12 Bach, L. T. et al. Dissecting the impact of CO2 and pH on the mechanisms of photosynthesis and calcification in the coccolithophore Emiliania huxleyi. New Phytologist 199, 121-134, doi:doi: 10.1111/nph.12225 (2013).
13 Popp, B. N. et al. Effect of phytoplankton cell geometry on carbon isotopic fractionation. Geochimica y Cosmochimica Acta 62, 69-77 (1998).
14 Langer, G. et al. Species-specific responses of calcifying algae to changing seawater carbonate chemistry. Geochemistry Geophysics Geosystems 7 (2006).
15 Langer, G., Nehrke, G., Probert, I., Ly, J. & Ziveri, P. Strain-specific responses of Emiliania huxleyi to changing seawater carbonate chemistry. Biogeosciences 6, 2637-2646, doi:10.5194/bg-6-2637-2009 (2009).
16 Rost, B., Zondervan, I. & Riebesell, U. Light-dependent carbon isotope fractionation in the coccolithophorid Emiliania huxleyi. Limnology and Oceanography 47, 120-128 (2002).
17 De Bodt, C., Van Oostende, N., Harlay, J., Sabbe, K. & Chou, L. Individual and interacting effects of pCO2 and temperature on Emiliania huxleyi calcification: study of the calcite
production, the coccolith morphology and the coccosphere size. Biogeosciences 7, 1401-1412 (2010).
18 Iglesias-Rodriguez, M. D. et al. Phytoplankton calcification in a high-CO2 world. Science 320, 336-340 (2008).
19 Langer, G. & Bode, M. CO2 mediation of adverse effects of seawater acidification in Calcidiscus leptoporus. Geochemistry, Geophysics, Geosystems 12 (2011).
20 Rickaby, R. E. M., Henderiks, J. & Young, J. N. Perturbing phytoplankton: response and isotopic fractionation with changing carbonate chemistry in two coccolithophore species. Climate of the Past 6, 771–785 (2010).
21 Müller, M. N. et al. Influence of CO2 and nitrogen limitation on the coccolith volume of Emiliania huxleyi (Haptophyta). Biogeosciences 9, 4155-4167 (2012).
22 Fuertes, M. A., Flores, J. A. & Sierro, F. J. The use of circularly polarized light for biometry, identification and estimation of mass of coccoliths. Marine Micropaleontology 113, 44-55 (2014).
23 Bollmann, J. Technical Note: Weight approximation of coccoliths using a circular polarizer and interference colour derived retardation estimates (The CPR Method). Biogeosciences 11, 1899-1910, doi:10.5194/bg-11-1899-2014 (2014).
24 Beaufort, L., Barbarin, N. & Gally, Y. Optical measurements to determine the thickness of calcite crystals and the mass of thin carbonate particles such as coccoliths. Nature Protocols 9, 633-642 (2014).
25 Bickert, T., Haug, G. & Tiedemann, R. Late Neogene benthic stable isotope record of ODP Site 999: Implications for Caribbean paleoceanography, organic carbon burial and the Messinian Salinity Crisis. Paleoceanography 19, PA1023 (2004).
26 Haug, G. H. & Tiedemann, R. Effect of the formation of the Isthmus of Panama on Atlantic Ocean thermohaline circulation. Nature 393 (1998).
27 Zachos, J. C., Dickens, G. R. & Zeebe, R. E. An early Cenozoic perspective on greenhouse warming and carbon-cycle dynamics. Nature 451, 279-283 (2008).
28 Bolton, C. T. & Stoll, H. M. Late Miocene threshold response of marine algae to carbon dioxide limitation. Nature 500, 558-562 (2013).
29 Hopkinson, B. M., Dupont, C. L., Allen, A. E. & Morel, F. M. M. Efficiency of the CO2-concentrating mechanism of diatoms. Proceedings of the National Academy of Sciences USA 108, 3830-3837 (2011).
30 Kameo, K. & Bralower, T. J. in Proc. ODP, Sci. Results, 165 (eds R.M. Leckie, H. Sigurdsson, G.D. Acton, & G. Draper) 3-17, Ocean Drilling Program (2000).
31 Young, J. R. Size variation of Neogene Reticulofenestra coccoliths from Indian Ocean DSDP cores. Journal of Micropalaeontology 9, 71-85 (1990).
32 Henderiks, J. & Pagani, M. Refining ancient carbon dioxide estimates: Significance of coccolithophore cell size for alkenone-based pCO2 records. Paleoceanography 22 (2007).
33 Henderiks, J. & Pagani, M. Coccolithophore cell size and the Paleogene decline in atmospheric CO2. Earth and Planetary Science Letters 269, 576-584 (2008).
34 Aloisi, G. Co-variation of metabolic rates and cell-size in coccolithophores. Biogeosciences Discussions 12, 6215-6284 (2015).
35 Stoll, H. M. & Schrag, D. P. Coccolith Sr/Ca as a new indicator of coccolithophorid calcification and growth rate. Geochemistry Geophysics Geosystems 1, 1-24 (2000).
36 Bolton, C. T. et al. Glacial–interglacial productivity changes recorded by alkenones and microfossils in late Pliocene eastern equatorial Pacific and Atlantic upwelling zones. Earth and Planetary Science Letters 295, 401-411 (2010).
37 Sosdian, S. M. et al. Cenozoic seawater Sr/Ca evolution. Geochemistry Geophysics Geosystems 13, Q10014, doi:doi:10.1029/2012GC004240 (2012).

38 Cassar, N., Laws, E. A. & Popp, B. N. Carbon isotopic fractionation by the marine diatom Phaeodactylum tricornutum under nutrient- and light-limited growth conditions. Geochimica et Cosmochimica Acta 70, 5323-5335 (2006).
39 Beaufort, L., Couapel, M., Buchet, N., Claustre, H. & Goyet, C. Calcite production by coccolithophores in the south east Pacific Ocean. Biogeosciences 5, 1101-1117 (2008).
40 Tolosa, I. et al. Distribution of lipid biomarkers and carbon isotope fractionation in contrasting trophic environments of the South East Pacific. Biogeosciences 5, 949-968 (2008).
41 Petit, J.-R. et al. Climate and atmospheric history of the past 420,000 years from the Vostok ice core, Antarctica. Nature 399, 429-436 (1999).
42 Siegenthaler, U. et al. Stable carbon cycle–climate relationship during the late Pleistocene. Science 310, 1313-1317 (2005).
43 Program developed for CO2 systems calculations (Oak Ridge, TN, USA: ORNL/CDIAC-105 Carbon Dioxide Information Analysis Centre, Oak Ridge National Laboratory, US Department of Energy, 1998).
44 Roy, R. et al. The dissociation constants of carbonic acid in seawater at salinities 5 to 45 and temperatures 0 to 45°C. Marine Chemistry 44, 249-267 (1993).
45 Greene, S. et al. Long-term stability of the carbonate compensation depth across the Late Paleocene-Early Eocene warming trend, presented at Goldschmidt (2014).