Supplemental Water: Lessons Learned Ed Clerico · 28 Years - 61 Systems Gillette Stadium, Foxboro,...
30
Supplemental Water: Lessons Learned Ed Clerico October 1, 2015
-
Upload
hoangkhanh -
Category
Documents
-
view
215 -
download
0
Transcript of Supplemental Water: Lessons Learned Ed Clerico · 28 Years - 61 Systems Gillette Stadium, Foxboro,...

Supplemental Water:
Lessons Learned
Ed ClericoOctober 1, 2015
Water Reuse: Case Studies/Tourswww.naturalsystemsutilities.com
2
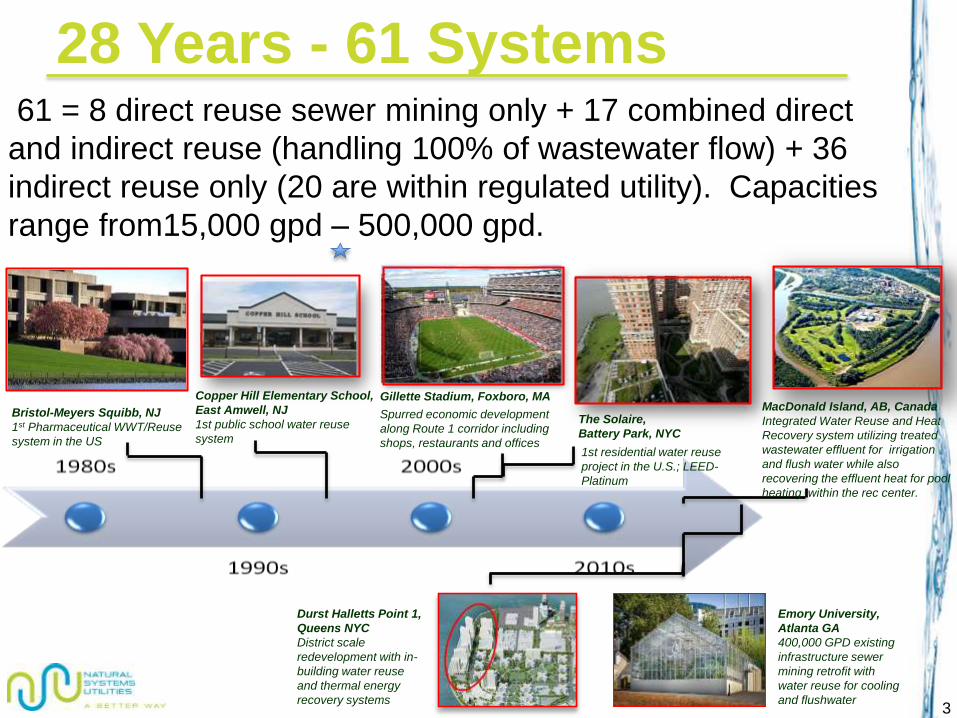
28 Years - 61 Systems
Gillette Stadium, Foxboro, MA
Spurred economic development
along Route 1 corridor including
shops, restaurants and offices
The Solaire,
Battery Park, NYC
1st residential water reuse
project in the U.S.; LEED-
Platinum
Copper Hill Elementary School,
East Amwell, NJ
1st public school water reuse
system
Bristol-Meyers Squibb, NJ
1st Pharmaceutical WWT/Reuse
system in the US
MacDonald Island, AB, Canada
Integrated Water Reuse and Heat
Recovery system utilizing treated
wastewater effluent for irrigation
and flush water while also
recovering the effluent heat for pool
heating within the rec center.
61 = 8 direct reuse sewer mining only + 17 combined direct
and indirect reuse (handling 100% of wastewater flow) + 36
indirect reuse only (20 are within regulated utility). Capacities
range from15,000 gpd – 500,000 gpd.
Durst Halletts Point 1,
Queens NYC
District scale
redevelopment with in-
building water reuse
and thermal energy
recovery systems
Emory University,
Atlanta GA
400,000 GPD existing
infrastructure sewer
mining retrofit with
water reuse for cooling
and flushwater3
4
Regulations
5
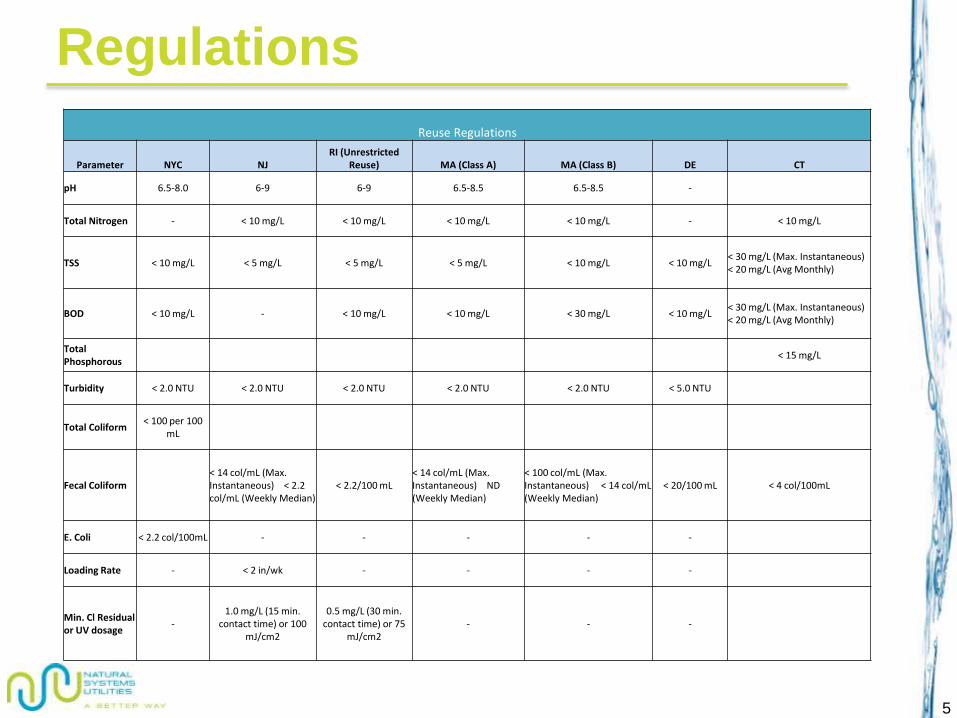
Reuse Regulations
Parameter NYC NJRI (Unrestricted
Reuse) MA (Class A) MA (Class B) DE CT
pH 6.5-8.0 6-9 6-9 6.5-8.5 6.5-8.5 -
Total Nitrogen - < 10 mg/L < 10 mg/L < 10 mg/L < 10 mg/L - < 10 mg/L
TSS < 10 mg/L < 5 mg/L < 5 mg/L < 5 mg/L < 10 mg/L < 10 mg/L< 30 mg/L (Max. Instantaneous) < 20 mg/L (Avg Monthly)
BOD < 10 mg/L - < 10 mg/L < 10 mg/L < 30 mg/L < 10 mg/L< 30 mg/L (Max. Instantaneous) < 20 mg/L (Avg Monthly)
Total Phosphorous
< 15 mg/L
Turbidity < 2.0 NTU < 2.0 NTU < 2.0 NTU < 2.0 NTU < 2.0 NTU < 5.0 NTU
Total Coliform< 100 per 100
mL
Fecal Coliform< 14 col/mL (Max. Instantaneous) < 2.2 col/mL (Weekly Median)
< 2.2/100 mL< 14 col/mL (Max. Instantaneous) ND (Weekly Median)
< 100 col/mL (Max. Instantaneous) < 14 col/mL (Weekly Median)
< 20/100 mL < 4 col/100mL
E. Coli < 2.2 col/100mL - - - - -
Loading Rate - < 2 in/wk - - - -
Min. Cl Residual or UV dosage
-1.0 mg/L (15 min.
contact time) or 100 mJ/cm2
0.5 mg/L (30 min. contact time) or 75
mJ/cm2- - -
Key Lessons Learned
6
• Customer Drivers Vary Widely
• Pollution prevention – protecting the pristine, restoring the polluted
• Water conservation – scarcity of supply
• Economic benefit – property value, affordability, community economic vitality, resiliency
• Delivery Mechanism Greatly Affects Innovation Potential – DBO and DBOO allow for flexibility and accountability
• Innovation drives value
• Performance Is Not Just O&M – System Stewardship - the responsible overseeing and protection of something considered worth caring for and preserving. Adequate performance requires RME as system steward.
• Regulatory framework greatly affects innovation potential – prescriptive regulations stymie innovation and create scapegoat dynamics. The “appliance” approach works best.
• Integrated Systems Approach Provides Best Value To All Stakeholders

Existing Case Studies: BPC
7
Over 10 years of operating data. ZERO permit exceedancesand ZERO user complaints/public health concerns
System automatically controlled/monitored with alarms. Licensed Operator On-Site 2 days/wk, less than 4 hours per day (8 hours / wk)
Achieving >55% Water Use Reduction
Achieving >65% Sewer Discharge Reduction
100% Reclaimed Water For Cooling Tower Make-up
Reduced strain on municipal/centralized infrastructure
Existing systems being retrofitted & new systems being developed with thermal energy recovery for NET ZERO/NET POSITIVE ENERGY water reuse

Existing Case Studies: BPC
8
Multiple small scale systems serving densely populated areas. High efficiency MBRs – high quality water, small foot print

Innovation Driven Value
9
Hot Water Tank (~30% building demand)60°C / 140°F
Heat Pump
Electric Energy for Treatment = 5% of building demands (350 kWh/day: single high-rise building scale, prior to optimization)
Recovered Heat = 65,500 Btu/hr (~400 kWh/day)
ho
t w
ater
loo
p
reu
se w
ater
loo
p
23 °C75 °F
13°C55°F
Mac Island Subcontractor/Client Testimonial:“The temperature in competition pool became to hot, but I will adjust the boiler heat exchanger lower than normal set point, so can use more heating from glycol heating” – Jonathan German, RRC/MIPC“Delivering enough free heat to actually overheat the competition pool!” - Andrew Byrnes, DEC

DBOO Example Structure
10
RME
Sponsor/Developer
Site/Client/End User
Capital Agreement
LenderEquity
Investor
DesignBuild
OperatorRegulator
Service Contract
Technology, Delivery & Performance
Lease/Easement
ServiceAgreement / WPA
Appropriate Risk/Reward Dynamics are Critical for Success
• Economic Viability: Service is affordable and provides quality of life benefits to End User and economic benefit to sponsor, lender and investor
• RME is financially secure and provides performance guarantee
• Regulator is informed and empowered to enforce
• Debt & Equity investors could include combination of public and private sectors
• Having the end user as the RME creates conflicts
Permitting, Enforcement

Optimal Financial Risk Criteria
11
• Scale is at least 100,000 gpd
• Timing (time to revenue < 2 years)
• Regulatory Environment Clear (not rate based rate of return regulated & environmental or reuse regulations exist)
• Cost of water >$10/1,000gallons

Supplemental Information
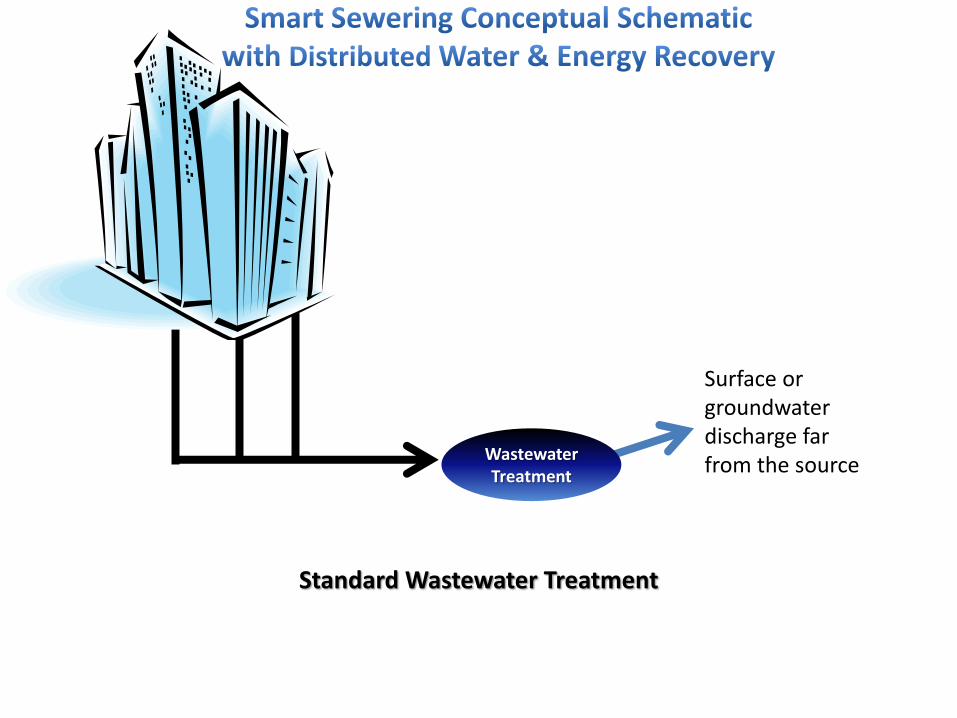
Standard Wastewater Treatment
Wastewater Treatment
Surface or groundwater discharge far from the source
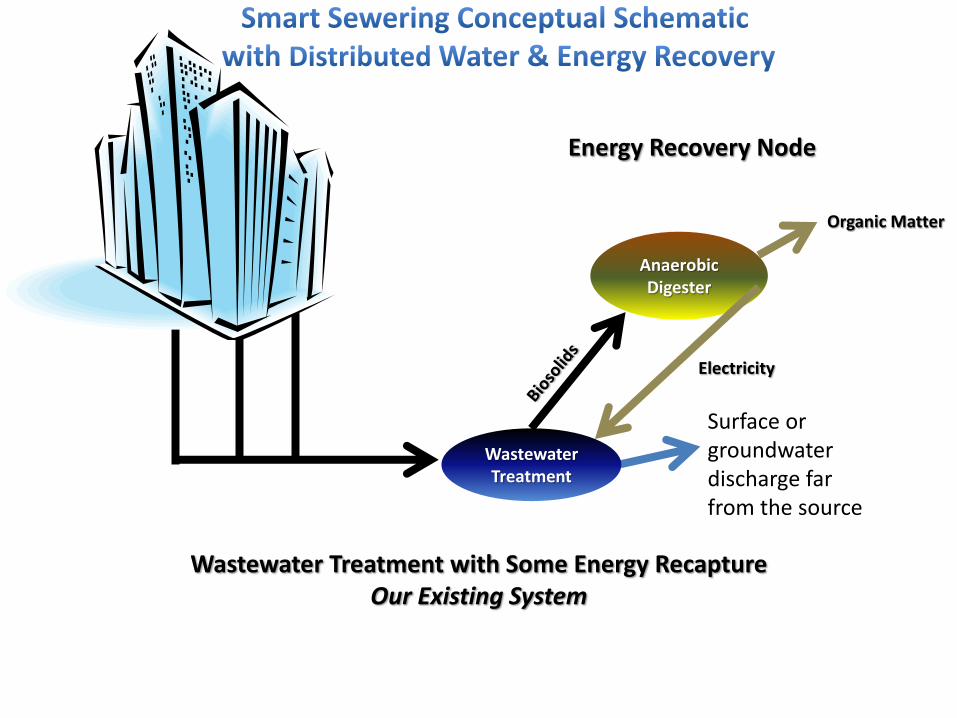
Anaerobic Digester
Wastewater Treatment with Some Energy RecaptureOur Existing System
Electricity
Organic Matter
Wastewater Treatment
Energy Recovery Node
Surface or groundwater discharge far from the source

Anaerobic Digester
Wastewater Treatment with Some Energy Recapture
Electricity
Organic Matter
Wastewater Treatment
Energy Recovery Node
Surface or groundwater discharge far from the source

Anaerobic Digester and
CHP
Wastewater Treatment andNon-Potable Water Reuse Loop
Wastewater Treatment Including Integrated Water Management
Electricity
Organic Matter
Non-potable water reuse
Groundwater RechargeWastewater Treatment
Energy Recovery NodeGreen Stormwater Management

Anaerobic Digester and
CHP
Wastewater Treatment andNon-Potable Water Reuse Loop
Wastewater Treatment With Integrated Water Management Including Nutrient Capture
Nutrients
Electricity
Organic Matter
Non-potable water reuse
Groundwater RechargeWastewater Treatment
Energy and Nutrient Recovery Node
Green Stormwater Management
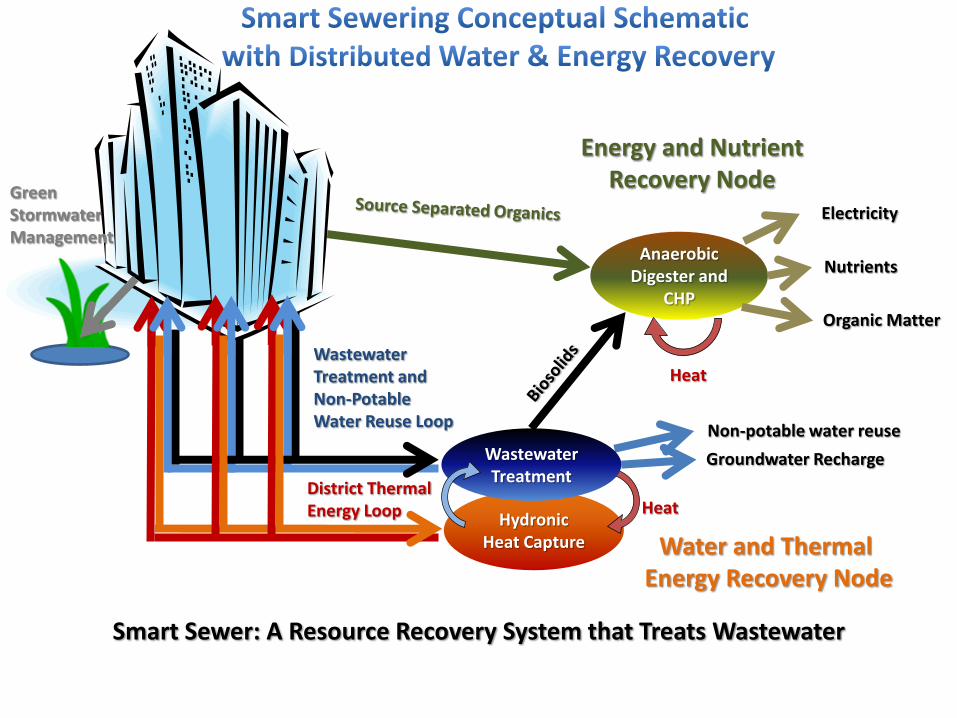
Hydronic Heat Capture
Anaerobic Digester and
CHP
Wastewater Treatment andNon-Potable Water Reuse Loop
District Thermal Energy Loop
Smart Sewer: A Resource Recovery System that Treats Wastewater
Nutrients
Electricity
Organic Matter
Non-potable water reuse
Groundwater Recharge
Heat
Wastewater Treatment
Heat
Energy and Nutrient Recovery Node
Green Stormwater Management
Water and Thermal Energy Recovery Node
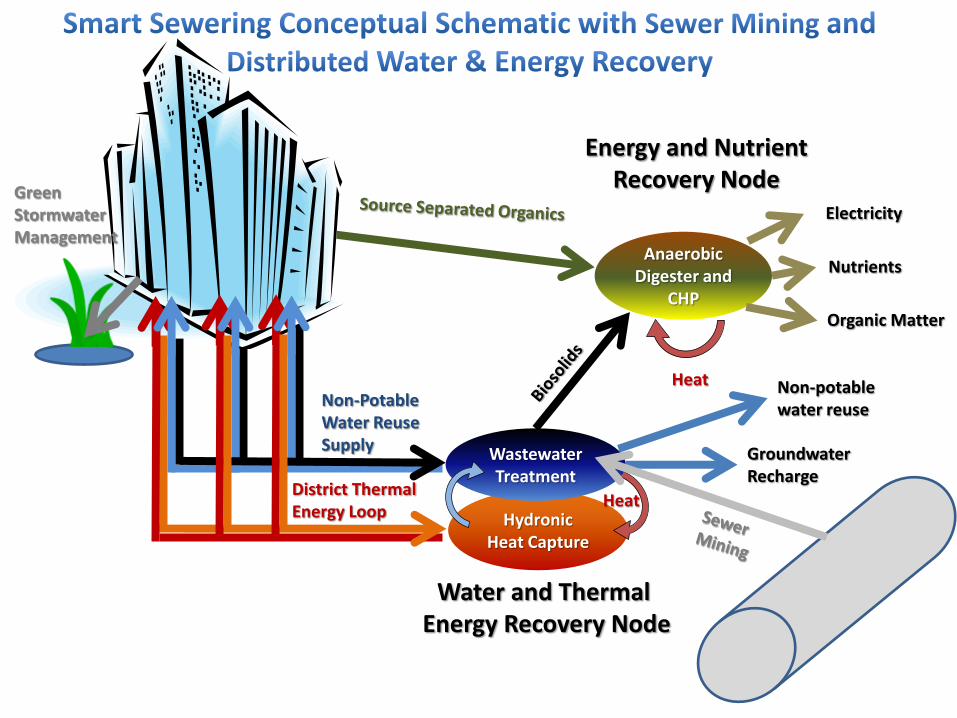
Hydronic Heat Capture
Anaerobic Digester and
CHP
Non-Potable Water Reuse Supply
District Thermal Energy Loop
Water and Thermal Energy Recovery Node
Nutrients
Electricity
Organic Matter
Non-potable water reuse
Groundwater Recharge
Heat
Wastewater Treatment
Heat
Energy and Nutrient Recovery Node
Green Stormwater Management

Unit & Economic Processes
MEMBRANE BIOREACTOR
WASTEWATER
TREATEMENTNODE
FOOD WASTE DIGESTER
SLUDGE DIGESTER
TREATED
EFFLUENTSTORAGE
TANK
LOCAL NON-POTABLE WATER
REUSE APPLICATIONS
DIGESTATE SOLD AS HIGH-VALUEFERTILIZER FOR
LAND APPLICATION
DIGESTATE TO IN-VESSEL COMPOST
TO CLASS A BIOSOLIDS
COMBINEDHEAT AND
POWER
HEAT PUMP
LOCAL HEAT APPLICATIONS TO REPLACE FUEL OIL
TIPPING FEE REVENUE FROM
FOOD WASTEACCEPTANCE
GREENWAYS/OPENSPACE
GROUNDWATER RECHARGE
RESTORED URBAN STREAMS
POCKET WETLANDSELECTRICITY OR
CNG PRODUCED TO SELL TO USERS OR
TO PIPELINE

Integrated Water Resource Management
Reuse Applications:
Toilet Flushing
Cooling Tower Make-UpWater
Landscape Irrigation
Laundry
21

Potable Water
Wastewater
Discharge to Sewers
Transfer to treatment
Membrane Bio ReactorUV/Ozone Disinfection
Reuse Water
ReservoirTo Irrigation
Distributed Water Reuse System Schematic
Aerobic Membrane Filters
Flush Water
Cooling Tower
Anoxic
Transfer to treatment
Stormwater Feed Tank
Wastewater Feed Tank
Laundry Water
Cooling Water
Co
olin
gWastewater
Re
use
Wat
er
Stormwater overflow
Highly variable
1
2
34
51 Wastewater collected for treatment
2 Stormwater collected for treatment where appropriate
Biological treatment
Final polishing and disinfection
Storage for nonpotable reuse 5
4
3 WW/Heat Pump
22

Completed Project Case Study: Battery Park, NYC
Wastewater Optimization:
• Installed 25,000 – 100,000 gpd onsite
WWT for buildings
• Assisted 9 buildings be LEED Gold
• 48% reduction in water use
• 56% reduction in WW discharge
Investment Value (pro forma):• $1.5mm capital requirement• 25% water reuse tax credit
Key Partner: Albanese Group
Similar Projects in Pipeline
• West 57th St
• New School
Note: Operated continuously through Hurricane Sandy when Battery Park was submerged and without power for a week
NSU Proposition: DBO Urban Infill WWT/Reuse

The Visionaire Building Integrates a Multi-Functional System With Existing Infrastructure
Project Summary
• Achieve 55% Water Use Reduction, 64% Sewer Discharge Reduction and 100% Reuse For Cooling Tower Make-up
• Simple implementation for single building/owner
− More cost effective than NYC water & sewer (at 95,000 GPD scale)
− Lower energy use than NYC utility infrastructure
Value Proposition
• Proven resource stewardship that reduces lifecycle cost
• Intelligent design recycles formerly wasted resources
− Energy
− Water
− Nutrients
Economics• 25% Credit on Water & Sewer Bill offsets
operating cost 5.00
7.00
9.00
11.00
13.00
15.00
17.00
19.00
2005 2007 2009 2011 2013 2015 2017 2019 2021 2023
$/k
ga
l
Year
NYC W&S Rate vs. Reuse Costs
NYC Projected W&S Rate
100,000 GPD Reuse Cost
Date of Project Launch: 2004
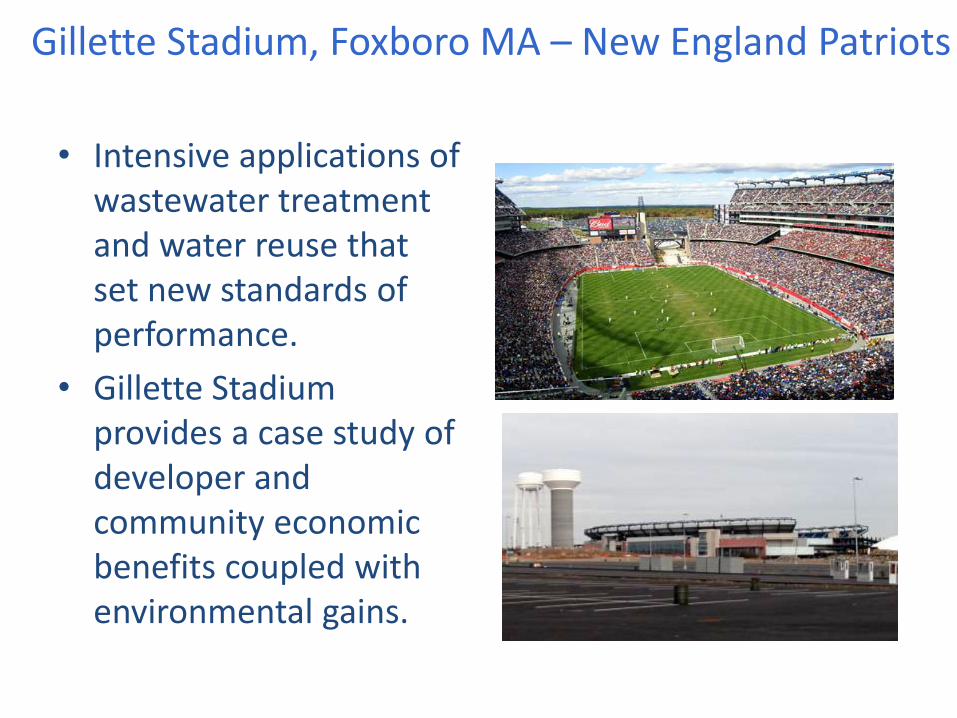
Gillette Stadium, Foxboro MA – New England Patriots
• Intensive applications of wastewater treatment and water reuse that set new standards of performance.
• Gillette Stadium provides a case study of developer and community economic benefits coupled with environmental gains.
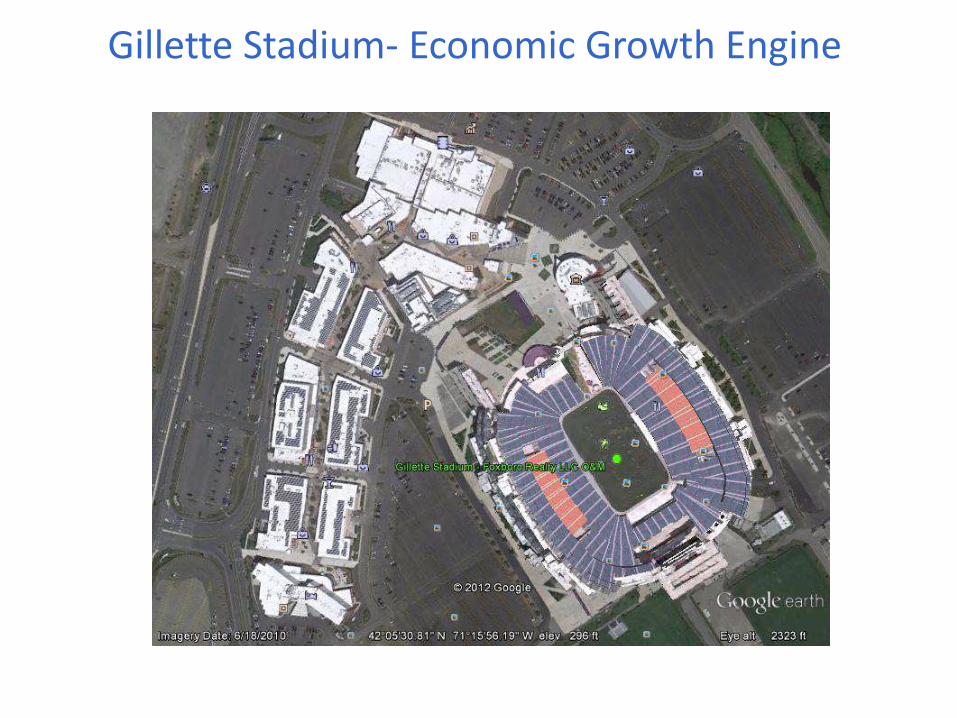
Gillette Stadium- Economic Growth Engine

Distributed Water Market Drivers are at an Inflection Point
1. Engineering Specialists Develop Experience in Niches
2. Environment & Public Health Regulations Expand
3. Incumbent Centralized Infrastructure Ages
4. Technology Tested in the Field
1. DBOO Platform Allows Solutions to Scale
2. Falling Subsidies / Demand for New Project Financing
3. Distributed Solutions Extend Capacity at Lower Cost
4. Innovative Technology Enhances Sustainability
Water Service Rate Trends in Major Cities
Past
Present
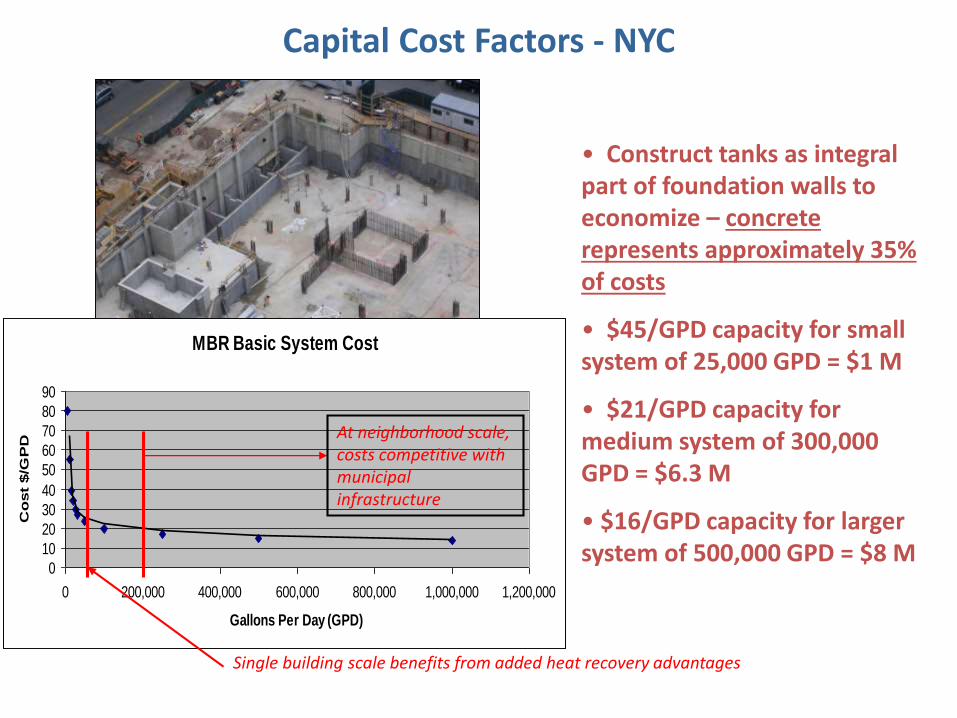
Capital Cost Factors - NYC
• Construct tanks as integral part of foundation walls to economize – concrete represents approximately 35% of costs
• $45/GPD capacity for small system of 25,000 GPD = $1 M
• $21/GPD capacity for medium system of 300,000 GPD = $6.3 M
• $16/GPD capacity for larger system of 500,000 GPD = $8 M
MBR Basic System Cost
0
10
20
30
40
50
60
70
80
90
0 200,000 400,000 600,000 800,000 1,000,000 1,200,000
Gallons Per Day (GPD)
Co
st
$/G
PD
Single building scale benefits from added heat recovery advantages
At neighborhood scale, costs competitive with municipal infrastructure

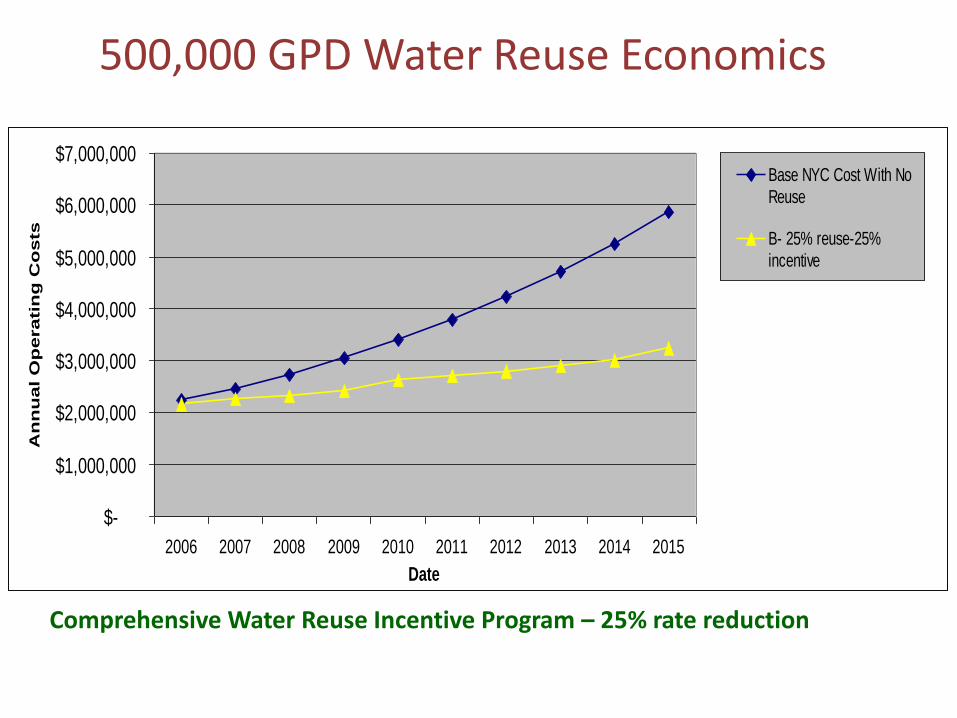
Operating Cost Factors – NYC
$-
$1,000,000
$2,000,000
$3,000,000
$4,000,000
$5,000,000
$6,000,000
$7,000,000
2006 2007 2008 2009 2010 2011 2012 2013 2014 2015
Date
An
nu
al O
perati
ng
Co
sts
Base NYC Cost With No
Reuse
B- 25% reuse-25%
incentive
NYC Comprehensive Water Reuse Incentive Program – 25% rate reduction
$-
$1,000,000
$2,000,000
$3,000,000
$4,000,000
$5,000,000
$6,000,000
$7,000,000
2006 2007 2008 2009 2010 2011 2012 2013 2014 2015
Date
An
nu
al O
perati
ng
Co
sts
Base NYC Cost With No
Reuse
B- 25% reuse-25%
incentive
500,000 GPD Water Reuse Economics
Comprehensive Water Reuse Incentive Program – 25% rate reduction

!["Pricing & Payment Strategies." Wepay >> Bill Clerico [COMMERCISM 2014]](https://static.fdocuments.net/doc/165x107/549d4318b47959cf318b496f/pricing-payment-strategies-wepay-bill-clerico-commercism-2014.jpg)