Supplemental materials Net calcification (NC) materials Net calcification (NC) Net calcification...
14
Supplemental materials Net calcification (NC) Net calcification rates of corals incubated under light and dark conditions were compared to fragments lack of tissue. For this, samples were immersed in sodium hypochlorite (NaOCl) overnight and subsequently rinsed thoroughly with DDW. Vessels containing seawater without fragments under light incubation (hereafter, seawater-only control) were used as a control for changes in carbonate chemistry during incubation not caused by the coral itself. For each treatment, pH was measured and water samples were collected for alkalinity at the beginning and end of the incubation to determine carbonate chemistry. Water samples were stored in the dark at 4°C until analyzed. Calcification rates were calculated from the difference between TA measured at the beginning and the end of each incubation period according to the following equation (Schneider and Erez, 2006): Where ΔTA is- the difference in TA measured at the beginning and end of each incubation period (milliequivalent per liter); V chamber is- the volume of the experimental vessel (ml); V coral is- the displacement volume of the coral (ml); 1.028 is the density of seawater in the northern Gulf of Eilat (g ml -1 ); T is- the incubation duration (hours); S.A. is- the surface area of the coral fragment (cm 2 ). The same equation was used to measure dissolution of bare coral skeleton. Calcification rates as obtained from the intercomparison experiment were also normalized to specimen dry skeleton weight for comparison with the radioactive estimates of calcification.
Transcript of Supplemental materials Net calcification (NC) materials Net calcification (NC) Net calcification...

Supplemental materials
Net calcification (NC)
Net calcification rates of corals incubated under light and dark conditions were
compared to fragments lack of tissue. For this, samples were immersed in sodium
hypochlorite (NaOCl) overnight and subsequently rinsed thoroughly with DDW.
Vessels containing seawater without fragments under light incubation (hereafter,
seawater-only control) were used as a control for changes in carbonate chemistry
during incubation not caused by the coral itself. For each treatment, pH was measured
and water samples were collected for alkalinity at the beginning and end of the
incubation to determine carbonate chemistry. Water samples were stored in the dark
at 4°C until analyzed. Calcification rates were calculated from the difference between
TA measured at the beginning and the end of each incubation period according to the
following equation (Schneider and Erez, 2006):
Where ΔTA is- the difference in TA measured at the beginning and end of each
incubation period (milliequivalent per liter); Vchamber is- the volume of the
experimental vessel (ml); Vcoral is- the displacement volume of the coral (ml); 1.028 is
the density of seawater in the northern Gulf of Eilat (g ml-1
); T is- the incubation
duration (hours); S.A. is- the surface area of the coral fragment (cm2). The same
equation was used to measure dissolution of bare coral skeleton. Calcification rates as
obtained from the intercomparison experiment were also normalized to specimen dry
skeleton weight for comparison with the radioactive estimates of calcification.
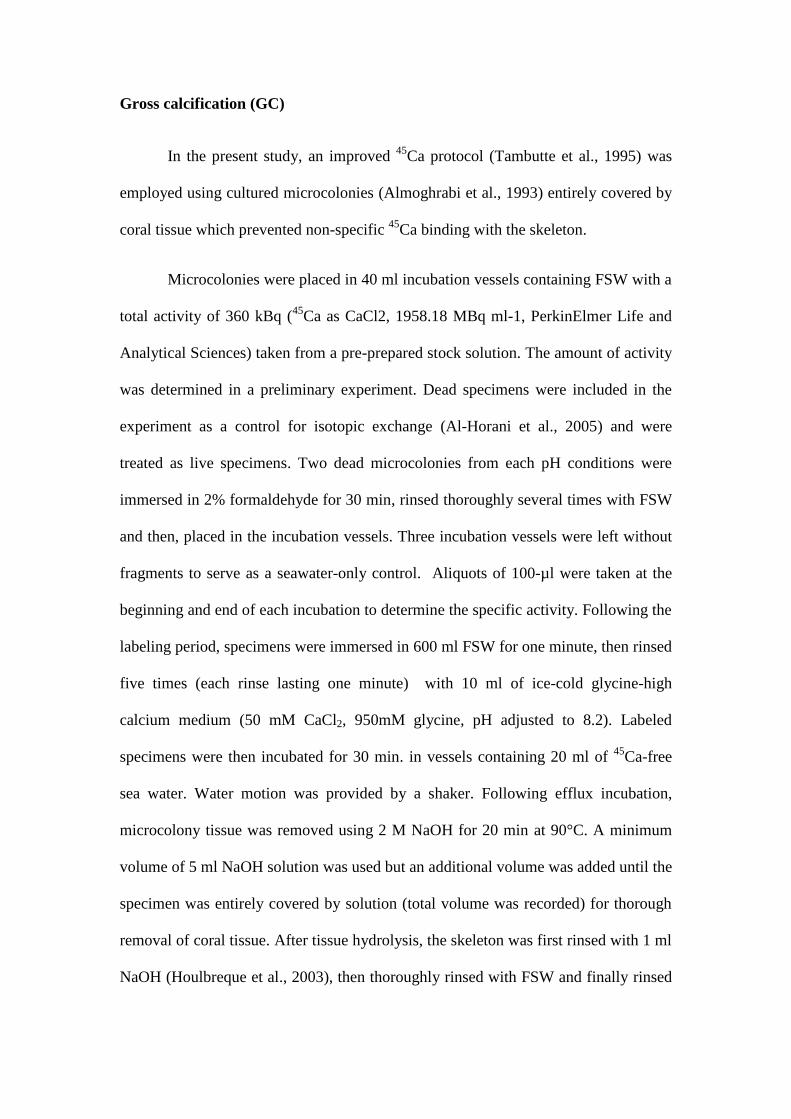
Gross calcification (GC)
In the present study, an improved 45
Ca protocol (Tambutte et al., 1995) was
employed using cultured microcolonies (Almoghrabi et al., 1993) entirely covered by
coral tissue which prevented non-specific 45
Ca binding with the skeleton.
Microcolonies were placed in 40 ml incubation vessels containing FSW with a
total activity of 360 kBq (45
Ca as CaCl2, 1958.18 MBq ml-1, PerkinElmer Life and
Analytical Sciences) taken from a pre-prepared stock solution. The amount of activity
was determined in a preliminary experiment. Dead specimens were included in the
experiment as a control for isotopic exchange (Al-Horani et al., 2005) and were
treated as live specimens. Two dead microcolonies from each pH conditions were
immersed in 2% formaldehyde for 30 min, rinsed thoroughly several times with FSW
and then, placed in the incubation vessels. Three incubation vessels were left without
fragments to serve as a seawater-only control. Aliquots of 100-µl were taken at the
beginning and end of each incubation to determine the specific activity. Following the
labeling period, specimens were immersed in 600 ml FSW for one minute, then rinsed
five times (each rinse lasting one minute) with 10 ml of ice-cold glycine-high
calcium medium (50 mM CaCl2, 950mM glycine, pH adjusted to 8.2). Labeled
specimens were then incubated for 30 min. in vessels containing 20 ml of 45
Ca-free
sea water. Water motion was provided by a shaker. Following efflux incubation,
microcolony tissue was removed using 2 M NaOH for 20 min at 90°C. A minimum
volume of 5 ml NaOH solution was used but an additional volume was added until the
specimen was entirely covered by solution (total volume was recorded) for thorough
removal of coral tissue. After tissue hydrolysis, the skeleton was first rinsed with 1 ml
NaOH (Houlbreque et al., 2003), then thoroughly rinsed with FSW and finally rinsed

with DDW (Tambutte et al., 1995). As solution from the first rinse was added to the
tissue hydrolysate and the remaining rinsing solution was decanted. Finally, skeletons
were dried at 70°C for about 5 h and skeleton dry weight was determined. Skeletons
were completely dissolved in 12 M HCl by adding small amounts of the solution (the
minimum total volume was 2.4 ml and total volume was recorded), over a period of a
day accompanied by gentle shaking. To exclude errors due to adsorption or
precipitation of radioisotope on the walls of the vessels, the vessels used in the
washing procedure were rinsed with 5 M HCl and FSW between the incubation
periods and new vials were used to collect the tissue and the skeleton fractions from
each specimen. Samples (500 µl) of skeleton digest and tissue hydrolysate were added
to 10 ml Ultima Gold AB (PerkinElmer) scintillation liquid and measured on the
scintillation counter (Tri-carb 1600TR, Packard). Prior to counting, 2M HCl were
added to tissue fractions until samples were no longer alkaline (acidic or neutralize) to
avoid quenching caused by a chemical (NaOH). Counts of both fractions were
corrected according to HCl/NaOH total volume to receive the total amount of 45
Ca
incorporation into the skeleton/tissue during incubation. Calcification rates were then
calculated from the activity recorded in seawater control samples and given in µmol
Ca2+
per skeleton dry weight (Houlbreque et al., 2003;Tambutte et al., 1996) using the
formula:
Where Activitysample is the total DPM in skeleton dissolution sample
( ; Activityseawater is the total DPM
in 100µl seawater sample (control); 1.17 is the amount of Ca2+
in 100µl ambient
seawater (µmol) and W is skeleton dry weight. The amount of 45
Ca uptake by dead
specimens (covered with tissue) was subtracted from the amount measured in intact
(live) specimens.
While we did not discuss 45
Ca uptake by the tissue it should be noted that
there were no significant differences with time, for both pH treatments (Two-way
ANOVA, p=0.728 and p=0.38 at pHT 8.09 and 7.49 respectively).
Calculation of carbonate system in seawater
Total alkalinity (TA) values were measured using an automatic potentiometric
titration (Mettler-Toledo GmbH, DL67 titrator) to the second end point (Almgren et
al., 1983) of a 12.3-g accurately weighed seawater sample. It was then computed
using the Gran equation (DOE, 1994) with pH values lower than 3.9 for creating the
Gran plot. The pH electrodes (Mettler-Toledo DG-111–SC; Stockholm, Sweden)
were calibrated daily before starting using the titrator. The acid concentration was
0.049N HCl (JT Baker, Phillipsburg, NJ). In the series of experiments comparing
gross and net calcification, a new titrator was utilized: a Metrohm 862 compact
titrosampler (autosampler combined with titrator) that uses not less than 35 g seawater
samples. Hence, experimental samples containing only 40 ml, were diluted by a factor
of 3 and acid concentration was set to 0.025 M. Alkalinity was calculated using the
first derivative of the curve for the evaluation of the exact end point. Prior to
measurement water samples were filtered (0.2μm membranes). The differences
between duplicate samples were less than 6 µEq kg-1
(for calibration of the titrator,
differences were measured between triplicate samples). Water samples analysis were

stored in darkness at 4°C in brown glass bottles filled up to the top with a gas tight
screw and processed within two weeks of collection.
pH Measurements were carried out using a CyberScan pH meter (pH/Ion 015 ,
Eutech Instruments with automatic temperature compensation) and CyberScan gel-
filled pH combination electrode. Prior to experiments, the pH electrode was calibrated
against National Bureau of Standards (NBS) scale buffers of 4.01, 7.00 and 10.00 at
25 o
C and was soaked in seawater for at least 1 h before measurement. The
manufacturer's technical specifications of the pH meter are 0.01 pH for resolution and
± 0.01 (standard error) for accuracy.
Components of the carbonate system (pCO2, CO3−2
, HCO3, DIC
concentrations and Ω aragonite) were calculated from total alkalinity along with pH
values, temperature and salinity using the CO2SYS program, version 01.03 (Lewis
and Wallace 1998; Table 3). The pHNBS were shifted onto the total pH scale (pHT) by
subtracting -0.11 (Zeebe and Wolf-Gladrow, 2001), which includes a minor
correction for [SO42-
] and the stability constant of HSO4- at a salinity of 40.7‰. The
thermodynamic carbonate dissociation constants for activity scales (K1 and K2) were
attained from Mehrbach et al. (1973) and the refit by Dickson and Millero (1987).
Statistical analysis
Data from the tissue fixation, anesthesia and coral freezing experiments, as
well as the lesioned corals experiment were analyzed by one- or two-way factorial
analysis of variance (ANOVA) using the statistical software SPSS 15. If necessary,
logarithmic or reciprocal transformations were performed to satisfy the assumptions
of normality. Comparison of light and dark calcification with the dissolution of coral
skeleton were performed using an ANOVA permutation test (e.g. Fisher 1935, Manly

1997) as the data did not meet with assumptions of normality and homogeneity of
variance even with transformation. Permutation tests provide superior Type I error
control when assumptions of traditional parametric tests are violated (Good, 1994).
We then used the Akaike's Information Criterion (AICc), corrected for small sample
size (Burnham and Anderson, 2002), to select the model (combination of factors) that
best explained calcification rates patterns (minimum AICc score). Akaike weights
were computed to evaluate the probability that a specific model is the best model for
the observed data (Burnham and Anderson 2002; Johnson and Omland, 2004). In the
results we refer only to the selected model. Where significant effects existed, we used
Tukey's HSD multiple comparison to identify differences between subgroups.
To assess the compatibility of TA depletion and the 45
Ca-labling techniques
we examined: (1) the strength of the relationship between methods using the Reduced
Major Axis regression (RMA, Model 2 regression; Ricker, 1973;Jacques and Pilson,
1980). The regression was calculated with the geometric mean estimate described by
Ricker (1973) and Ricker (1975); the slope of the functional regression is computed
by dividing the slope of the least squares predictive regression by the correlation
coefficient; and (2) the similarity between mean values and precision level (the
difference of calcification value from the average, at each pH and time interval) of
both methods using the permutation test for repeated measure ANOVA. The latter can
evaluate whether both methods produce similar values for all individuals (degree of
agreement between methods; Bland and Altman, 1986).
To detect differences between subgroups we used Tukey's HSD-adjusted for
repeated measure ANOVA using the statistical program R (Maxwell and Delaney
2003). R, version 2.13.2 (R Development Core Team, 2006) was used to perform the

permutational ANOVA and the RMA analyses. The level of statistical significance
was set at p<0.05.

Supplemental references
Al-Horani, F. A., Al-Rousan, S. A., Manasrah, R. S., and Rasheed, M. Y.: Coral
calcification: Use of radioactive isotopes and metabolic inhibitors to study the
interactions with photosynthesis and respiration, J. Chem. Ecol., 21, 325-335,
10.1080/02757540500258724, 2005.
Almgren, T., Dyrssen, D., and Fonselius, S.: Determination of alkalinity and total
carbonate, in: Methods of seawater analysis, edited by: Grasshoff, K., Ehrhadt, M.,
and Kremling, K., Verlag Chemie GmbH, 99-123, 1983.
Almoghrabi, S., Allemand, D., and Jaubert, J.: Valine Uptake by the Scleractinian
Coral Galaxea-Fascicularis - Characterization and Effect of Light and Nutritional-
Status, J. Comp. Physiol. B.,, 163, 355-362, 1993.
Bland, J. M., and Altman, D. G.: STATISTICAL-METHODS FOR ASSESSING
AGREEMENT BETWEEN 2 METHODS OF CLINICAL MEASUREMENT,
Lancet, 1, 307-310, 1986.
Burnham, K.P., and Anderson, D.R. (2002). Model Selection and Multimodel
Inference: A Practical Information-Theoretic App roach (NewYork: Springer), 488
pp.
Dickson, A. G., and Millero, F. J.: A Comparison of the Equilibrium-Constants for the
Dissociation of Carbonic-Acid in Seawater Media, Deep-Sea Research Part a-
Oceanographic Research Papers, 34, 1733-1743, 1987.
DOE: Handbook of methods for the analysis of the various parameters of the carbon
dioxide system in sea water version 2 ed., edited by: Dickson, A. G., and Goyet, C.,
ORNL/CDIAC-74, 1994.
Fisher R.A.: The Design Of Experiments. Hafner, New York, N.Y, 1935
Good, P.: Springer Series in Statistics: Permutation tests: A practical guide to
resampling methods for testing hypotheses, Springer Series in Statistics; Permutation
tests: A practical guide to resampling methods for testing hypotheses, 1994.
Houlbreque, F., Tambutte, E., and Ferrier-Pages, C.: Effect of zooplankton
availability on the rates of photosynthesis, and tissue and skeletal growth in the
scleractinian coral Stylophora pistillata, J. Exp. Mar. Biol. Ecol., 296, 145-166, 2003.
Jacques, T. G., and Pilson, M. E. Q.: Experimental ecology of the temperate
scleractinian coral Astrangia danae 1. Partition of respiration, photosynthesis and
calcification between host and symbionts, Mar. Biol., 60, 167-178, 1980.
Johnson, J. B., and Omland, K. S.: Model selection in ecology and evolution, Trends
in Ecology & Evolution, 19, 101-108, 10.1016/j.tree.2003.10.013, 2004.
Manly B. F. J.: Randomization, Bootstrap and Monte Carlo, 1997.
Maxwell, S. E., & Delaney, H. D.: Designing experiments and analyzing data: A
model comparison perspective. Mahwah, NJ: Lawrence Erlbaum Associates. Methods
in Biology, 2nd edn. Chapman & Hall, London, 2003.

Mehrbach, C., Culberso.Ch, Hawley, J. E., and Pytkowic.Rm: Measurement of
Apparent Dissociation-Constants of Carbonic-Acid in Seawater at Atmospheric-
Pressure, Limnol. and Oceanogr., 18, 897-907, 1973.
Ricker, W. E.: Linear Regressions in Fishery Research, J. Fish. Res. Bd., 30, 409-434,
1973.
Ricker, W. E.: Linear Regressions in Fishery Research - Note, J. Fish. Res. Bd., 32,
1494-1498, 1975.
Schneider, K., and Erez, J.: The effect of carbonate chemistry on calcification and
photosynthesis in the hermatypic coral Acropora eurystoma, Limnol. and Oceanogr.,
51, 1284-1293, 2006.
Tambutte, E., Allemand, D., Bourge, I., Gattuso, J. P., and Jaubert, J.: An Improved
Ca-45 Protocol For Investigating Physiological-Mechanisms In Coral Calcification,
Mar. Biol., 122, 453-459, 1995.
Tambutte, E., Allemand, D., Mueller, E., and Jaubert, J.: A compartmental approach
to the mechanism of calcification in hermatypic corals, J. Exp. Biol., 199, 1029-1041,
1996.
Zeebe, R. E., and Wolf-Gladrow, D.: CO2 in Seawater: Equlibrium, Kinetics,
Isotopes, Elsevier Science, B.V, Amsterdam, 346 pp., 2001.

Fig .S1. Total alkalinity (TA) as measured from the recirculating seawater system in which corals were
maintained during the time frame of experiments: 7.19 (open triangle), 7.49 (open square) and 8.09
(open diamond) pHT treatments as compared with monthly measurements of ambient seawater (closed
diamond) as received from the Israel National Monitoring Program (NMP) of the Gulf of Eilat database
(sampling depth was 20-40 m, similar to the depth from which seawater was supplied to the system).
Additions of CO2 to seawater did not alter total alkalinity (Zeebe and Wolf-Gladrow 2003). Indeed,
results of the CO2 enriched treatments, pHT 7.19 and 7.49 are in the range of the pHT 8.09 (as recorded
from our system). The small differences in TA found between the ambient pH treatments in our system
and the monthly measurements by the NMP, can derive from secreting organisms that alter alkalinity in
the seawater before entering the tanks.

Fig. S2. Calcification values of S. pistillata micorcolonies as obtained from the (A), (B) alkalinity-
depletion technique and (C), (D)
45Ca incorporation method. Each point represents a calcification rate
of a given fragment. Microcolonies were incubated under normal (8.09; plots A, C) and reduced (7.49;
plot B, D) initial pHT and in the presence of light, over three time points, 2, 4 and 6 h; n=6 for time
points. Calcification rates of intact specimens, derived from the 45
Ca method, were corrected by
subtracting 45
Ca uptake of the dead fragments –control. Microcolonies used in the experiment were
cultured in the pH system for a period of 14 months before the experiment was conducted. Linear
regression (solid line) is plotted along with the 95% confidence interval (dashed line). All plotted
regressions are statistically significant (p<0.05).
2 4 6
0
1
2
3
4
5
6
7
8
Time (hour)
2 4 6Cal
cifi
cati
on
(
mo
l C
aCO
3 g
-1 d
ry s
kel
eto
n)
0.0
.5
1.0
1.5
2.0
2.5
3.0
2 4 6Cal
cifi
cati
on (
mol
CaC
O3 g
-1 d
ry s
kel
eton)
0.0
.5
1.0
1.5
2.0
2.5
3.0
Time (hour)
2 4 6
0
1
2
3
4
5
6
7
8
B
C D
A
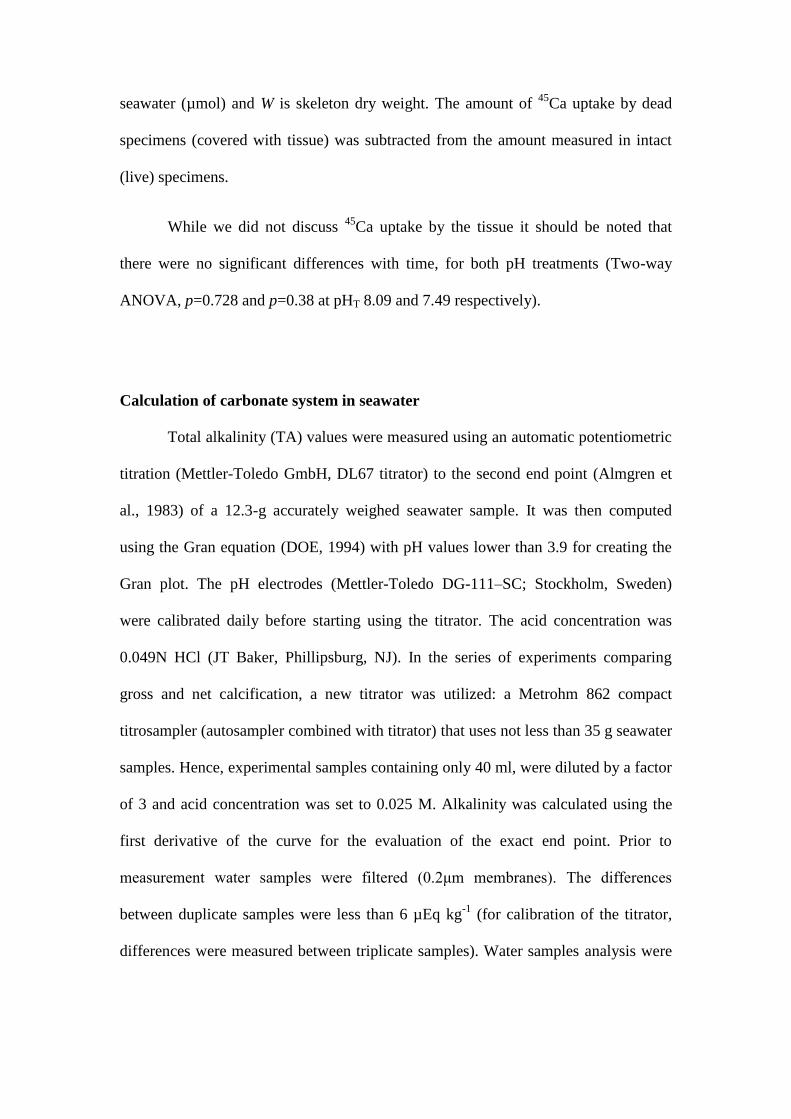
Table S1. Calcification and final pH values of S. pistillata microcolonies resulting from alkalinity-
depletion and 45
Ca incorporation methods (pH values measured at the end of the alkalinity experiment).
Data are presen ted as mean±STDV.
Table S2. Results of permutational ANOVA design for the effect of pH (8.09 and 7.49, on the pHT
scale), time (2, 4 and 6 h) and method (45
Ca and total alkalinity) on the total calcification values of the
coral S. pistillata.
Total alkalinity 45Ca uptake Total alkalinity 45
Ca uptake
8.09 2 0.853±0.39 0.815±0.328 0.426±0.195 0.408±0.164 8.26±0.04
4 1.285±0.342 0.824±0.382 0.321±0.085 0.206±0.095 8.5±0.06
6 1.933±0.426 1.275±0.332 0.322±0.071 0.212±0.055 8.55±0.1
7.49 2 1.268±0.15 1.053±0.182 0.634±0.075 0.527±0.091 7.77±0.11
4 3.061±1.533 2.598±0.577 0.765±0.383 0.65±0.144 8±0.09
6 3.265±2.287 2.962±0.58 0.544±0.381 0.494±0.097 8.3±0.06
(µmol CaCO3 g-1
dry skeleton h-1
)
Total calcification Calcification rates
pHT
treatmentTime (h) Final pHT
(µmol CaCO3 g-1
dry skeleton)
Source of variation df SS MS P (perm)
pH 1 44.933 44.933 0.0327
Time 2 1.447 0.724 0.9216
Method 2 2.284 2.284 0.2015
pH × Time 1 7.134 3.567 0.0048
pH × Method 1 0.015 0.015 0.2015
Time × Method 2 0.479 0.239 1
pH × Time × Method 2 0.221 0.11 0.5701
Residuals 59 44.516 0.755 0.9804

Table S3. Seawater carbonate chemistry in each of the incubation vessels in the alkalinity experiment
of the long-term acclimation experiment. TA and pH were measured, while all other parameters were
calculated using the CO2SYS program.
TA DIC p CO2 CO2(aq) HCO3-
CO32-
(µeqv
kg-1
)
(µmol
kg-1
)(µatm)
(µmol
kg-1
)
(µmol
kg-1
)
(µmol
kg-1
)
8.09 Control 1 2506.6 8.09 2133 390.9 10.8 1859.2 263.1 4.01
2 1 2380.5 8.23 1920.2 243.8 6.7 1600.8 312.7 4.76
2 2462.9 8.26 1967.7 230.5 6.4 1621.9 339.4 5.17
3 2391.2 8.25 1914.1 230.4 6.4 1583.8 323.9 4.93
4 2377.2 8.29 1871 202.1 5.6 1523.7 341.7 5.2
5 2422.5 8.3 1901.3 199.9 5.5 1542 353.8 5.39
6 2367.2 8.2 1931.1 265.6 7.3 1627.2 296.6 4.52
4 1 2403.5 8.48 1734.4 110.1 3 1285.1 446.3 6.8
2 2401.5 8.5 1715.5 102.7 2.8 1255.9 456.8 6.96
3 2288.0 8.55 1583.9 81.9 2.3 1123.2 458.4 6.98
4 2363.0 8.54 1650.7 87.9 2.4 1178.4 469.9 7.16
5 2305.5 8.4 1722.6 137.3 3.8 1333.6 385.3 5.87
6 2360.7 8.55 1640.3 84.8 2.3 1163.3 474.7 7.23
6 1 2344.4 8.56 1619.1 81.3 2.2 1140.6 476.3 7.25
2 2336.6 8.71 1485.7 47.1 1.3 933.7 550.7 8.39
3 2302.9 8.58 1570.1 74.2 2 1091 477 7.27
4 2267.1 8.57 1550.9 75.6 2.1 1085.2 463.7 7.06
5 2280.5 8.5 1619.8 97 2.7 1185.9 431.3 6.57
6 2314.8 8.4 1730.3 137.9 3.8 1339.5 387 5.89
7.49 Control 1 2509.9 7.41 2474.8 2355.5 65 2340.6 69.2 1.05
2 1 2357.6 7.7 2211 1064.6 29.4 2062.8 118.9 1.81
2 2398.6 7.48 2338.1 1892.3 52.2 2209.2 76.7 1.17
3 2365.0 7.76 2191.2 913.2 25.2 2031.6 134.5 2.05
4 2343.0 7.73 2183.8 978.4 27 2031.4 125.5 1.91
5 2311.8 7.76 2140.6 892.1 24.6 1984.6 131.3 2
6 2296.3 7.77 2121.3 862.9 23.8 1964.4 133 2.03
4 1 2317.0 8.02 2007.8 440 12.1 1781.2 214.5 3.27
2 2235.3 7.9 2000.4 592 16.3 1818 166.1 2.53
3 2111.0 8.15 1741.4 273.1 7.5 1491.6 242.3 3.69
4 2239.3 8.03 1931.3 412.6 11.4 1709.2 210.6 3.21
5 2013.9 7.95 1769.6 462.5 12.8 1593.5 163.3 2.49
6 2282.7 7.96 2011.7 512.8 14.1 1808 189.6 2.89
6 1 2049.6 8.29 1593.2 172.1 4.7 1297.5 291 4.43
2 2188.2 8.34 1673.1 157.6 4.3 1333.3 335.5 5.11
3 2306.3 8.31 1795.3 183.7 5.1 1449.8 340.4 5.19
4 2053.6 8.37 1538.7 133.4 3.7 1209.1 326 4.97
5 2208.3 8.3 1720.3 180.9 5 1395.1 320.1 4.88
6 2180.3 8.18 1782.3 258.4 7.1 1512 263.2 4.01
pHT
treatment
Time
(h)
Number
of repeat
Final
pHT
Ωarg

Table S4. Changes in seawater carbonate chemistry from the initial conditions (T0) as obtained from
the alkalinity experiment of the long-term acclimation experiment. Changes, expressed in percentage,
were calculated between the beginning and end of each incubation (2, 4 and 6 h).
Time (h)
pHT 8.09 7.49 8.09 7.49 8.09 7.49
4.2 6.4 6.1 12.2 7.9 13.6
10 11.1 21.5 22.8 25.1 31.9
2.1 3.9 5.0 7.9 5.7 11.8
14.8 12.5 34.2 27.3 39.2 41.6
-24.6 -73.3 70.0 185 76.4 351
Alkalinity
DIC
pH final
HCO3-
CO32-
Carbonate
parameter
% Change from initial (T0)
2 4 6