Supplemental Materials and Methods Reagents, cell lines ... · Supplemental Materials and Methods ....
19
Supplemental Materials and Methods Reagents, cell lines and cell culture Human prostate cancer cell lines PC3 and LNCaP were obtained from the American Type Culture Collection. These cells were cultured in RPMI 1640 supplemented with 10% fetal bovine serum (Hyclone), 100 U/ml of penicillin and 100 μg/mL streptomycin, and maintained in an incubator with a humidified atmosphere of 95% air and 5% CO 2 at 37 ºC. Nicotinic acid was purchased from Sigma and AZD2281 from Selleck Chemicals. Tissue sample preparation for protein extraction One pair of frozen benign and prostate cancer tissue specimens were used for this study. Samples were taken from a patient who underwent radical prostatectomy at the City of Hope (COH) National Medical Center with final diagnosis of prostatitic adenocarcinoma (Gleason score 7). The samples were snap- frozen shortly after prostatectomy and had been stored at –80 o C at the COH Tumor Bank since collected. The protocol for using these samples was approved by the COH Cancer Protocol Review and Monitoring Committee (CPRMC) and Institutional Review Board (IRB). Cancer and normal/BPH tissues were harvested from cancer and benign tissue blocks, respectively, using biopsy needles (Miltex, Inc., York, PA). The areas for sampling were circled on the H&E slides by a pathologist and then marked on the blocks to achieve high tumor content (> 90%). Up to 10 cores (1.5 mm in diameter and 2-5 mm in depth, 50-100 mg in weight) were punched from each frozen tissue block. Tissues were homogenized with 10 volume of RIPA buffer (50 mM Tris, 150 mM NaCl, 0.5% Sodium deoxycholate, 0.1% SDS, 1% NP-40, pH 8.0) supplied with Complete Protease Inhibitors (Roche) and PMSF (Sigma). Soluble proteins were collected after centrifugation for Western blot analysis.
Transcript of Supplemental Materials and Methods Reagents, cell lines ... · Supplemental Materials and Methods ....
Supplemental Materials and Methods
Reagents, cell lines and cell culture
Human prostate cancer cell lines PC3 and LNCaP were obtained from the American Type Culture
Collection. These cells were cultured in RPMI 1640 supplemented with 10% fetal bovine serum
(Hyclone), 100 U/ml of penicillin and 100 µg/mL streptomycin, and maintained in an incubator with a
humidified atmosphere of 95% air and 5% CO2 at 37 ºC. Nicotinic acid was purchased from Sigma and
AZD2281 from Selleck Chemicals.
Tissue sample preparation for protein extraction
One pair of frozen benign and prostate cancer tissue specimens were used for this study. Samples were
taken from a patient who underwent radical prostatectomy at the City of Hope (COH) National Medical
Center with final diagnosis of prostatitic adenocarcinoma (Gleason score 7). The samples were snap-
frozen shortly after prostatectomy and had been stored at –80 oC at the COH Tumor Bank since collected.
The protocol for using these samples was approved by the COH Cancer Protocol Review and Monitoring
Committee (CPRMC) and Institutional Review Board (IRB). Cancer and normal/BPH tissues were
harvested from cancer and benign tissue blocks, respectively, using biopsy needles (Miltex, Inc., York,
PA). The areas for sampling were circled on the H&E slides by a pathologist and then marked on the
blocks to achieve high tumor content (> 90%). Up to 10 cores (1.5 mm in diameter and 2-5 mm in depth,
50-100 mg in weight) were punched from each frozen tissue block. Tissues were homogenized with 10
volume of RIPA buffer (50 mM Tris, 150 mM NaCl, 0.5% Sodium deoxycholate, 0.1% SDS, 1% NP-40,
pH 8.0) supplied with Complete Protease Inhibitors (Roche) and PMSF (Sigma). Soluble proteins were
collected after centrifugation for Western blot analysis.
Western blot and immunoprecipitation analysis
Western blot was carried out with the following antibodies: NAMPT (Bethyl), SIRT1 (Epitomics),
NNMT (GenWay), acetylated p53 (Cell Signaling), acetylated FOXO1 (Santa Cruz Biotech), acetylated
lysine (Millipore), FOXO3a (Cell Signaling) and GAPDH (Trevigen). FOXO3a immunoprecipitation
was performed as described previously (Chen et al., 2005) using protein A/G-agarose beads (Santa Cruz
Biotech).
Measurement of cell proliferation and apoptosis
Cell proliferation was analyzed using XTT Cell Proliferation Kit (Roche) per manufacture’s instructions.
Apoptosis was measured by TUNEL assay using a tetramethylrhodamine (TMR red) In Situ Cell Death
Detection Kit (Roche) coupled with flow cytometry or photographed under fluorescent microscope as per
manufacture’s instructions. TMR was excited with 530 nm (green) laser for flow cytometric analysis.
Stable gene knockdown using lentiviral vectors
Short hairpin RNA (shRNA) was designed according to rules described by Reynolds et al (Reynolds et
al., 2004). The sequence of shRNA against NAMPT was 5’-GAGTGTTACTGGCTTACAA-3’, and a
second shRNA (5’-GAGTGTTACGGGGTTCCAG-3’) was from the literature (Yang et al., 2007).
Scrambled shRNA sequence was created by mutating critical bases on shRNA against NAMPT: 5’-
GAGTGTTACGGGGTTCCAG-3’. The sequence of shRNA against SIRT1 was 5’-
GAAGTGCCTCAGATATTAA-3’. All shRNAs were subcloned into the pSicoR lentiviral
vector(Ventura et al., 2004), in which shRNA is driven by a U6 promoter and a reporter green fluorescent
protein (GFP) expression cassette is driven by an immediate early promoter of cytomegalovirus (CMV).
We produced VSV-G (G protein of vesicular stomatitis virus) pseudotyped shRNA lentiviral vectors
using a four-plasmid transfection system described previously (Yuan et al., 2010). Recombinant
lentiviruses for NAMPT or SIRT1 knockdown were referred to shNAMPT or shSIRT1 respectively.
Lentiviral transductions were conducted at a multiplicity of infection (MOI) of 4. Transduced cells were
typically used for further experiments after 3 days of transductions. In addition, we constructed an
inducible lentiviral vector for SIRT1 knockdown. SIRT1 shRNA oligoes were annealed and cloned into
Age1 and EcoR1 sites of pLKO-Tet-On vector (Wiederschain et al., 2009). Viral particles were produced
as described above. Two days after transduction, cells were treated with puromycin (2 μg/ml) and stable
cell line was established. Cells were then treated with doxycycline (100 μg/ml) to induce shSIRT1
expression and gene knockdown.
RNA analysis
Total RNA was extracted using Trizol (Invitrogn), and treated with RNase free DNase (Roche). First
strand cDNA was synthesized using Superscript III kit (Invitrogen). The cDNA was diluted and 2μl was
used for real time PCR using SYBR Green qPCR kit (Invitrogen). Real time PCR was performed on IQ5
multicolor Real-time PCR system (Bio-Rad). Melting curve was generated at the end of PCR cycles to
check the specificity of the primers. The 18s rRNA gene was used as a control. Primers sequences are
available upon request.
Colony formation assay
A standard two-layer soft agarose culture was used with the bottom layer of 0.6% agarose and the top
layer of 0.35% agarose. Prostate cancer cells were seeded in triplicate at 500 cells/well in 6-well plate,
and colonies were counted after 20 days of incubation. Plates were stained with 0.0055% Crystal Violet
for 1 hour, then rinsed with water and colonies were scored with aid of a microscope.
Measurement of SIRT1 deacetylase activity
Change of NAD+-dependent deacetylase activity in prostate cancer cells upon NAMPT knockdown was
determined using SIRT1 Fluorimetric Drug Discovery kit (Biomol) as per the manufacturer’s
recommendations. Non-NAD+ dependent Histone deacetylase (HDAC) activity was blocked by adding
800 nM trichostatin A (Sigma).
NAMPT and SIRT1 over-expression
For NAMPT over-expression, we extracted total RNA from human WI38 fibroblast cells and synthesized
the first strand cDNA by reverse-transcription. NAMPT coding sequence (CDS) was amplified from
cDNA using a pfu DNA polymerase (Strategene) with the following primers: forward 5’-
CTGTCCTCCGGCCCG-3’; reverse 5’-GCAAAGGGCCCTAAAAAGCTTAC-3’. NAMPT CDS was
cloned into TA cloning vector (Invitrogen) and verified by DNA sequencing. To enhance the expression
of NAMPT, a Kozak sequence (GCCACC) was added right before the start codon of NAMPT CDS, and
the entire NAMPT expression sequence was then placed under a cytomegalovirus (CMV) promoter in a
lentiviral vector. For SIRT1 over-expression, a pBabe retroviral vector carrying a SIRT1 expression
cassette, pYESir2-puro (Vaziri et al., 2001), was obtained from Addgene, and retrovirus was packaged
using Phoenix Ampho cell line (ATCC). SIRT1 over-expressing PC3 and LNCaP cells were selected
using puromycin at 1 or 0.5 µg/ml for 1 week, respectively.
In vitro cell invasion assay
This assay was performed using QCM ECMatrix Cell Invasion Fluorometric Assay Kit (Chemicon) as per
the manufacturer’s instructions. PC3 cells were transduced with lentiviral vectors at MOI of 4. Three
days after transduction, cells were incubated in serum-free media for 1 day, and 2x10⁵ cells were then
seeded in the upper chambers. After 48 hours of incubation, migrated cells in the lower chamber was
measured by the fluorometri assay as instructed.
ROS measurement
ROS level was measured using the dye 5-(and-6)-carboxy-2′,7′-difluorodihydrofluorescein diacetate
(H2DFFDA; Molecular Probes). Following treatment with FK866 for 72hrs, cells were trypsinized and
re-suspended in phosphate buffered saline and loaded with 5 μM H2DFFDA for 30 min at room
temperature. Cells were then centrifuged and re-suspended in growth medium and incubated for 1hr in
CO2 incubator. After washing the dye, cells were analyzed immediately by flow cytometry with excitation
at 488 nm and emission at 515 nm.
NAD+, Glucose, and ATP assays
Cellular NAD+ concentration was measured using NAD/NADH Assay Kit (Abcam) as per the
manufacturer’s instruction. Glucose was analyzed using Glucose Assay Kit (Sigma). Briefly, PC3 cells
were seeded at a density of 5x10⁴ cells/ml in a 24-well plate in duplicates and were treated with FK866
(10-50nM) or DMSO. Media aliquots were collected at different time points and diluted 1:80 in sterile
water for glucose measurement. ATP was measured using Cell Titer Glo Kit (Promega). The cells on 24-
well plates were equilibrated for 30 minutes at room temperature (RT), detached from the plate with 50 μl
Trypsin, resuspended in 250ul of RPMI 1640 media and counted. An aliquot of 100ul cells were then
mixed with an equal volume of Cell Titer Glo reagent, and the contents were placed on an orbital shaker
to induce cell lysis for 2 minutes, followed by incubation at RT for 10 minutes to stabilize the luminescent
signal before obtaining the reading at an integration time of 0.25-1second per well.
References:
Chen WY, Wang DH, Yen RC, Luo J, Gu W, Baylin SB (2005). Tumor suppressor HIC1 directly regulates SIRT1 to modulate p53-dependent DNA-damage responses. Cell 123: 437-48. Reynolds A, Leake D, Boese Q, Scaringe S, Marshall WS, Khvorova A (2004). Rational siRNA design for RNA interference. Nat Biotechnol 22: 326-30.
Vaziri H, Dessain SK, Ng Eaton E, Imai SI, Frye RA, Pandita TK et al (2001). hSIR2(SIRT1) functions as an NAD-dependent p53 deacetylase. Cell 107: 149-59. Ventura A, Meissner A, Dillon CP, McManus M, Sharp PA, Van Parijs L et al (2004). Cre-lox-regulated conditional RNA interference from transgenes. Proc Natl Acad Sci U S A 101: 10380-5. Wiederschain D, Wee S, Chen L, Loo A, Yang G, Huang A et al (2009). Single-vector inducible lentiviral RNAi system for oncology target validation. Cell Cycle 8: 498-504. Yang H, Yang T, Baur JA, Perez E, Matsui T, Carmona JJ et al (2007). Nutrient-Sensitive Mitochondrial NAD(+) Levels Dictate Cell Survival. Cell 130: 1095-107. Yuan H, Wang Z, Gao C, Chen W, Huang Q, Yee JK et al (2010). BCR-ABL gene expression is required for its mutations in a novel KCL-22 cell culture model for acquired resistance of chronic myelogenous leukemia. J Biol Chem 285: 5085-96.
Supplemental Figure Legend
Figure 1 Expression of NNMT in normal human tissues and cancer cell lines
(A) Expression of NNMT in cancer cell lines using normal human liver lysate as a control. KCL-22
lysate was loaded in both lanes 3 and 4. (B) Comparison of NNMT expression in additional normal
human tissues with cancer cell lines. NB, normal breast; NC, normal colon; NL, normal lung; NPM,
normal peripheral blood mononuclear cells.
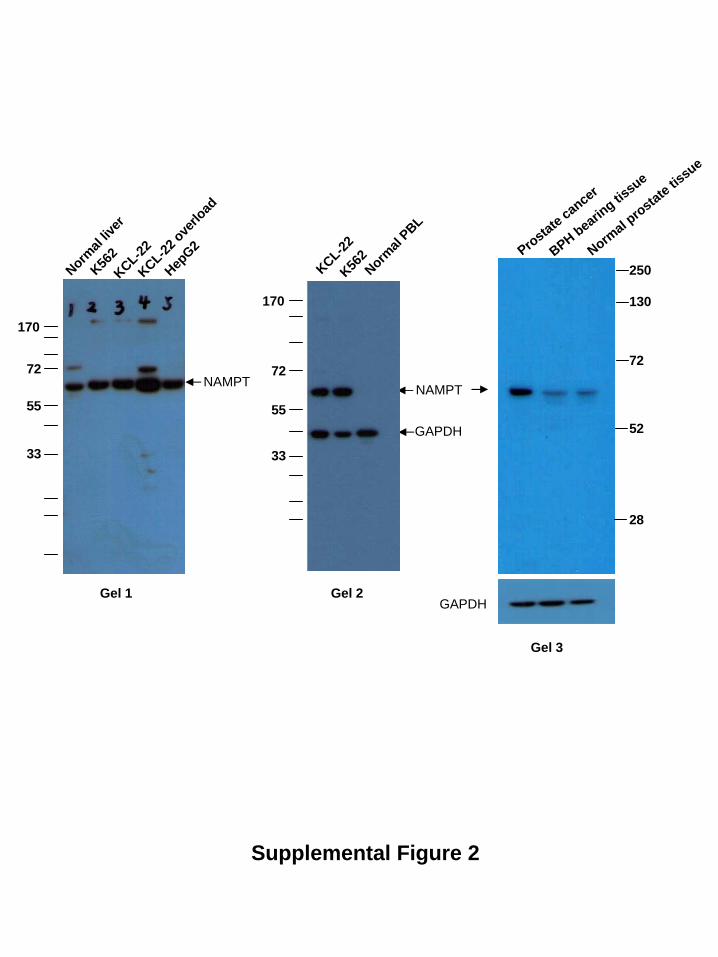
Figure 2 Validation of NAMPT antibody specificity
Whole gel images of Western blots using NAMPT antibody. Gel 1: normal human liver lysate (lane 1)
and hepatic cancer cell line HepG2 (lane 5) as positive controls, as compared to CML cell lines (K562
and KCL-22). Note that on lane 4, KCL-22 cell lysate was intentionally overloaded. Gel 2: analysis of
CML cell lines along with mononuclear cells from normal human peripheral blood was done by
simultaneous probing with NAMPT and GAPDH antibodies. Gel 3: analysis of normal prostate, BPH-
bearing prostate tissues and prostate carcinoma lysates. All these samples were obtained from the same
patient. Normal and BPH-bearing tissues were from the same benign tissue block. Although BPH sample
was collected from a BPH area, the purity of BPH sample was uncertain due to the use of biopsy needles
which might punch through the BPH gland and thus collect certain amount of normal tissue underneath.
Such procedure would undermine the detection of moderate change of gene expression in BPH-bearing
tissue. In all gels, however, NAMPT antibody predominantly detected the NAMPT protein.
Figure 3 NAMPT expression in normal and tumor tissues
(A) Normal human tissues with high levels of NAMPT expression. (B) Normal human tissues with low
levels of NAMPT expression, but increased in their corresponding tumors.
Figure 4 Effects of a second set of NAMPT shRNA
NAMPT was knocked down by a second set of shRNA in PC3 cells, which sensitized the cells to
hydrogen peroxide treatment. The assay was performed as described for Figure 5A.
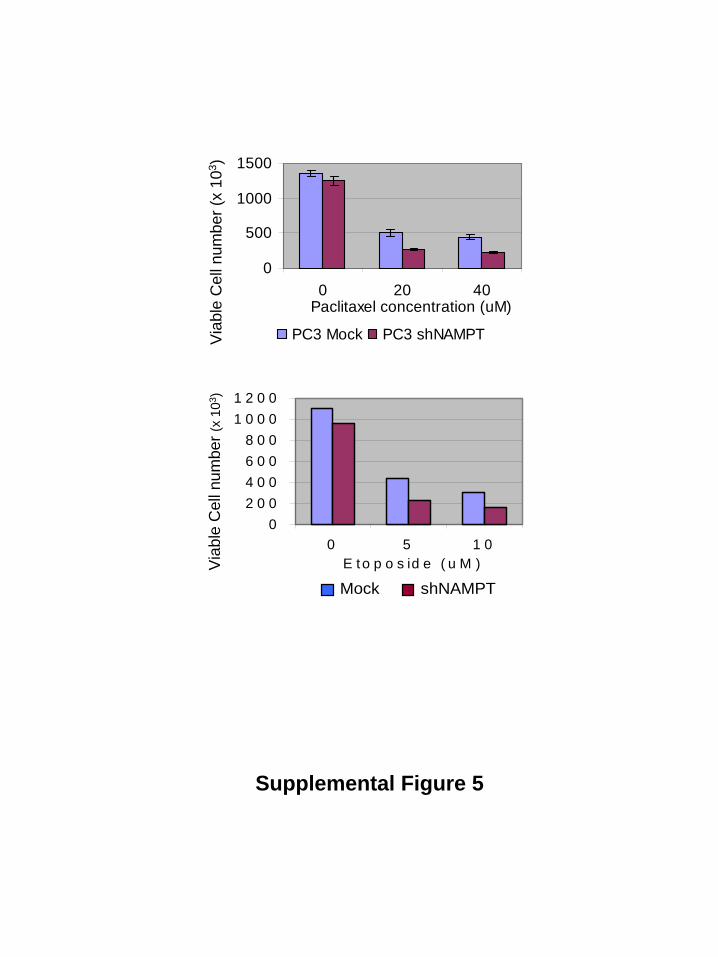
Figure 5 Effects of NAMPT knockdown on chemotherapeutic agents
Mock or NAMPT knockdown PC3 cells were treated with paclitaxel (A) or etoposide (B) for two days at
concentrations indicated. Viable cells were counted as described for Figure 5A.
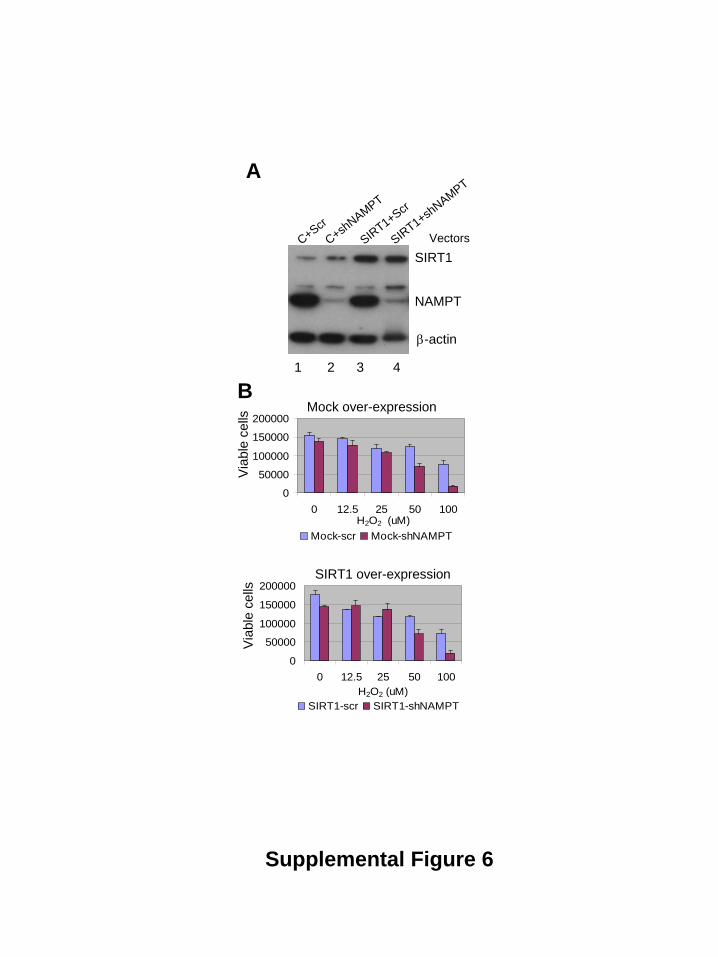
Figure 6 Effects of SIRT1 over-expression with NAMPT knockdown
(A) SIRT1 and NAMPT expression analysis in PC3 cells with different transduction combination. C+Scr:
empty expression vector(C) plus scrambled shRNA vector (Scr); C+shNAMPT: empty expression vector
plus shNAMPT vector; SIRT1+Scr: SIRT1 expression vector plus scrambled shRNA vector;
SIRT1+shNAMPT: SIRT1 expression vector plus shNAMPT vector. (B) Cell survival and proliferation
under treatment with hydrogen peroxide in mock (Top) or SIRT1 (Bottom) over-expressing cells with
scrambled and NAMPT shRNA knockdown. Viable cells were counted by trypan blue exclusion after
overnight H2O2 treatment. Limited protection by SIRT1 over-expression was seen with H2O2 lower than
25 μM.
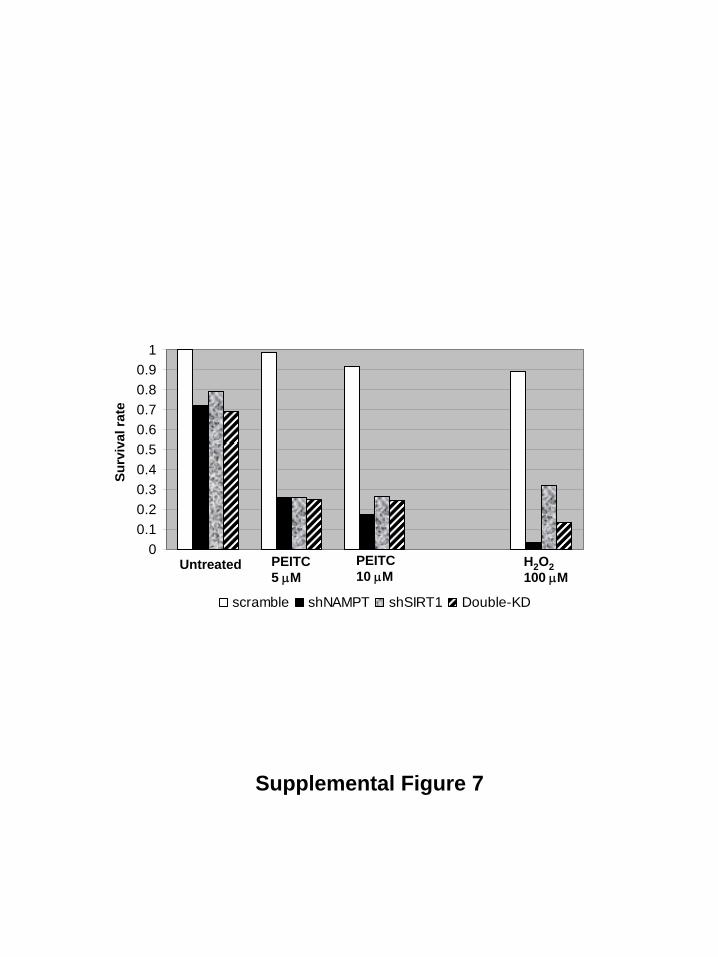
Figure 7 Effects of SIRT1 and NAMPT double knockdown
Individual and combined knockdown of SIRT1 and NAMPT in PC3 cells were treated with PEITC and
H2O2 as described in Figure 5. Double knockdown did not further increase cell death.
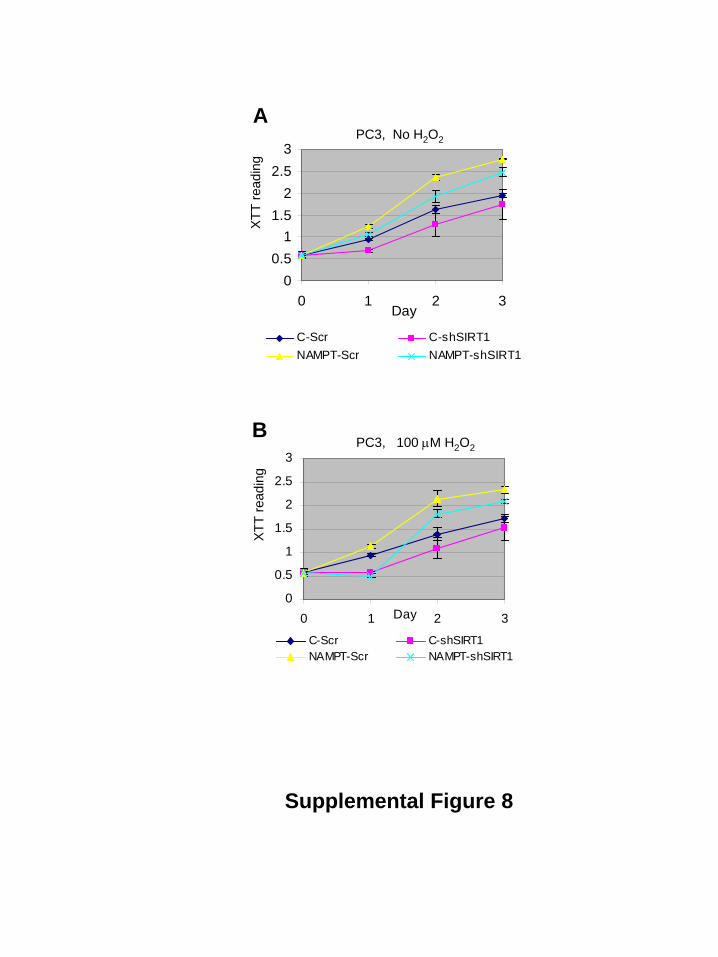
Figure 8 Effects of SIRT1 knockdown on NAMPT over-expressing PC3 cells
Proliferation of PC3 cells co-transduced with empty expression vector(C) plus scrambled shRNA vector
(C-Scr), empty expression vector plus shSIRT1 (C-shSIRT1), NAMPT over-expression vector(NAMPT)

plus scrambled shRNA vector (NAMPT-Scr), or NAMPT over-expression vector plus shSIRT1
(NAMPT-shSIRT1). Cells were analyzed in the absence (A) or presence (B) of 100 μM hydrogen
peroxide.
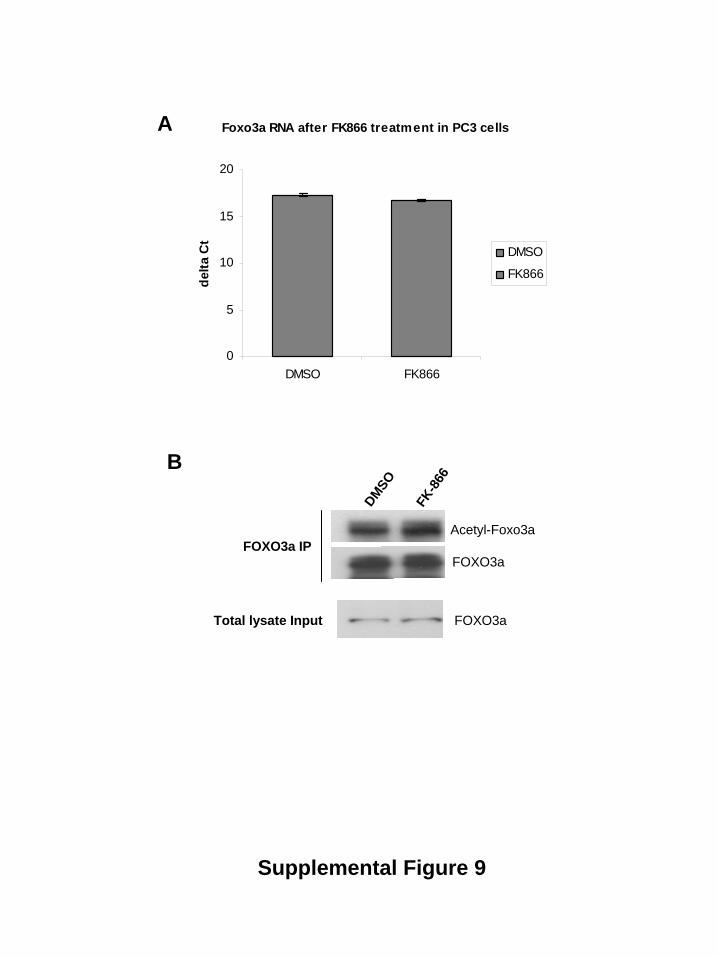
Figure 9 Analysis of FOXO3a RNA and protein acetylation after FK866 treatment in PC3 cells.
(A) FOXO3a RNA analyzed by reverse transcription and real time PCR. Experiment was performed as
described for Figure 8A. (B) FOXO3a protein acetylation. Cells were harvested 24 h after FK866
treatment to avoid substantial FOXO3a degradation. FOXO3a was immunoprecipitated using FOXO3a
antibody. Western blot was probed with anti-acetyl lysine antibody. After stripping, the membrane was
re-probed with FOXO3a antibody.
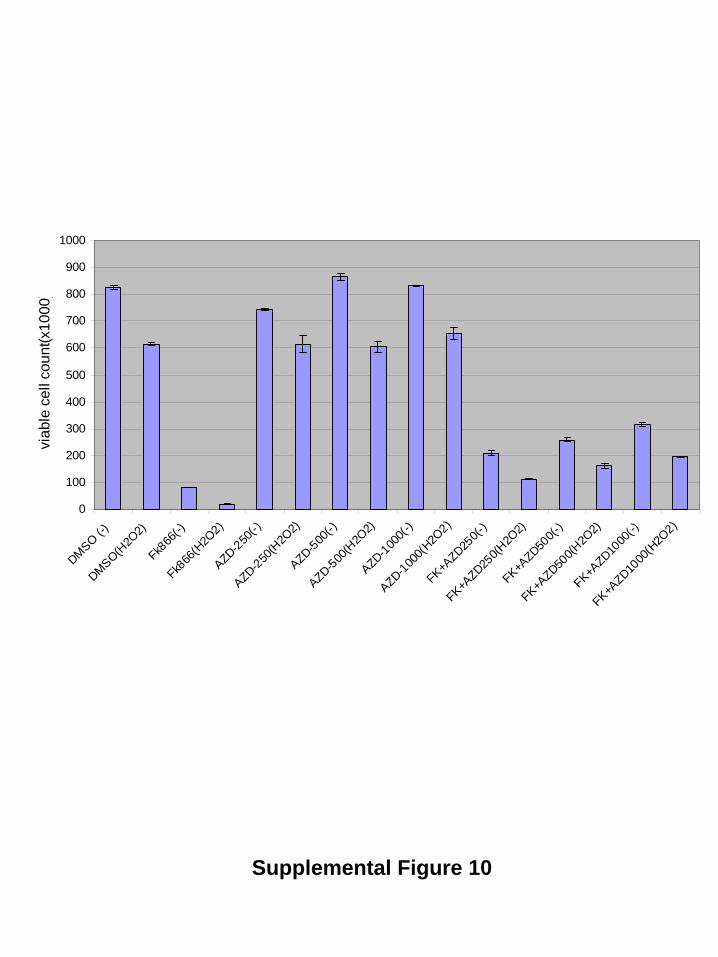
Figure 10 Effects of AZD2281 on FK866 treatment
PC3 cells were treated with AZD2281 at concentrations 250-1000 nM alone or in combination with 20
nM FK866, with or without 200 μM H2O2 for 24 hours.

Normal liv
er
K562KCL-22
KCL-22
HepG2HCT-116
MCF-7
NNMT
GAPDH
A
B
NNMT
GAPDH
K562KCL-22
NPMNB MCF-7
MDA-MB-231
NC HCT-116
CaCO2
NL NC 209
H 460
Supplemental Figure 1
Supplemental Figure 2
Gel 1 Gel 2
Normal p
rostate tissue
Prostate cancer
Gel 3
250
130
72
52
28
GAPDH
NAMPT
GAPDH
KCL-22Norm
al PBL
K562
170
72
55
33
NAMPT
Normal
liver
HepG2
170
72
55
33
KCL-22
K562
KCL-22 ove
rload
BPH bearing tis
sue

Colon Colon Carcinoma
Lymph Node Lymphoma
Lung Lung Adenocarcinoma
Adrenal gland Liver
Pancreas Muscle
A
B
Grey matter Glioblastoma
Supplemental Figure 3

0500
100015002000
0 200H2O2 concentrations (uM)PC3 mock PC3 shNAMPT No.II
Viab
le C
ell n
umbe
r (x
103 )
Supplemental Figure 4
Viab
le C
ell n
umbe
r (x
103 )
0
500
1000
1500
0 20 40Paclitaxel concentration (uM)
PC3 Mock PC3 shNAMPT
02 0 04 0 06 0 08 0 0
1 0 0 01 2 0 0
0 5 1 0E to p o s id e ( u M )
M o c k s h P B E F
Viab
le C
ell n
umbe
r (x
103 )
shNAMPTMock
Supplemental Figure 5
0
50000
100000
150000
200000
0 12.5 25 50 100H2O2 (uM)
SIRT1-scr SIRT1-shNAMPT
0
50000
100000
150000
200000
0 12.5 25 50 100H2O2 (uM)
Mock-scr Mock-shNAMPT
B
A
C+ScrC+shNAMPT
SIRT1+Scr
SIRT1+shNAMPT
NAMPT
SIRT1
β-actin
Vectors
1 2 3 4
Mock over-expression
SIRT1 over-expression
Via
ble
cells
Via
ble
cells
Supplemental Figure 6
Surv
ival
rate
00.10.20.30.40.50.60.70.80.9
1
scramble shNAMPT shSIRT1 Double-KD
Untreated PEITC5 μM
PEITC10 μM
H2 O2100 μM
Supplemental Figure 7
0
0.5
1
1.5
2
2.5
3
0 1 2 3Day
C-Scr C-shSIRT1NAMPT-Scr NAMPT-shSIRT1
00.5
11.5
22.5
3
0 1 2 3Day
C-Scr C-shSIRT1NAMPT-Scr NAMPT-shSIRT1
PC3, No H2 O2
PC3, 100 μM H2 O2B
A
XTT
read
ing
XTT
read
ing
Supplemental Figure 8
Foxo3a RNA after FK866 treatment in PC3 cells
0
5
10
15
20
DMSO FK866
delta
Ct
DMSO
FK866
Supplemental Figure 9
Acetyl-Foxo3a
DMSO
FK-8
66
FOXO3a
Total lysate Input
FOXO3a IP
FOXO3a
A
B
0
100
200
300
400
500
600
700
800
900
1000
DMSO (-)
DMSO(H2O
2)
Fk866
(-)
Fk866
(H2O
2)
AZD-250(-)
AZD-250(H
2O2)
AZD-500(-)
AZD-500(H
2O2)
AZD-1000(-
)
AZD-1000(H
2O2)
FK+AZD25
0(-)
FK+AZD25
0(H2O
2)
FK+AZD50
0(-)
FK+AZD50
0(H2O
2)
FK+AZD10
00(-)
FK+AZD10
00(H
2O2)
viab
le c
ell c
ount
(x10
00)
Supplemental Figure 10