
Pharmocologic Treatment With Histone Deacetylase 6 Inhibitor

Supplemental Information for
Acetylation site specificities of lysine deacetylase inhibitors in human
cells
Christian Schölz, Brian T. Weinert, Sebastian A. Wagner, Petra Beli, Miyake Yasuyuki, Jun Qi,
Lars J. Jensen, Werner Streicher, Anna R. McCarthy, Nicholas J. Westwood, Sonia Lain, Jürgen
Cox, Patrick Matthias, Matthias Mann, James E. Bradner, Chunaram Choudhary
This file includes:
- Supplemental Figures 1-14
- Supplemental Table 1
- Supplemental Notes 1-2
Nature Biotechnology: doi:10.1038/nbt.3130
a
b
Supplemental Figure 1
NO2NH2
Br
SB(OH)2
NO2NHBoc
Br
NO2NHBoc
S
NaH, (Boc)2O
DMF, 0 °C60 %
NH2NHBoc
S
NH
O
HCTU, DIPEA,DMF, 23 °C
64%
NHNHBoc
S
O
NH
OOH
O
NHNH2
S
O
NH
O4M HCl,
dioxane/THF
23 °C95%
SI-1 SI-2 SI-3
SI-4 SI-5 JQ12
Pd(PPh3)4, Na2CO3DME/H2O, 120 °C
80 %
10% Pd/C, H2
EtOAc, 23 °C94%
Log[conc(M)]-10 -8 -6 -4
0
50
100
150HDAC1HDAC2HDAC3HDAC4HDAC5HDAC6HDAC7
HDAC8HDAC9
Nor
mal
ized
Act
ivity
c
HDAC1 HDAC2 HDAC3 HDAC4 HDAC5 HDAC6 HDAC7 HDAC8 HDAC99.20 77.2 1856 >4000 >4000 >4000 >4000 >4000 >4000
JQ12 IC50 (nM)
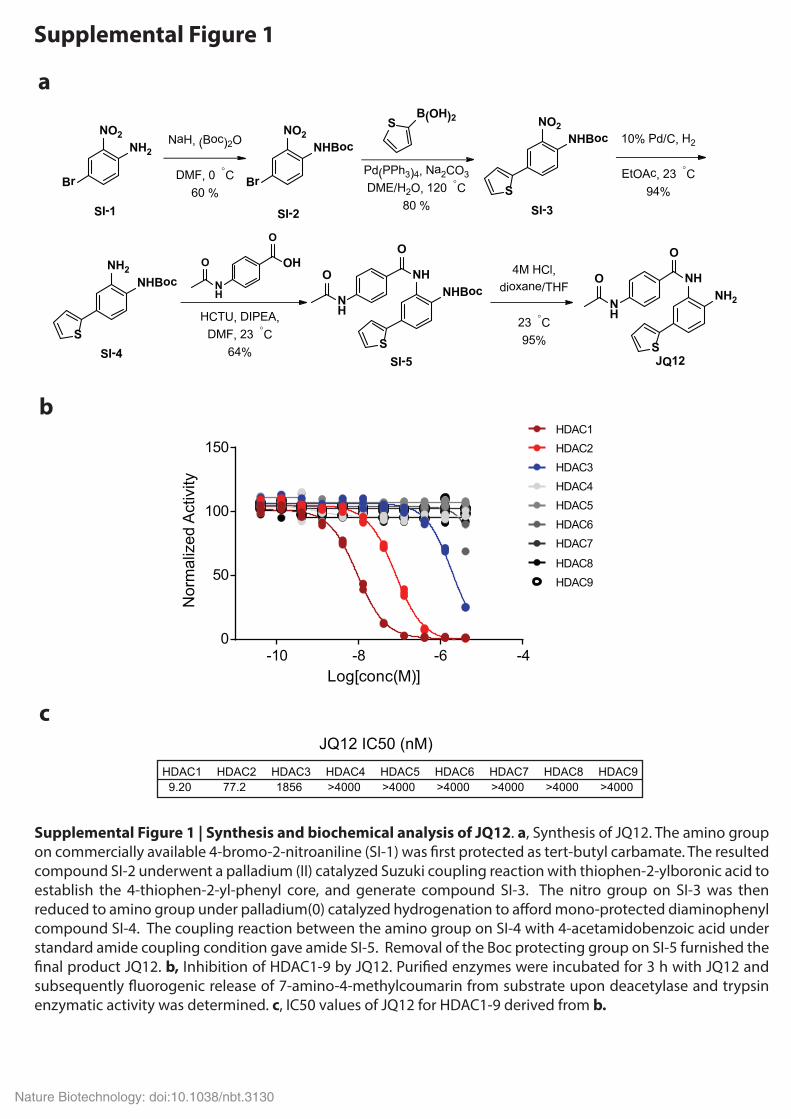
Supplemental Figure 1 | Synthesis and biochemical analysis of JQ12. a, Synthesis of JQ12. The amino group on commercially available 4-bromo-2-nitroaniline (SI-1) was �rst protected as tert-butyl carbamate. The resulted compound SI-2 underwent a palladium (II) catalyzed Suzuki coupling reaction with thiophen-2-ylboronic acid to establish the 4-thiophen-2-yl-phenyl core, and generate compound SI-3. The nitro group on SI-3 was then reduced to amino group under palladium(0) catalyzed hydrogenation to a�ord mono-protected diaminophenyl compound SI-4. The coupling reaction between the amino group on SI-4 with 4-acetamidobenzoic acid under standard amide coupling condition gave amide SI-5. Removal of the Boc protecting group on SI-5 furnished the �nal product JQ12. b, Inhibition of HDAC1-9 by JQ12. Puri�ed enzymes were incubated for 3 h with JQ12 and subsequently �uorogenic release of 7-amino-4-methylcoumarin from substrate upon deacetylase and trypsin enzymatic activity was determined. c, IC50 values of JQ12 for HDAC1-9 derived from b.
Nature Biotechnology: doi:10.1038/nbt.3130

Supplemental Figure S2
-4 -2 0 2 4
-4-2
02
4
Apicidin n = 1090 R = 0.57
-4 -2 0 2 4-4
-20
24
Bufexamac (1 mM) n = 2483 R = 0.85
-4 -2 0 2 4
-4-2
02
4
Bufexamac (50 µM) n = 2659 R = 0.84
-4 -2 0 2 4
-4-2
02
4
CI.994 n = 1080 R = 0.69
-4 -2 0 2 4
-4-2
02
4
JQ12 n = 1185 R = 0.52
-4 -2 0 2 4
-4-2
02
4
LBH589 n = 2020 R = 0.77
-4 -2 0 2 4
-4-2
02
4
MGCD0103 n = 905 R = 0.57
-4 -2 0 2 4-4
-20
24
MS275 n = 1420 R = 0.68
-4 -2 0 2 4
-4-2
02
4
NaB n = 1107 R = 0.74
-4 -2 0 2 4
-4-2
02
4
Nicotinamide n = 2162 R = 0.79
-4 -2 0 2 4
-4-2
02
4
Pandacostat n = 1045 R = 0.75
-4 -2 0 2 4
-4-2
02
4
PCI24781 n = 1900 R = 0.9
-4 -2 0 2 4
-4-2
02
4
PCI34051 n = 1658 R = 0.44
-4 -2 0 2 4-4
-20
24
PXD101 n = 1127 R = 0.68
-4 -2 0 2 4
-4-2
02
4
SAHA n = 1135 R = 0.55
-4 -2 0 2 4
-4-2
02
4
Sirtinol n = 1040 R = 0.9
-4 -2 0 2 4
-4-2
02
4
Tenovin-6 n = 966 R = 0.92
-4 -2 0 2 4
-4-2
02
4
TSA n = 718 R = 0.65
-4 -2 0 2 4
-4-2
02
4
Tubacin n = 1445 R = 0.76
-4 -2 0 2 4-4
-20
24
VPA n = 1618 R = 0.57
Log2 (SILAC Ratio KDACI/Ctrl. Experiment 2)
Log 2 (S
ILA
C R
atio
KD
AC
I/Ctrl
. Exp
erim
ent 1
)
Supplemental Figure 2 | Correlation between acetylation changes quanti�ed in KDACI experiments. The plots show the correlation between acetylation site changes in two independent biological replicate experiments for each KDAC inhibitor.
Nature Biotechnology: doi:10.1038/nbt.3130

5810
This study
Supplemental Figure S3
Weinert et al. (2013)
2298 588
Supplemental Figure 3 | Overlap of identi�ed acetylation sites with previously published acetylation sites from HeLa cells. The Venn diagram shows the overlap of identi�ed acetylation sites from this study with acetyla-tion sites identi�ed from a previous study in HeLa cells23.
Nature Biotechnology: doi:10.1038/nbt.3130

Acetyllysine
SMC3
HDAC8
0 1.0 2.5 5.0 10 25ø
PCI34501 (μM)
Supplemental Figure 4
51
191
191kDa
a bFo
ld in
crea
se in
ace
tyla
tion
(KD
AC
I/Con
trol)
Apicidi
n
Bufexa
mac
CI-994
JQ12
LBH58
9
MGCD0103
MS275
NaBNAM
Panda
costa
t
PCI2478
1
PCI3405
1
PXD101SAHA
Sirtino
l
Tenov
in6 TSA
Tubac
inVPA
0
2
4
6
8K106acK105ac/K106ac
Supplemental Figure 4 | HDAC8 inhibitor PCI34051 increases SMC3 acetylation. a, The bar plot shows SILAC ratios of acetylated SMC3 peptides from cells treated with di�erent KDACIs for 16 hours. Ratios represent median ± SD of all detected peptides representing either acetylated SMC3 at position K106 or double-acetylated SMC3 at K105 and K106. b, Treatment of HeLa cells with PCI34501 causes dose-dependent increase in SMC3 acetylation. SMC3 was immunoprecipitated and subsequently acety-lation of SMC3 was visualized by immunoblotting with a pan-anti-acetyllysine antibody. Immuno-blots shown are representative of two independent experiments. IP antibody: anti-SMC3; Immunoblot anti-body: anti-acetyllysine. ø: control, using anti-c-myc antibody for IP. WCL: whole cell lysate.
IP:SMC3
WCL
Nature Biotechnology: doi:10.1038/nbt.3130
Supplemental Figure 5
−4 −2 4
−4
−2
0
2
4
0 2
Log 2S
ILA
C R
atio
NA
M 7
2h/1
6h E
xp.2
Log2SILAC RatioNAM 72h/16h Exp.1
n=1063,R=0.79
0 20 40 60 80transcriptionRNA splicing
RNA metabolic processchromosome organization
chromatinspliceosomechromosome
nucleus
percent of proteinsassociated with GO term
Proteins with upregulated acetylation
p=2.1e-13
p=4.7e-12
p=1.1e-11
p=9.2e-10
p=4.3e-40
p=8.9e-11
p=1.4e-08
p=1.3e-06GO
CC
GO
BP
a b c
16h/
cont
rol0
20
40
60
80
100
AcK
site
s (%
)
72h/
cont
rol
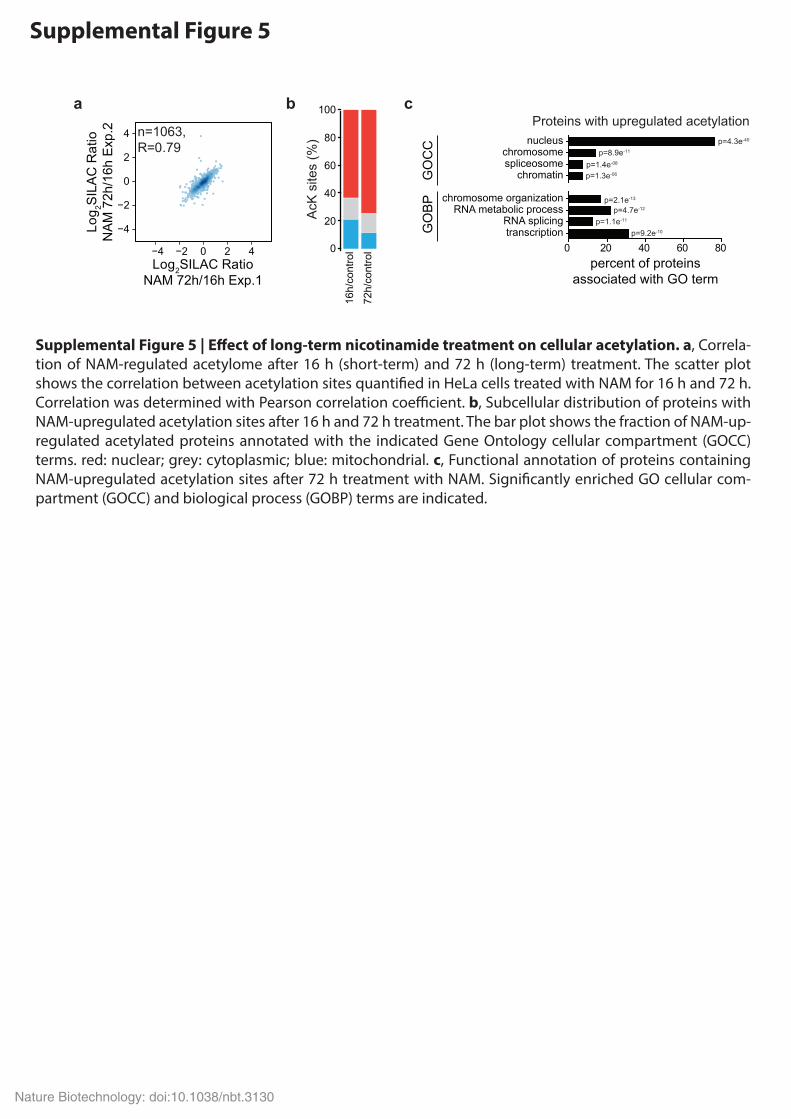
Supplemental Figure 5 | E�ect of long-term nicotinamide treatment on cellular acetylation. a, Correla-tion of NAM-regulated acetylome after 16 h (short-term) and 72 h (long-term) treatment. The scatter plot shows the correlation between acetylation sites quanti�ed in HeLa cells treated with NAM for 16 h and 72 h. Correlation was determined with Pearson correlation coe�cient. b, Subcellular distribution of proteins with NAM-upregulated acetylation sites after 16 h and 72 h treatment. The bar plot shows the fraction of NAM-up-regulated acetylated proteins annotated with the indicated Gene Ontology cellular compartment (GOCC) terms. red: nuclear; grey: cytoplasmic; blue: mitochondrial. c, Functional annotation of proteins containing NAM-upregulated acetylation sites after 72 h treatment with NAM. Signi�cantly enriched GO cellular com-partment (GOCC) and biological process (GOBP) terms are indicated.
Nature Biotechnology: doi:10.1038/nbt.3130

Supplemental Figure 6
LIG1
HMGB2
RANBP9
KAT5
POLD3
RAD23A
CLSPN
CASP3
PDCD5
DPY30
CASC5
SMARCC1
POU2F1 BRD1
ARID1B
SMARCA2
MN1
HNRNPC
SF3A1
FUS
SURF6
HMGA1
NPM1NR3C1
SUCLG2
MLL3
MLL2
H3F3B
SRSF3
EFTUD2
CENPV
CREBBP
HMGB1
CBX5
CBX3 TRIM33
HCFC1
NUP50
BAZ1B
EP300
TMPOHNRNPD
HNRNPF
ACIN1AKAP8L
PTBP1
ILF3
EP400
SETMYST1 MCRS1
ATF6DDX17
TRIM28RNF2
CCDC101
STAT1
MBIPENO1
ING4CHD9
YEATS2
WHSC2
SUB1
CTDP1
MYST2
C20orf20
BRD4
NCOA3
ETS1
NCOA2
COBRA1
SATB1TSPYL1
SP1
JUNBHMGB3
TAF3
AFF4
PSMC3
GTF3C3
WAC
PDLIM1
BRF1
EDF1
CRTC2
SP3
ZYX
PES1
DCAF13
HINT1
EEF1B2
EIF3H
RPL19
NOP58
RPS17
NHP2
TARS
S100A11
ALDH7A1
ALDH18A1
ST13
HSP90AA1
CAD
AHSA1
SUMO3
NUMA1
TPX2
CENPF
ORC6L
MAD2L1
MCM4
HIRA
KIF4A DYNC1LI1 SENP1
NSUN2
DUT
SSBP1
AK4
PPP1CB
NEDD8
CKS1B
PNPT1 NUDC
MRPL12
EBNA1BP2
RPS16
NCL
MKI67
DKC1
FBL
MYST3
MYST4
ING3
ANXA2
RPL38
TUFM
RAB8A RPL14BRD8
NOP14
SNCA
XRCC6
XRCC5
WRN
HYRC
NBNRAD50
RANBP2
BIN1
PARP1
EIF4HRSL24D1
IARSUBAP2L
NUP98
HCLS1
CDC37
UBE2M
FNBP4
SFRS18
SRSF2IP
DDX42
SRRM2
RBM17
PARN
ACTN4VIM
NONO
NCBP2U2AF2
SF3B1SNRPC
PRPF4B
RBM39
EZR
CFL1
PLEC
CALD1
KRT18
SFPQ
SPTAN1
ACTN1
FOSL2
PRPF4HNRNPA0
HNRNPA1CDK11A
SF1DDX5
CRTC1BCOR
NOL7
SSRP1CCNT1
SLC25A5
PDHX
COX4I1HIST1H1E
BAZ2A
RBBP7
SEC23IPTRIM25
LMNA
HNRNPU
Log2 SILAC Ratio (H/L)
1 5
Number of upregulated acetylation sites
1
2-3
4-5
6+
`Transcription´
`Acetylation´`Translation´
`Cell Cycle´
`DNADamage´
`ChromatinModification´
`Splicing´
`Cyto-skeleton´
PCBP1
HNRNPA2B1
SF3B2
DHX9
RBM10MATR3
PSIP1
SNW1
DHX38
KHSRP
DDX46
HNRNPM
ATF4
MAML1
GTF2H1TCERG1
TCEA1RUNX1
MEF2A
ETS2
INTS1
a
KPNB1
Light(R0, K0)
“Control”
Medium(R6, K4)“KDACi”
Heavy(R10, K8)
“KDAC KO”
In-solution protein digest
SCX chromatography LC-MS/MS analysis
Acetyl-lysine IP
Cell lysisMix proteins 1:1:1
b c
SIRT1
Tubulin
MEF wt
KOkDa
97
51
Sirt6 (123bp)
Gapdh (72bp)
d
−5
0
5
−5 0 5 −5 0 5
Log 2S
ILA
C R
atio
Sirt
6 -/- /
WT
Exp
.2
Log2SILAC RatioSirt6 -/- / WT Exp.1
−5
0
5
Log 2S
ILA
C R
atio
Sirt
6 -/- /
WT
Log2SILAC RatioNAM / Ctrl.
n=729,R=0.72
n=1931,R=0.10
Sirt2 (143bp)
Gapdh (72bp)
Supplemental Figure 6 | Nicotinamide causes hyperacetylation of nuclear proteins. a, Functional interac-tion networks of proteins with NAM-upregulated acetylation sites (after 16 h of NAM treatment). Network analy-sis was performed using protein interaction information from the STRING database and networks were visualized using Cytoscape. The color code re�ects the highest SILAC ratio of hyperacetylated sites on each protein and the color of circle boundaries indicates the number of upregulated sites for each protein. Clusters of functionally related proteins are highlighted. b, Schematic representation of triple SILAC experiments. Wildtype (WT) MEFs labeled with “light” SILAC were treated with vehicle control, MEF WT cells labeled with “medium” SILAC were treated for 16 h with KDAC inhibitors, and knockout (KO) cells were labeled with “heavy” SILAC and were treated with vehicle control. Subsequently, proteins were extracted and proteolysed using Lys-C and trypsin. Acetylated peptides were enriched with anti-acetyllysine antibodies and samples were analyzed by mass spectrometry. c, Veri�cation of Sirt1, Sirt2 and Sirt6 deletion in KO cells. Deletion of Sirt1, Sirt2 and Sirt6 in KO cells was con�rmed via immuno-blotting (SIRT1) or QPCR (Sirt2 and Sirt6). d, Correlation of acetylation site changes identi�ed in Sirt6-/- cells. The scatter plots show the correlation between acetylation changes observed in biological replicate experiments in Sirt6-/- cells, and NAM-treated MEF cells and Sirt6-/- cells, respectively. Correlation was determined with Pearson correlation coe�cient.Nature Biotechnology: doi:10.1038/nbt.3130

Supplemental Figure 7
−4 −2 4
−4
−2
0
2
4
0 2
Log 2
SIL
AC
Rat
ioN
icot
inam
ide/
cont
rol
Log2SILAC RatioEX-527/control
n=1574,R=0.68
Supplemental Figure 7 | NAM and EX-527 increase acetylation of shared targets. The scatter plot shows the correlation between acetylation sites quanti�ed in NAM- and EX 527-treated HeLa cells. Correlation was deter-mined with Pearson correlation coe�cient.
Nature Biotechnology: doi:10.1038/nbt.3130

Supplemental Figure 8
−4 −2 4
−4
−2
0
2
4
0 2
Log 2S
ILA
C R
atio
Sirt
inol
/ C
trl. E
xp.2
Log2SILAC RatioSirtinol / Ctrl.Exp.1
n=752,R=0.37
−4
−2
0
2
4
Log 2S
ILA
C R
atio
AG
K2
/ Ctrl
. Exp
.2
−4 −2 40 2Log2SILAC Ratio
AGK2 / Ctrl. Exp.1
n=774,R=0.46
−4
−2
0
2
4
Log 2S
ILA
C R
atio
Sirt
2 -/- /
wt E
xp.2
−4 −2 40 2Log2SILAC RatioSirt2 -/- / WT Exp.1
n=751,R=0.71
−4 −2 4
−4
−2
0
2
4
0 2
Log 2S
ILA
C R
atio
Sirt
2 -/- /
WT
Log2SILAC RatioNAM / Ctrl.
n=1195,R=0.15
−4 −2 4
−4
−2
0
2
4
0 2
Log 2S
ILA
C R
atio
Sirt
2 -/- /
WT
Log2SILAC RatioSirtinol / Ctrl.
n=1577,R=0.11
−4 −2 4
−4
−2
0
2
4
0 2
Log 2S
ILA
C R
atio
Sirt
2 -/- /
WT
Log2SILAC RatioAGK2 / Ctrl.
n=1733,R=0.35
Supplemental Figure 8 | Correlation of acetylation site changes regulated by SIRT2 and sirtu-in inhibitors. The scatter plots show the correlation between acetylation site SILAC ratios from di�erent biological experiments for Sirt2-/- vs. WT MEFs; MEFs treated with sirtinol, AGK2 or NAM vs. control treated MEFs; as well as correlation between inhibitor-regulated and SIRT2-regulated sites. Correlation was determined with Pearson correlation coe�cient.
Nature Biotechnology: doi:10.1038/nbt.3130

Supplemental Figure 9
a b
HADHAECHS1
CoA
EHHADH
EHHADH HADHA
ACAA1
HADHB
ACAA2
CPT1A
CPT1B
CPT1C
CPT2
ACSL1
ACSL5
ACSL3
ACSL6
ACSL4
ACADMACOX3ACOX1
ACADL ACADVL
L-Palmitoyl-carnitine
Hexadecanoate(Fatty acid)
Hexa-decanoyl-CoA
trans-Hexadec-2-enoyl-CoA
(S)-3-Hydroxy-hexadecanoyl-CoA
3-Oxo-hexa-decanoyl-CoA
Acetyl-CoATetra-decanoyl-CoA
HADH
c d
-4 -2 0 2 4
0.0
0.5
1.0
1.5
Log2(SILAC Ratio Tenovin-6/Ctrl.)
Den
sity
nonmitochondrial
mitochondrial
P = 5.1e-153
Oxaloacetate
CSMDH1
MDH2
FH
SDHA
DLST
SUCLG1 OGDH
ThPP
Lipoamide-EDihydro-lipoamide-E
DLD
Citrate cis-Aconitate Isocitrate
Oxalosuccinate
IDH1
IDH2
IDH1
IDH2
2-Oxoglutarate
Phosphoenol-pyruvate
Acetyl-CoAPyruvate
S-Acetyldihydro-lipoamide-E
TCA cycle
ACLY
ACO1
ACO2
ACO1
ACO2
IDH3A
IDH3B
IDH3G
(S)-Malate
Fumarate
SuccinateSuccinyl-CoA
SUCLG2
SDHB
SDHC SDHD
OGDHL
OGDH
OGDHL
S-Succinyl-dihydrolipoamide
3-Carboxy-1-hydroxypropyl-ThPP
PCK1
PCK2Lipoamide-EDihydro-
lipoamide-E
DLD
DLAT
ThPP
PDHA1
PDHA2
PDHB
PDHA1
PDHA2
PDHB
PDHXPDHX
SUCLA2
Fraction of proteins involved (%)
Fraction of proteins involved (%)
membrane
cytoplasmic part
mitochondrion
mitochondrial nucleoid
mitochondrial membrane
mitochondrial matrix
mitochondrial part
5.4e−04
6.9e−05
1.3e−13
5.2e−16
4.5e−18
1.7e−26
1.3e−41
All identifiedUpregulated
0 20 40 60 80
fatty acid beta−oxidation
nucleoside triphosphate biosynth. process
amine catabolic process
tricarboxylic acid cycle
oxidation−reduction process
respiratory electron transport chain
cellular ketone metabolic process
4.6e−06
2.5e−06
6.8e−07
1.3e−08
2.1e−10
1.8e−11
1.3e−11
0 10 20 30 40
All identifiedUpregulated
GO
BP
term
sG
OC
C te
rms
Supplemental Figure 9 | Tenovin-6 selectively increases acetylation of mitochondrial proteins. a, The plot shows the distribution of SILAC ratios of acetylation sites on mitochondrial and non-mitochondrial proteins in tenovin-6 treated HeLa cells. Acetylation of mitochondrial proteins was selectively increased in tenovin-6 treated cells. b, The bar charts show enrichment of Gene Ontology cellular compartment (CC) or GO biological process (BP) terms among proteins with tenovin-6 upregulated acetylation sites. c and d Schematic overview of the TCA cycle and fatty-acid elongation pathways, respectively. Proteins that showed increased acetylation (>2-fold) in tenovin-6 treated HeLa cells are shown in red.
Nature Biotechnology: doi:10.1038/nbt.3130
Supplemental Figure 10
HIF1-α
T T
y₁₇
V P E E
y₁₃
E
y₁₂
L
y₁₁
N
y₁₀
P
y₉
acK
y₈
I
y₇
L
y₆
A
y₅
L
y₄
Q
y₃
N
y₂
A
y₁
Q R
b₂ b₃ b₇ b₈ b₉ b₁₀ b₁₁ b₁₂ b₁₄²⁺
y₁
b₂
b₃
y₂y₃
y₄
y₅y₆
b₇b₁₄²⁺
y₇
b₈
y₈
b₉
y₉
b₁₀y₁₀
b₁₁
y₁₁
b₁₂
y₁₂
y₁₃ y₁₇
02
4Intensity [10e6]
200 400 600 800 1000 1200 1400 1600 1800 2000m/z
050
100
Rel
ativ
e A
bund
ance
a
b
n = 3430R= 0.76
Log 2 S
ILA
C R
atio
Buf
exam
ac (1
mM
) / C
trl.
Log2 SILAC RatioBufexamac (50µM) / Ctrl.
−5
−5
0
5
0 5
MAP1LC3B
/B2
PBXIP1
IGFBP7
F11R
SERPINI1
COL12A
1
COL4A2
PLOD2
FAM162A
RIOK3
P4HA2
PPL
GFPT2
STAU1
COL3A1
TK1ENO2
ALDOC
P4HA1
COL5A1
HK2
ABHD4
NDRG10
2
4
6
8
10
Bufexamac (1
Bufexamac (50µM)
Fold
upr
egul
atio
n (B
ufex
amac
/Con
trol) mM)
c
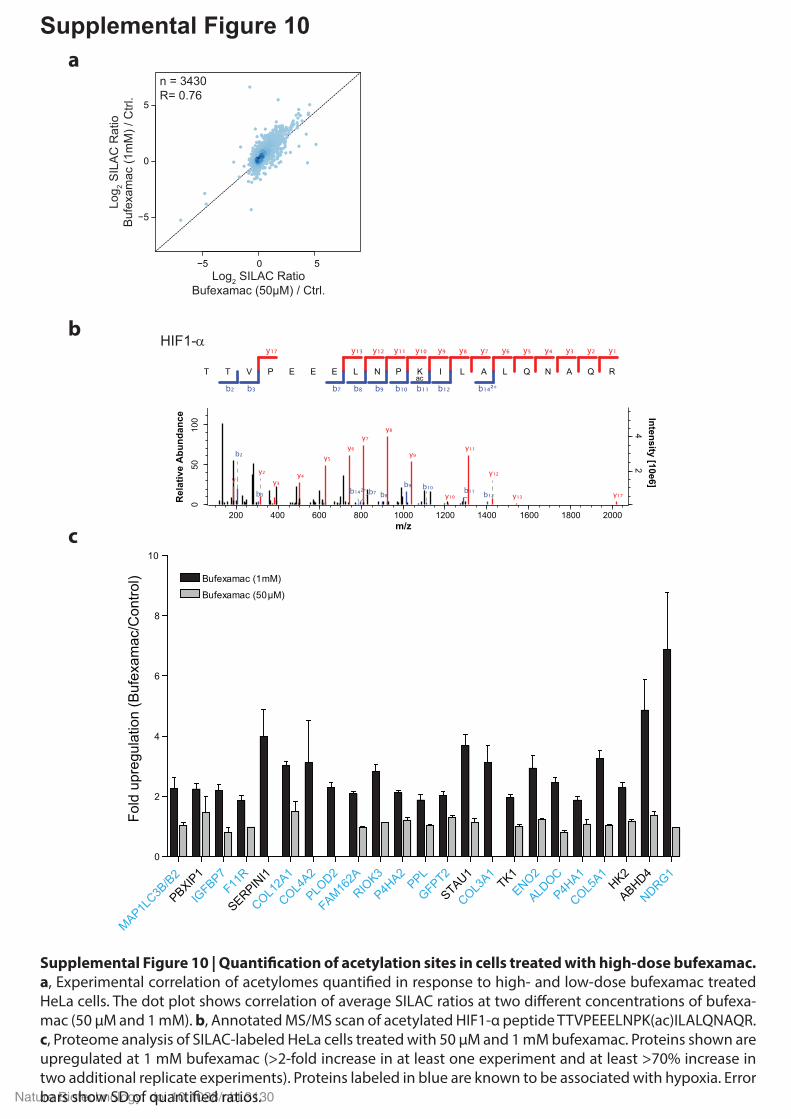
Supplemental Figure 10 | Quanti�cation of acetylation sites in cells treated with high-dose bufexamac. a, Experimental correlation of acetylomes quanti�ed in response to high- and low-dose bufexamac treated HeLa cells. The dot plot shows correlation of average SILAC ratios at two di�erent concentrations of bufexa-mac (50 µM and 1 mM). b, Annotated MS/MS scan of acetylated HIF1-α peptide TTVPEEELNPK(ac)ILALQNAQR. c, Proteome analysis of SILAC-labeled HeLa cells treated with 50 µM and 1 mM bufexamac. Proteins shown are upregulated at 1 mM bufexamac (>2-fold increase in at least one experiment and at least >70% increase in two additional replicate experiments). Proteins labeled in blue are known to be associated with hypoxia. Error bars show SD of quanti�ed ratios.Nature Biotechnology: doi:10.1038/nbt.3130

Supplemental Figure 11
FeCl3 (µM)
Cel
l Dea
th (%
)
0 25 50 100 150 200 2500
10
20
30Bufexamac (250 µM)Dfx (200 µM)
Supplemental Figure 11 | Iron supplementation prevents bufexamac-induced cell death in HL60 cells. The bar chart shows percentage of cell death in HL60 cells treated with bufexamac or DFX. Iron supplementation reduced cell death to background level. Cell viability was determined by propidium iodide (PI) staining of cells and subsequent analysis of PI �uorescence. Error bars represent SD of three independent experiments.
Nature Biotechnology: doi:10.1038/nbt.3130

Supplemental Figure 12
Wavelength (nm)
OD
300 400 500 600 7000.0
0.1
0.2
0.3
0.4
0 230µM
Bufexamac (µM)
OD 4
90
0 50 100 150 200 2500.00
0.05
0.10
0.15
0.20
0.25
ba
Kd: ~130 µM
Supplemental Figure 12 | Bufexamac is an iron chelator. a, UV/VIS spectroscopy of bufexamac titrated into FeCl3 solution. b, The �gure shows the derived iron binding curve measured at 490 nm in a. Data analy-sis resulted a KD of 136 ± 11 µM. All measurements were performed using methanol as solvent due to very low solubility of bufexamac in aqueous solutions. Therefore, these KD values may di�er in aqueous solu-tions.
Nature Biotechnology: doi:10.1038/nbt.3130

ONH
OOH
HDAC6
TAT
acetylated microtubule
non-acetylated microtubule
Bufexamac
high-doselow-dose
Fe
ONH
OOHFe complexing iron
Proteasomaldegradation
HIF1-αHIF1-α
VHL
HIF1-αARNT
HIF1-αARNT
transcription of HIF1-α target genes
VEGF
a
b
c
d
e
Supplemental Figure 13
AcAcAc
Cytoplasm
Nucleus
Supplemental Figure 13 | Proposed model describing the dose-dependent e�ects of bufexamac in cells. a, At lower doses bufexamac inhibits HDAC6, thereby increases acetylation of target proteins such as tubulin. b, At higher doses bufexamac inhibits HDAC6 activity, but additionally results in iron depletion by chelating cellular iron. c, Depletion of cellular iron by bufexamac mimics hypoxia, which leads to the stabili-zation of HIF1-α. d and e Stabilized HIF1-α accumulates in the nucleus where it binds to hypoxia response elements (HRE) and transcriptionally upregulates target genes involved in cellular responses to hypoxia, such as vascular endothelial growth factor A (Vegfa).
Nature Biotechnology: doi:10.1038/nbt.3130

Class I
Class IIa
Class IIb
Class IV
Class III
SIRT1SIRT2SIRT3SIRT4SIRT5SIRT6SIRT7
HDAC1HDAC2HDAC3HDAC8
HDAC6HDAC10
HDAC11
HDAC4
HDAC5
HDAC7
HDAC9
MS275
NaB
Tubacin
Tenovin-6
Nicotinamide
Sirtinol
TSASAHAPXD101LBH589PandacostatPCI24781
Bufexamac
Apicidin
MG
CD
0103
CI994
PCI34051
JQ12
VPA
Supplemental Figure 14
a bS
irtin
olN
icot
inam
ide
Teno
vin6
PC
I340
51P
CI2
4781
Buf
exam
acTu
baci
nN
aBut
yrat
eTS
AS
AH
ALB
H58
9P
XD
101
JQ12
Pand
acos
tat
MS
275
CI.9
94Va
lpro
ate
MG
CD
0103
Api
cidi
n
SirtinolNicotinamideTenovin6PCI34051PCI24781BufexamacTubacinNaButyrateTSASAHALBH589PXD101JQ12PandacostatMS275CI.994ValproateMGCD0103Apicidin
-1 10
Pearson
Supplemental Figure 14 | Comparison of in-vitro and in-vivo speci�city pro�les of KDACIs. a, Site-based speci�city analysis of KDACIs . SILAC ratios of all identi�ed sites from each Inhibitor were used to calculate pair-wise Pearson correlation coe�cients for all KDACIs. b, The �gure shows the agreement of KDACI-regulated acetylomes with their predicted acetylation pro�les. The type color indicates the level of agreement: Green: high agreement; yellow: partial agree-ment; red: little or no agreement (See also Supplementary note 2).
Nature Biotechnology: doi:10.1038/nbt.3130

Supplemental Table 1 (List of KDAC Inhibitors)
Inhibitor CAS No. Chemical Name Alternative Name Conc. used in this study (µM) Solvent
AGK2 304896-28-4 2-Cyano-3-[5-(2,5-dichlorophenyl)-2-furanyl]-N-5-quinolinyl-2-propenamide 10 DMSO
Apicidin 183506-66-3 Cyclo[(2S)-2-amino-8-oxodecanoyl-1-methoxy-L-tryptophyl-L-isoleucyl-(2R)-2-piperidinexcarbonyl] 5 DMSO
Bufexamac 2438-72-4 2-(p -Butoxyphenyl)acetohydroxamic acid 0.1-1000 DMSOCI.994 112522-64-2 4-(acetylamino)-N-(2-aminophenyl)-benzamide Tacedinaline 50 DMSOJQ12 5 DMSO
LBH589 404950-80-7 (E)-N-hydroxy-3-(4-((2-(2-methyl-1H-indol-3-yl)ethylamino)methyl)phenyl)acrylamide Panobinostat 2 DMSO
MGCD0103 726169-73-9 N-(2-aminophenyl)-4-((4-(pyridin-3-yl)pyrimidin-2-ylamino)methyl)benzamide Mocetinostat 20 DMSO
MS275 209783-80-2 pyridin-3-ylmethyl 4-((2-aminophenyl)carbamoyl)benzylcarbamate Entinostat 5 DMSO
NaButyrate 156-54-7 Butyric acid sodium salt 5000 H2O
Nicotinamide 98-92-0 Pyridine-3-carboxylic acid amide Niacinamide, Vitamin B3, Vitamin PP 20000 H2O
Pandacostat(E)-3-[4-[[[(E)-(2,3-dihydroxy-4-oxocyclohexa-2, 5-dien-1-
ylidene)methyl]amino]carbamoyl]phenyl]-N-hydroxyprop-2-enamide
50 DMSO
PCI24781 783355-60-23-[(dimethylamino)methyl]-N-[2-[4-
(hydroxycarbamoyl)phenoxy]ethyl]-1-benzofuran-2-carboxamide
Abexinostat 1 DMSO
PCI34051 950762-95-5 N-hydroxy-1-[(4-methoxyphenyl)methyl]indole-6-carboxamide 10 DMSO
PXD101 414864-00-9 (E)-N-hydroxy-3-[3-(phenylsulfamoyl)phenyl]prop-2-enamide Belinostat 5 DMSOSAHA 149647-78-9 N'-hydroxy-N-phenyloctanediamide Vorinostat, Zolinza 2 DMSO
Sirtinol 410536-97-9 2-[[(Z)-(2-oxonaphthalen-1-ylidene)methyl]amino]-N-(1-phenylethyl)benzamide 100 DMSO
Tenovin6 1011557-82-64-tert-butyl-N-[[4-[5-
(dimethylamino)pentanoylamino]phenyl]carbamothioyl] benzamide
10 DMSO
TSA 58880-19-6 (2E,4E,6R)-7-[4-(dimethylamino)phenyl]-N-hydroxy-4,6-dimethyl-7-oxohepta-2,4-dienamide Trichostatin A 2 DMSO
Tubacin 537049-40-4 N-[4-[(2R,4R,6S)-4-[(4,5-diphenyl-1,3-oxazol-2-
yl)sulfanylmethyl]-6-[4-(hydroxymethyl)phenyl]-1,3-dioxan-2-yl]phenyl]-N'-hydroxyoctanediamide
10 DMSO
Valproate 99-66-1 2-propylpentanoic acid
Depakine, Depakene, Ergenyl, Dipropylacetic acid, Mylproin,
Convulex, Valproic Acid, Myproic Acid
5000 H2O
Supplemental Table 1 | List of KDAC Inhibitors used in this study. The table lists names of KDACIs and their concentration used in this study for global acetyl-lation analysis in HeLa cells. Used solvent and chemical name are also indicated.
Nature Biotechnology: doi:10.1038/nbt.3130

Supplemental notes
Supplemental note 1
Synthesis of JQ12. The amino group on commercially available 4-bromo-2-nitroaniline (SI-1) was
first protected as tert-butyl carbamate. The resulted compound SI-2 underwent a palladium (II)
catalyzed Suzuki coupling reaction with thiophen-2-ylboronic acid to establish the 4-thiophen-2-yl-
phenyl core, and generate compound SI-3. The nitro group on SI-3 was then reduced to amino
group under palladium (0) catalyzed hydrogenation to afford mono-protected diaminophenyl
compound SI-4. The coupling reaction between the amino group on SI-4 with 4-acetamidobenzoic
acid under standard amide coupling condition gave amide SI-5. Removal of the Boc protecting
group on SI-5 furnished the final product JQ12. (Supplemental Figure 1A)
Supplemental note 2
Due to the lack of known bonafide targets for each of different KDACs it is not possible to compare
in-vivo specificities of KDACIs for acetylation sites with their in-vitro specificities for individual
deacetylases. We used the number of affected acetylation sites, the subcellular distribution of
KDACI-regulated proteins, known KDAC-specific acetylation sites, data from genetic knockout
cells, as well as comparative acetylation profiles for different KDACIs to obtain an indirect
comparison of in-vivo specificity profiles of KDACIs with their predicted cellular specificities
(based on the number and subcellular localization of target deacetylases).
Nature Biotechnology: doi:10.1038/nbt.3130


