
Supplemental Information - cell.com · Supplemental Information ... Oo C1 C2 C4 Pcgf1 Kdm2b Yaf2...
23
Molecular Cell, Volume 58 Supplemental Information Cbx2 Targets PRC1 to Constitutive Heterochromatin in Mouse Zygotes in a Parent-of-Origin- Dependent Manner Mathieu Tardat, Mareike Albert, Rico Kunzmann, Zichuan Liu, Lilia Kaustov, Raphael Thierry, Shili Duan, Urszula Brykczynska, Cheryl H. Arrowsmith, and Antoine H.F.M. Peters
Transcript of Supplemental Information - cell.com · Supplemental Information ... Oo C1 C2 C4 Pcgf1 Kdm2b Yaf2...

Molecular Cell, Volume 58
Supplemental Information
Cbx2 Targets PRC1 to Constitutive Heterochromatin in Mouse Zygotes in a Parent-of-Origin-
Dependent Manner
Mathieu Tardat, Mareike Albert, Rico Kunzmann, Zichuan Liu, Lilia Kaustov, Raphael Thierry, Shili
Duan, Urszula Brykczynska, Cheryl H. Arrowsmith, and Antoine H.F.M. Peters

A
B
0
4
8
Oo C1 C2 C4
Exp
ress
ion,
log2
(RP
KM
)Bmi1
Cbx2
Phc2
Phc1
Phc3
Cbx7
Cbx8
Cbx4
Cbx6Mel18
Canonical
0
4
8
Oo C1 C2 C4
Pcgf1
Kdm2b
Yaf2
Pcgf3
Rybp
Pcgf5
Variant
0
4
8
Oo C1 C2 C4
Rnf2
Ring1
Common
0
4
8
Oo C1 C2 C4
Zp3
Pou5f1
Hnrnpr
Control
C
mat
erna
lpa
tern
al
DAPI H2AK119ub1 5mC
83%
250-150-
100-75-
50-
37-
25-
Rybp -
β-Tubulin -
mock
siSCR
siRyb
p-1
siRyb
p-2
siRyb
p-3
siRyb
p-1-2-
3
Rybp-EGFP+-
EGFP-
- endo
- exo
*
DAPI Rybp
siS
CR
siR
ybp-
1
DRybp-EGFP RybpDAPI
E
F
Identification of EGFP or antibody positive cells
(Matlab)
0.5
1.0
1.5
2.0
2.5
3.0
Hp1β
wild-type Suv39h dn
***
(757) (1047)
Creating masks for PCH and Eu regions
(Matlab)
Statistical analysis and data plotting (SigmaPlot)
Automatic image quantification workflow (immunostaining performed in ESC)
Measure mean intensity on PCH and euchromatic regions
Calculate ratio of intensity on PCH over euchromatin (Eu)
EGFP/Antibody DAPI
Fluo
resc
ence
Rat
io P
CH
/Eu
PCH Eu
HG
0
5
10
15
20
25
30
I
wild-type
Suv39h dn
AP staining
EGFPCbx
2-EGFP
EGFP-Phc
2
EGFP-Rnf2
Mock
% o
f EG
FP p
ositi
ve c
ells
wild-type
Suv39h dn
Hp1β -
Cbx7 -
Eset -
G9a -
Suv39h1 - Rnf2 -
Rybp -
β-Tubulin -
Hp1α -
Hp1γ -
Pou5f1-
Phc1 -
PCNA -
Mel18 -
Ezh2 -
Suz12 -
Eed -
H2AK119ub1 -
H3K9me3 -
Total H3 -
H3K4me3 -
H3K27me3 -PRC1
PRC2
Suv39h: wt dn wt dn wt dn wt dn
H3K9/HP1Pathway
wild-type wild-type
wild-type Suv39h dn
mock EGFP
Cbx2-EGFP Cbx2-EGFP
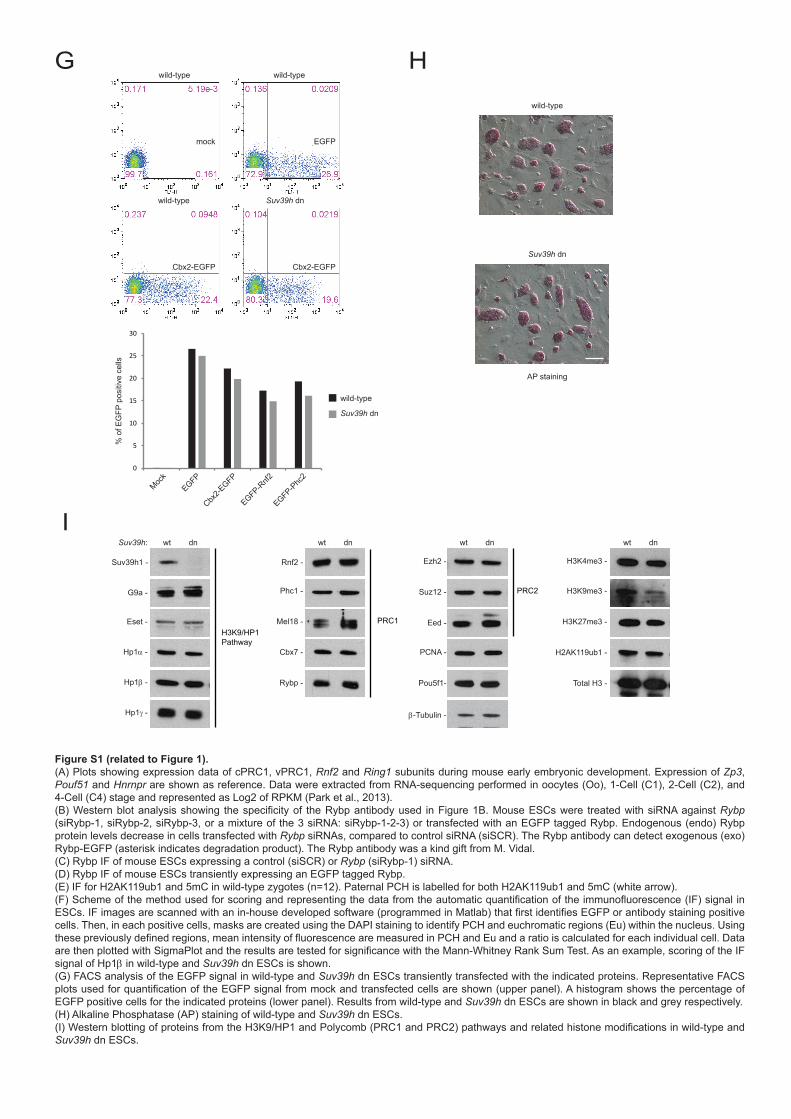
Figure S1 (related to Figure 1).(A) Plots showing expression data of cPRC1, vPRC1, Rnf2 and Ring1 subunits during mouse early embryonic development. Expression of Zp3, Pouf51 and Hnrnpr are shown as reference. Data were extracted from RNA-sequencing performed in oocytes (Oo), 1-Cell (C1), 2-Cell (C2), and 4-Cell (C4) stage and represented as Log2 of RPKM (Park et al., 2013). (B) Western blot analysis showing the specificity of the Rybp antibody used in Figure 1B. Mouse ESCs were treated with siRNA against Rybp (siRybp-1, siRybp-2, siRybp-3, or a mixture of the 3 siRNA: siRybp-1-2-3) or transfected with an EGFP tagged Rybp. Endogenous (endo) Rybp protein levels decrease in cells transfected with Rybp siRNAs, compared to control siRNA (siSCR). The Rybp antibody can detect exogenous (exo) Rybp-EGFP (asterisk indicates degradation product). The Rybp antibody was a kind gift from M. Vidal.(C) Rybp IF of mouse ESCs expressing a control (siSCR) or Rybp (siRybp-1) siRNA.(D) Rybp IF of mouse ESCs transiently expressing an EGFP tagged Rybp.(E) IF for H2AK119ub1 and 5mC in wild-type zygotes (n=12). Paternal PCH is labelled for both H2AK119ub1 and 5mC (white arrow).(F) Scheme of the method used for scoring and representing the data from the automatic quantification of the immunofluorescence (IF) signal in ESCs. IF images are scanned with an in-house developed software (programmed in Matlab) that first identifies EGFP or antibody staining positive cells. Then, in each positive cells, masks are created using the DAPI staining to identify PCH and euchromatic regions (Eu) within the nucleus. Using these previously defined regions, mean intensity of fluorescence are measured in PCH and Eu and a ratio is calculated for each individual cell. Data are then plotted with SigmaPlot and the results are tested for significance with the Mann-Whitney Rank Sum Test. As an example, scoring of the IF signal of Hp1β in wild-type and Suv39h dn ESCs is shown.(G) FACS analysis of the EGFP signal in wild-type and Suv39h dn ESCs transiently transfected with the indicated proteins. Representative FACS plots used for quantification of the EGFP signal from mock and transfected cells are shown (upper panel). A histogram shows the percentage of EGFP positive cells for the indicated proteins (lower panel). Results from wild-type and Suv39h dn ESCs are shown in black and grey respectively.(H) Alkaline Phosphatase (AP) staining of wild-type and Suv39h dn ESCs.(I) Western blotting of proteins from the H3K9/HP1 and Polycomb (PRC1 and PRC2) pathways and related histone modifications in wild-type and Suv39h dn ESCs.

A B
- + - - - - + - - -- - + - - - - + - -
- - - + - - - - + -
- - - - + - - - - +
Cbx2-EGFP
Cbx2-CDF12A-EGFP
Cbx2-ATG78R-EGFP
Cbx2-CDF12A-ATPRG-->AAA-EGFP
wild-type Suv39h dn
βtubulin-
EGFP-
PCH
wild-type Suv39h dn
0
0.04
0.08
0.12
0.16
0.2
ChIP Hp1β
Major Satellites Intergenic
Inpu
t Chr
omat
in (%
)
0
0.5
1
1.5
2
2.5
3
3.5
0
0.05
0.1
0.15
0.2
Inpu
t Chr
omat
in (%
)
Canonical PRC1 targets
Major Satellites Cdx2 Gata4
ChIP EGFP
- +Cbx2-EGFP - + - + - + - + - +
C
KRPRGRPCbx2-AT
RCbx2-ATG78R
LCbx2-ATG78L
RL LCbx2-ATCbx7
--
--
--
--
--
--
-- - -
AAA - -- -
Cbx2-ATL1Cbx2-ATL1G137R R - --- - -
R PRG REG
Cbx2-CD- --- - -
GE VF AAA
Q
Cbx2-ATL2Cbx2-ATL2G165R R - --- - -
R R RGKK K
Cbx2-CDF12A
Cbx2-ATPRG-->AAA
D%
of c
ells
with
EG
FP fo
ci a
t PC
H
Cbx2-E
GFP (93)
Cbx2-C
DF12
A -EGFP (6
0)
Cbx2-A
TPRG-->
AAA -EGFP (4
9)
Cbx2-A
TG78
R -EGFP (6
1)
Cbx2-A
TG78
L -EGFP (5
4)
Cbx2-A
TCbx
7 -EGFP (5
4)
Cbx2-A
TL1G13
7R -EGFP (4
6)
Cbx2-A
TPRG-->
AAA -ATL1G13
7R -EGFP (5
1)
Cbx2-A
TG78
R -ATL1G13
7R -EGFP (3
7)
Cbx2-A
TG78
R -ATL1G13
7R -ATL2G16
5R -EGFP (3
6)
Cbx2-C
DF12
A -ATPRG-->
AAA -EGFP (5
0)
Cbx2-C
DF12
A -ATG78
R -ATL1G13
7R -ATL2G16
5R -EGFP (4
9)0
20
40
60
80
100
120Suv39h dn
0
10
20
30
40
50
% o
f EG
FP p
ositi
ve c
ells
Cbx2-E
GFPMoc
k
Cbx2-C
DF12
A -EGFP
Cbx2-A
TG78
R -EGFP
Cbx2-C
DF12
A -ATPRG-->
AAA -EGFP
EGFP
wild-type Suv39h dn
E
Figure S2 (related to Figure 2).(A) Histogram for FACS analysis of wild-type and Suv39h dn ESCs transiently expressing the indicated EGFP-tagged full length Cbx2 constructs.(B) Western blotting of full-length Cbx2 and point mutant constructs in wild-type and Suv39h dn ESCs. Cbx2 constructs were transiently transfected in ESCs before detection with a GFP antibody. Lower Cbx2-EGFP protein levels in unsorted population of Suv39h dn ESCs reflects lower frequen-cies of transfection (Figure S2A) rather than differential expression levels between individual wild-type versus Suv39h dn ESCs. β-Tubulin is used as a loading control.(C) Mutations introduced into the chromodomain, AT-hook and ATL motifs of Cbx2.(D) Classic quantification of enrichment of different Cbx2-EGFP constructs at PCH relative to euchromatin in Suv39h dn ESCs nuclei (shown as % of EGFP positive cells showing enrichment on PCH). Numbers in brackets refer to numbers of cells scored.(E) Chromatin immunoprecipitation (ChIP) controls in wild-type and Suv39h dn ESCs. Hp1β binding to major satellites is impaired in Suv39h dn ESCs, as expected. Cbx2-EGFP binds the promoter of Cdx2 and Gata4 in both wild-type and Suv39h dn ESCs. Cbx2-EGFP binds strongly to major satellites in Suv39h dn ESCs compared to wild-type cells. Primers used to amplify mouse major satellite DNA (Martens et al., 2005; Peters et al., 2003), or regions 300bp and 400bp upstream of the TSS of Cdx2 and Gata4 respectively (Alder et al., 2010) were previously described. Results from wild-type and Suv39h dn ESCs are shown in black and grey respectively.

PCH
euchromatin
background
paternalmaternal
Bmi1 staining
Draw regions of interest: PCH, euchromatin (purple for paternal
pronucleus and orange for maternal pronucleus) and background (blue) using
the DAPI channelImage J
Measure mean intensity in regions of interest and background for each channel
(i.e Bmi1)Normalize results with background
Image J
0
5
10
15
20
25
30
Statistical analysis and data plotting(i.e Bmi staining on PCH in wild-type
zygotes)
SigmaPlot
image quantification workflow (immunostaining performed in embryos)
Fluo
resc
ence
inte
nsity
(A.U
.) of
Bm
i1
PCH
***
n=23
DAPI staining
F
1
2
3
4***
contr
ol (13
7)50μM
, 2h (
256)
contr
ol (19
1)50μM
, 2h (
185)
Fluo
resc
ence
Rat
io P
CH
/Eu
wild-type Suv39h-dn
B
0
10
20
30
40
50
% o
f EG
FP p
ositi
ve c
ells
distamycin A (2h, 50µM) : - - 25µM- 50µM
wild-type Suv39h dn
Cbx2-EGFP : - +- + +EGFP : -+ - --
C
β-Tubulin -
Cbx2-EGFP -
Suv39h1 -
Hp1β -
0 0 25 50 0 0 25 50Distamycin A (µM) :wild-type Suv39h dn
0
0.1
0.2
0.3
0.4
0.5
0.6
0.7
in
put c
hrom
atin
(%)
distamycin A50µM, 2h :
Cbx2
Mock
Cbx2
Cbx2
Mock
Cbx2
- -+ +--
wild-type Suv39h dn D E
A
Cbx2-EGFP
cont
rol
DAPI Cbx2-EGFP H3K9me3 Hp1β
50 µ
M, 6
hdi
stam
ycin
A
DAPI Cbx2-EGFP H3K9me3 Hp1β
wild-type Suv39h dn
Mat Pat

Figure S3 (related to Figure 3).(A) Distamycin A treatment results in loss of Cbx2-EGFP enrichment at chromocenters in Suv39h dn ESCs. In wild-type cells, distamycin A treatment does not impair H3K9me3 and Hp1β localization. Representative picture of control and distamycin A-treated wild-type and Suv39h dn ESCs are shown.(B) Quantification of enrichment of Cbx2-EGFP at PCH relative to euchromatin in wild-type and Suv39h dn ESCs treated with 50µM distamycin A for 2hr. (C) Histogram for FACS analysis of the EGFP signal in wild-type and Suv39h dn ESCs transiently transfected with Cbx2-EGFP -/+ treatment with distamycin A. Results from wild-type and Suv39h dn ESCs are shown in black and grey respectively.(D) Western blotting analysis shows that the presence of distamycin A does not alter Cbx2-EGFP nor Hp1β protein stability in both wild-type and Suv39h dn ESCs. βtubulin is used as a loading control.(E) Histogram for EGFP ChIP-qPCR analysis of mouse major satellite repeats in wild-type and Suv39h dn ESCs upon transient transfection with Cbx2 (full length) –EGFP ± distamycin A treatment. Data are represented as percent of input chromatin. Error bars represent SD.(F) Scheme of the method used for scoring and representing the data from immunostaining in zygotes. Using Image J (National Institute of Health), we identify and draw regions of interest: PCH, euchromatin and background from the DAPI channel. The mean intensity of fluorescence of PCH and euchromatin is then measured in each channel from non-saturated images and normalized to background. The resulting fluorescence intensities, indicated as arbitrary units (A.U.), are plotted using SigmaPlot and the results are tested for significance with the Mann-Whitney Rank Sum Test. As an example, scoring of the IF signal of Bmi1 at PCH in wild-type zygotes is shown. As expected Bmi1 is significantly more localized to pat-PCH, than mat-PCH.***p≤0.001; ns: not significant. Numbers in brackets refer to number of cells or embryos scored.
B C
EGFP -
β-Tubulin -
moc
kE
GFP
CD
Cbx
2 -ATC
bx2
CD
Cbx
2-F1
2A-A
TCbx
2
CD
Cbx
2-W
33A-A
TCbx
2
CD
Cbx
2-F1
2A-A
TCbx
2-G
78R
CD
Cbx
2-W
33A-A
TCbx
2-G
78R
CD
Cbx
2 -fle
x-A
TCbx
2
CD
Cbx
2 -ATC
bx2-
G78
R
CD
Cbx
2-F1
2A-fl
ex-A
TCbx
2
EGFP -
β-Tubulin -
AT1
-2-3
Hm
ga1
CD
Cbx
2 -AT2
-3H
mga
1
CD
Cbx
2-F1
2A-A
T2-3
Hm
ga1
CD
Cbx
2 -fle
x-A
T2-3
Hm
ga1
0
5
10
15
20
25
30
35
Fluo
resc
ence
inte
nsity
of E
GFP
(A.U
.)
0
5
10
15
20
25
30
35
Ezh2m-z+wild-type
ns
ns ns
ns*
**
paternal
maternal
Cbx2 (
10)
Cbx2-C
DF12
A (14)
Cbx2 (
12)
Cbx2-C
DF12
A (16)
A
Cbx
2-C
DF1
2A
Ezh
2m-z
+w
ild-ty
pe
Cbx
2C
bx2-
CD
F12A
Cbx
2DAPI EGFP H3K27me3
paternal
DAPI EGFP H3K27me3
maternal
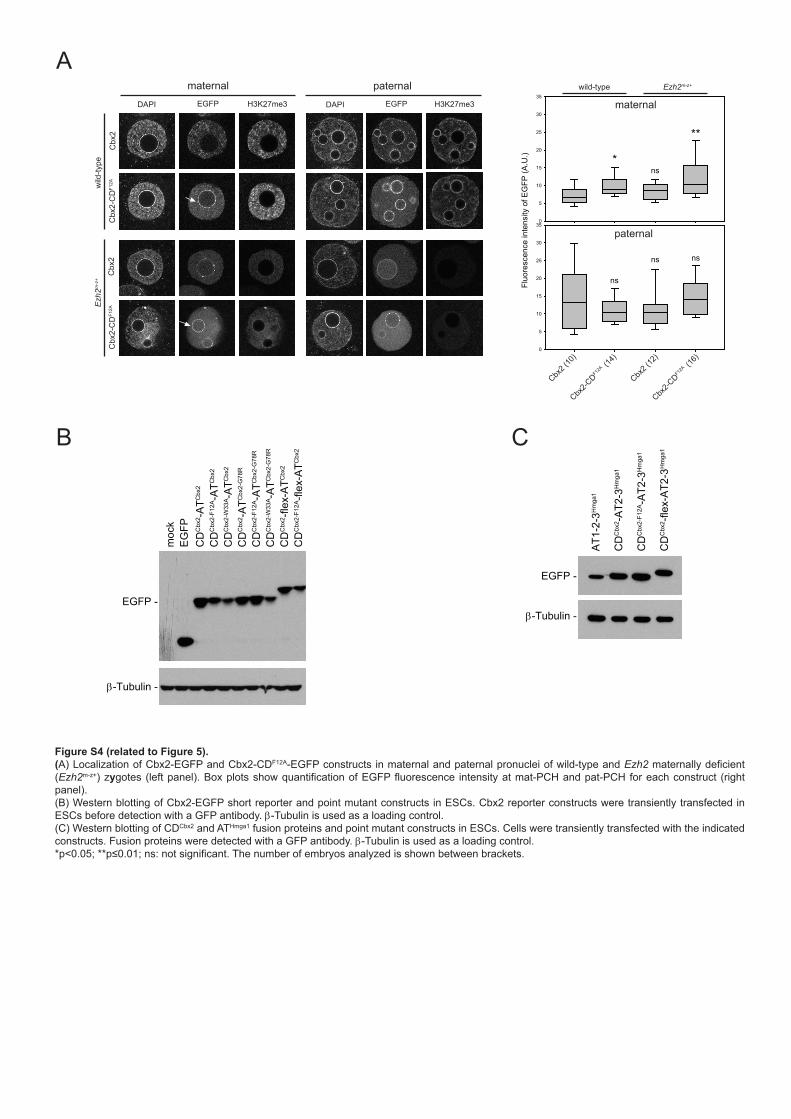
Figure S4 (related to Figure 5).(A) Localization of Cbx2-EGFP and Cbx2-CDF12A-EGFP constructs in maternal and paternal pronuclei of wild-type and Ezh2 maternally deficient (Ezh2m-z+) zygotes (left panel). Box plots show quantification of EGFP fluorescence intensity at mat-PCH and pat-PCH for each construct (right panel).(B) Western blotting of Cbx2-EGFP short reporter and point mutant constructs in ESCs. Cbx2 reporter constructs were transiently transfected in ESCs before detection with a GFP antibody. β-Tubulin is used as a loading control.(C) Western blotting of CDCbx2 and ATHmga1 fusion proteins and point mutant constructs in ESCs. Cells were transiently transfected with the indicated constructs. Fusion proteins were detected with a GFP antibody. β-Tubulin is used as a loading control.*p<0.05; **p≤0.01; ns: not significant. The number of embryos analyzed is shown between brackets.

A
β-Tubulin -
Myc -
Hp1β -- endo
- exo
3xMyc-Hp1βV23A
3xMyc-Hp1β ++- -
- -3x
Myc
-Hp1
βV23
A3x
Myc
-Hp1
βDAPI Hp1β Myc
B C
0.5
1.0
1.5
2.0
2.5
3xMyc
-Hp1
βV23
A (189
)
3xMyc
-Hp1
β (139
)
***
Fluo
resc
ence
ratio
PC
H/E
u
D
EGFP -
β-Tubulin -
CD
Cbx
2 -ATC
bx2
CD
dPC-A
TCbx
2
CD
Cbx
4 -ATC
bx2
CD
Cbx
7 -ATC
bx2
CD
Cbx
2-A
14V-A
TCbx
2
CD
dPC
-A14
V-A
TCbx
2
CD
Cbx
4-V
13A-A
TCbx
2
CD
Cbx
7-V
23A-A
TCbx
2
E
CDCbx
4 -ATCbx
2 (188
)
CDCbx
7 -ATCbx
2 (141
)
1.0
1.2
1.4
1.6
1.8
2.0
2.2
2.4
CDCbx
4V13
A -ATCbx
2 (68)
CDCbx
7V13
A -ATCbx
2 (50)
wild-type
Fluo
resc
ence
Rat
io P
CH
/Eu
*** ***
F
Cbx2-E
GFP (305
)Cbx
4-EGFP (3
14)
Cbx6-E
GFP (221
)Cbx
7-EGFP (3
10)
Cbx8-E
GFP (185
)
Fluo
resc
ence
Rat
io P
CH
/Eu
0.5
1.0
1.5
2.0
2.5
3.0
EGFP (286
)
Cbx4-EGFP Cbx8-EGFPCbx6-EGFP Cbx7-EGFP
DA
PI
EG
FP
Suv39h dn
G
Stro
ngM
oder
ate
Wea
k
DAPI Cbx2-EGFP (n=16) H3K27me3
wild-type
56%
25%
19%
Wea
k
DAPI Cbx4-EGFP (n=10) H3K27me3
100%
Mod
erat
eW
eak
DAPI Cbx7-EGFP (n=9) H3K27me3
56%
44%

Figure S5 (related to Figure 6).(A) IF localization of 3xMyc-Hp1β and 3xMyc-Hp1βV23A in mouse ESCs transiently transfected with the indicated constructs.(B) Quantification of the enrichment of exogenous Hp1β proteins (Myc-tag IF) on PCH shown in (A). (C) Western blot analysis of mouse ESCs transiently transfected with the indicated Hp1β constructs. β-Tubulin is used as a loading control.(D) Western blotting of the chimeric EGFP short reporter and point mutant constructs in ESCs. Cells were transiently transfected with the indicated constructs. Fusion proteins were detected with a GFP antibody. β-Tubulin is used as a loading control.(E) Quantification of PCH enrichment of chimeric EGFP reporters containing the CD of Cbx4 or Cbx7 fused to ATCbx2. The Valine to Alanine mutation impairs PCH localization of Cbx4 and Cbx7 reporters in wild-type ESCs.(F) EGFP localization of Cbx4-, Cbx6-, Cbx7- and Cbx8-EGFP fusion proteins in Suv39h dn ESCs (left panel). Quantification of the enrichment of exogenous EGFP tagged Cbx proteins on PCH in Suv39h dn ESCs (right panel).(G) Localization of Cbx2, Cbx4 and Cbx7 EGFP constructs in paternal PCH and euchromatin of wild-type zygotes.Numbers in brackets refer to number of cells scored (***p≤0.001).

ADAPI Hp1β
wild
-type
Hp1βm
-z+
wild
-type
Hp1βm
-z+
Hp1α
Hp1γDAPI Hp1β Hp1γDAPI Hp1β
DAPI Hp1βHp1α
maternal paternal
0
10
20
30
40
50
60
70
Fluo
resc
ence
inte
nsity
(A.U
.)
***
nsDAPI Bmi1 Hp1βDAPI Bmi1 Hp1β
wild
-type
Hp1βm
-z+
B
(23) (23) (10)(10)
maternal paternal
wild-type Hp1βm-z+ wild-type Hp1βm-z+
maternal paternal
CDAPI Hp1β
wild
-type
Hp1βm
-z+
H4K20me3DAPI Hp1β H3K9me3
wild
-type
Hp1βm
-z+
maternal maternal
2
3
4
5
6
7
8
2
3
4
5
6
7
8
9
10
Fluo
resc
ence
inte
nsity
(A.U
.)
Fluo
resc
ence
inte
nsity
(A.U
.)H3K9me3 H4K20me3
ns
**
wild-type (26) Hp1βm-z+ (17) wild-type (11) Hp1βm-z+ (7)
D
E F DAPI Cbx2-EGFP Hp1β
wild
-type
Suv
4-20
h dn
83%
97%
DAPI Cbx2-EGFP H4K20me3
wild
-type
Suv
4-20
h dn
83%
97%

DAPI Rnf2 Hp1β DAPI Rnf2 Hp1β
DAPI Cbx2 Hp1β DAPI Cbx2 Hp1β
wild
-type
Suv
39h2
m-z
+ w
ild-ty
peS
uv39
h2m
-z+
Maternal PaternalG
DAPI Bmi1 Hp1β DAPI Bmi1 Hp1β
wild
-type
Suv
39h2
m-z
+
DAPI H3K9me3 Hp1β DAPI H3K9me3 Hp1β
wild
-type
Suv
39h2
m-z
+
0
2
4
6
8
10
12wild-type Suv39h2m-z+ wild-type Suv39h2m-z+
maternal paternal
H3K9me3
20
40
60
80
100
120Hp1β
0
2
4
6
8
10
12
14 Rnf2
0
2
4
6
8
10
12
14
16
18
20Cbx2
0
5
10
15
20
25
30
35Bmi1
***
*
***
ns
ns
***
**
ns
**
ns
(21) (21) (12)(12)
(32) (32) (17)(17)
(17) (17) (13)(13)
(9) (9) (5)(5)
(14) (14) (8)(8)
Fluo
resc
ence
inte
nsity
(A.U
.) of
indi
cate
d pr
otei
ns/c
hrom
atin
mar
ks
Figure S6 (related to Figure 7).(A) IF analyses showing that expression levels and localization of Hp1α and Hp1β proteins are not changed in Hp1βm-z+ compared to wild-type PN5 zygotes.(B) IF localization of Bmi1 at PCH in maternal and paternal pronuclei of Hp1βm-z+ zygotes compared to wild-type (arrows). Box plots show the quantifi-cation of fluorescence intensity for Bmi1 at mat-PCH and pat-PCH in wild-type and Hp1βm-z+ zygotes. (C, D) IF analyses show absence of anti-Hp1β signal and reduced levels for maternally inherited H4K20me3 in Hp1βm-z+ versus wild-type zygotes. H3K9me3 levels are comparable between genotypes. Box plots show quantification of fluorescence intensity for indicated antibodies at mat-PCH in wild-type and Hp1βm-z+ zygotes. (E, F) IF localization of Cbx2-EGFP, H4K20me3 and Hp1β in wild-type and Suv4-20h dn ESCs. Percentages indicate cells that display the depicted phenotype.(G) IF analyses showing that matPRC1 components Cbx2, Rnf2, and Bmi1 are enriched at mat-PCH in Suv39h2m-z+ zygotes but not in wild-type PN5 zygotes (arrows). Box plots show quantification of fluorescence intensity for the indicated antibodies at mat-PCH and pat-PCH in wild-type and Suv39h2m-z+ zygotes.*p≤0.05; **p≤0.01; ***p≤0.001; ns: not significant. The number of embryos analyzed is shown between brackets.

Table S1: List of antibodies used in this study.
Antibody Origin Ref WB IF ChIP PRC1 Bmi1 Upstate 05-637 1:200 Rnf2/Ring1b Active Motif 39663 1:1000 1:300 Cbx2 A.Otte 1:300 Phc1 SIGMA HPA006973 1:1000 Phc1 Active Motif 39724 1:300 Phc2 H.Koseki 1:200 Cbx7 Abcam ab21873 1:1000 1:300 Rybp Abcam ab5976 1:2000 Rybp M.Vidal 1:2000 1:500 H2AK119ub1 Cell Signaling 8240 1:2000 1:500 PRC2 Ezh2 Cell Signaling 5246 1:1000 Suz12 Cell Signaling 3737 1:1000 EED A.Otte 1:1000 H3K27me3 Upstate 07-449 1:1000 1:500 H3K27me3 Active Motif 39156 1:1000 1:500 H3K9/HP1 Suv39h1 Cell Signaling 8729 1:1000 ESET Upstate 07-378 1:1000 G9a Cell Signaling 3306 1:1000 Hp1α Euromedex 2HP-2G9-AS 1:1000 1:300 Hp1β Serotec MCA 1946 1:1000 1:500 4µg
Hp1γ Euromedex 2MOD-1G6-AS 1:1000 1:300
H3K9me3 Upstate 07-442 1:1000 H3K9me3 IMP 1:500 H4K20me3 IMP 1:500
5mC Eurogentec BI-MECY-0100 1:400
Controls GFP Roche 11814460001 1:1000 1:200 4µg H3K4me3 Upstate 07-473 1:1000 βtubulin SIGMA T 4026 1:5000 Lamin A/C Santa Cruz SC6215 1:3000 PCNA Santa Cruz sc-56 1:1000 Pou5f1 BD Bioscience 611202 1:2000 1:500 H3 Abcam 1791 1:10000

Supplemental Experimental Procedures
Constructs
For site-directed mutagenesis, approximately 25bp long primers containing the
mutation in the center were used for amplification with Phusion Taq (Finnzymes). The
PCR reaction was digested with the methylation sensitive restriction enzyme Dpn1 (New
England BioLabs) to remove the original construct and subsequently used for
transformation. Successful mutagenesis was confirmed by sequencing. The Cbx2
truncation constructs were generated by PCR from the Cbx2-EGFP construct. For the
Cbx4, Cbx7 CD fusion constructs with the Cbx2 AT-hook, a Pst1 site was introduced
between the CD of Cbx2 and the Cbx2 AT-hook for cloning. The CDs of Cbx4 and Cbx7
were amplified by PCR.
Cloning, expression and purification of Cbx proteins.
Cbx2 (9-66), Cbx2 (9-88), Cbx4 (8-65) and Cbx7 (8-62) were obtained as
described before (Kaustov et al., 2011). Cbx2 (9-66)-A14V, Cbx4 (8-65)-V13A and Cbx7
(8-62)-V13A mutations were made by QuickChange II XL site-directed mutagenesis kit
(Stratagene) and confirmed by complete cDNA sequencing. Proteins for NMR samples
were prepared in M9-defined medium supplemented with 15N-Ammonium Chloride and
D-13C6 glucose for uniformly 13C,15N labeled samples or with 13C labeled biosynthetic
precursors to generate 13C labeled methyl groups of Ile, Leu, Val for ILV labeled samples,
respectively (Kaustov et al., 2011; Tugarinov et al., 2006).
Mice and Cell Lines
To produce maternally deficient HP1β mice, Cbx1F/F mice that carried the Zp3-cre
recombinase transgene were generated. Housing and handling of mice conformed to the
Swiss Animal Protection Ordinance, chapter 1.

ESCs were cultured in either DMEM medium with 4.5 g/l glucose (Gibco)
containing 15% FCS (fetal calf serum, Chemicon), penicillin, streptomycin, 2 mM L-
glutamine, 0.1 mM β-mercaptoethanol, non-essential amino acids and 1mM sodium
pyruvate (Gibco) or with knockout serum replacement (Invitrogen) in presence of GSK3β
and MEK1 inhibitors (2i) (CHIR99021, 3µM and PD184352, 0.8µM respectively, Axon
Medchem).
Transiently transfected ESCs were seeded after approximately 16h of culture on
poly-L-lysine coated coverslips, fixed with PFA and mounted in Vectashield containing
DAPI (Vector).
Phosphatase Alkaline staining was performed with the Alkaline Phosphatase
Detection Kit (SCR004, Millipore) following manufacturer’s instructions.
siRNA knock down in ESCs was performed using Lipofectamine following the
manufacturer’s instructions (Invitrogen). Briefly, 2.105 cells were transfected with 100
pmole of siRNA duplexes, and collected 2 days later for subsequent Western blot or IF
analysis. siRNA were purchased from Microsynth (Switzerland). Sequences are available
upon request.
Flow Cytometry
Transiently transfected cells were harvested with Trypsin, washed in PBS and
resuspended in 500µL of PBS-0.2%Serum. EGFP expression was analyzed by a flow
cytometer (FACSCalibur, Beckton Dickinson) using CellQuest software (Beckton
Dickinson). Plots and quantification of EGFP positive cells were performed with FlowJo
software (Tree Star).
Collection, in vitro fertilization (IVF), micro-injection and culture of mouse embryos
Isolation of oocytes, and embryos, generation of mRNA and micro-injection were
done as previously described (Posfai et al., 2012; Puschendorf et al., 2008).

Mouse oocytes and embryos were derived from superovulated 5-10 week old
females according to standard procedures (Hogan et al., 1994). For IVF, females were
injected with PMSG (5U, Intervet) and 48h later with hCG (5U, Intervet). M-II oocytes
were then collected 14h after hCG injection. Sperm was obtained from 10-16 week old
control males. Capacitation was carried out in human tubular fluid (HTF, Millipore)
containing 7.5 mg/ml BSA for 2h. IVF was performed in HTF containing 7.5 mg/ml BSA
(Gibco) for 2h. Zygotes were substaged according to morphology of pronuclei using
criteria as defined previously (Adenot et al., 1997). In brief, PN0 refers to embryos
immediately after fertilization and PN5 refers to embryos with large pronuclei located
centrally within the embryo. For distamycin A treated PN0 zygotes, fertilization was
performed in HTF containing 7.5 mg/ml BSA supplemented with distamycin A (Sigma,
#D6135) for 2h.
For in vitro transcription, the plasmids were linearized and the mMessage
mMachine T7 kit (Ambion, AM1344) was used. The synthesized mRNA was diluted to the
optimal concentration using nuclease-free water (Ambion, AM9937). 2-4 pL mRNA
(100ng/μl) was microinjected into the cytoplasm of in vitro fertilized CD1 zygotes using
the Eppendorf FemtoJet injector system. Zygotes were then cultured in KSOM medium
plus amino acids (Chemicon) under a 5% CO2 atmosphere at 37ºC and fixed at late
zygotic stages (PN5).
Fluorescence Recovery After Photobleaching
The Suv39h dn ESCs were transiently transfected using Lipofectamine. For
imaging, cells were plated on Ibidi plates (Ibidi, Germany), grown 24 hours in ESC
medium and imaged on a spinning disc confocal setup comprising an Olympus IX81
(Olympus, Japan) microscope equipped with a Yokogawa CSU-X1 scan head, a 491nm
laser line, a PlanApo 100x/1.45 TIRFM oil immersion objective, an ASI MS-2000 with Z-
piezo stage, a Semrock Di01-T488/568-13x15x0.5 dichroic, a Semrock FF01-525/40-25
emission filter and a Cascade II EM-CCD camera (Photometrics). The setup was
enclosed in a heating box and temperature was set at 37°C and controlled with a “Box”
element (Life Cell imaging, Basel). The sample was covered with a plate dispensing

humidified air containing 5% CO2 at a flux rate of 6 l/hour controlled with a “Brick” element
(Life Cell imaging, Basel). Final pixel size was 94nm. FRAP was performed using a Rapp-
Optoelectronic module equipped with a 473 laser. The results were analyzed using
ImageJ.
Immunofluorescence Staining
Before fixation of embryos, the zona pellucida was removed by incubation in acidic
tyrode for 30 seconds. Embryos were washed twice in FHM, fixed for 15 min in 4%
paraformaldehyde in PBS (pH 7.4) and permeabilized with 0.2% Triton-X 100 in PBS at
room temperature (RT). Fixed embryos were blocked at least 4 hours at RT in 0.1%
Tween-20 in PBS containing 2% BSA and 5% normal goat serum, and were then
incubated with primary antibodies in blocking solution overnight at 4ºC. For 5mC
detection, embryos were incubated in 4N HCl for 10 min at room temperature followed by
neutralization in Tris-HCl, pH 8.0, for 10 min before overnight incubation with the primary
antibody. Embryos were washed three times for 30 min in 0.1% Tween-20 in PBS
containing 2% BSA before application of secondary antibodies for 1 hour at RT followed
by three washing steps for 30 min in 0.1% Tween-20 in PBS containing 2% BSA in the
dark. Primary antibodies were used in combination with cross-absorbed Alexa 488-, 568-
, or 633-coupled secondary antibodies (Molecular Probes). Embryos were mounted in
Vectashield containing DAPI (Vector). Mouse ESCs were trypsinized and placed on poly-
L-lysine coated coverslips for 10 min to attach. Cells were fixed in 2% paraformaldehyde
in PBS (pH 7.4), permeabilized in 0.1% Triton-X 100 in 0.1% sodium citrate. ESCs were
blocked for 30 min in 0.1% Tween-20 in PBS containing 2% BSA and 5% normal donkey
serum at RT and stained as described above.
Microscopy and image analysis
Immunofluorescence stainings of embryos were analyzed using the laser scaning
confocal microscopes LSM510 META (Zeiss; software: LSM Image Browser) and LSM
700 (Zeiss: software: ZEN). One confocal slice through the maximal radius of each pro-

nucleus was scanned. The images were projected using ImageJ. Quantification of the
mean fluorescence intensity of PCH and euchromatin in embryos was performed with
ImageJ and normalized to background (Figure S3F). Unbiased automatic quantifications
of fluorescence intensities in ESCs were performed from tiled pictures comprising at least
64 images taken with a 40X/1.3 oil objective on a Zeiss LSM700 microscope. Images
were subsequently analyzed with a custom Matlab (MathWorks) script developed in
house. In a first step, the EGFP (or antibody) positive cells were identified using a k-
means clustering method. Next, the corresponding DAPI channel was classified into PCH
(high intensity in DAPI), euchromatin (medium intensity in DAPI) and background (low
intensity in DAPI outside the cell). Mean fluorescence intensity from PCH- and
euchromatic-identified regions were calculated for both the DAPI and EGFP channel. For
each labeled cell, the ratio of fluorescence signals at PCH over euchromatic regions was
calculated for both DAPI and EGFP channels. Numerical data was exported into Excel
and plotting and statistical analysis of the immunofluorescence data were conducted with
SigmaPlot (Systat Software). Mann-Whitney U tests were calculated.
Immunoblot Analysis
For immunoblot analysis, cells washed with PBS were lysed in Laemmli buffer (for
histones, acid extraction was performed according to the Abcam protocol). After
measuring protein quantity by Bradford, equal amounts of protein were resolved by SDS-
PAGE, transferred to a nitrocellulose membrane (Biorad), and probed with a primary
antibody overnight at 4ºC. Membranes were then incubated with the appropriate HRP-
conjugated secondary antibodies (1:10000, Amersham). The immunoreactive bands
were detected by chemiluminescence (Thermo Fisher Scientific).
Immunoprecipitation
Protein extracts were prepared as followed: 1 volume of cells was resuspended in
1 volume of low salt buffer (20 mM Hepes at pH 7.9, 10 mM KCl, 0.1% (v/v) NP40 and
cocktail of protease inhibitors). The lysis mixture was incubated on ice for 10 min. Then,

1 volume of high salt buffer was added (20 mM Hepes at pH 7.9, 1 M KCl, 6 mM MgCl2,
20% (v/v) glycerol). DNA was broken with a syringe and needle and the lysis mixture was
sonicated with a Bioruptor (Diagenode), incubated 30 min at 4 °C and centrifuged for 5
min at 4 °C. Immunoprecipitation buffer (20mM Hepes at pH 7.9, 10 mM KCl, 1.5 mM
MgCl2, 0.2% (v/v) Tween20, 10% (v/v) glycerol and cocktail of protease inhibitors) used
at 2x concentration, was added to the lysis mixture, before pre-clearing with 15μl of
Dynabeads protein G (Invitrogen) for 1 h at 4 °C with rotation. After collection of the pre-
cleared lysate, 4µg of mouse anti-GFP antibody (Roche) pre-attached to 15µL of
Dynabeads protein G was added and allowed to precipitate overnight at 4 °C with rotation.
Beads were collected, washed three times with 1 ml of 1x immunoprecipitation buffer,
and resuspended in SDS buffer before immunoblot analysis. All buffer were
supplemented with a cocktail of protease inhibitor (Complete Mini EDTA-free, Roche).
Small-scale biochemical fractionation
One day after transfection of ESCs with Cbx2-EGFP constructs, 10x106 cells were
collected and subcellular fractions were then prepared and analyzed by Western blot as
previously described (Julien and Herr, 2004).
Chromatin immunoprecipitation
ChIP-qPCR from ESCs was performed according to previously described
protocols with modifications (Mohn et al., 2008; Tardat et al., 2010). Cells were collected,
washed in PBS and were cross-linked in PBS containing 1% formaldehyde for 10 min at
room temperature. The Cross-linking reaction was stopped by addition of glycine
(125mM) for 5 min at RT. Cells were then washed twice with cold PBS. Pellets were
resuspended in 15 mL buffer 1 (10 mM Tris (pH 8.0), 10 mM EDTA, 0.5 mM EGTA, 0.25%
Triton X-100) and twice in 15 mL buffer 2 (10 mM Tris (pH 8.0), 1 mM EDTA, 0.5 mM
EGTA, 200 mM NaCl). Then cells were lysed in 1 mL lysis buffer (50 mM HEPES/KOH
(pH 7.5), 500 mM NaCl, 1 mM EDTA, 1% Triton X-100, 0.1% DOC, 0.1% SDS, protease
inhibitors) and incubated on ice for at least 1h. DNA was sheared with first a 10 sec pulse

using a Branson sonicator (amplitude 70%), then samples were aliquoted in 1.5mL
Eppendorf tubes containing 250µL of lysate each prior to sonication with a Bioruptor
(Diagenode) for 25-30 cycles. DNA fragments length (between 200-600bp on average)
was checked on agarose gel stained with ethidium bromide. For the immunoprecipitation,
we incubated between 30-50µg of chromatin overnight at 4 °C with 3-5µg of indicated
antibodies (Table S1) pre-attached to 15µL of Dynabead protein G (Invitrogen). Beads
were washed twice with 1 mL lysis buffer, once with 1 mL DOC buffer (10 mM Tris (pH
8.0), 0.25 M LiCl, 0.5% NP-40, 0.5% deoxycholate, 1 mM EDTA), once with 1mL TE
buffer and bound chromatin was eluted in 1% SDS/0.1 M NaHCO3. After RNase A
treatment followed by proteinase K digestion, cross-linking was reversed by overnight
incubation at 65 °C. DNA was purified with the MinElute PCR Purification Kit according
to the manufacturer's instructions (Qiagen). ChIP experiments were performed at least
three times from independent chromatin preparations, and quantitative PCR analyses of
ChIP DNAs were performed in triplicate using a SYBR Green quantitative PCR kit
(Invitrogen) and a ABI 7500 Fast or a ABI StepOnePlus apparatus (Applied Biosystems),
under conditions standardized for each primer set (primers are available upon request).
The amount of DNA in ChIP samples was extrapolated from standard curve analysis of
chromatin DNA before immunoprecipitation (input chromatin).
Preparation of NCP with H3 methylated histone analog.
Methylated H3Kc27me3 histone was prepared as described previously (Simon et
al., 2007). The 601-DNA (‘Widom’ DNA) was obtained from 32X plasmid which contains
32 repeats of the 601-DNA sequence which were cleaved using ECORv and then used
for nucleosome reconstitution using salt-gradient dialysis method as described
previously) (Dyer et al., 2004).
Fluorescence Polarization
Chromodomains of Cbx2 (9-66), Cbx4 (8-65) and Cbx7 (8-62) were amplified by
PCR from the Mammalian Gene Collection clones and were subcloned into a modified

pET28a-LIC vector. The recombinant proteins and their corresponding mutants were
overexpressed as N-terminal His6-tagged proteins at RT using E. coli BL21 (DE3) Codon
plus RIL (Stratagene) as a host organism. These expressed proteins were purified by
Talon (BD) affinity chromatography under native conditions and eluted with buffer
containing 500 mM Imidazole followed by size exclusion chromatography using a HiLoad
26/60 Superdex-75 column (GE Healthcare). The proteins were monomeric in solution as
determined by size exclusion chromatography. The final samples were prepared in buffer
containing 20 mM Tris (pH 8), 250 mM NaCl, 1mM DTT, 1mM TCEP, 1 mM Benzamidine,
and 0.5 mM PMSF.
The buffer used in the binding assays contained 20 mM Tris pH 8.0, 250 mM NaCl,
1 mM DTT, 5 mM β-mercaptoethanol, 1 mM Benzamidine, 1 mM PMSF, and 0.01%
Tween-20. Fluorescence polarization assays were performed in 384 well plates using
Synergy 2 microplate reader (BioTek, Vermont, USA). To determine Kd values, the data
were fit to a hyperbolic function using SigmaPlot software (Systat Software, Inc., CA,
USA).
NMR spectroscopy and data analysis
The sequence-specific assignments of backbone and side chain resonances of
human Cbx2CD-AT were assigned using the ABACUS approach from peak lists derived
manually from peak picked spectra using NMR data collected at high resolution from non-
linearly sampled spectra and processed using multidimensional decomposition
(Gutmanas et al., 2002; Orekhov et al., 2003). We obtained assignments for all Ile, Leu
and Val methyl groups of Cbx2CD-AT (2 Ile, 3 Val and 9 Leu) which were then used for
chemical shift mapping for a U-[15N,2H]-labeled Cbx2CD-AT sample with Ile, Leu and Val
selectively labeled with 13C. Chemical shift mapping of Cbx2CD-AT was measured from the
[15N,1H] and [13C,1H] TROSY spectra of U-[15N,1H] or U-[15N,2H],Ileδ1-[13CH3], Leu,Val-
[13CH3,12CD3]-labeled Cbx2CD-AT, respectively at protein concentrations ranging from
0.15mM-0.45mM, alone and with aliquots of [2H]-H3K27cme3-NCP (1:1, 1:2, and 1:3
molar ratios) or unlabeled H3K27me3 peptide (residues 19-33; 1:1, 1:3 and 1:6 molar
ratios) until no further changes in chemical shifts were detected. The TROSY and HSQC

spectra were recorded at 250C in 90/10% H2O/D2O with 20 mM TRIS pH 7.7, 150 mM
NaCl, 1mM benzamidine, 0.5mM phenylmethylsulfonyl fluoride, 3mM β-mercaptoethanol.
NMR experiments were performed at 293K on 600 and 800 MHz Bruker Avance
spectrometers equipped with cryoprobes. Composite chemical shift perturbation (CSP)
values were calculated using the equations Δ(δ1H-15N) = [(Δδ1H)2 + (Δδ15N/5)2]1/2 and
Δ(δ1H-13C) = [(Δδ1H)2 + (Δδ13C/4)2]1/2. The data were processed with NMRPipe (Delaglio
et al., 1995) and analyzed with NMRView and Sparky software (Goddard et al., 2006).

Supplemental References
Adenot, P.G., Mercier, Y., Renard, J.P., and Thompson, E.M. (1997). Differential H4
acetylation of paternal and maternal chromatin precedes DNA replication and differential
transcriptional activity in pronuclei of 1-cell mouse embryos. Dev. Camb. Engl. 124, 4615–
4625.
Alder, O., Lavial, F., Helness, A., Brookes, E., Pinho, S., Chandrashekran, A., Arnaud,
P., Pombo, A., O’Neill, L., and Azuara, V. (2010). Ring1B and Suv39h1 delineate distinct
chromatin states at bivalent genes during early mouse lineage commitment. Dev. Camb.
Engl. 137, 2483–2492.
Delaglio, F., Grzesiek, S., Vuister, G.W., Zhu, G., Pfeifer, J., and Bax, A. (1995).
NMRPipe: a multidimensional spectral processing system based on UNIX pipes. J.
Biomol. NMR 6, 277–293.
Dyer, P.N., Edayathumangalam, R.S., White, C.L., Bao, Y., Chakravarthy, S.,
Muthurajan, U.M., and Luger, K. (2004). Reconstitution of nucleosome core particles from
recombinant histones and DNA. Methods Enzymol. 375, 23–44.
Goddard T.D., Kneller D.G. (2006) SPARKY 3, v.3.113, University of California, San
Francisco
Gutmanas, A., Jarvoll, P., Orekhov, V.Y., and Billeter, M. (2002). Three-way
decomposition of a complete 3D 15N-NOESY-HSQC. J. Biomol. NMR 24, 191–201.
Hogan, B., Costantini, F., and Lacy, E. (1994). Manipulating the Mouse Embryo: A
Laboratory Manual (Cold Spring Harbor Laboratory Press).
Julien, E., and Herr, W. (2004). A switch in mitotic histone H4 lysine 20 methylation status
is linked to M phase defects upon loss of HCF-1. Mol. Cell 14, 713–725.
Martens, J.H.A., O’Sullivan, R.J., Braunschweig, U., Opravil, S., Radolf, M., Steinlein, P.,
and Jenuwein, T. (2005). The profile of repeat-associated histone lysine methylation
states in the mouse epigenome. EMBO J. 24, 800–812.

Mohn, F., Weber, M., Rebhan, M., Roloff, T.C., Richter, J., Stadler, M.B., Bibel, M., and
Schübeler, D. (2008). Lineage-specific polycomb targets and de novo DNA methylation
define restriction and potential of neuronal progenitors. Mol. Cell 30, 755–766.
Orekhov, V.Y., Ibraghimov, I., and Billeter, M. (2003). Optimizing resolution in
multidimensional NMR by three-way decomposition. J. Biomol. NMR 27, 165–173.
Simon, M.D., Chu, F., Racki, L.R., de la Cruz, C.C., Burlingame, A.L., Panning, B.,
Narlikar, G.J., and Shokat, K.M. (2007). The site-specific installation of methyl-lysine
analogs into recombinant histones. Cell 128, 1003–1012.
Tugarinov, V., Kanelis, V., and Kay, L.E. (2006). Isotope labeling strategies for the study
of high-molecular-weight proteins by solution NMR spectroscopy. Nat. Protoc. 1, 749–
754.