SUPERVISION OF BIOSECURITY AND SUBANG … of...Report SUPERVISION OF BIOSECURITY AND POULTRY HEALTH...
24
Transcript of SUPERVISION OF BIOSECURITY AND SUBANG … of...Report SUPERVISION OF BIOSECURITY AND POULTRY HEALTH...


Report
SUPERVISION OF BIOSECURITY AND
POULTRY HEALTH MANAGEMENT OF
BROILER FARMS SECTOR III IN
SUBANG DISTRICT
Faculty of Veterinary Medicine Institut Pertanian Bogor Indonesian - Dutch Partnership Program on Highly
Pathogenic Avian Influenza Control Dinas Peternakan of Subang District, West Java
2011

I. INTRODUCTION
I.1. Background
A baseline survey which was conducted by IPB and IDP in January 2010
showed that mortality in broiler farms sector III in Cipunegara sub-ditrict of
Subang was high, about 5.4% and the farms had low productivity. Level of
biosecurity measures practiced on the farms which is one of important factors for
improving poultry health was also still low with the average 46.7% out of 37
measures that should be applied on the farms. Farmers knowledge in farm and
poultry health management was very poor as well. Therefore biosecurity and
poultry health management advisors from Dinas Peternakan of Subang district
were trained and they regularly advised the farmers during weekly visits to apply
good farming practices.
Advice and supervision on biosecurity and poultry health management in
broiler farms sector III in Cipunagara Subdistrict started on October 2, 2010 and
ended in April 2011 (28 weeks). Results of the evaluation at the end of the
program recommended an extension and it was agreed to continue the program
until June 2011. Extension and advise covered the topics farm management,
poultry health, production, and biosecurity. This report covers the findings for the
period October 2010 to April 2011.
I.2. The Objectives
The objectives of the program are:
1. Improving of poultry management, health and biosecurity trough regular farm
visits by Dinas Peternakan advisors
2. Improvement of farm productivity
3. Improving Dinas staffs’ skills in poultry management, health, and biosecurity
4. Conducting surveillance of poultry disease in broiler farms sector III in
Cipunagara

II. ACTIVITIES
II.1. Time and Location
The program was conducted from October 2, 2010 to April 2011, and
subsequently extended to June 2011. The activity was conducted in 25 broiler
farms sector III in Cipunagara Subdistrict, Subang District, West Java Province.
II.2. Activity stage
The activity was carried out in the following stages:
1. Baseline survey
Baseline survey has aimed to collect data on of the biosecurity
condition and farm productivity. The survey was conducted in January
2010. The results of the survey have been reported separately.
2. Socialization of survey result
Results of the survey were socialized to the farmers during a
meeting on April 13, 2010. In this meeting, the farmers were asked for
their feedback regarding activities which could improve their farm
productivity. The farmers realized that they did not have good knowledge
regarding farm management, poultry health and biosecurity due to lack of
assistance from the government. Hence they needed advice on farm
management, poultry health and biosecurity to improve their farm
productivity.
3. Training of Trainer (TOT) for advisors
The would-be advisors were staff from Dinas Peternakan in
Subang who generally had some basic knowledge and education in
livestock production and animal health but were not yet specialists in
poultry health and management, and biosecurity. The TOT was aimed to
improve knowledge and skills of the advisors on biosecurity, poultry
health and poultry management. TOT was conducted from 3 to 5 August
2010. In addition to the TOT, weekly meetings (with Dinas, IPB and IDP

staff) were held during the first month of the program, and followed by
similar monthly meetings in the following months to evaluate supervision
activities in the field and to discuss and find solutions for problems
encountered during the farm visits in the field. Beside regular meetings, 3
additional training sessions were held for the advisors on biosecurity
measures (including a field visit) and vaccination policies and practices.
During the meetings the advisors were supervised by poultry management
and health experts both from Faculty of Veterinary Medicine of IPB and
IDP.
4. Assistance for the broiler farmers
The whole group of advisors consisted of ten people who were
divided into five teams, One team consisted of two officers. Every teams
supervised five farms, therefore 25 farmers were supervised in this
program.
The teams were allocated as in Table 1.
Table 1 The names of the advisor teams and farms supervised
Advisor team Farms supervised
drh. Sukirman and Tarjaya Nasim, Arianto, Ujang, Ade and Adut Rahmat Hidayat, A.Md and Asep Saefulloh, S.Pi
Ade Black, Sutarjo, Hasan, Toto and Ade Supriyatna
Eko Haryono, S.Pt and Nina Arifah, A.Md
Kastam, Nasir, Tono, Ade Kosasih and Rusli
Maman Tarsiman and Nana Suryana
Tarsim, Wisono, Marjuki, Sutarya and Hasim
R. Ginanjar Firmansyah W., A.Md and Deden Suharyo
H.Warsu, H. Dimyati, Sendin, Yusup and Carli
The activity of supervision consisted of:
• Every farmer was visited by the advisor team every week. Beside
regular visits, advisors assisted the farmer at shed preparation before
arrival of DOCs, vaccination and harvest time.
• Every farmer kept farm records which were kept on their farms and
in the logbook which was held by the advisor. Farms records consisted

of number of dead and culled birds, quantity (number of bags) of feed
consumption, vaccination, vitamin, diseases and treatment.
• During every visit the advisors record biosecurity practices in the farms,
bird weighing, checking farmers records and record it in logbook, and
give advice regarding poultry management, health, biosecurity and
vaccination.
• Blood samples were collected during every harvest time. The number of
collected samples were 20 birds/farm to measure antibody titer against
ND, gumboro, and avian influenza. This assay was performed to
evaluate vaccination.
• Tracheal swabs were collected of 10 birds/farm if there was mortality >
1% in 3 consecutive days.
• Weekly meetings between advisors and poultry health management
experts were performed in the first month of the intervention, and
followed by monthly meetings in the next four months.
• Results of serology test were discussed with the immunological and
poultry health experts in a special meeting separate from the regular
meetings.
• Additional meetings were performed to discuss specific topics which
were requested by advisors. The meeting consisted of lecture,
discussion and field visit.
The flow of activities is shown in Figure 1 .

Figure 1 Activity flow of assistance management, poultry health and biosecurity
for broiler farmers sector III in Cipunagara.
II.3. Farmers in the program
Farms participating in the program were broiler farms sector 3 in
Cipunagara. Total 25 farms participated and had in total 28 poultry sheds (cages)
for broiler production. Out of 25 farms, 18 farms were independent farms and 7
farms worked under contract with a poultry company. Until the end of April, 7
farms (9 cages) have completed 4 production cycles, 6 farms (6 cages) have
completed 3 production cycles, 9 farms (9 cages) completed 2 production cycles,
and 4 farms (4 cages) completed only 1 production cycle. Total number of
production cycles which have been supervised was 76. However, because there
was 1 production cycle in one farm that raised and harvested in one group broilers
of different age groups, therefore this cycle was not included, hence records of
75 production cycles were used. Out of theses 75 production cycles, 53 cycles
were independent farms and 22 cycles were contract farms.

III. RESULTS AND DISCUSSION
III.1. Production
III.1.1. Type of Day Old Chick (DOC)
There were 4 types of DOC which were used by farmers, namely
Cobb, Ross, Lohman, and not branded. Percentage of DOC type used by
farmer was presented in Table 2.
Table 2 Type of DOC used by farmer
DOC Strain Number of cycles Persentage Remarks Cobb 37 55.1 34 independent, 3 contract Ross 7 10.1 2 independent, 5 contract Lohman 14 20.3 14 contract Not branded 16 23.2 16 independent Cobb and Lohman 1 1.5 1 independent Total 75 100
The reason for farmers to use DOC of unknown strain or origin (not
branded) was shortage of DOC in the market. In general not branded DOC
had low quality and low weight. Standard of weight of DOC is 37 gram,
while DOC that were received by the farmers were in the range 28.4 – 46
gram.
III.1.2. Period of production
Period of production was in the range from 19 – 34 days as shown in
Table 3.
Table 3 Period of chicken production (days)
Day of Slaughter (day)
Number of cycles Persentage (%)
Remarks
16 – 20 9 12.0 8 independent, 1 contract 21 – 25 31 41.3 25 independent, 6 contract 26 – 30 25 33.3 19 independent, 6 contract 31 - 35 10 13.3 10 contract Total 75* 100%
*Remarks: 1 farm production cycle was not included due to raising chickens of 3 different ages together.
Generally independent farms harvest broilers at early age namely in
the range 21 – 25 days, because of high market demand for young broilers.
Time of harvest and price for broilers on contract farms depended on the

company, therefore chickens were harvested at an age of more than 30 days
of age except for example when there was a disease on the farm.
Table 4 Age at selling/slaughter (days)
Farm type No of cycles Average age Standard deviation Independent 53 24.2 3.2 Contract 22 28.2 3.6 Total
75
25.4
3.8
III.1.3. Mortality
Distribution of mortality for all cycles are presented in the Table 5.
The highest mortality (more than 9%) were found in two farms i.e. Sutarjo
A farm in the cycle I (10,38%), and Toto farm in the cycle II (30,40%).
The high mortality in Sutarjo A farm was due to predation by cats, while in
Toto farm was because of omphalitis considered as bad quality of DOC.
Omphalities is a bacterial disease of poultry that involves the inflammation
of the navel. It is a disease that infects very young chicks, in the first few
days of their lives.
The average and standard deviation of mortality were 4.25% ±
3.69%. If it is adjusted with taken out of extreme mortality (mortality
10.38% and 30.40%), average and standard deviation of mortality were
3.81% ± 1.94%.
Table 5 Mortality distribution of 75 observed cycles
Mortality Rate (%) Number of cycles Percentage Remarks 0 - 1 7 9.33 7 independent
>1 – 2 7 9.33 7 independent >2 - 3 13 17.33 6 independent, 7 contract >3 – 4 16 21.33 11 independent, 5 contract >4 – 5 10 13.33 7 independent , 3 contract >5 - 6 8 10.67 5 independent, 3 contract >6 - 7 9 12.00 6 independent, 3 contract >7 - 8 2 2.67 1 independent, 1 contract >8 - 9 1 1.33 1 independent
>9 2 2.67 2 independent Total 75 100

III.1.4. Body weight at harvest
Body weight at harvest in each farm varies due to variation in harvest
age. In most production cycles the body weight is below standard (Annex 1),
in fact for all except the group of contract farmers the average body weight
is below the standard. See table 6. In this study we use the broiler
performance standard from PT. Charoen Pokphand Indonesia, Tbk. which
was implemented in the field. We use this standard because that company is
the common supplier for broiler farms in Subang (DOC, feed, etc).
Table 6 The average of body weight at slaughter for every cycle period and type
of farms
Farms Number of Cycle
Slaughter Day
Body Weight at Slaughter (g)
Standard deviation
(g)
% flocks above the
Standard of Body Weight
Cycle
1st cycle 27 24.8 1132.3 319.3 40.7
2nd cycle 24 26.0 1240.3 336.9 45.8
3rd cycle 15 26.5 1298.2 372.3 20.0
4th cycle 9 23.6 1060.2 202.3 22.2
Total 75 25.4 1191.4 328.9 36.0
Type of Farms
Independent 53 24.2 1067.8 243.5 26.4
Contract 22 28.2 1489.1 321.2 59.1
Total 75 25.4 1191.4 328.9 36.0

Figure 2 Percentage of flocks which reached body weight above standard at
harvest.
III.1.5. Feed Conversion Rate (FCR)
FCR (Feed Conversion Rate) is a tool to measure the efficiency of feed
consumption in relation to body weight gain. FCR is the kg of feed
consumed per kg weight gain and is calculated with total feed consumption
divided by total body weight at harvest. Therefore a lower FCR shows a
more efficient feed conversion. FCR varies depending on chicken age at
harvest. FCR will increase with increasing age of chickens. Standard of
FCR for each age of broiler chicken was shown at Annex 1. The FCR at
slaughter for every cycle period and type of farms is presented in Table 7.
Generally contract farms had a less efficient FCR compared to the
standard because the feed is provided by the company and farmers tend to
give more feed to reach maximum body weight. Figure 3 shows the
percentage of flocks which have more efficient FCR than the standard for
each of the production cycles. This figure shows that the percentage of
flocks which have a more efficient FCR increased. This means the
utilization of feed compared with bodyweight gain was efficient.

Table 7 The FCR at slaughter for every cycle period and type of farms
Farms Cycle % flocks better
than the Standard of FCR
Average Index of
Performance (IP)
Standard deviation
of IP
Cycle
1st cycle 27 33.3 302.3 61.4
2nd cycle 24 70.8 350.7 90.0
3rd cycle 15 60.0 353.5 75.3
4th cycle 9 66.7 344.9 88.9
Total 75 54.7 333.1 79.5
Type of Farms
Independent 53 60.4 330.4 88.4
Contract 22 40.9 339.7 53.5
Total 75 54.7 333.1 79.5
The FCR is generally less efficient compared to the standard, except
for the category 4th cycle and the category independent farmers where the
FCR is slightly more efficient than the standard.
Figure 3 Percentage of flocks which have a more efficient FCR
compared to standard in each production cycle.
III.1.6. Index of Performance (IP)
Index of performance (IP) is a tool to measure and compare the
performance of farms. The IP is a parameter which combines the feed
efficiency, the differences in final weight and the number of days reared in

one formula and makes it possible to compare the results of a broader range
of broiler flocks.
IP is calculated with the following formula:
Where: m = mortality rate (%) BW = average body weight (in kg) FCR = Feed conversion rate Age = Age of harvest (days)
Index of performance is divided into four categories as shown in the
Table 8.
Table 8 Category of farm performance based on IP value
Index of performance
Category
<200 Poor
200 – 250 Moderate
>250 – 300 Good
>300 Very good
For all categories of poultry the average Index of Performance is in
the category ‘Very Good’.
Figure 4 presents the percentage of IP category for each flock for
every production cycle. This figure showed that IP increased for each
production cycle.
Figure 4 Percentage of IP category for each flock on every production cycle.

The average of IP for all cycles was in the category very good with
the average more than 300. The IP showed an increase for every production
cycle. The average of IP for each production cycles presented in Table 7 and
Figure 5.
Figure 5 Average of IP for each production cycles.
Generally, contract farms had good IP ( (>300). 17 flocks from the
22 flocks on contract farms had an IP higher than 300 (Table 7). This is
because on contract farms, all farm needs such as feed, vitamin and vaccine
were provided by the company, while independent farm must provide all
these inputs by themselves and they are not always able to do meet the exact
requirements for the chickens.
Table 9 The index of performance (IP) distribution of independent and
contract farms
Index of Performance Number of flocks Remarks < 200 2 2 independent
200 - 250 8 7 independent, 1 contract > 250 - 300 16 12 independent, 4 contract
> 300 49
32 independent, 17 contract
Total 75
III.2. Vaccination
Most farmers applied the ND I and IBD I vaccination on the farms. AI
vaccination and IBD II was only done by the contract farms. Distribution of
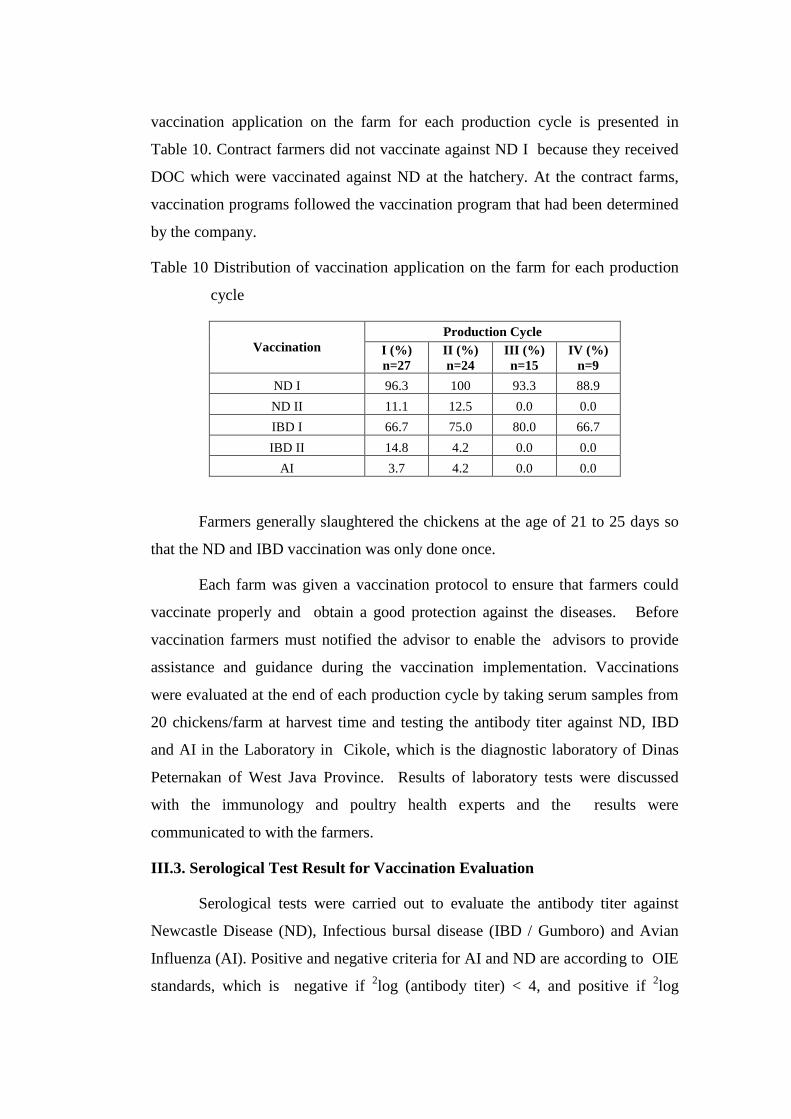
vaccination application on the farm for each production cycle is presented in
Table 10. Contract farmers did not vaccinate against ND I because they received
DOC which were vaccinated against ND at the hatchery. At the contract farms,
vaccination programs followed the vaccination program that had been determined
by the company.
Table 10 Distribution of vaccination application on the farm for each production
cycle
Production Cycle Vaccination I (%)
n=27 II (%) n=24
III (%) n=15
IV (%) n=9
ND I 96.3 100 93.3 88.9
ND II 11.1 12.5 0.0 0.0
IBD I 66.7 75.0 80.0 66.7
IBD II 14.8 4.2 0.0 0.0
AI 3.7 4.2 0.0 0.0
Farmers generally slaughtered the chickens at the age of 21 to 25 days so
that the ND and IBD vaccination was only done once.
Each farm was given a vaccination protocol to ensure that farmers could
vaccinate properly and obtain a good protection against the diseases. Before
vaccination farmers must notified the advisor to enable the advisors to provide
assistance and guidance during the vaccination implementation. Vaccinations
were evaluated at the end of each production cycle by taking serum samples from
20 chickens/farm at harvest time and testing the antibody titer against ND, IBD
and AI in the Laboratory in Cikole, which is the diagnostic laboratory of Dinas
Peternakan of West Java Province. Results of laboratory tests were discussed
with the immunology and poultry health experts and the results were
communicated to with the farmers.
III.3. Serological Test Result for Vaccination Evaluation
Serological tests were carried out to evaluate the antibody titer against
Newcastle Disease (ND), Infectious bursal disease (IBD / Gumboro) and Avian
Influenza (AI). Positive and negative criteria for AI and ND are according to OIE
standards, which is negative if 2log (antibody titer) < 4, and positive if 2log

(antibody titer) ≥ 4. The positive and negative criteria for IBD was following the
manual ELISA kit used in Cikole Diagnostic Laboratory, which is negative if 2log
(antibody titer) < 8, and positive if 2log (antibody titer) ≥ 8. Serological test results
were presented in Table 11.
Table 11 The results of serological tests against ND, IBD and AI
Diseases
The Frequency
of Vaccination
Negative Positive Total
0 3 0 3
1 47 0 47
2 4 1 5
Total 54 1 55
ND
% 98.2 1.8 100
0 14 5 19
1 24 10 34
2 0 2 2
Total 38 17 55
IBD
% 69.1 30.9 100
0 53 0 53
1 2 0 2
Total 55 0 55
AI
% 100 0 100
Table 12 Application time of vaccination and growing period of chickens (days)
Minimum Maximum Mean Std Deviation
ND 1 0*) 6 3.6 1.1
ND 2 17 19 18.3 0.8
IBD 1 0*) 18 12.4 3.0
IBD 2 19 21 19.4 0.9
AI 7 7 7.0 0.0 Growing Period 19 34 25.4 3.8
*)Vaccination was done in hatchery
HI test results for ND show only one farm with a positive antibody titer,
namely one of the five flocks which was vaccinated twice in one production cycle.
For the farms which vaccinate ND twice the first vaccination is usually performed
on day 4and the second one between day 17 until 19. Because the chickens were

generally sold between day 22 and 25 the antibody titer had not yet increased after
the vaccination. On farms which vaccinated only once antibody titers had
decreased at time of selling so they also showed negative results.
The first IBD vaccination was generally performed on day 12 and the
second vaccination on day 19. The results of ELISA test showed that the two
farms that vaccinated for IBD twice obtained positive results. As for the farms
which vaccinated once 10 of 34 farms showed positive test results. The time
between the first IBD vaccination and slaughter was 2 weeks. At that time there
had been an increase in antibody titer to obtain a positive test result. As for the
few farms that had negative test results this was possibly caused by a low vaccine
doses or improper vaccination procedure. With the aim to improve the
vaccination results the farmers were provided with a protocol and the and the
advisors must be present at the farms at the vaccination time to provide guidance
to farmers regarding the dose and procedure of application.
Some farms which were not vaccinated against IBD showed a positive
ELISA test results. That farms must be wary because there is the possibility that
their farm is infected with IBD. Those farmers were advised to disinfect the shed
properly in order to kill the IBD virus, for example by using disinfectant
concentration two times theusual concentration and to give formaldehyde.
In general farmers did not do AI vaccination. AI vaccination was only
done on one farm, and the results of HI test against the AI showed negative results
in all flocks.
III.4. Disease Outbreak Report
One of the activities during supervisor program was to take tracheal
swabs from 10 birds/farm if there was mortality > 1% in 3 consecutive days at
that farm.
Advisors to Kastam's farm reported that there were high mortality for 3
consecutive days. High mortality occurred from day 20 in the first and again in
the second cycle during assistance program. The number of deaths during
outbreaks in the two cycles are presented in Table 13.

Table 13 The outbreak history at Kastam’s Farm
Day Mortality (head) Cycle I (N = 3000)
20 28 21 15 22 25 23 (go to slaughter) 50
Cycle II (N = 3100) 20 5 21 5 22 21 23 57 24 (go to slaughter) 161
Advisors took 15 tracheal swabs in both cycles and sent the samples to the
Diagnostic Laboratory in Cikole, Bandung. The PCR test results were H5
positive, which confirmed that the farm was infected with avian influenza.
The advisors investigated the farm and interviewed the farmer. The farm
was a contract farm. The farmer informed that in the first cycle he received the
feed from the company which had first been on another farm but was surplus after
selling the chickens. Partner companies usually send the feed every two weeks. In
the second cycle the farmer received a visit from a friend who works at the poultry
slaughter house. The farmis surrounded by a bamboo garden and located away
from settlements.
From the investigation result there is the possibility that the infection is
transmitted through feed provided by the company. The incubation period for AI
ranges from 3 to 7 days, and in this case the feed arrived on day 14and the
outbreak occurred on day 20. After that the shed was empty for 5 weeks.
However, it is assumed that the disinfection process implemented on the farm did
not kill the AI virus and the outbreak occurred again in the next flock.
Biosecurity recommendations for the farmer wereto disinfect the shed
using formaldehyde to kill and eradicate the virus; not to accept feed waste or
feed from another farm; and to control the traffic of people, animals and vehicles
visiting the farm. Further not allow visitors to enter, except with the owner’s
permission and using special clothing.
III.5. Biosecurity Measures
In general, the application of biosecurity on farms showed an increase,
especially for biosecurity practices which can be implemented without any cost or
at low cost.
Of the 32 biosecurity items that were recommended to be applied on the
farms, only one was not implemented by the farmers, namely safe storing and
disposal of manure. In the handling of manure, farmers usually remove the
manure immediately after harvest and transport it to be used as fertilizer. Farmers
never store manure for a long time at their farms.
Biosecurity practices which were applied by only a few farmers (<10%)
until the 28th week of supervision were cleaning & disinfection of vehicles, as
well as providing special farm clothing. Other biosecurity practices that
application were also applied by few farmers (3.27%) were providing farm boots
and insect control.
Locking the gates, control of wild birds and control of rodent and other
animals entering the farm were only done by 36.4% of farmers. All in all out was
only practiced by 45.5% of farmers, while other farmers sold their poultry
gradually ( e.g. every 1 or 2 days) over a short period.
Biosecurity measures applied by the farmers from the first week of
supervision until the 28th week are described in detail in Table 15.
Table 14 showed the implementation of biosecurity measures (%) in week
1 and week 28, and Table 15 showed the percentage of farmers who apply the 32
items of biosecurity in broiler farms sector 3 of the initial assistance program
(week 1) until the week 28th.

Table 14 The implementation of biosecurity measures (%) in week 1st and week
28th.
Farms applying the biosecurity measure (%)
Week 1 Week 28 No Biosecurity measure
n=25 n=22
1 Fencing surrounding the farm 24.0 54.5 2 Lock on front of gate 12.0 36.4 3 Stop sign at entrance 40.0 100.0 4 Biosecurity manual 68.0 100.0 5 Keep visitors log 80.0 100.0 6 Lock on all poultry houses 88.0 100.0 7 Record name breeding farm,
location of breeding farm 64.0 86.4
8 Record mortality (including culled bird)
72.0 100.0
9 All-in all-out n/a 50.0
10 Separate all poultry species (include water fowl)
88.0 100.0
11 Separate age classes of poultry
100.0 95.5
12 Clean spilled feed 40.0 95.5 13 Protect feed store from rodent and
wild bird) 28.0 77.3
14 Cleaning and disinfection between flocks
100.0 100.0
15 Dead bird removal from shed at least 3 times per day
40.0 90.9
16 safe disposal of dead birds (burning, burying, composting)
52.0 90.9
17 Sign at entry restricting visitors
44.0 100.0
18 Remove manure after harvest 100.0 100.0 19 Storing and disposal manure
safely 0.0 0.0
20 Cleaning and disinfection of equipment and tools
76.0 100.0
21 Cleaning & disinfection of vehicles
0.0 9.1
22 Having hand wash facilities on the farm
48.0 95.5
23 Provide farm clothing
4.0 9.1
24 Provide farm boots 20.0 50.0
25 Washing hands before and after entering the poultry house
32.0 95.5
26 Boot cleaning and Disinfection action before entering the shed
20.0 77.3
27 Insect Control 8.0 27.3 28 Make the shed Wild bird proof 16.0 40.9
29 Rodent Control for other animal
8.0 45.5
30 Scavening dogs and cat control 12.0 54.5
31 Control of open water (drainage, water lakes)
32.0 86.4
32 Control of vegetation around the farm
32.0 86.4
Average 43.5 73.6

Table 15 The percentage of farmers who apply the 32 items of biosecurity
in broiler farms sector 3 of the initial assistance program (week 1)
until the week 28th
Week
1 3 5 7 9 11 13 15 17 19 21 23 25 27 No Biosecurity
n=25 n=25 n=25 n=25 n=25 n=25 n=25 n=25 n=25 n=25 n=25 n=25 n=24 n=24
1 Fencing surrounding the farm
24.0 32.0 40.0 48.0 44.0 48.0 48.0 48.0 48.0 48.0 48.0 48.0 50.0 50.0
2 Lock on front of gate
12.0 12.0 20.0 28.0 28.0 32.0 32.0 32.0 32.0 32.0 32.0 32.0 33.3 33.3
3 Stop sign at entrance
40.0 68.0 100.0 100.0 100.0 100.0 100.0 100.0 100.0 100.0 100.0 100.0 100.0 100.0
4 Biosecurity manual
68.0 88.0 100.0 100.0 100.0 100.0 100.0 100.0 100.0 100.0 100.0 100.0 100.0 100.0
5 Keep visitors log
80.0 96.0 100.0 100.0 100.0 100.0 100.0 100.0 100.0 100.0 100.0 100.0 100.0 100.0
6 Lock on all poultry houses
88.0 88.0 88.0 92.0 92.0 96.0 100.0 100.0 100.0 100.0 100.0 100.0 100.0 100.0
7 Record name and location breeding farm
64.0 72.0 76.0 80.0 76.0 80.0 80.0 80.0 80.0 80.0 80.0 84.0 83.3 83.3
8 Record mortality (including culled bird)
72.0 100.0 100.0 100.0 100.0 100.0 100.0 100.0 100.0 100.0 100.0 100.0 100.0 100.0
9 All-in all-out
n/a 66.7 44.0 44.0 44.0 44.0 48.0 48.0 48.0 48.0 48.0 48.0 50.0 50.0
10 Separate all poultry species (include water fowl)
88.0 88.0 92.0 96.0 92.0 96.0 96.0 96.0 96.0 96.0 96.0 100.0 100.0 100.0
11 Separate age classes of poultry
100.0 100.0 96.0 96.0 92.0 96.0 96.0 96.0 96.0 96.0 96.0 96.0 95.8 95.8
12 Clean spilled feed
40.0 80.0 88.0 96.0 92.0 96.0 96.0 96.0 96.0 96.0 96.0 96.0 95.8 95.8
13 Protect feed store from rodent and wild bird)
28.0 48.0 56.0 64.0 68.0 72.0 72.0 72.0 72.0 72.0 72.0 72.0 75.0 75.0
14 Cleaning and disinfection between flocks
100.0 100.0 100.0 100.0 100.0 100.0 100.0 100.0 100.0 100.0 100.0 100.0 100.0 100.0
15 Dead bird removal from shed at least 3 times per day
40.0 64.0 80.0 84.0 80.0 84.0 88.0 88.0 88.0 92.0 92.0 92.0 91.7 91.7
16 safe disposal of dead birds (burning, burying, composting)
52.0 72.0 84.0 88.0 88.0 92.0 92.0 92.0 92.0 92.0 92.0 92.0 91.7 91.7
17 Sign at entry restricting visitors
44.0 76.0 100.0 100.0 100.0 100.0 100.0 100.0 100.0 100.0 100.0 100.0 100.0 100.0
18 Remove manure after harvest
100.0 100.0 96.0 100.0 100.0 100.0 100.0 100.0 100.0 100.0 100.0 100.0 100.0 100.0
19 Storing and disposal manure safely
0.0 0.0 0.0 0.0 0.0 0.0 0.0 0.0 0.0 0.0 0.0 0.0 0.0 0.0
20 Cleaning and disinfection of equipment and tools
76.0 88.0 96.0 100.0 96.0 100.0 100.0 100.0 100.0 100.0 100.0 100.0 100.0 100.0
21 Cleaning & disinfection of vehicles
0.0 8.0 0.0 4.0 4.0 8.0 8.0 8.0 8.0 8.0 8.0 8.0 8.3 8.3
22 Having hand wash facilities on the farm
48.0 72.0 84.0 88.0 92.0 96.0 96.0 96.0 96.0 96.0 96.0 96.0 95.8 95.8
23 Provide farm clothing
4.0 12.0 12.0 16.0 16.0 16.0 12.0 12.0 12.0 12.0 12.0 12.0 12.5 12.5
24 Provide farm boots
20.0 36.0 36.0 52.0 48.0 52.0 52.0 52.0 52.0 52.0 52.0 52.0 50.0 50.0
25 Washing hands before and after entering the poultry house
32.0 72.0 84.0 96.0 92.0 96.0 96.0 96.0 96.0 96.0 96.0 96.0 95.8 95.8
26 Boot cleaning and Disinfection action before entering the shed
20.0 60.0 64.0 76.0 72.0 76.0 76.0 76.0 76.0 76.0 76.0 76.0 75.0 75.0
27 Insect Control
8.0 20.0 24.0 24.0 24.0 24.0 24.0 24.0 24.0 24.0 24.0 24.0 25.0 25.0
28 Make the shed Wild bird proof
16.0 24.0 24.0 24.0 32.0 32.0 36.0 36.0 36.0 36.0 36.0 36.0 37.5 37.5
29 Rodent Control for other animal
8.0 24.0 32.0 40.0 40.0 44.0 40.0 40.0 40.0 40.0 40.0 40.0 41.7 41.7
30 Scavening dogs and cat control
12.0 28.0 36.0 44.0 44.0 48.0 48.0 48.0 52.0 52.0 52.0 52.0 54.2 54.2
31 Control of open water (drainage, water lakes)
32.0 60.0 76.0 88.0 88.0 88.0 88.0 88.0 88.0 88.0 88.0 88.0 87.5 87.5
32 Control of vegetation around the farm
32.0 24.0 40.0 68.0 76.0 84.0 84.0 84.0 88.0 88.0 88.0 88.0 87.5 87.5

IV. CONCLUSION
During the implementation of the program there was an increase in the
application of biosecurity measures in poultry farms sector 3, especially for measures
that did not require any or only little cost. The implementation of the following
measures increased from being applied at less than 50 % of the farms to 100% or
almost 100%. Stop sign at entrance, cleaning spilled feed, sign at entrance restricting
visitors, dead bird removal 3 x per day, having hand washing facilities on the farm,
washing hands before and after entering the poultry house, control of open water
(drainages, lakes), and control of vegetation around the farm.
The parameters used to measure productivity were not conclusive and were not
easily comparable. There is an indication that the productivity during the 1ste cycle
was lower but no significant difference could be found between the subsequent 2nd,
3rd and 4th cycle and further studies are needed with a longer cycle of observation to
prove whether the increase is caused by the supervision program.
Contract farms have in average a slightly higher biosecurity score compared to
independent farms. Flock size is more than 3 times higher in contract farms, while size
of the shed is almost 4 times bigger. Broilers are reared at contract farms in average for
28 days, which is 4 days more than on independent farms. Broilers from contract farms
are in average over 400 grams heavier when they are sold. IP indexes are similar for
both groups of farms, but the feed conversion (kg feed per kg growth) is quite a bit
higher in contract farms compared to the independent farms.
Through regular visits and discussions with the Dinas staff in this supervision
program, the farmers have obtained a better level of knowledge of farm management,
poultry health and biosecurity. The staff from the Subang District Livestock Office
also gets the benefit from the training and the working experience in the program and
this increases the capacity of Dinas in the fields of farm management, poultry health,
socialization and biosecurity.
In order to sustain the program commitment and good cooperation with the
stakeholders and government is required in addition to sufficient funding for running
such a program.
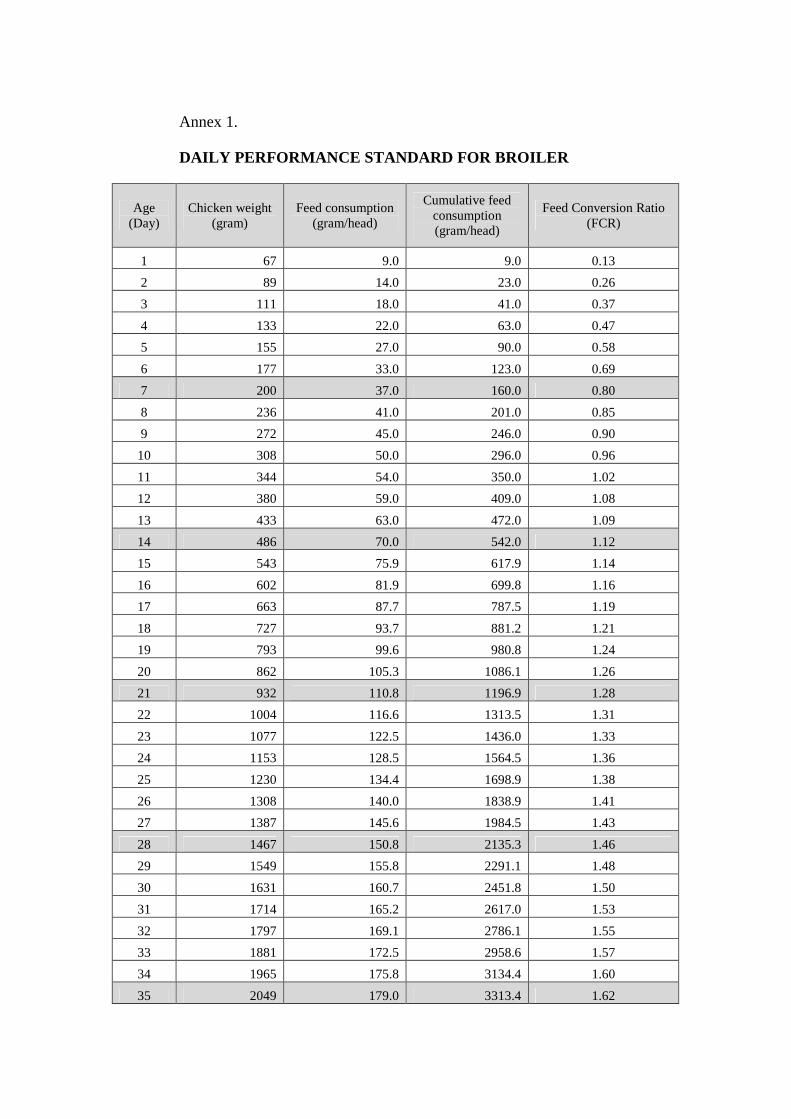
Annex 1.
DAILY PERFORMANCE STANDARD FOR BROILER
Age (Day)
Chicken weight (gram)
Feed consumption (gram/head)
Cumulative feed consumption (gram/head)
Feed Conversion Ratio (FCR)
1 67 9.0 9.0 0.13
2 89 14.0 23.0 0.26
3 111 18.0 41.0 0.37
4 133 22.0 63.0 0.47
5 155 27.0 90.0 0.58
6 177 33.0 123.0 0.69
7 200 37.0 160.0 0.80
8 236 41.0 201.0 0.85
9 272 45.0 246.0 0.90
10 308 50.0 296.0 0.96
11 344 54.0 350.0 1.02
12 380 59.0 409.0 1.08
13 433 63.0 472.0 1.09
14 486 70.0 542.0 1.12
15 543 75.9 617.9 1.14
16 602 81.9 699.8 1.16
17 663 87.7 787.5 1.19
18 727 93.7 881.2 1.21
19 793 99.6 980.8 1.24
20 862 105.3 1086.1 1.26
21 932 110.8 1196.9 1.28
22 1004 116.6 1313.5 1.31
23 1077 122.5 1436.0 1.33
24 1153 128.5 1564.5 1.36
25 1230 134.4 1698.9 1.38
26 1308 140.0 1838.9 1.41
27 1387 145.6 1984.5 1.43
28 1467 150.8 2135.3 1.46
29 1549 155.8 2291.1 1.48
30 1631 160.7 2451.8 1.50
31 1714 165.2 2617.0 1.53
32 1797 169.1 2786.1 1.55
33 1881 172.5 2958.6 1.57
34 1965 175.8 3134.4 1.60
35 2049 179.0 3313.4 1.62

Age (Day)
Chicken weight (gram)
Feed consumption (gram/head)
Cumulative feed consumption (gram/head)
Feed Conversion Ratio (FCR)
36 2134 181.7 3495.1 1.64
37 2218 184.3 3679.4 1.66
38 2302 186.8 3866.2 1.68
39 2386 189.1 4055.3 1.70
40 2469 191.1 4246.4 1.72
41 2552 193.0 4439.4 1.74
42 2634 194.7 4634.1 1.76 Adapted from PT. Charoen Pokphand Indonesia, Tbk. which was implemented in the field.