Supercell storm at Kolkata, India and neighbourhood...
10
Indian Journal of Radio & Space Physics Vol. 35, August 2006, pp. 270-279 Supercell storm at Kolkata, India and neighbourhoodAnalysis of thermodynamic conditions, evolution, structure & movement Vivek Sinha Aerodrome Meteorological Office, Netaji Subhas Chander Bose International Airport, Kolkata 700 052, India Devendra Pradhan Cyclone Detection Radar, New Secretariat Building, 1 K S Ray Road, Kolkata 700 001, India (Email: [email protected]) Received 5 August 2005; revised 13 March 2006; accepted 7 April 2006 On 12 th March 2003 a very severe thunderstorm traversed across the Gangetic West Bengal in India and adjoining areas of Bangladesh. Documentation and analysis of the thermodynamic condition of the atmosphere and evolution, structure and movement of the storm as tracked by the Doppler radar is presented in this paper. One particular cell of the system lasted for over 12 h. Based on the internal structure, reflectivity, duration and weather pattern on the ground, it has been concluded that the particular cell was a supercell. Keywords: Bulk Richardson number, Convective inhibition energy, Storm relative helicity, Surface rainfall intensity, Vertically integrated liquid, Weak echo region, Vertical profiles of radar reflectivity PACS No: 92.60.Wc; 84.40.Xb 1 Introduction During the pre-monsoon season of March, April and May, Gangetic West Bengal and surrounding areas are affected with severe thunderstorm called Norwesters. On 12 March 2003, a series of severe thunderstorm occurred over Kolkata (22.3ºN-88.5ºE) and neighborhood, causing widespread destruction. As per the local Newspaper report, 11 people lost their lives and several well-built structures including the portico and a portion of the perimeter wall of the international airport of Kolkata collapsed under its impact. This was the first thunderstorm of the Norwester season of the year 2003 and possibly the severest in that year. The severity of the storm was more pronounced in the northern part of the station, which was affected twice in quick succession, once at 0820 hrs UTC when the wind speed rose to 74 km/h and again at about 1100 hrs UTC with wind speed reaching 82 km/h. The storm which originated between Dhanbad district in Jharkhand and Bankura district in West Bengal, produced hailstorm, which left over 200 people injured in Bankura alone. The environmental condition was so explosive that the convective activity, which started at 0800 hrs UTC, continued well past 2000 hrs UTC and in the process generated a series of violent thunderstorms. Initially the system was located in the 270º-300º sector with almost a clear sky in the 090º-270º sectors, but with the passage of time the instability grew both eastwards and southwards. The present paper is a documentation and diagnostic study of the evolution and structure of the storm based on the Doppler weather radar (DWR) data at Kolkata, which successfully tracked the storm from 250 km NW of the station, till its dissipation in the east of the station over Bangladesh. Apart from radar data, the relevant data of a set of surrounding stations and overall synoptic situation of the region has also been taken into account. Analysis of synoptic and radar data indicates that it was, indeed a very severe thunderstorm and at least one cell could be classified as a supercell. 2 Methodology and data To study the process of initiation, apart from prevailing synoptic condition over the region, the RS/RW observation of Kolkata has been used to calculate the convective parameters and shear values
Transcript of Supercell storm at Kolkata, India and neighbourhood...
Indian Journal of Radio & Space Physics
Vol. 35, August 2006, pp. 270-279
Supercell storm at Kolkata, India and neighbourhoodAnalysis of
thermodynamic conditions, evolution, structure & movement
Vivek Sinha
Aerodrome Meteorological Office, Netaji Subhas Chander Bose International Airport, Kolkata 700 052, India
Devendra Pradhan
Cyclone Detection Radar, New Secretariat Building, 1 K S Ray Road, Kolkata 700 001, India
(Email: [email protected])
Received 5 August 2005; revised 13 March 2006; accepted 7 April 2006
On 12th March 2003 a very severe thunderstorm traversed across the Gangetic West Bengal in India and adjoining areas
of Bangladesh. Documentation and analysis of the thermodynamic condition of the atmosphere and evolution, structure and
movement of the storm as tracked by the Doppler radar is presented in this paper. One particular cell of the system lasted for
over 12 h. Based on the internal structure, reflectivity, duration and weather pattern on the ground, it has been concluded
that the particular cell was a supercell.
Keywords: Bulk Richardson number, Convective inhibition energy, Storm relative helicity, Surface rainfall intensity,
Vertically integrated liquid, Weak echo region, Vertical profiles of radar reflectivity
PACS No: 92.60.Wc; 84.40.Xb
1 Introduction
During the pre-monsoon season of March, April
and May, Gangetic West Bengal and surrounding
areas are affected with severe thunderstorm called
Norwesters. On 12 March 2003, a series of severe
thunderstorm occurred over Kolkata (22.3ºN-88.5ºE)
and neighborhood, causing widespread destruction.
As per the local Newspaper report, 11 people lost
their lives and several well-built structures including
the portico and a portion of the perimeter wall of the
international airport of Kolkata collapsed under its
impact. This was the first thunderstorm of the
Norwester season of the year 2003 and possibly the
severest in that year. The severity of the storm was
more pronounced in the northern part of the station,
which was affected twice in quick succession, once at
0820 hrs UTC when the wind speed rose to 74 km/h
and again at about 1100 hrs UTC with wind speed
reaching 82 km/h. The storm which originated
between Dhanbad district in Jharkhand and Bankura
district in West Bengal, produced hailstorm, which
left over 200 people injured in Bankura alone. The
environmental condition was so explosive that the
convective activity, which started at 0800 hrs UTC,
continued well past 2000 hrs UTC and in the process
generated a series of violent thunderstorms. Initially
the system was located in the 270º-300º sector with
almost a clear sky in the 090º-270º sectors, but with
the passage of time the instability grew both
eastwards and southwards.
The present paper is a documentation and
diagnostic study of the evolution and structure of the
storm based on the Doppler weather radar (DWR)
data at Kolkata, which successfully tracked the storm
from 250 km NW of the station, till its dissipation in
the east of the station over Bangladesh. Apart from
radar data, the relevant data of a set of surrounding
stations and overall synoptic situation of the region
has also been taken into account. Analysis of synoptic
and radar data indicates that it was, indeed a very
severe thunderstorm and at least one cell could be
classified as a supercell.
2 Methodology and data To study the process of initiation, apart from
prevailing synoptic condition over the region, the
RS/RW observation of Kolkata has been used to
calculate the convective parameters and shear values

SINHA & PRADHAN: ANALYSIS OF SUPERCELL STORM OVER KOLKATA
271
of the atmosphere. To study the internal structure of
the storm, both the primary and secondary products
generated by the DWR have been taken into account.
The DWR at Kolkata is a S-band radar (2875 MHz)
operating at a wavelength of 10 cm. The peak pulse
power of the radar is 750 kW and maximum
unambiguous range of 400 km; however, during the
present tracking the range was kept at 250 km. The
base data generated by the radar is reflectivity, radial
velocity and spectrum width and derived products are
generated as per the product definition file (PDF).
3 Initiation of thunderstorm
The storm was first spotted by the DWR at Kolkata
at 0800 hrs UTC, at a distance of 150 km WNW of
Kolkata near Bankura. As per the synoptic condition,
a trough of low pressure was prevailing over an area
covering Chattisgarh, Jharkhand, and north Orissa
that helped in initiating deep convection.
4 Sequence of weather
The facility of continuous weather watch and
autographic recording of element is available at
Kolkata airport (42809), which is about 12 km NNE
of the DWR site and at Alipore (42807), which is
around 3 km south of DWR. Till 0750 hrs UTC, weak
(< 5 kts) easterly wind was recorded at the airport with
isolated stratocumulus and cumulonimbus cloud and
widespread altocumulus clouds. The first spell of
heavy thunderstorm and gusty wind was reported at
0820 hrs UTC and the second spell at 1100 hrs UTC,
although feeble rain and thunderstorm (RA/TS)
continued incessantly for 14 h till 2200 hrs UTC.
Once the thunderstorm formation started, the wind
remained north-westerly between 280º and 320º at the
Airport and northerly to north-westerly at Alipore.
Another airport Ranchi (VERC) that is around
240 km WNW of DWR, reported 8 kts of ENEly
wind with low and medium cloud at 0900 hrs UTC
and RA/TS with weak SEly wind at 1200 hrs UTC.
As per the Dines PT anemograph, the first spell of
downdraft at the Airport was recorded at 0845 hrs
UTC in which the wind speed rose to 54 kts and
lasted for 15 min. The second spell of gustiness
started at 1030 hrs UTC and a peak speed of 72 kts
was recorded at 1105 hrs UTC. The gustiness
continued till 1200 hrs UTC, after which it subsided.
Compared to this the Alipore anemograph recorded
a peak gustiness of 22 kts only during the same
period. The shift in wind was clearly revealed by the
anemograph at the Airport. At 0840 hrs UTC just
before the first spell of downburst, the wind direction
changed to north-westerly from north-easterly, only to
become north-easterly at the time of downdraft, and
the same sequence was repeated at the time of second
spell at 1110 hrs UTC. This strong directional shear
might be an indicator of rotational motion within the
downdraft. The damage at the ground fully supports
this fact, particularly the damage at the Airport, as the
iron and steel structure was found twisted and
mingled after it collapsed. It is important to mention
that the Alipore anemograph did not record any such
directional shear. The general observation that the
pressure falls up to 5 mb within one km radius of a
tornado does not hold in this case, as a steeper fall of
5 mb was recorded at Alipore, which was farther
away from the main track, compared to 2 mb fall at
the Airport. Besides, there was a lag of 20 min
between the lowest pressure recorded at Alipore
(recorded at 1040 hrs UTC) and Airport (recorded at
1100 hrs UTC), which again indicates that the storm
has taken a relatively northern course.
Starostin1 has reported that a squall line has a
tendency to dissipate when it approaches the position,
which was previously occupied by another stronger
cell. In effect, the squall line has a tendency to
displace the region of hailstorm evolution. In the
present case the dissipation of supercell between 0918
and 1018 hrs UTC and its subsequent regeneration in
a newer area, supports this observation.
5 Results and Discussion
5.1 Thermodynamic and shear environment
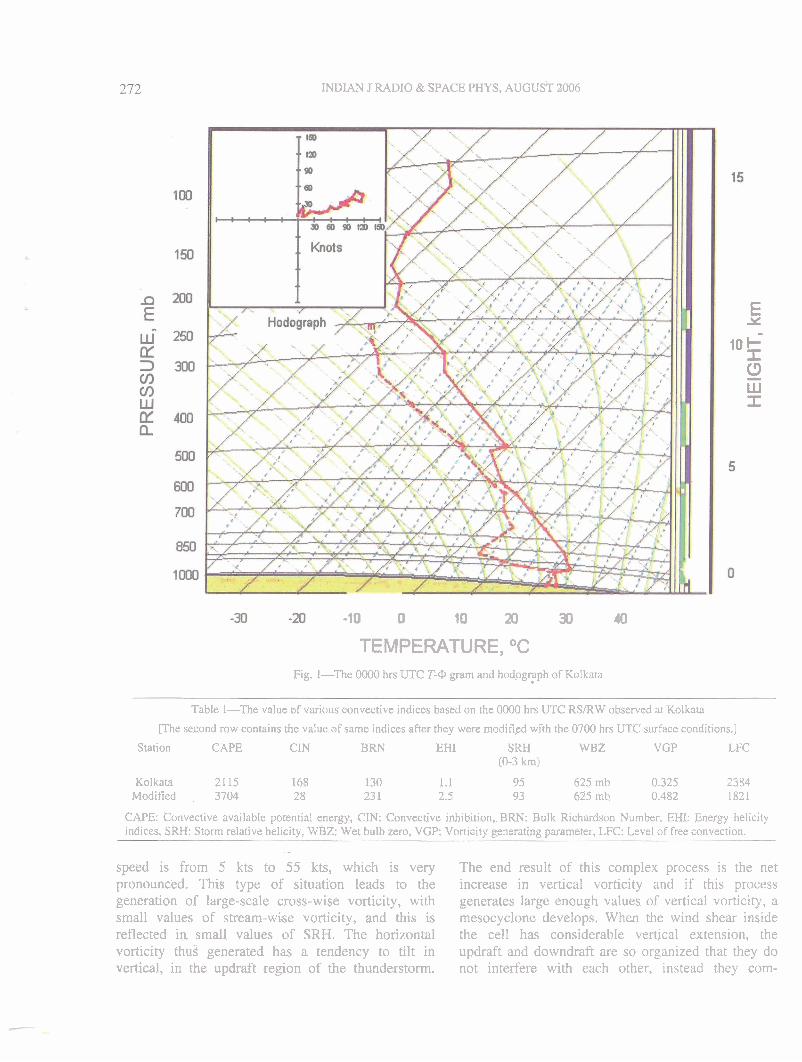
The actual sounding of 0000 hrs UTC of Kolkata
(42809) has been shown in Fig. 1, and various
stability parameters based on the actual sounding and
modified sounding based on 0700 hrs UTC surface
observation has been presented in Table 1.
Together with convective instability, environ-
mental shear plays the most crucial part in generation
and sustenance of severe thunderstorm. Storm relative
helicity (SRH) is an estimate of the potential of the
thunderstorm to acquire rotational updraft in the given
shear environment. In the present case, the 0-3 km
SRH value of 95 is too low, because supercell storm
generally occurs in a SRH value of 150 and above 2.
The low SRH value is due to the fact that the shear in
wind direction is much less than the shear in wind
speeds. Between ground and 6 km height, where the
direction varies from 180º to 260º, the change in
INDIAN J RADIO &SPACE PHYS, AUGUST 2006
-10 0 10 20 30 40
TEMPERATURE, OC Fig. I-The 0000 hrs UTC T-0 gram and hodogrfph of Kolkata
E : &
10 g (3 iii I
Table 1-The value of various convective indices based on the 0000 hrs UTC RSIRW observed at Kolkata
[The second row contains the value of same indices after they were modified with the 0700 hrs UTC surface conditions.]
Station CAPE CIN BRN EHI SRH (0-3 km)
WBZ VGP LFC
Kolkata 21 15 168 130 1.1 95 625 mb 0.325 2384 Modified . 3704 28 23 1 2.5 93 625 mb 0.482 1821
CAPE: Convective available potential energy, CIN: Convective inhibition, BRN: Bulk Richardson Number, EHI: Energy helicity indices. SRH: Storm relative helicity, WBZ: Wet bulb zero, VGP: Vorticity generating parameter, LFC: Level of free convection.
--
speed is from 5 kts to 55 k t ~ , which is very The end result of this complex process is the net pronounced. This type of situation leads to the increase in vertical vorticity and if this process generation of large-scale cross-wise vorticity, with generates large enough values of vertical vorticiry, a small values of stream-wise vorticity, and this is mesocyclone develops. When the wind shear inside reflected in small values of SRH. The horizontal the cell has considerable vertical extension, the vorticity thus generated has a tendency to tilt in updraft and downdraft are so organized that they do vertical, in the updraft region of the thunderstorm. not interfere with each other, instead they com-
SINHA & PRADHAN: ANALYSIS OF SUPERCELL STORM OVER KOLKATA
273
plement the respective process. This particular feature
distinguishes the supercell storm from ordinary storm.
Studies by Wessman and Klemp3 and others have
indicated that a shear magnitude of 20 m/s in the
lower 6 km creates a condition favourable for
organized updraft and downdraft and this in turn
favours the sustenance of supercell, but this cannot be
treated as a threshold value. In general, the deeper the
environmental shear, more efficient is the dynamic
process that controls the supercell. However, for the
entire process, the value of shear should be taken
together with the instability and not in isolation. In the
0000 hrs UTC sounding the CAPE value was 2115
J/kg, which again is not a very significant value for
formation of supercell thunderstorm. Thus if we take
the 0000 hrs UTC shear or convective parameters, it
did not suggest a storm of this magnitude, but when
the sounding is modified with afternoon values, the
picture changes completely. The modified CAPE
value of 3704 J/kg is sufficient to support supercell
storms. As the amount of shear in the environment
increases, with a given amount of available convec-
tive buoyant energy (i.e., instability), there is a range
of shear values within which long-lived convective
storms are likely to occur4. This range of shear values
appears to depend on the amount of instability, with
long-lived storms occurring in an environment of
greater values of shears, which is generally associated
with larger instability. Therefore, unlike relatively
weak wind shear together with high CAPE value that
favours a multi-cell storm, a moderate value of CAPE
does support supercell thunderstorm in certain
circumstances.
In case of Leon province of north-western Spain,
the value of CAPE has never been found to exceed
2000 J/kg, not even for hailstorm5. The mean value
for CAPE has been 132 J/kg for all days, while for
hailstorm days it had a mean value of 365 J/kg.
Although this is much lower than the value generally
found in mid-latitudes, there is no evidence of any
linear relationship between very high CAPE value and
severity of thunderstorm. In central USA major
tornados have typically been associated with
moderate to high CAPE value6 between 1500 and
3500 J/kg and as the value increases beyond 3500
J/kg, the frequency of super storm decreases
significantly. In another case study7 conducted by the
authors, it was found that a very high CAPE value of
5119 J/kg was associated with a relatively weak
thunderstorm; while a value of 3361 J/kg was
associated with a severe line squall, both occurring at
an interval of one day on 1 and 3 June 2004.
The LFC height in 0000 hrs UTC sounding was
2384 m, which is considerably high for initiation, but
in the modified sounding it became 1821 m, which is
an ideal value. The low LFC height implies large
CAPE in lower levels and this in turn implies
increased potential for low-level acceleration. In
general, LFC below 2000 m is found to be conducive
for tornadic thunderstorm.
The CIN value for the 0000 hrs UTC sounding was
168 J/kg, which is somewhat higher for severe
thunderstorm. In fact model studies have suggested that
large low-level stability, which is reflected in a large
value of CIN acts against generation of intense surface
vorticity and a CIN value larger than 150-200 J/kg
extending through the lowest 2-3 km is not likely to
produce a severe thunderstorm. Most of the supercell
thunderstorms producing tornados are generally found
to be associated with a CIN value lying between 50 and
100 J/kg. However, in the modified sounding, the CIN
value was 28 J/kg and this again was a favourable
value, as Rasmussen and Blanchard8 have found that
75% of tornadoes in classic supercell environments had
CIN < 21 J/kg and 60 % of tornadoes in non-supercell
environments had values greater than this. Yet another
parameter, energy helicity index (EHI) was also
calculated, which combines CAPE and SRH into one
index. In 0000 hrs UTC sounding the EHI value was
1.1, which represents potential for supercell but not for
tornado. In the modified sounding the value doubled to
2.5, which represented a condition favourable for
meso-cyclone induced super-cellular tornadoes.
The wet bulb zero (WBZ) in the present case was
at 625 mb (3,711 m), which again indicated moderate
possibility of hail. In general, WBZ heights from
1,520 m, to 3,660 m above ground level (AGL) are
associated with hail at the ground. The potential for
large hail is usually high for WBZ heights of 2130 m
to 3050 m AGL, and possible hail size decreases if
WBZ is below 1830 m or above 3350 m, AGL.
To begin with the 0000 hrs UTC sounding of
Kolkata was not exactly indicative of a very severe
thunderstorm activity, but when the sounding is
modified with 0700 hrs UTC temperature, dew point
and wind velocity, the situation changes significantly
and all the convective parameters indicated towards
severity. It can therefore be concluded that the
situation in the afternoon has become fully conducive
for supercell formation.

INDIAN J RADIO & SPACE PHYS, AUGUST 2006
274
5.2 Reflectivity
The radar reflectivity and radial velocity clearly
indicate the severity of the storm. The maximum
reflectivity picture (MAX_Z) for different stages of
storm between 0818 hrs UTC and 1248 hrs UTC has
been given in Fig. 2. Unlike the convectional PPI and
RHI pictures, the MAX_Z picture provides a three-
dimensional view of the thunderstorm. The maximum
reflectivity in a vertical column presented in dBz, the
location of the cloud, horizontal and vertical extents
are displayed by MAX_Z picture. In the 0818 hrs
UTC picture, one cluster of cell in its dissipating state
can be clearly seen over the station moving across the
northern part of Kolkata city. Although the cells were
disorganized and reflectivity varied between 35 and
50 dBz, it generated strong gusty wind ≈74 km/h
ahead of it, causing the first round of destruction in
the area. In the same picture, a very strong cell
located over Bankura, about 170 km WNW of
Kolkata can also be seen. From its very initial stage
this particular cell was remarkable in its reflectivity
and vertical extension. Unlike the other cells, the
reflectivity of this cell was around 60 dBz and vertical
extension exceeded 16 km. The boundaries were very
sharply defined, outside which reflectivity dropped to
36-40 dBz. The sharp boundary and high reflectivity
was an indication of its predominant hail composition.
The movement of this cell has been tracked in Fig.
3 between 0818 hrs UTC and 1348 hrs UTC. Moving
with an average speed of 40 km/h, the initial
movement of the cell was ESE, but subsequently it
took an easterly course. As it came within 90 km of
the station, the cell started mutilating and gust front
from the parent cell generated daughter cells in SSW
sector. Between 0918 and 1018 hrs UTC there was
further mutilation and few more cells developed in
SSW and SW sector. During this period echo-top
collapsed, its height reduced to 8 km; simultaneously
the downdraft started ahead of it and the gustiness of
the wind increased to 82 km/h. This caused the
second round of destruction, in which the perimeter
wall and a part of portico of Kolkata airport collapsed.
Thus during 0848-1018 hrs UTC, as the system
travelled between Bankura and Kolkata, this parti-
cular cell behaved like a supercell and there was very
little change in the features of the cell. Significantly,
as it moved east of the station, the cell again
intensified and this is evident in the sector picture
between 1148 and 1348 hrs UTC. As the cell regained
strength, the echo top again attained a height of 14 km
and it remained so till the cell went out of 250 km
range of DWR at around 1418 hrs UTC.
The cell caused further destruction in Bangladesh
as it traversed across the country. The fact that there
was no depletion in severity of the storm even after
sunset, suggests that it was the dynamic process rather
than the gust front or buoyancy, which sustained the
storm. In case when severe thunderstorm occurs at
night, it is usually associated with nocturnal low-level
jet (LLJ) that sets in after the cessation of solar
insolation. This LLJ provides the required conver-
gence, advection and lifting to the thunderstorm. The
1200 hrs UTC RS/RW sounding of Kolkata on that
day did report 50-95 knot wind between 6 km and 11
km. On comparison with 0000 hrs UTC wind pattern,
it is found that the core of high wind had descended
considerably and we believe that this has increased
the low-level shear and made the storm scale environ-
ment more favourable for sustenance of supercell
thunderstorm. The regeneration of cell east of the
station can be partly attributed to incursion of warm,
moist air in the system, as the storm enters the region
of southerly flow having maritime origin. During its
entire duration the core reflectivity of this cell
remained in excess of 55 dBz and even when
mutilation of cell occurred in SW quadrant (sector
picture: 1018 hrs UTC) the parent cell retained its
reflectivity.
5.3 Vertical profile of radar reflectivity
The environmental wind shear together with
updraft strength in a convective cell determines the
vertical distribution of reflectivity. The echo at low,
middle and upper levels tends to be vertically aligned
when the shear is relatively weak, or when the updraft
is strong. Using ground-based radar Yuter and Houze9
have suggested that updraft and high reflectivity tend
to coincide at high level, although the correlation is
weak. As the cell attains a mature stage, the liquid
water content is evenly distributed along the entire
column and this gives a uniform distribution of
reflectivity. Zisper and Lutz10
have reported that both
in tropical and mid-latitude meso-cyclonic system,
vertical profile of reflectivity exhibits a gradual
decrease in reflectivity with height above freezing
level, but no such gradient is observed in the present
case. This together with near absence of weak echo
region (WER) or bounded weak echo region (BWER)
in the cell can be attributed to the very strong strength
of updraft. As mentioned earlier, the vertical
distribution of reflectivity has remained uniform for

SINHA & PRADHAN: ANALYSIS OF SUPERCELL STORM OVER KOLKATA
Fig. 2--Maximum reflectivity picture at different stages of thunderstorm evolution [DNB: Dhanbad, PRL: Purulia, BNK: Bankura, KOL: Kolkafa, BPD: Baripada, BST: Basherhat, RSH: Rajshahi, JSR: Jassore, KLN: Khulna]

INDIAN J RADIO & *ACE PHYS, AUGUST 2006
Fig. +Structure and movement nf supercell [The cell regained its strength ns it crossed India and approached KLN (Khulnaf, Bangladesh]
the cell between QSrC8 and 0948 hrs UTC, which can be taken as mature phase of the cell. However, between 1048 and h108 hrs UTC, the collapse of echo-top can be clearly seen (Fig. 2) and this, in turn coincides with the peak gust recarded at 1105 hrs UTC at Airport obseruatory.
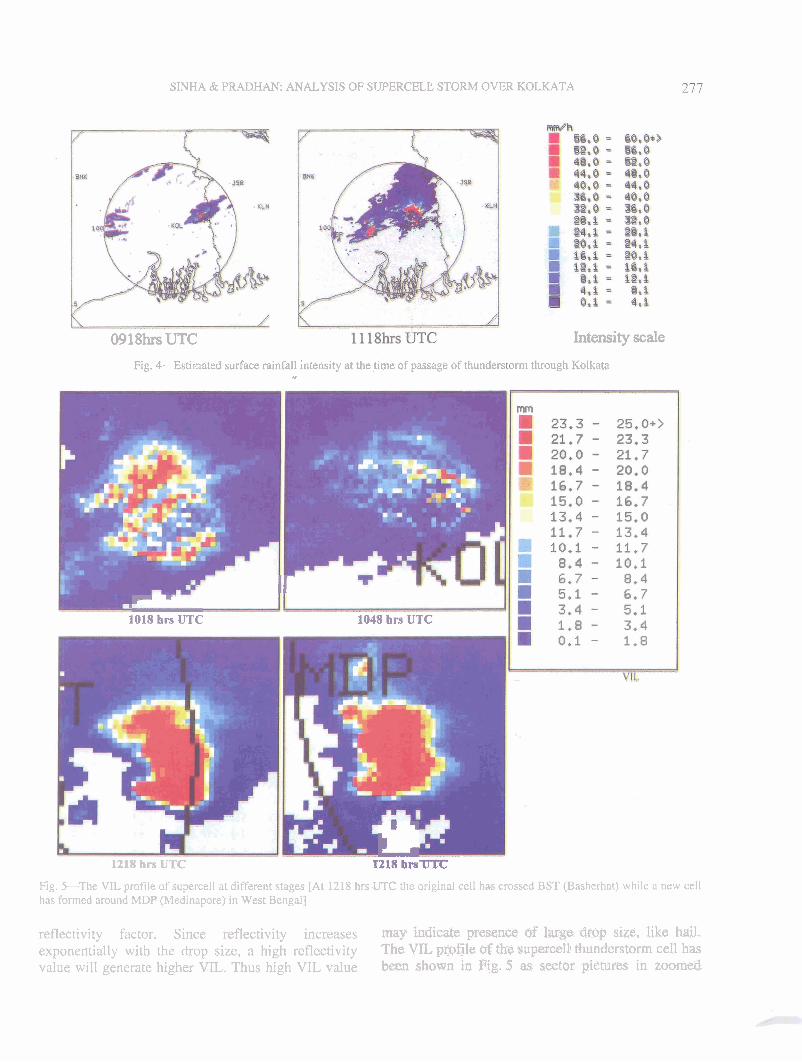
: 5.4 Surface rainfall intensity (Sm The SRI picture generated by the DWR at 0918
and 11 1 8 hrs UTC has been given in Fig. 4. In the 0918 hrs UTC picture, the cell located at NNE of the station gives a rainfall potengial of 52-56 mm/h, while the actual rainfall at Airpart between 0850 and 0905 hrs UTC was 16 mm, which comes out to be 54 mm/h. Similarly, during the second spell, the surface
rainfall inte&ity picture of 11 18 hrs UTC gave, an estimate of 60 m d , while the realized rain was 35 mm in 20 min, which is 105 mmlh. Therefore, the actual rain was much higher than the RADAR estimated rain. This discrepan~y can be attributed to the fact that the radar estimate was for a height of 1.5 km AGL. Besides, the A and h coefficients in Marshall-Palmer equation v - q from season to season and location to location.
-
5.5 Vertically integrated liquid Vertically integrated liquid [VIL) is u derived
product from Doppler reflectivity data. It converts reflectivity data into liquid water content value based on distribution of drop size and a coefficient based on
SINHA L PRADHAN: ANALYSIS OF SUPERCELI: STORM OVER KOLKATA
0918hrs UTC Intensity scale
Fig. 4-Estimated surface rainfall intensity at the time af passage of thunders "
It- r 1018 hrs UTC 1048 hrs UTC
--
1218 hrs UTC c 1218 hrs u l-c
)rrn through Kolkata
Fig. +The VIL profile of supercell at different stages [At 1218 hrs UTC the original cell has crossed BST (Basherhat) while a new cell has formed around MDF (Medinapore) in West Bengal]
reflectivity factor. Since reflectivity increases may indicate presence of luge drop size, like hail. exponentially with the drop size, a high reflectivity The VIL profile of the supercell thunderstorm cell has value will generate higher V&. Thus high VIL value be-en shown in Fig. 5 as sector pictures in zoomed

INDIAN J RADIO & SPACE PHYS, AUGUST 2006
Fig. &The hook shape echo of supercell at the time of its maximum intensity over Bankura
mode. In the 0848 hrs UTC picture when the cell was located over Bankura, the classical hook shape of the cell is distinctly visible (Fig. 6). The VIL value is around 23.3 mm on a scale of 0.1-25 mm. Such a high value clearly indicated the presence of large sized hail and this was confirmed by ground truth, as around 250 people were injured in Bankura district itself due to hailstorm. The 1218 hrs UTC picture shows the cell as it has moved east of the station. Once again the cell has regained strength and acquired hook shape. At the same time another strong cell has evolved over Midnapur at a distance of about 200 krn west of the station, which too can be seen in the next 1218 hrs UTC picture. Within 30 min this cell splits up and the stronger of the two cells attains a hook shape in its left flank.
Supercell thunderstorm displays an abrupt decrease in VIL during the collapsing phase of the storm, when echo top collapses and downdraft increases with
corresponding decrease in the updraft. This is again clearly depicted in the 1018 and 1048 hrs UTC pictures as the supercell collapses over the station. However, this interpretation comes with a rider that the VIL is airmass dependent. Convection in colder air-mass may produce large sized hail even with low VIL value, while the convection in warmer air-mass may not produce significant hail activity even with large VIL. Another limitation of VIL interpretation is that, in effect it is the integration of reflectivity in the entire column of the cell and as such storm having greater height will give higher value of VIL than a shorter cell; and this may be a reason for a consistently high value of VIL in the present case.
Conclusions The features and sequence of weather events do
~dicate the presence of supercell within the thunder- , qrm. The entire duration of activity exceeded 12 h

SINHA & PRADHAN: ANALYSIS OF SUPERCELL STORM OVER KOLKATA
279
and during this period the storm underwent a series of
generation and regeneration. This indicates the
complementary role played by the updraft and
downdraft. This is unlike the ordinary thunderstorm,
where the two have an adversary role to play. This is
possibly the first documented study of a supercell
over Indian region using DWR and the interpretation
of Doppler signature has been found to be in good
agreement with the ground observations. However, as
more and more case study of severe thunderstorm
shall be undertaken, the maturity in signature
interpretation will also increase.
This study also underlines the usefulness of DWR
as a tool for both diagnostic and prognostic study.
Whenever radar data at shorter interval is available,
the evolution of meso-scale convective system can be
studied using a very useful method suggested by
Starostin11
. The method called Moving Reference
method, is particularly useful for tracing the
movement of squall line and this can be used in future
studies.
References 1 Starostin A, The confluence of the convective lines,
Preprints, 28th Conference on Radar Meteorology, American
Meteorological Society, USA, (1997) 455.
2 Davies-Jones R, Burgess D & Foster M, Test of helicity as a
tornado forecast parameter. Preprints, 16th Conference on
S.L.S, American Meteorological Society (USA), (1990) 588.
3 Weisman M L & Klemp J B, Characteristics of isolated
convective storms. Mesoscale meteorology and forecasting,
American Meteorological Society, Boston (USA), (1986)
331.
4 Rasmussen E N & Wilhelmson R B, Relationships between
storm characteristics and 1200 GMT hodographs, low-level
shear, and stability. Preprints, 13th Conf. Severe Local
Storms (Tulsa, OK), American Meteorological Society
(USA), (1983) J5.
5 Lopez L, Marcos J L, Sanchez J L, Castro A & Fraile R,.
CAPE values and hailstorms on northwest Spain, Atmos Res
(Netherlands), 56 (2001) 147.
6 Weisman M L, The genesis of severe long-lived bow echoes,
J Atmos Sci (USA), 50 (1993) 645.
7 Pradhan D & Sinha V, Thunderstorm genesis over Kolkata
A case study, Vatavaran AFAC J Meteorol (India), 29 (2005)
20.
8 Rasmussen E N & Blanchard D O, Baseline climatology of
sounding-derived supercell and tornado forecast parameters.
Wea Forecast (USA), 13 (1998) 1148.
9 Youter S E & Houze R A, Three-dimensional kinematics and
microphysical evolution of Florida cumulonimbus, Mon Wea
Rev (USA), 123 (1995) 1941.
10 Zisper E J & Lutz K R, The vertical profile of radar
reflectivity of convective cells; A strong indicator of storm
intensity and lightning probability, Mon Wea Rev (USA), 122
(1994) 1751.
11 Starostin A, Livshits E M & Shvetsov V S, Mesoscale
structure of the radar echo fields from convective clouds in
Maldovia, Russian Meteorol and Hydro (USSR), 10 (1983)
55.