Supecritical Fluid Extraction - THESES ET MEMOIRES DE L'UDS
195
Universite Louis Pasteur – Strasbourg I Faculte de Chimie Th` ese pr´ esent´ ee pour obtenir le grade de Docteur de l’Universit´ e Louis Pasteur de Strasbourg I Discipline : chimie-physique Supecritical Fluid Extraction: Spectroscopic Study of Interactions Comparison to Solvent Extraction par Anne Rustenholtz Farawila Soutenue publiquement le 8 juin 2005 Dirig´ ee par Dr Isabelle BILLARD & Professor Chien M. WAI Membres du jury : Directeur de Th` ese : Dr Isabelle BILLARD, HDR, IReS, Strasbourg Co-directeur de Th` ese : Prof. Chien M. WAI, Prof., Universit´ e de l’Idaho, USA Rapporteur Interne : Prof. Georges WIPFF, Prof, Facult´ e de Chimie, Strasbourg Rapporteur Externe : Dr St´ ephane SARRADE, HDR, CEA, Pierrelatte Rapporteur Externe Pr´ ealable : Dr Oleg EGOROV, Senior Scientist, Pacific North- west National Laboratory, USA
Transcript of Supecritical Fluid Extraction - THESES ET MEMOIRES DE L'UDS

Universite Louis Pasteur ndash Strasbourg I
Faculte de Chimie
These presentee pour obtenir le grade deDocteur de lrsquoUniversite Louis Pasteur de Strasbourg I
Discipline chimie-physique
Supecritical Fluid ExtractionSpectroscopic Study of InteractionsComparison to Solvent Extraction
par
Anne Rustenholtz Farawila
Soutenue publiquement le 8 juin 2005
Dirigee par Dr Isabelle BILLARD amp Professor Chien M WAI
Membres du jury Directeur de These Dr Isabelle BILLARD HDR IReS StrasbourgCo-directeur de These Prof Chien M WAI Prof Universite de lrsquoIdaho USARapporteur Interne Prof Georges WIPFF Prof Faculte de Chimie StrasbourgRapporteur Externe Dr Stephane SARRADE HDR CEA PierrelatteRapporteur Externe Prealable Dr Oleg EGOROV Senior Scientist Pacific North-west National Laboratory USA
to Hobbi
Remerciements - Acknowledgment
I thank je remercie
bull Mes Parents pour leur aide et leur soutien tout au long de ma scolarite ainsique le reste de ma famille
bull My husband for his love and support I would not have finished this projecton time without him I also thank him for being my first and best proof-readerand for his help with LATEX and Gnuplot
bull Dr Isabelle Billard pour mrsquoavoir enseignee les bases du travail de recherchescientifique et pour mrsquoavoir mise en contact avec Professeur Chien M Wai etde ce fait permis drsquoaller aux Etats Unis Merci aussi pour ses conseils et lesdiscussions interessantes que nous avons partagees tant par email que de vivevoix
bull The University of Idaho and Professor Chien M Wai for his kindness hisencouragement and his help with his scientific knowledge and ideas as well ashis financial support all along my PhD research
bull Les membres du Jury Professeur Wipff avec lequel jrsquoai eu de tres interessantesconversations lors de mes passages en France et Dr Stephane Sarrade que jrsquoaieu le plaisir de rencontrer pour la premiere fois lors de ma soutenance Dr OlegEgorov for his great comments that helped me to improve this thesis and forhis friendship
bull Pacific Northwest National Laboratories and Mr John Fulton for his kindnessand for sharing his laboratory and his knowledge which were indispensable forthe FTIR experiments
bull AREVA and Mr Syd Koegler for allowing me to perform some practical re-search in one of Framatome-ANP laboratories in Richland Washington
bull Dr Alexander Blumenfeld for sharing his knowledge of RMN
bull Mr Thomas Eichenberg Dr Scott Franz Miss Virginia Sliman and Dr PeterHalverson for their editing help and their comments that helped me to improvethis thesis Dr Michel Billaux pour ses commentaires et ses corrections dans lapartie Fran caise
Remerciements - Acknowledgment 6
bull M Antony Jean-Mertens pour son amitie et pour mrsquoavoir ouvert lrsquoesprit surdrsquoautres mondes et mrsquoavoir fait decouvrir les Etats-Unis Mes autres amis alsa-ciens avec qui jrsquoai passe des moments inoubliables
bull Dr Mari Hannele Mannila for being my best ldquosac de sablerdquo during unforgettablemotorcycle trips in the wild North West of the United States I owe her mybiggest laughs and she is the best friend that someone should hope for Kitos
bull My Idahorsquos friends Abeer Hatem Mohammed et al for their friendship andthe good time that we spent together
bull Mme Beatrice Henrioulle pour srsquoetre occupee de sa poupouille afin que je puissefinir la redaction de cette these ainsi que pour sa bonne humeur generale sonamitie et ses encouragements
bull Enfin mon fils Mohamed Yousef III pour mrsquoavoir laissee un peu de temps pourecrire entre deux pleurs et deux gazouillis
Contents
Remerciements - Acknowledgment 5
Resume 19
Titre 19
Resume Court 19
Mots Clefs 20
Introduction 20
01 Interactions entre Ethers Couronne et Eau 21
011 En Milieu Supercritique 21
012 Dans des Solvants Classiques 24
013 Role de lrsquoeau dans lrsquoequilibre etabli lors de lrsquoextraction du cesium
par les ethers couronne 25
02 Interaction entre le TBP lrsquoEau et lrsquoAcide Nitrique 26
021 Interaction entre le TBP et lrsquoEau 26
022 Interaction entre le TBP lrsquoEau et lrsquoAcide Nitrique 28
023 Mise en Pratique Extraction de lrsquoUranium a lrsquoAide de Phos-
phate de Tributyle et drsquoAcide Nitrique 29
Conclusion 31
General Introduction 33
1 Crown Ether-Water Interaction 49
Introduction 49
CONTENTS 8
11 Crown Ether-Water Interaction In Supercritical CO2 53
Introduction 53
111 Experimental Work 58
112 Summary of the Results 61
113 Additional Description 62
Conclusion 66
12 Crown Ether-Water Interaction in Solvents 69
Introduction 69
121 Experimental Section 75
122 Summary of Results 77
123 Comparison to FT-IR Results in CO2 77
Conclusion 80
13 Introduction to Cesium Extraction Equilibrium Using Crown Ethers 84
Introduction 84
131 Experimental Work 86
132 Calculations 88
133 Results and Discussion 93
Conclusion 95
Conclusion 97
2 TriButyl PhosphatendashWaterndashNitric Acid Interaction 99
Introduction 99
21 Interaction of Tributyl Phosphate with Water 105
Introduction 105
211 Interaction of Tributyl Phosphate with Water in Supercritical
CO2 Analyzed by Fourier Transform Infra-Red Spectroscopy 105
212 Interaction of Tributyl Phosphate with Water in Solvent Ana-
lyzed by Nuclear Magnetic Resonance Spectroscopy 118
CONTENTS 9
Conclusion 129
22 Interactions with Nitric Acid Analyzed by Nuclear Magnetic Resonance 131
Introduction 131
221 Experimental Work 131
222 Results and Discussion 134
Conclusion 143
23 Practical Application Uranium Extraction
from Solid Matrices 144
Introduction 144
231 Experimental Work 145
232 Extraction of UO2 from Different Matrices 152
233 Stripping of the Uranium from TBP Media to Water 157
Conclusion 162
Conclusion 164
General Conclusions 167
A Mass Yield of the Fission Element 171
B Decay Series 173
C Acronyms 177
D Curriculum Vitae 179
Address 179
Academic History 179
Master Publications and Conference Presentations 180
PhD Publications and Conference Presentations 180
E Abstract 181
CONTENTS 10
F An FT-IR Study of Crown Ether-Water Complexation in Supercrit-
ical CO2 183
G Partition Coefficients and Equilibrium Constants of Crown Ethers
between Water and Organic Solvents Determined by Proton Nuclear
Magnetic Resonance 191
H Characterization of a Tri-n-butyl Phosphate-Nitric Acid Complex
a CO2-Soluble Extractant for Dissolution of Uranium Dioxide 197
List of Figures
1 Schema experimental de la spectroscopie infrarouge a transformee de
Fourier 22
2 Structure moleculaire des trois types de liaisons entre ethers couronne
et eau Conformations pontee (a) simple (b) et en sandwich (c) 23
3 Une des configurations possible pour les liaisons hydrogenes entre une
molecule de TBP drsquoacide nitrique et drsquoeau 29
4 Schema experimental pour lrsquoextraction drsquoUO2 30
5 World map of nuclear reactors from the International Nuclear Safety
Center (INSC) web page1 34
6 Gamma radiation map in the Chernobyl area results of the May 29
1986 Gamma Radiation Survey2 37
7 Phase diagram for CO2 the shaded areas are the subcritical and su-
percritical fluid regions 41
8 Mass (g) of elements (150 days after discharge from a PWR) per ton
(Mg) of uranium (freshly loaded in the reactor) versus the atomic num-
ber of the element3 43
9 Representation of a crown ether (18-crown-6) and the TBP and nitric
acid molecules 46
11 Molecular structure of 12-Crown-4 (a) 15-Crown-5 (b) 18-Crown-6
(c) 24-Crown-8 (d) 51
LIST OF FIGURES 12
12 Molecular structure of dicyclohexano-18-Crown-6 (a) and of dibenzo-
18-Crown-6 (b) 52
13 Fourier Transform Infra-Red (FT-IR) spectrometer 55
14 Fourier Transform Infra-Red (FT-IR) experimental setup 59
15 Molecular structure of the water-crown ether interaction in the bridge
form (a) the single configuration (b) and the sandwich form (c) 62
16 Molar fraction of crown ether bonded to water k versus density at
constant pressure (20 MPa) Lines are guides for the eyes and do not
have any theoretical or analytical value 65
17 Molar fraction of crown ether bonded to water k versus density at
constant temperature (40 C) Lines are guides for the eyes and do not
have any theoretical or analytical value 66
18 Dependence of ln K on 1000T at 20 MPa 67
19 Dependence of free water [D2O] on the equilibrium constant K 68
110 Potential energy of a nucleus with a spin state I=12 outside and inside
a magnetic field 71
111 Nuclear magnetic resonance experiment4 73
112 Acquisition sequence for a nuclear magnetic resonance experiment 74
113 P-NMR spectrum of the ethanal molecule (CH3CHO)5 81
114 coupling due to spin-spin interactions and relative intensities 82
115 Typical PNMR spectra of 18-crown-6 in the CDCl3 phase The con-
centrations of 18-crown-6 after equilibrium with water are 000 0002
0075 and 0153 molmiddotLminus1 (from top to bottom) and the water peaks are
at 1565 1874 2393 and 2668 ppm respectively 83
116 Molecular structure of dicyclohexano-18-Crown-6 (a) and of Cesium
picrate (b) 86
117 Typical PNMR spectrum for DCH18C6 (at 04 molmiddotLminus1) with water
and cesium picrate (at 30 mmolmiddotLminus1) in the CDCl3 phase) 87
LIST OF FIGURES 13
118 Typical PNMR spectrum for DCH18C6 (at 005 molmiddotLminus1) with water
and cesium picrate (at 8 mmolmiddotLminus1) in the CDCl3 phase) 88
119 Total cesium picrate concentration versus water concentration in the
organic phase for different initial ligand (L = DCH18C6) concentra-
tions (from 005 to 04 molmiddotLminus1) 93
120 Total water concentration versus total ligand concentration in the or-
ganic phase 94
21 One of the possible configurations of hydrogen bonds between a TBP
a nitric acid and a water molecule 101
22 Principal steps of the Purex process 104
23 FT-IR spectra of free and bonded D2O at different TBP concentrations
(0-016 molmiddotLminus1) and at one fixed D2O concentration (0054 molmiddotLminus1)
in supercritical CO2 (40 C 20 MPa) 107
24 Possible configurations of the hydrogen bond between a D2O and a
TBP molecule 107
25 Possible configurations of the hydrogen bond between a D2O and two
TBP molecules 108
26 Density effect on the equilibrium constant K at constant temperature
(N 40 C) and at constant pressure (H 20 MPa) 110
27 Molar fraction of TBP bonded to water k versus density at constant
temperature (N 40 C) and at constant pressure (H 20 MPa) 111
28 Concentration of free D2O versus temperature at 20 MPa 112
29 Free D2O concentration versus density for at constant temperature (N
40 C) and at constant pressure (H 20 MPa) 112
210 Dependence of ln K on 1000T (T in K) at 20 MPa 113
211 Dependence of the free water concentration [D2O] on the equilibrium
constant K 114
LIST OF FIGURES 14
212 linear regression of the molar solubility of water67 in CO2 versus the
temperature at constant pressure (20 (N) and 40 (H) MPa) 116
213 Volume of water droplets when 500microL of water saturated TBP is mixed
with CO2 in a 10 mL cell versus the temperature at constant pressure
(20 MPa) 117
214 300MHz 1H-NMR spectra of TBPmiddotH2O in CDCl3 119
215 Enlargement of a 500MHz 1H-NMR spectra of TBPmiddotHNO3middotH2O in
CDCl3 123
216 Possible configuration for the TBP hydrate 124
217 Chemical shift observed of water in CDCl3 and in TBP versus the
molecular fractions of free water (H) and of bonded water (N) The
dashed lines corresponds to their linear regression fits 125
218 Chemical shift observed (black points) and calculated (thin line) of
water in CDCl3 and in TBP versus total water concentration in the
organic phase 126
219 Chemical shift observed of CHCl3 in TBP and in CDCl3 versus the
TBP concentration in the organic phase 127
220 Total water ([H2O]0org) versus total TBP ([TBP]0org) in the organic
phase 128
221 Chemical shift of nitric acid observed from the droplets (H) and from
nitric acid solutions in water (N) and calculated (dashed line) using
equation (229) versus total nitric acid concentration 132
222 A typical proton NMR spectrum of TBPmiddot(HNO3)xmiddot(H2O)y with a benzene-
d6 insert The sample was prepared by mixing 10 mL of 155M
HNO3 with 40 mL of 98 TBP 133
223 Chemical shift observed of nitric acid and water in TBP versus the
mole ratio of nitric acid on TBP in the organic phase 136
LIST OF FIGURES 15
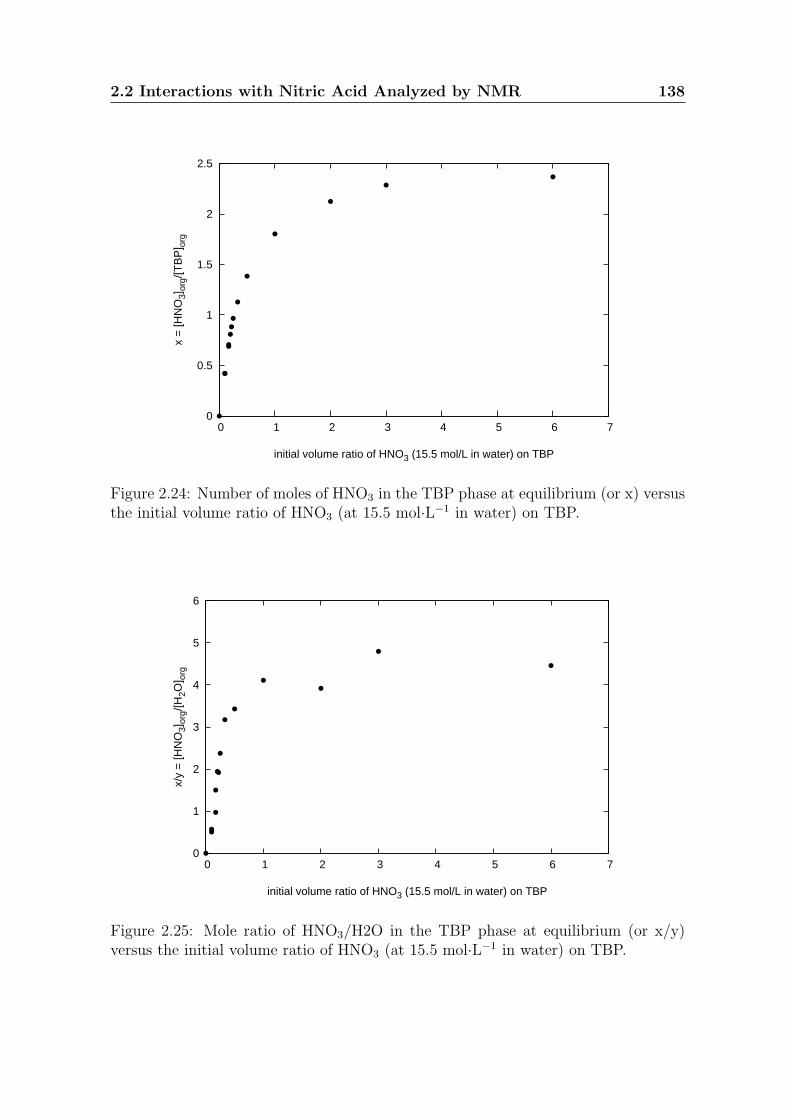
224 Number of moles of HNO3 in the TBP phase at equilibrium (or x)
versus the initial volume ratio of HNO3 (at 155 molmiddotLminus1 in water) on
TBP 138
225 Mole ratio of HNO3H2O in the TBP phase at equilibrium (or xy)
versus the initial volume ratio of HNO3 (at 155 molmiddotLminus1 in water) on
TBP 138
226 Proton NMR spectrum of TBPmiddot(HNO3)xmiddot(H2O)y in CDCl3 The com-
plex was prepared by mixing 4 mL of TBP and 1 mL of 155 molmiddotLminus1 HNO3
volume ratio of TBPmiddot(HNO3)xmiddot(H2O)y to CDCl3 = 11 139
227 Proton NMR spectrum of TBPmiddot(HNO3)xmiddot(H2O)y in CDCl3 The
complex was prepared by mixing 2 mL of TBP and 2 mL of 155
molmiddotLminus1 HNO3 volume ratio of TBPmiddot(HNO3)xmiddot(H2O)y to CDCl3 = 11 139
228 Chemical shift of the nitric acid and the water versus total water and
nitric acid concentration in the organic phase 141
229 Concentration of nitric acid in the aqueous phase versus initial TBP
concentration in the organic phase 142
230 Total water and nitric acid concentration in CDCl3 versus initial TBP
concentration 142
231 UO2 extraction experimental setup 147
232 Gamma spectra of the background and of uranyl ion enriched at 31
in 235U and at 87 gmiddotLminus1 of uranium in water and of the UO2+2 ion
(29 235U) at 24 gmiddotLminus1 in TBP 150
233 Calibration curves for UO2+2 ion in water (H 31 235U) and in TBP
(N 29 in 235U) 151
234 gamma spectra of the background and of the three kind of matrices
(R L and Y) used for extraction 154
235 gamma spectra of the background and of the uranyl ion (29 U) in
the TBP stripped solution at and in the aqueous solution 158
LIST OF FIGURES 16
236 Total mass of uranium stripped versus total volume of water used
The line is a guide for the eyes and does not have any theoretical or
analytical value 159
237 Partition of HNO3 between the organic and the aqueous phases at 50
C 20 MPa and with a TBPwater volume ratio of 119 160
238 Partition of uranium between the organic and the aqueous phases for
different initial nitric acid concentrations The experiment was per-
formed at 50 C 20 MPa and with a TBPwater volume ratio of 119
Lines are guides for the eyes and do not have any theoretical or ana-
lytical value 162
239 Lost of efficiency when the volume ratio is 11 between the two phases
(H) and when the temperature is 24 C (N) 163
List of Tables
1 Supercritical fluids critical values 42
11 Equilibrium parameters for water-crown-ether interaction in supercrit-
ical fluids 64
12 Values of I the quantum spin number for different nucleus 70
13 Comparison of the values of the equilibrium constants K1 and K2 and
of the molar fractions of ligand complexed to water k1 and k2 78
14 Comparison of water solubilities in solvents and in CO2 79
21 Equilibrium parameters for water-TBP interaction in supercritical CO2110
22 Antisolvent effect for a water saturated TBP mixed with CO2 at dif-
ferent densities 116
23 intensities and coupling constants of the TBP multiplets 122
24 Composition of TBPmiddot(HNO3)xmiddot(H2O)y complexes 137
25 Composition of the different matrices used for extraction determined
by mass spectroscopy 146
26 Optimal parameters for the supercritical CO2 extraction 157
27 Optimum uranium recovery efficiencies 157
28 Results of the stripping experiments at 50C 20 MPa and with a 119
TBP to water volume ratioa 161
A1 Mass (g) and radioactivity (Ci) of elements (150 days after discharge
from a PWR) per ton (Mg) of uranium (freshly loaded in the reactor)
for all elements 172
LIST OF TABLES 18
B1 Main decay energies for 238-Uranium 174
B2 Main decay energies for 235-Uranium 175
Resume
Titre
Extraction en Milieu Supercritique Etude Spectroscopique des Interactions ndash Com-
paraison avec des Solvants Classiques
Resume Court
Le dioxyde de carbone supercritique (SF-CO2) a ete choisi afin drsquoetudier lrsquoextraction
en milieu supercritique drsquoions metalliques tels que le cesium et lrsquouranium Un interet
particulier a ete porte au role de lrsquoeau lors de ces extractions ainsi qursquoa son interaction
avec des agents chelateurs (AC) En premiere partie les ethers couronne ont ete
choisis comme AC du cesium et leur interaction avec lrsquoeau a ete etudiee dans le
SF-CO2 en utilisant la spectroscopie InfraRouge a Transformee de Fourier (IR-TF)
Une configuration sandwich entre deux ethers couronne et une molecule drsquoeau a ete
observee dans le SF-CO2 Pour les configurations simple et pontee lrsquoequilibre a ete
defini et lrsquoenthalpie de formation de la liaison hydrogene a ete calculee Ces resultats
ont ensuite ete compares a ceux obtenus dans des melanges de CHCl3 et de CCl4 en
utilisant la spectroscopie a Resonance Magnetique Nucleaire (RMN) Pour conclure
cette premiere partie le role de lrsquoeau a ete etudie lors de lrsquoextraction du picrate de
cesium par le DCH18C6 et les constantes drsquoequilibre ont ete determinees
Dans une deuxieme partie lrsquoextraction de lrsquouranium a ete etudiee dans le SF-CO2
Des complexes de Phosphate de TriButyle (TBP) drsquoeau et drsquoacide nitrique ont ete
utilises comme AC et oxydants LrsquoIR-TF a ete utilisee pour etudier lrsquointeraction
LIST OF TABLES 20
entre le TBP et lrsquoeau dans le SF-CO2 Ces resultats ont ete compares a ceux trouves
dans le CHCl3 en utilisant la RMN Cette meme spectroscopie a ete utilisee pour
comprendre les interactions entre lrsquoacide nitrique le TBP et lrsquoeau seuls puis dissous
dans du CHCl3 La formation de microgouttelettes drsquoacide et drsquoeau dues a lrsquoeffet
anti-solvant a ete observee et quantifiee Pour conclure ce travail de these jrsquoai reussi
a optimiser lrsquoextraction et la recuperation drsquouranium enrichi provenant de cendres
drsquoincineration de dechets de fabrication de combustible nucleaire Un complexe de
TBP drsquoeau et drsquoacide nitrique dissous dans du SF-CO2 a ete utilise a cette fin
Mots Clefs
RMN ndash IR ndash Extraction ndash Fluides supercritiques ndash CO2 ndash Dioxyde de carbone ndash
Solvants ndash Acide nitrique ndash Uranium ndash Cesium ndash Eau ndash Ethers couronne ndash TBP ndash
Uranyle ndash Retraitement ndash Dechets nucleaires ndash Liaison hydrogene ndash Effet anti-solvant
Introduction
Mon travail de these est base sur lrsquoextraction de cations metalliques a lrsquoaide de diox-
ide de carbone supercritique Lrsquouranium et le cesium ont ete specialement choisis
pour leur abondance dans les dechets nucleaires drsquoorigines diverses Lrsquoeau fait partie
integrante de ces systemes et jrsquoai concentre une partie de mon travail de recherche
sur le role de lrsquoeau dans ces extractions Mais avant de discuter en details ce tra-
vail je vais decrire brievement les caracteristiques de lrsquoextraction a lrsquoaide de fluides
supercritiques
Les fluides supercritiques du fait de leurs proprietes uniques sont de plus en
plus utilises pour lrsquoextraction drsquoions metalliques provenant de materiaux liquides ou
solides Le fluide le plus souvent utilise dans ces procedes est le dioxyde de carbone
(CO2) Il a de nombreux avantages il est peu toxique bon marche et relativement
benin pour lrsquoenvironnement ses constantes critiques sont moderees (Tc = 310 C et
Pc = 738 MPa) et son pouvoir de solvatation peut etre modifie par simple changement
01 Interactions entre Ethers Couronne et Eau 21
de temperature etou de pression
Neanmoins le dioxyde de carbone est un solvant apolaire et necessite souvent
lrsquoadjonction drsquoagents chelateurs pour faciliter lrsquoextraction drsquoions metalliques Afin
drsquoameliorer qualitativement et quantitativement lrsquoextraction ces agents doivent avoir
des proprietes specifiques ils doivent etre solubles dans le CO2 et selectifs de lrsquoion
metallique que lrsquoon veut extraire Durant mon travail de these deux types drsquoagents
chelateurs ont ete etudies les ethers couronne et le phosphate de tributyle
01 Interactions entre Ethers Couronne et Eau
Les ethers couronne sont des macrocycles pouvant abriter au centre de leur cavite des
cations de differentes tailles Ils sont souvent utilises pour extraire des ions alcalins
tel que le lithium le potassium ou le cesium La taille de la cavite depend de lrsquoether
couronne utilise le rendant generalement specifique a un cation donne Les ethers
couronne sont relativement solubles dans le dioxyde de carbone et dans de nombreux
solvants Ils sont donc indiques en tant qursquoagents chelateurs dans le traitement de
dechets contenant des cations metalliques Ils peuvent etre utilises par exemple pour
le traitement de dechets nucleaires contenant du cesium 137 Ce traitement peut etre
realise a lrsquoaide de dioxyde de carbone supercritique
De tels dechets sont souvent extraits de matrices contenant de lrsquoeau Lrsquoeau fait
partie integrante du procede drsquoextraction Il est donc necessaire de connaıtre les
interactions entre lrsquoeau et les ethers couronne dans differents solvants
011 En Milieu Supercritique
Pour cette etude la spectroscopie infrarouge a transformee de Fourier (IR-TF) a ete
utilisee comme methode drsquoanalyse (Figure 1) Cette methode permet de distinguer
trois types de liaisons entre les ethers couronne (18-couronne-6 pour cette etude) et
lrsquoeau Le D2O a ete prefere a lrsquoH2O afin drsquoeviter la superposition des raies intenses
provenant du dioxyde de carbone entre 3500 cmminus1 et 3800 cmminus1 et celles de lrsquoeau
01 Interactions entre Ethers Couronne et Eau 22
Figure 1 Schema experimental de la spectroscopie infrarouge a transformee deFourier
Le premier type de configuration nrsquoest observe qursquoa haut rapport de concentra-
tion entre les ethers couronne et le D2O il srsquoagit drsquoun ldquosandwichrdquo compose de deux
molecules de 18-couronne-6 entourant une molecule drsquoeau (Figure 2 c) A faibles rap-
ports de concentrations une molecule drsquoeau peut etre liee a un seul ether couronne de
deux manieres differentes (Figure 2 a et b) Le premier type de configuration est dit
ponte et consiste en deux liaisons hydrogene entre le D2O et deux atomes drsquooxygene
provenant de la cavite de 18-couronne-6 Le deuxieme type de configuration est dit
simple le D2O forme une seule liaison hydrogene avec un atome drsquooxygene provenant
de la cavite de lrsquoether couronne
Les constantes drsquoequilibre de ces deux types de configurations ont ete calculees
et varient entre 16(4) et 9(2) Lmiddotmolminus1 pour la configuration simple et entre 10(3) et
5(2) Lmiddotmolminus1 pour la configuration pontee lorsque la densite du dioxyde de carbone
01 Interactions entre Ethers Couronne et Eau 23
Figure 2 Structure moleculaire des trois types de liaisons entre ethers couronne eteau Conformations pontee (a) simple (b) et en sandwich (c)
augmente de 850 a 960 gmiddotLminus1 La mesure des constantes drsquoequilibre a differentes
temperatures et a pression constante a permis de calculer lrsquoenthalpie de formation
des deux complexes consideres Elle vaut -12(2) kJmiddotmolminus1 pour le complexe simple
et -38(3) kJmiddotmolminus1 pour le complexe ponte Ces valeurs sont en accord avec celles
reportees pour des solvants classiques
Lrsquoequilibre entre la forme pontee et la forme simple est decrit comme suit
2 18C6 + 2 D2O 18C6middotD2Osimple + 18C6middotD2O
pontee (1)
A partir de cet equilibre la constante drsquoequilibre K est donnee par
K =[18C6middotD2O
simple][18C6middotD2Opontee]
[D2O]2[18C6]2= Ks middotKp (2)
avec
Ks =[18C6middotD2O
simple]
[D2O][18C6]et Kp =
[18C6middotD2Opontee]
[D2O][18C6](3)
Ceci mrsquoa permis de comparer ces resultats a ceux obtenus par la spectroscopie
RMN (Resonance Magnetique Nucleaire) cette derniere ne permettant pas de dis-
tinguer la forme pontee de la forme simple La constante drsquoequilibre K varie entre
34(4) et 300(30) L2middotmolminus2 lorsque la densite du CO2 augmente a pression constante
01 Interactions entre Ethers Couronne et Eau 24
(sim20 MPa) Dans les meme conditions la fraction molaire k drsquoether couronne liee a
lrsquoeau varie entre 33(3) et 54(5)
012 Dans des Solvants Classiques
Lrsquointeraction ethers couronneeau dans des melanges de chloroforme (CHCl3) et de
tetrachlorure de carbone (CCl4) a egalement ete etudiee afin de determiner lrsquoinfluence
du solvant sur cette interaction Pour cette etude la RMN a ete utilisee comme
methode drsquoanalyse
La RMN ne permet pas de distinguer les deux types de configurations possibles
(simple et pontee) entre un ether couronne et une molecule drsquoeau De ce fait les
differentes configurations ne peuvent pas etre precisees par cette methode Il faut
aussi noter que les concentrations choisies sont suffisamment faibles pour que la con-
figuration ldquosandwichrdquo entre deux molecules drsquoether couronne et une molecule drsquoeau
ne puisse pas etre observee Lrsquoequilibre est donc decrit par la formation drsquoun com-
plexe 11 entre une molecule drsquoeau et un ether couronne en rapide echange avec des
molecules non complexees drsquoeau et de ligand
La fraction molaire k drsquoether couronne complexe avec une molecule drsquoeau a ete
calculee pour differents ethers couronne Si k augmente avec la taille de la cavite de
15(1) pour 12-couronne-4 a 97(5) pour 18-couronne-6 lrsquoaddition de tetrachlorure
de carbone abaisse la valeur de k pour tous les ethers couronne en equilibre avec lrsquoeau
et la constante est proche de zero dans le CCl4 pur Au contraire le coefficient de
partage des ethers couronne entre la phase organique et la phase aqueuse augmente
exponentiellement avec le pourcentage de CCl4 dans cette phase
Cette etude montre que lrsquointeraction entre lrsquoeau et les ethers couronne depend
fortement de la nature du solvant utilise Il a ete demontre qursquoun solvant a faible con-
stante dielectrique comme le CCl4 nrsquoest pas favorable a la formation drsquoun complexe
entre lrsquoether couronne et lrsquoeau Ceci a aussi ete demontre pour le dioxyde de car-
bone a haute pression et temperature Lorsque la valeur de la constante dielectrique
01 Interactions entre Ethers Couronne et Eau 25
augmente en utilisant le CHCl3 comme solvant ou lorsque le CO2 est utilise a basse
pression et temperature les ethers couronne sont plus enclins a former un complexe
avec lrsquoeau Ces resultats sont importants car lrsquoeau joue un role primordial dans
lrsquoextraction drsquoions metalliques utilisant des ethers couronne comme extractant
013 Role de lrsquoeau dans lrsquoequilibre etabli lors de lrsquoextractiondu cesium par les ethers couronne
La RMN comme precedemment a ete utilisee en tant que methode drsquoanalyse pour
cette etude Lrsquointroduction de cesium (sous la forme de picrate de cesium) dans
lrsquoequilibre induit de nouvelles relations drsquoequilibre dans la phase organique Elle sont
decrites comme suit
CsP + L CsPL avec K1 =[CsPL]
[CsP][L](4)
CsPL + L CsPL2 avec K2 =[CsPL2]
[CsP][L](5)
L + H2O LmiddotH2O avec Ka =[LmiddotH2O]
[L][H2O](6)
CsPL + H2O CsPLmiddotH2O avec Kb =[CsPLmiddotH2O]
[CsPL][H2O](7)
CsPL2 + H2O CsPL2middotH2O avec Kc =[CsPL2middotH2O]
[CsPL2][H2O](8)
avec P pour picrate et L pour ligand (dicyclohexane18-couronne-6 ou DCH18-couronne-
6)
Les resultats de lrsquointeraction entre DCH18-couronne-6 et lrsquoeau sont similaires a
ceux trouves precedemment sans addition de cesium En effet la fraction molaire k
drsquoether couronne lie a lrsquoeau vaut 73(8) et la constante drsquoequilibre Ka vaut 38(13)
Lmiddotmolminus1 Il a egalement ete montre que la constante Kc est nulle Il nrsquoy a donc pas
de formation de sandwich entre deux ethers couronne un picrate de cesium et une
molecule drsquoeau La constante K2 est egale a 47(15) Lmiddotmolminus1 ce qui implique qursquoen
lrsquoabsence drsquoeau le sandwich entre deux ethers couronne et un picrate de cesium
02 Interaction entre le TBP lrsquoEau et lrsquoAcide Nitrique 26
est prefere au complexe simple ne comprenant qursquoun ether couronne et un picrate de
cesium Quant a la constante Kb elle vaut 27(7) Lmiddotmolminus1 ce qui indique une preference
pour le complexe hydrate CsPLmiddotH2O sur celui non hydrate Ces resultats montrent
lrsquoimportance de lrsquoeau dans lrsquoextraction drsquoions metalliques a lrsquoaide de polyethers macro-
cycliques
02 Interaction entre le TBP lrsquoEau et lrsquoAcide Ni-
trique
Le phosphate de tributyle (TBP) est employe depuis des annees dans le systeme
PUREX (Plutonium URanium EXtraction) pour extraire et separer lrsquouranium Le
CO2 peut remplacer avantageusement le dodecane ou le kerosene habituellement
utilises dans de tels procedes Ce solvant a en effet deux avantages sur les solvants
classiques il est beaucoup moins toxique pour lrsquoenvironnement et du fait de sa
supercriticalite il peut penetrer plus en profondeur des matrices solides comme des
cendres ou de la terre Lrsquoacide nitrique et le TBP forment un complexe relativement
soluble dans le CO2 et permettent drsquooxyder et drsquoextraire lrsquouranium
021 Interaction entre le TBP et lrsquoEau
En Milieu Supercritique
Une etude similaire a celle faite dans le cas des ethers couronne et de lrsquoeau a ete
conduite pour etudier lrsquointeraction entre le TBP et lrsquoeau dans le CO2
Comme pour le cas des ethers couronne a haute concentration en TBP la con-
figuration comprenant deux molecules de TBP liees a une seule molecule drsquoeau est
observee La partie quantitative de cette etude a ete realisee a faible concentration
en TBP dans ces conditions il y a formation drsquoun complexe 11 entre le TBP et
lrsquoeau en rapide echange avec du TBP et de lrsquoeau non lies Lrsquoenthalpie de formation
de ce complexe est egale a -9(2) kJmiddotmolminus1 alors que sa constante de formation varie
entre 12(3) et 9(2) Lmiddotmolminus1 lorsque la pression de CO2 augmente de 20 a 40 MPa a
02 Interaction entre le TBP lrsquoEau et lrsquoAcide Nitrique 27
constante temperature (40 C)
La fraction molaire k de TBP complexe avec une molecule drsquoeau varie entre 18(1)
et 22(1) avec lrsquoaugmentation de la densite du dioxyde de carbone En lrsquoabsence
de solvant la fraction molaire k est de 100 car une solution de TBP saturee en
eau a un rapport molaire de 11 Cette difference fait que lorsqursquoune solution de
TBP saturee en eau est dissoute dans un solvant il y a formation instantanee de
micro-gouttelettes drsquoeau Lors de cette formation un nuage est drsquoabord observe puis
les micelles srsquoagglomerent pour former de plus grosses gouttelettes qui finalement se
collent aux parois du recipient Ce phenomene existe aussi lorsque de lrsquoacide nitrique
est ajoute au melange TBP-eau Connaissant la solubilite de lrsquoeau dans le CO2 aux
conditions experimentales utilisees la quantite des micro-goutelettes a ete determinee
apres equilibre Lorsque 05 mL de TBP sature en eau (rapport molaire 11 entre le
TBP et lrsquoeau) est melange au CO2 dans une cellule de 10 mL la quantite de micro-
gouttelettes formees varie de 0 a 11(2) microL lorsque la temperature diminue de 70 a 25
C a pression constante (sim20 MPa)
Dans des Solvants Classiques
Une etude similaire a ete realisee en utilisant la RMN et en remplacant le dioxyde
de carbone par du chloroforme afin drsquoexplorer lrsquoeffet du solvant sur lrsquoequilibre Les
concentrations choisies sont telles que seul le complexe 11 entre le TBP et lrsquoeau est
observe Differentes quantites de TBP ont ete dissoutes dans du chloroforme Ces
solutions ont ensuite ete melangees avec le meme volume drsquoeau et apres equilibre la
phase organique a ete analysee par RMN
A partir des mesures du deplacement chimique de lrsquoeau dans le TBP et le CDCl3
les deplacements chimiques δ0 et δ1 de lrsquoeau dans du chloroforme pur et dans du TBP
pur ont ete calcules δ0 = 151(004) ppm et δ1 = 351(004) ppm Le deplacement
chimique du chloroforme en fonction de sa concentration dans le TBP a egalement
ete calcule
02 Interaction entre le TBP lrsquoEau et lrsquoAcide Nitrique 28
Lrsquoanalyse de ces donnees mrsquoa egalement permis de calculer la constante de for-
mation (K = 27(02) Lmiddotmolminus1) du complexe TBP-eau et la fraction molaire k de
TBP complexee avec une molecule drsquoeau (k = 15(1)) Cette valeur est inferieure
a celle trouvee pour le CO2 montrant qursquoil y a moins de complexes TBP-eau formes
dans le chloroforme que dans le CO2 La concentration de lrsquoeau libre crsquoest a dire
non complexee au TBP dans le chloroforme a egalement ete calculee ([H2O]org =
007(002) molmiddotLminus1) cette valeur correspond aux valeurs trouvees dans la litterature
Enfin la quantite de micro-gouttelettes a ete calculee Elle vaut 14(1) microL dans les
memes conditions que precedemment (lorsque le CO2 a ete utilise comme solvant)
Cette valeur est superieure de 3 microL a la valeur maximale trouvee pour le CO2 (11(1)
microL a 20 MPa et 25 C)
022 Interaction entre le TBP lrsquoEau et lrsquoAcide Nitrique
Le phosphate de tributyle forme des liaisons hydrogene avec lrsquoacide nitrique et lrsquoeau
donnant un complexe TBPmiddot(HNO3)xmiddot(H2O)y tres soluble dans le dioxyde de carbone
supercritique (Figure 3) Le nombre de molecules drsquoacide nitrique par molecule de
TBP x peut prendre des valeurs comprises entre 0 et 25 Drsquoun autre cote le nom-
bre de molecules drsquoeau par molecule de TBP y varie entre 04 et 08 Lorsqursquoun
tel complexe est dissous dans un solvant il y a formation instantanee de micro-
gouttelettes drsquoacide nitrique Ces gouttelettes ont ete detectees par RMN Il a ete
prouve que la concentration en acide des micro-gouttelettes augmente lorsque le nom-
bre de molecules drsquoacide par molecule drsquoeau xy dans le complexe de TBP augmente
La quantite et lrsquoacidite des micro-gouttelettes ainsi formees peut jouer un role impor-
tant dans la dissolution et lrsquooxydation de dioxyde drsquouranium lors de lrsquoextraction de
tels composes avec du dioxyde de carbone
02 Interaction entre le TBP lrsquoEau et lrsquoAcide Nitrique 29
Figure 3 Une des configurations possible pour les liaisons hydrogenes entre unemolecule de TBP drsquoacide nitrique et drsquoeau
023 Mise en Pratique Extraction de lrsquoUranium a lrsquoAidede Phosphate de Tributyle et drsquoAcide Nitrique
La societe AREVA (a Richland Etat de Washington USA) mrsquoa permis drsquoutiliser
la technique drsquoextraction supercritique afin de recuperer lrsquouranium enrichi contenu
dans differentes matrices Certaines de ces matrices sont des cendres venant de
lrsquoincineration de dechets secondaires a la fabrication du combustible nucleaire Ces
cendres contiennent de 5 a 10 drsquouranium enrichi a 2-3
Lrsquoextraction se deroule en deux etapes Premierement lrsquooxyde drsquouranium UO2
contenu dans la matrice est oxyde avec de lrsquoacide nitrique et le nitrate drsquouranyle
resultant est extrait avec du TBP et du CO2 Pour cette premiere etape un complexe
TBPmiddot(HNO3)xmiddot(H2O)y est dissous dans le dioxyde de carbone Deuxiemement lrsquoion
uranyle est recupere dans de lrsquoeau pour etre recycle Ces deux etapes sont presentees
en details sur la Figure 4
Les conditions optimales de lrsquoextraction sont les suivantes (i) le complexe utilise
est TBPmiddot(HNO3)18middot(H2O)04 (ii) la temperature et la pression drsquoextraction sont re-
02 Interaction entre le TBP lrsquoEau et lrsquoAcide Nitrique 30
Figure 4 Schema experimental pour lrsquoextraction drsquoUO2
spectivement de 60 C et de 20 MPa (iii) pour chaque gramme de cendre 2 mL du
complexe de TBP sont necessaires (iv) le temps de lrsquoextraction statique est drsquoune
heure et le debit est inferieur a 05 mLmin
Lrsquouranium a ete recupere de la phase organique de deux manieres Premierement
la phase organique avait une concentration en acide de 5 molmiddotLminus1 et lrsquouranium (a
535 gmiddotLminus1) a ete extrait avec de lrsquoeau a 50 C Seulement 15(1) de lrsquouranium a ete
recupere de cette maniere Deuxiemement lrsquouranium a ete recupere sous pression et
en ligne avec lrsquoextraction Les conditions optimum sont 20 MPa et 50 C avec
19 mL drsquoeau par mL de TBP Le rendement de la recuperation sous pression est
bien meilleur que celui de la recuperation a pression atmospherique Ce rendement
diminue lorsque la concentration en acide augmente ou lorsque la concentration en
uranium diminue Lorsque les conditions ont ete modifiees (temperature reduite a
24 C ou volume drsquoeau reduit a 1 mL par mL de TBP) une perte allant jusqursquoa
02 Interaction entre le TBP lrsquoEau et lrsquoAcide Nitrique 31
68 dans lrsquoefficacite de la recuperation de lrsquouranium a ete observee Cette perte est
moindre a basse concentration en acide nitrique
Conclusion
Durant ce travail de these deux types drsquoextractants drsquoions metalliques ont ete etudies
Les premiers appeles ethers couronne sont utilises pour extraire des cations alcalins
comme le cesium Leurs interactions avec lrsquoeau ont ete etudiees a lrsquoaide de deux
methodes drsquoanalyse differentes La premiere methode utilisee est la spectroscopie IR-
TF Cette methode manque de precision mais permet de distinguer les differentes
configurations possibles Lrsquoautre methode utilisee est la RMN Cette methode est plus
precise quantitativement mais ne permet pas de discerner les configurations simples
et pontees entre les ethers couronne et lrsquoeau Elle permet neanmoins drsquoetudier sans
interferences des systemes plus compliques tel que le systeme ether couronne eau
et picrate de cesium Il nrsquoa malheureusement pas ete possible de lrsquoutiliser dans les
fluides supercritiques lrsquoequipement a disposition ne le permettant pas
Lrsquoautre type drsquoextractant utilise est le TBP Cet extractant peut former un com-
plexe en se melangeant a lrsquoacide nitrique Ce complexe a ete caracterise et etudie
dans differents solvants Lorsqursquoil est dilue dans le dioxyde de carbone la formation
de micro-gouttelettes drsquoacide facilite lrsquooxydation de lrsquoUO2 et lrsquoextraction de lrsquoUO2+2
Il a ete prouve que ce principe peut etre utilise pour extraire lrsquouranium de milieux
tels que des cendres provenant de lrsquoincineration de dechets secondaires a la fabricaton
du combustible nucleaire De nombreux progres peuvent etre faits dans la mise en
application a grande echelle de ce procede ecologique drsquoextraction notamment en ce
qui concerne la recuperation de lrsquouranium
General Introduction
My thesis work is focused on the supercritical fluid extraction of uranium and cesium
These elements are present in nuclear waste such as nuclear manufacturing byprod-
ucts or Spent Nuclear Fuel (SNF) Uranium is the main element constituting the fuel
and Cesium-137 is an abundant fission product with a relatively long half-life that
contributes largely to the heat production in SNF The processing of uranium and
cesium is of particular importance for waste management
Water is often present in such waste and it plays an important role in the extrac-
tion process which I studied as part of this research I used different spectroscopic
methods for analyzing the relevant chemical interaction in supercritical fluids and in
solvents such as chloroform and carbon tetrachloride In this introduction I will first
describe the origins and the diversity of nuclear waste and current practical methods
of managing them as well as the futuristic waste management processes envisioned
by scientists I will then describe the industry standard reprocessing technique which
is solvent extraction Supercritical fluids especially carbon dioxide are good alterna-
tives to organic solvents in this process I will therefore describe their characteristics
Thereafter I will relate the special characteristics of uranium and cesium as well as
the chelating agents I used to extract them Last the spectroscopic techniques that
I used will be briefly described
Nuclear Wastes and Nuclear Waste Management
Nuclear byproducts and waste have been a serious issue from the dawn of the nuclear
age The first use of nuclear energy for military purposes during the world war II was
General Introduction 34
accompanied by the generation of large quantities of waste that continued to grow
during the arms race between the United States and the Soviet Union as well as other
countries with nuclear arms The peaceful applications of nuclear energy particularly
for generating electric power are also responsible for producing large quantities of
heavy metal and radioactive waste through different steps of the fuel cycle Hundreds
of nuclear power plants are operating today in many countries (Figure 5) There are
many other industrial applications of nuclear materials and they are used routinely
in hospitals for medical diagnosis and treatments
Figure 5 World map of nuclear reactors from the International Nuclear Safety Center(INSC) web page1
Nuclear waste management is not only a problem in the present but also will be
in the future Indeed the fuel industry declining the oil supply is going down and
developing countries like India and China have a huge demand for power which is a
basic need and is required for economic growth Furthermore to reverse the global
warming effect the emission of greenhouse gases from industry transportation and
power plants needs to be reduced The solution to this problem is electricity produced
from plants that do not generate greenhouse effect gases The electricity can be for
industrial use home use or public transportation Natural gas is cleaner than coal
General Introduction 35
because it does not produce as many particles and byproducts as coal or oil but 4 of
natural gas is lost during transport The contribution of methane to global warming
is 25 worse than that of CO2 which is also produced by these plants On the other
hand renewable energy (ie hydroelectric windpower solar etc) has now reached a
plateau There are not many large dams that can still be built on the worldrsquos rivers
wind-mills are expensive inefficient and consume too much space solar energy lacks
power and is expensive The only obvious way to overcome the energy crisis that is
building is to increase the number of nuclear power plants
For the same amount of energy produced one can find more uranium in the
filters and waste of a coal power plant than in a nuclear power plant Furthermore
the Industrial Accident Safety Rate (IASR) based on the number of accidents per
hour and per worker in American nuclear power plants is well below the IASR for
manufacturing industries and is at the same level as the IASR for banks or real estate
agencies For these reasons the approval rate for new nuclear power plants in general
opinion polls in America increased up to 60 recently This approval rate is even
greater in places where a nuclear power plant is already in place
The majority of nuclear waste is associated with the uranium fuel cycle The
front end of the fuel cycle the so called pre-fission stage which includes mining and
enrichment and fuel fabrication activities generates uranium-containing byproducts
and waste The back end of the fuel cycle the stage after the fuel is irradiated in
the reactors generates large quantities of radioactive waste products While these
fission products are intentionally generated in production reactors for the purpose of
processing to extract weapons grade plutonium they are considered waste products
when generated by power reactors Most of the nuclear waste generated today comes
from power plants and is stored without reprocessing particularly in the United
States European countries and Japan continue to make progress in reprocessing
which can reduce the volume of highly radioactive waste and allow the recycling of
useful isotopes Regardless of the sources of nuclear waste ndash power plants the legacy
General Introduction 36
of cold war nuclear weapons hospital waste food irradiation etc ndash improvements
in the technology of handling and reprocessing are necessary for the economics of the
respective application as well as for environmental protection These reprocessing
techniques are basically chemical in nature and this thesis is a contribution in this
direction
Nuclear waste can be divided into four categories depending on its toxicity8
(i) Low-Level Waste (LLW) The level of radioactivity and the half-life of the radioac-
tive isotopes in low-level waste are both relatively small and LLW does not require
shielding during handling and transport To reduce its volume it is often compacted
or incinerated before disposal Storing the waste for a period of 10 to 50 years will
allow most of the radioactive isotopes in low-level waste to decay at which point the
waste is not considered radioactive and can be disposed as normal waste This kind
of waste for example is generated by hospitals and industries
(ii) Intermediate-Level Waste (ILW) contains higher amounts of radioactivity and
some requires shielding This waste for example is made of contaminated materials
from the manufacture of nuclear fuel eg gloves shielding outfits plastic containers
papers etc In such cases the contaminated material can be incinerated to lower the
amount of waste and the resulting ash can be treated and then discarded as LLW
(iii) High-Level Waste (HLW) comes mostly from the core of nuclear reactors and
from nuclear weapons processing HLW contains fission products including uranium
and plutonium generated in the reactor core HLW is highly radioactive and some
isotopes have extremely long half-lives (some longer than 100000 years) Therefore
HLW will take a long time to return to safe levels of radioactivity
(iv) Transuranic Wastes have atomic numbers greater than uranium They come
mainly from weapons production and consist of clothing tools rags residues de-
bris and other such items contaminated with small amounts of radioactive elements
mostly plutonium Because of the long half-lives of these elements this waste is not
disposed of as either low-level or intermediate-level waste It does not have the very
General Introduction 37
high radioactivity of high-level waste nor its high heat generation
In addition to the problems arising from the management of accumulating waste
there is another concern the pollution generated by the Chernobyl incident which
quickly covered a large area (Figure 6) This disaster turned a localized problem into
a major environmental one Unless another solution is found the population in the
area affected by such pollution must wait for the intensity of radioactivity to decay
and disperse sufficiently in order to return and pursue farming However certain
places eg proximal to a source of drinking water will need real decontamination
efforts
Figure 6 Gamma radiation map in the Chernobyl area results of the May 29 1986Gamma Radiation Survey2
Different ways of disposing of nuclear waste have been under investigation and
trial8 First short-term storage can be used It decreases the radioactivity of HLW
up to 100 times in 10 years Unfortunately the decay of radioactive material is not
General Introduction 38
linear but exponential which limits the usefulness of passive storage Short-term
storage is a necessity for HLW because these materials cannot be shipped or handled
easily when they are just coming out of the core of a reactor It is important to
know that short-term storage is not a final option it only lowers the danger level
of the waste but does not eliminate it The waste will still need to be processed or
stored in another way afterward It is important to make sure that the storage area
is stable and well protected from accidents or natural disaster The spread of such
radioactive material in drinking water or on agricultural and hunting lands would be
a catastrophe
As a follow-up or as a second option long-term storage can be used for HLW
or ILW HLW and long-lived waste from ILW (from fuel reprocessing) are generally
buried deep underground whereas ILWrsquos short-lived waste (mainly from reactors) is
generally buried in shallow repositories Forgetting them underground until the dan-
ger is no longer present seems to be a good idea but it does not take into account the
fact that some waste has a very long half-life and nobody can assure that humanity
will remember it after several thousand years We are still discovering artifacts that
are less than five thousand years old for instance in Egypt Even the ancient Egyp-
tian language and alphabet were forgotten Will the archaeologist of the future dig
with a Geiger counter Besides the earth is moving all the time in an unpredictable
manner Nobody can assure that the waste will remain stable and not be dispersed
with underground water or seismic activity
The toxicity of the waste beyond its radioactivity is another aspect to consider
Indeed some of this waste contains plutonium one of the most toxic of all elements
Some people consider sending such waste into space but the cost would be enormous
and unethical
Nevertheless there is a way of minimizing the consequences of leaks or other
problems that might cause the waste to be scattered it is the vitrification process
before storage With this method radioactive waste is mixed with silica and melted
General Introduction 39
into glass beads This process should prevent radioactive elements from going into
the atmosphere or the groundwater even if they are in direct contact with it
In the United States the Nuclear Regulatory Commission (NRC) uses the funds
collected from nuclear power plant taxes to develop waste disposal programs There
is a long-term underground storage currently under development at Yucca Mountain
Nevada9
Another way to get rid of such waste is to process it10 One way of processing
nuclear waste is to transmute the unstable isotopes to stable ones in the same way
alchemists would transform or transmute lead into gold There have been some at-
tempts to use photons in the x-ray range in a high-powered electron linear accelerator
The use of a laser to remove neutrons from a radioactive isotope also has been inves-
tigated If the use of this technology were possible Cesium-137 could be transmuted
to Cesium-136 with a half-life of 131 days instead of 302 years Unfortunately this
seems to be only an alchemistrsquos dream A more realistic way to use transmutation is
to irradiate an isotope with neutrons in an accelerator to allow the isotope to absorb
a neutron With this process iodine-129 can be transmuted to stable xenon with
neutron absorption The Accelerator Transmutation of Waste (ATW) system is cur-
rently being developed at Los Alamos National Laboratory in New Mexico1112 The
downside of ATW is that long-lived radioisotopes should be isolated for them to be
transmuted without interferences and without transmuting good radioisotopes into
bad ones For example Uranium-238 which is the main constituent of Spent Nuclear
Fuel (SNF) can be transmuted into Plutonium-239 239Pu is not as manageable as
238U and has a half-life of 25 thousand years
Solvent Extraction
Solvent extraction has already been proven to be a good method to separate radioiso-
topes from SNF One of the most famous solvent extraction processes is the PUREX
(Plutonium Uranium Recovery by Extraction) process The principle of this pro-
General Introduction 40
cess is to separate uranium and plutonium from the fission products and from one
another First the pellets are prepared for the dissolution (ie decladded) Then
the SNF is dissolved in a solution of nitric acid in which the tetravalent uranium is
oxidized to uranium(VI) Second the uranium(VI) and plutonium(IV) nitrates are
extracted from the nitric acid solution with a mixture of kerosene and Tri-n-Butyl
Phosphate (TBP) (at 70 and 30 respectively) while the fission products remain in
the aqueous nitric phase13 The plutonium is then reduced to an oxidation state III
In the trivalent state the plutonium is insoluble in the organic phase and is therefore
easily stripped out with water Finally the remaining uranium nitrate is stripped
out of the organic solution with heated water Uranium(VI) and plutonium(III) can
also be purified and converted to uranium trioxide (UO3) and plutonium dioxide
(PuO2) Despite this solvent extraction has a big downside its secondary waste
production If the organic solvents used in a Purex-like process could be exchanged
for a volatile solvent that is harmless to the environment the functioning cost would
be reduced That is exactly what Supercritical Fluid Extraction (SFE) does by using
carbon dioxide
Supercritical Fluids
A fluid is called supercritical when both its temperature and pressure exceed their
critical values (Tc for the critical temperature and Pc for the critical pressure) See
Figure 7 A phase diagram for CO2 is shown in Figure 7 with a representation of
the supercritical and the subcritical region When a substance is at a pressure and
temperature that is near the supercritical area its state is called subcritical
Supercritical fluid density depends on pressure and temperature The density
generally increases with a pressure increase and decreases with a temperature increase
Near the critical point it is not unusual to observe inconsistency in density or other
physical properties The system can be greatly disturbed by a small difference in
temperature or pressure or by adding a substance or an impurity to the fluid It
General Introduction 41
Figure 7 Phase diagram for CO2 the shaded areas are the subcritical and supercrit-ical fluid regions
is then important to pursue quantitative measurements in the neighborhood of the
critical values
Different fluids such as water methanol ammonia etc can be in the supercritical
state see Table 1 Supercritical CO2 offers numerous advantages over the other fluids
it has moderate critical values and it is inert nontoxic nonflammable inexpensive
and widely available in purified form Furthermore it is a gas at normal temperature
and pressure allowing an easy recovery of the extracted species without generation
of secondary wastes that are very hard to discard or reprocess
The solubility of a substance in Supercritical CO2 is related to its density and
temperature Solubility increases with an increase in density at constant temperature
and decreases with increasing temperature at constant pressure714 With regard to
the above factors we can see that supercritical CO2 is more economic in the long
run Besides the fact that supercritical CO2 requires less energy to reach its critical
parameters its density can be easily raised to improve solubility
General Introduction 42
Table 1 Supercritical fluids critical values
Name Symbol Tc Pc ρac
(C) (MPa) (gmiddotLminus1)
Methanol CH3-OH 240 plusmn 1 81 plusmn 01 273Methane CH4 -826 plusmn 03 461 plusmn 003 162Carbon dioxide CO2 3103 plusmn 004 7380 plusmn 0015 467Ammonia NH3 1323 plusmn 001 11300 plusmn 0005 225Water H2O 374 plusmn 2 22064 plusmn 0005 322Nitrogen N2 -2730248 plusmn 00005 12619 plusmn 0001 952
Source The National Institute of Standards and Technology (NIST) Chemistry Web-Book httpwebbooknistgova uncertainty on densities le 2 (gmiddotLminus1)
CO2 is the most widely used substance for supercritical fluid applications For
many years it has been used on a large scale to remove caffeine from coffee and
tea CO2 is also used to extract other lipophylic substances such as nicotine The
extraction of metallic ions is more challenging because they are generally insoluble in
CO2 To circumvent this problem neutral chelating agents are chosen15ndash17 and I will
describe in details their action later in this general introduction
During my thesis work I studied supercritical fluid extraction (SFE) directly or
indirectly with the use of organic solvents such as chloroform or carbon tetrachloride
I focused on the extraction of two elements present in nuclear waste and nuclear
contamination sites The first one cesium-137 is a man-made isotope produced by
the fission of uranium-235 Its half-life is 3017 years Cesium-137 is present in a
radio-contaminated environment such as the Chernobyl area but it is more of an
issue in nuclear power plant waste The second uranium is the main isotope present
in Spent Nuclear Fuel (SNF) and is also found in nuclear weapons and in ILW
Cesium and Uranium Elements
Cesium-137 is a relatively long-lived isotope with a large contribution to the heat
production in SNF As shown on Figure 8 and appendix A cesium is one of the
General Introduction 43
most abundant fission products in SNF from Pressurized Water Reactors (PWR) 150
days after its discharge The amount of cesium produced per ton of uranium in the
fresh fuel load is even greater in Liquid Metal Fast Breeder Reactors (LMFBR) such
as Super-Phenix in France Recovering the cesium from waste is a very interesting
project because it lowers the radioactivity of the matrices from where it is extracted
allowing the remaining material to be more easily handled and discarded After
separation from the waste 137Cs is a good candidate for long-term storage because
of its moderate half-life Cesium-137 can also be recycled and used for radiotherapy
for example
Cesium-137 is also a concern in cesium-contaminated areas such as the Chernobyl
area It is accumulated in the human body mimicking potassium which disturbs the
transmission of nerve messages Extracting cesium from cesium-contaminated areas
along with other isotope cleaning can effectively reduce the waiting period (sim300
years for 137Cs) required to return the land to the people
01
1
10
100
1000
10000
30 35 40 45 50 55 60 65 70
Mas
s yi
eld
of th
e fis
sion
ele
men
t (g
Mg)
Atomic number
Cs
Figure 8 Mass (g) of elements (150 days after discharge from a PWR) per ton (Mg)of uranium (freshly loaded in the reactor) versus the atomic number of the element3
General Introduction 44
The other element in which I was interested is uranium The uranium in nuclear
waste generally contains a higher uranium-235 isotope fraction than it does in natural
form which makes it attractive to recover and recycle for use as fuel in power reactors
This recycling strategy would reduce the energy needed and reduce the pollution
generated to enrich uranium Recycling uranium from waste is particularly relevant
considering that the natural abundance of the uranium-235 isotope is only 072
while recovered uranium (from fuel manufacturing waste for example) contains up to
sim4 235U
Chelating Agents
Because supercritical CO2 is a nonpolar solvent there is a weak solute-solvent in-
teraction in the Supercritical Fluid Extraction (SFE) of metal ions Consequently
supercritical CO2 needs the presence of a chelating agent14ndash17 also called ligand to
enhance its ability to extract metal ions and their counter ions into a hydrophilic
liquid
The role of a chelating agent is to bind with the metal ion to form a metal chelate
that is soluble in CO2 Furthermore a good chelating agent needs to have the fol-
lowing properties it has to be soluble in CO2 selective for the species that needs to
be extracted and relatively harmless for the environment or easily recyclable
Metal chelates can be formed in CO2 using two methods First the chelating agent
is dissolved in CO2 which is then directed into the sample containing the metal ions
In the second method the ligand is introduced into the sample before the SFE is
initiated
Most matrices from which metal ions are extracted contain water During the
extraction chelating agents change the hydration sphere of the ions Some water
can be solubilized in the organic phase with or without the help of the chelating
agent Consequently the presence of water has a great effect on the efficiency of the
extraction1618 Therefore the understanding of the water interaction with ligands
General Introduction 45
and metal ions has a significant impact on the understanding of the thermodynamics
of the extraction The understanding of these interactions might lead to the discovery
of new ways to enhance the extraction efficiency
Crown ethers have been intensively studied for their selectivity in the solvent ex-
traction of cations and especially alkaline-earth-metal cations18ndash23 See Figure 9 for
a representation of 18-crown-6 Furthermore crown ethers have relatively high sol-
ubility in sub- and supercritical CO214 These properties make crown ethers highly
attractive for Supercritical Fluid Extraction (SFE) of cesium A study24 used crown
ethers to extract sodium and potassium cations in supercritical CO2 with perfluoro-
carboxylic acid as a counter ion Another study performed by Wai et al25 showed a
successful extraction of cesium with crown ethers and fluorinated compounds Nev-
ertheless the role of water and the interactions involved in the chelating process
were not detailed in these publications I paid special attention to these important
properties in my work
On the other hand the TBP-nitric acid efficiency in the Purex process has been
proven13 See Figure 9 for the representation of TBP and nitric acid respectively
TBP is highly soluble in supercritical CO21426 and forms an adduct with nitric acid
This adduct can be used to dissolve uranium oxides27ndash29 The resulting metal chelate
2TBPmiddotUO2(NO3)2middot2H2O is known to have very high solubility in CO23031 Conse-
quently TBP-nitric acid adducts were chosen as chelating agents for the extraction
of uranium
Spectroscopic Methods Used
For this research work two experimental devices were used Proton Nuclear Magnetic
Resonance (NMR) and Fourier Transform Infra-Red spectroscopy (FT-IR) NMR is
a precise analytical tool for the quantitative understanding of water interactions in
organic solvents3233 The crown ether-water interactions with and without cesium
picrate and the TBP-nitric acid-water interactions in solvents were determined using
General Introduction 46
Figure 9 Representation of a crown ether (18-crown-6) and the TBP and nitric acidmolecules
this analytical technique Unfortunately I was unable to use it with supercritical
fluids in spite of numerous attempts I tried to use capillaries but they were not
suitable for my system where many compounds were dissolved in CO2 I also tried to
use a PEEK (TM)1 polymer high-pressure cell34 in collaboration with C Yonker (Pa-
cific Northwest National Laboratory Richland Washington) but the results obtained
were random and not reproducible The reasons for this failure might be the inability
to have a lock on the NMR spectroscope or a consistent standard for concentration
determination
I was not able to use the NMR for quantitative measurement in supercritical
fluids with the materials that I tried Nevertheless as an alternative technique I
used FT-IR spectroscopy with the help of John Fulton and his lab equipment35 in
the Fundamental Science Directorate of the Pacific Northwest National Laboratory in
Richland Washington FT-IR is not as accurate as NMR and the overlapping of rays
from different species can be a problem However if the system is kept simple with
a limited number of compounds it can be used for quantitative measurements with
1Manufactured by Victrex plc
General Introduction 47
an acceptable accuracy Indeed it has been used successfully in the past few years
to study hydrogen bonding in supercritical CO236ndash40 I used FT-IR successfully to
understand crown ether-water and TBP-water interactions in super- and subcritical
CO2 Furthermore I was able to distinguish different crown ether-water configura-
tions where the NMR was showing only an average of all configurations
Finally I used gamma spectroscopy to monitor the enhancement of the uranium
extraction from ash with supercritical CO2 This gamma spectroscopy technique
lacks accuracy but gives fast and inexpensive approximate measurements of uranium
which is used to estimate the extraction efficiency Key samples were analyzed by
Inductively Coupled Plasma Mass Spectroscopy (ICP-MS) for higher accuracy
Overview of the Thesis Structure
My thesis is divided into two chapters The first one focuses on cesium extraction
with crown ethers and the second one on uranium extraction with a TBPnitric acid
complex
In the first chapter I describe the crown-ether water interaction because the water
plays an important role in solvent extraction To pursue this goal I first used the
FT-IR spectroscopy in supercritical CO2 and then the NMR technique in organic
solvents for comparison To finalize this part of my research I show the results of the
addition of cesium picrate to the system in order to understand the whole picture of
the recovery of cesium
In the second chapter I describe the antisolvent effect of the TBP-water and
the TBP-water-nitric acid systems in supercritical CO2 and in solvents using FT-IR
and NMR To conclude this part I demonstrate the efficiency of supercritical fluid
extraction for a pilot plant where the uranium is extracted from the incineration ash
of the byproduct of the nuclear fuel production For this work I used the TBP-nitric
acid solutions described in supercritical CO2 Lastly I will summarize the conclusions
of this research thesis
Chapter 1
Crown Ether-Water Interaction
Introduction
The scope of work presented in this chapter covers the various mechanisms of the
cesium extraction in supercritical fluids and solvents using crown ethers as ligands
Special attention is focused on the role of water The interaction in sub- and super-
critical CO2 were studied in detail This was complemented and compared with a
parallel study using solvents specifically chloroform and carbon tetrachloride mix-
tures Different spectroscopic tools Fourier Transformed Infra-Red (FT-IR) and Nu-
clear Magnetic Resonance (NMR) were used for the analysis thus yielding detailed
information about the molecule structure and the interaction equilibria as these tech-
niques complement each other To conclude the work of this chapter the role of water
was studied in the cesium extraction equilibrium using crown ethers
I will first describe the crown ethers properties Crown ethers are macrocycles
formed of a succession of ether molecules (-H2C-O-CH2- named methoxymethane or
methyl methyl ether) bonded together through the carbon atoms to form a ring The
carbon atoms are positioned outside of the ring whereas the oxygen atoms are inside
the cavity and therefore form a powerful attractor for positively charged atoms or
molecules Furthermore the number of ether molecules forming the ring determines
the size of the internal cavity and is therefore very selective of the cation extracted
Representations of different crown ethers are shown in Figure 11 When unsub-
50
stituted their nomenclature depend on the number of chemical bonds and oxygen
atoms in their cycle For example a macrocycle composed of 12 chemical bonds and
4 oxygen atoms is called 12-crown-4 or 12C4 and a macrocycle composed of 18 bonds
and 6 oxygen atoms is called 18-crown-6 or 18C6 Unsubstituted crown ethers can
be in various conformations The most represented conformation for 18-crown-6 is
D3d (Figure 11) but other conformations are possible where the crown is more or
less closed on itself like a jaw Different substitutes can take the place of the hydro-
gen atoms outside the ring Some substitutes such as the cyclohexane or benzene
molecules are very commonly used and are represented in Figure 12 When these
substitutes are used with 18-crown-6 they force the crown ether to be in a ldquoplanerdquo
or D3d conformation
Solvent extraction technique is commonly applied for the removal of metal or-
ganic molecules or ions from soil or aqueous solutions using many acidic anionic
or neutral extractants41ndash46 Crown ethers have been intensively used as extractants
for their selectivity and efficiency to extract cations and especially alkaline-earth-
metallic cations from aqueous solutions making them ideal for the extraction of
cesium414748 Furthermore crown ethers are soluble in a large variety of solvents
like carbon tetrachloride chloroform or supercritical carbon dioxide making them
suitable for environmentally friendly processes using supercritical CO2
In such extractions the organic or the CO2 phase contains often water and its
interaction in the solvent needs to be taken in account especially since Dietz et al18
showed that the efficiency of a solvent extraction depends on the solubility of water
in the organic phase
Most published research on solvent extraction do not discuss the role of water
in sufficient detail183649ndash53 For example Dietz et al18 studied the extraction of
cesium from acidic nitrate media using crown ethers as extractant in various organic
solvents An increase in the efficiency of the extraction was observed when the water
solubility in the organic phase increased The enhanced extraction efficiency was
51
Figure 11 Molecular structure of 12-Crown-4 (a) 15-Crown-5 (b) 18-Crown-6 (c)24-Crown-8 (d)
partly attributed to the water-saturated organic phase Another study52 states that
the role of the water must be taken into account in the description of the equilibria of
the extraction from water since the organic phase is water saturated Some molecular
dynamics studies54 showed that the water is mainly bridge-bonded to the crown ether
in a D3d conformation In addition Moyer et al36 used FT-IR to describe the general
equilibrium between water and 18-crown-6 in carbon tetrachloride This study neither
discusses the effect of the solvent nor describes the ligand partition between the two
phases Moreover no published work described the water-crown ether interaction in
supercritical fluids
It was therefore important as a first step in this work to analyze the crown ether-
52
Figure 12 Molecular structure of dicyclohexano-18-Crown-6 (a) and of dibenzo-18-Crown-6 (b)
water interaction in supercritical and liquid CO2 Thereafter I used Nuclear Magnetic
Resonance (NMR) to study the role of the solvent in this interaction Solvents such
as chloroform and carbon tetrachloride were used I finally worked on constructing a
more complete picture of the cesium extraction by introducing some cesium picrate
to the water-crown ether equilibrium
11 Crown Ether-Water Interaction In Supercriti-
cal CO2
Introduction
The purpose of this section is to provide in-depth understanding of the interaction
between water and crown ethers in supercritical fluids The description of this inter-
action is important to give an insight into cesium extraction using crown ethers This
interaction was studied in supercritical CO2 using the Fourier Transform Infra-Red
(FT-IR) spectroscopy I will therefore describe this analytical tool in more details
because of the impact on the specific adaptations necessary for my experiments
The FT-IR spectroscopy is the spectroscopic technique most widely used to ana-
lyze molecular structures It is a fast and sensitive method for most chemical systems
Furthermore it is an economically attractive device that is easy to use Essentially
FT-IR is used for the understanding of the chemical bonds Chemical bonds have
frequencies of vibration that are mostly in the infra-red domain These frequencies
depend on the nature and on the environment of chemical bonds Thus if a molecule
is irradiated with a range of waves within the infra-red region it will absorb all the
waves that have the same frequency as the frequency of vibration of the bonds of
the molecule Therefore the absorption spectra can be represented by the plot of the
intensity of the transmitted beam versus the frequency of vibration The analysis of
such spectra can give the molecular structure of the molecule irradiated At a fun-
damental level the vibration between two atoms can be explained with the classical
mechanics model of the harmonic oscillator composed of two masses attached to the
opposite ends of a spring According to this model the frequency of the oscillations
(ω) in rads is obtained from
ω =radic
ks micro (11)
where ks is a constant related to the strength of the chemical bond analogous to the
spring constant which is the ratio between the spring force and the displacement The
11 Crown Ether-Water Interaction In Supercritical CO2 54
reduced mass micro is defined as
micro =m1m2
m1 + m2
(12)
where m1 and m2 are the masses of the atoms 1 and 2 respectively The frequency of
oscillation ω in rads is related to the frequency (ν) in Hertz according to
ω = 2πν (13)
and to the wavenumber (ν) in cmminus1 is obtained from
ν =ν
100 c(14)
where c is the speed of light in ms Combining the above equations the wave number
is
ν =
radicks
200πc
radicm1 + m2
m1m2
(15)
which demonstrates that the wave number (proportional to the frequency of vibration)
clearly depends on the mass of the atoms ie the isotopes used
Utilizing the previous equations the OndashH bond in the water molecule can be
approximated as a diatomic molecule Thus a significant shift in wave number should
be expected by using deutered water instead of normal water This is confirmed by
the following calculations where the constant ks for the OndashD and the OndashH bond
was assumed to be the same as an approximation The two frequencies are related
according to
νO-D = νO-H
radicmicroO-H
microO-D
= νO-H
radic16times 1
16 + 1
16times 2
16 + 2= 073times νO-Hmiddot (16)
This approximation is very good given that the symmetric stretching vibration wave
numbers for OndashH and OndashD are known to be 3652 and 2666 cmminus1 respectively55 the
ratio of the measured frequencies is 26663652 = 073 confirming the accuracy of
equation 16 In the work presented in this section I used this property to avoid the
overlapping of intense CO2 absorption bands between 3500 and 3800 cmminus1 with water
bands by using D2O instead of H2O
11 Crown Ether-Water Interaction In Supercritical CO2 55
Most of the IR spectrometers are Fourier transformed Their principle of operation
is described here with reference to Figure 13 A laser source of infra-red radiation
is used to generate the main beam This beam travels from the source to a half-
transparent mirror (beam-splitter) positioned at 135 degrees which splits the beam
in two The first beam (11) is reflected at 90 degrees and hit a mirror that is fixed
and perpendicular to the beam The second beam (22) is transmitted and bounces
off a mirror that is perpendicular to the beam This mirror can be moved to change
the length of the optical path Both beams return to the beam-splitter where half of
all the photons travel toward the source and are lost and the other half are reflected
(2) or transmitted (1) to the sample with a phase difference due to their different
path-lengths The combined beam transmitted through the sample finally arrives at
a detector placed at the other side of the test sample and the resulting signal will be
analyzed
Figure 13 Fourier Transform Infra-Red (FT-IR) spectrometer
11 Crown Ether-Water Interaction In Supercritical CO2 56
Due to the difference in optical path (δ) the two beams with two different phases
will go through the sample It will therefore produce some interferences that are either
constructive or destructive resulting in intensity changes depending on the value of
δ As a result the graph of the intensity as function of δ can be plotted To obtain
the spectrum which is a plot of intensity versus frequency a mathematical tool is
needed This tool is called the Fourier transformation and it is generally done by a
computer connected to the spectrometer
The resulting spectrum is composed of peaks of varying width As explained
before the position of those peaks depends on the bond energy and therefore depends
on the nature of the bond and on its chemical environment On the other hand at
relatively low concentration the intensity (I) of a peak at a given wave number can
be used to calculate the concentration of the molecule responsible for the peak using
the Beer Lambert law
I = I0eminusε l C (17)
where I0 is the initial intensity (before the sample) l is the light path-length in
the sample C is the concentration of the molecule responsible for the signal and ε
is the wavelength dependent molar absorptivity coefficient The coefficient ε needs
to be calculated from the spectra of the molecule at known concentrations Gener-
ally the computer connected to the spectrometer transforms the intensities values in
absorbance (A) which is defined from
A = minus lnI
I0
(18)
The absorbance is therefore directly proportional to the concentration C and ac-
cording to the Beer-Lambert law
A = ε l Cmiddot (19)
To minimize the interference of the background noise and thus improve accuracy
one can sum up the absorbances for the entire width of the peak In such case the
11 Crown Ether-Water Interaction In Supercritical CO2 57
Beer-Lambert law would be written asint ν2
ν1
A dν =
int ν2
ν1
ε l C dν = l C
int ν2
ν1
ε dν (110)
where ν1 and ν2 are the wavenumbers for which the peak begins and ends
This spectroscopic technique can be used in supercritical fluids and it has been
used successfully in the past few years to study hydrogen bonding in CO237ndash40 I
used FT-IR to understand crown ether-water and TBP-water interactions in super-
and subcritical CO2 Because FT-IR actually measures the bond energy between
atoms and molecules it provides structural information and good understanding of
how the species are bonded in a solution Furthermore there are vast databases
of spectra available which is helpful for the recognition of most of the bonds in very
different molecules The main problem with FT-IR is its low accuracy for quantitative
measurements The spectral peaks are generally broad and the determination of the
intensities generally lacks precision FT-IR can be easily overloaded with a system
that contains too many different species causing the overlapping of peaks In such
cases the intensity and therefore the concentration determination will be even less
accurate Nevertheless with a system kept as simple as possible and with the use of
innovative techniques to avoid overlapping as I did with substituting deuterium for
hydrogen FT-IR can be used effectively for quantitative analysis Moreover with the
use of a specially designed high pressure cell it can be easily used for measurement
in supercritical fluids
In this section I will present the experimental setup and a summary of the results
that are detailed in the paper ldquoAn FT-IR study of crown ether-water complexation in
supercritical CO2rdquo which I published with other colleagues This paper is reproduced
here as appendix F Generalization and more details beyond the published work will
be presented
11 Crown Ether-Water Interaction In Supercritical CO2 58
111 Experimental Work
Chemicals
D2O (100 D 9996 pure) 18-Crown-6 (995 pure) dicyclohexano-18-crown-6
(98 pure) methanol-d (995+ atom D) and carbon tetrachloride (999 pure)
were purchased from Aldrich Chemicals Company and used without further purifi-
cation Carbon dioxide was obtained as Supercritical Fluid Chromatography (SFC)
grade (purity ge 9999) from Scott Specialty Gases Inc
Experimental Setup
The experimental setup is shown in Figure (14) It consists of a syringe pump
(ISCO model 100DX) that pressurizes regulates and delivers CO2 to a specially
designed high pressure cell A detailed description of the high pressure cell will
be presented later The pressure is measured with an electronic transducer (Precise
Sensor Inc model D451-10) with a plusmn 01 MPa accuracy To avoid any incident caused
by over pressurization a rupture disc was installed on the line between the cell and
the syringe pump The cell is heated with four electric cartridge heaters and the
temperature is monitored by a controller (Watlow company) with a plusmn 1 C accuracy
For safety reasons the controller was set up to shut down the heater if the temperature
exceeds 80 C The different solutions inside the cell were analyzed using a Bruker
IFS 66V FT-IR spectrometer with a Mercury-Cadmium-Telluride (MCT) detector
(Kolmar Technologies) A 5 min acquisition time and an 80 kHz scanner velocity
for a 4 cmminus1 wavenumber resolution were used to optimize the spectrum quality and
signal-to-noise ratio Spectrum analysis and corrections including curve fitting and
spectrum subtraction were performed with the OPUS (Bruker Optics) software At
the end of each experiment the solutions were released to a hood
The stainless steel cell is rated up to 50 MPa and has an internal volume of 92 mL
It has an observation window made of sapphire which allows visual determination of
the number of phases present inside the cell This kind of information is important for
11 Crown Ether-Water Interaction In Supercritical CO2 59
Figure 14 Fourier Transform Infra-Red (FT-IR) experimental setup
11 Crown Ether-Water Interaction In Supercritical CO2 60
quantitative analysis as some water droplets can potentially form in the path of the
beam which would alter the measured spectral data The infrared beam is focused
along two conical holes and passes through two small diamond windows providing a
path-length of 100 microm The stirring of the solution during the whole experiment was
done using a Teflon-coated magnetic stirring bar
Water contamination from the atmosphere or from previous cleaning can change
equilibrium parameters and lead to erroneous results Such contamination of the cell
and its content must be avoided Thus for each experiment the cell was purged with
nitrogen and chemicals were introduced to the cell under a glove box The cell was
then connected to the line and the CO2 was introduced The solutions were stirred
for 20 to 30 minutes to reach equilibrium after each change of experimental condi-
tions such as chemicals concentration of species pressure and temperature Longer
experimental times were tested without any significant change in the IR spectra
Heavy water (D2O) was used instead of H2O to avoid the overlapping of water
peaks and strong CO2 absorption bands between the wave numbers of 3500 and 3800
cmminus1 The pure CO2 density was varied from 660 to 1040 gmiddotLminus1 by adjusting the
temperature between 25 and 70 C and the pressure between 20 and 40 MPa The
pure CO2 density was determined using a reported table from the National Institute
of Standards and Technology (NIST) Chemistry WebBook56
It is important to contain the chemicals inside the cell to maintain accuracy for
quantitative analysis and to avoid any back flow to the pump Therefore any decrease
in density was prevented in successive experiments that did not require new chemicals
but simply required increasing pressure andor decreasing temperature After each
set of experiments the cell was cleaned several times with CO2 and acetone and dried
using nitrogen A blank spectrum was taken to be certain that there is no contam-
ination It was also used to subtract the empty cell spectrum including the signal
from the diamond windows from the spectrum of each sample Another background
correction was performed because of the overlapping of weak 18-crown-6 bands (C-H
11 Crown Ether-Water Interaction In Supercritical CO2 61
stretch) and D2O bands The spectrum of pure 18-crown-6 at the same pressure and
temperature as the sample was also subtracted
To study the nature of crown-water hydrogen bonding in liquid and supercritical
CO2 a series of mixtures composed of a fixed D2O concentration (0049 molmiddotLminus1) and
variable 18-crown-6 concentrations (up to 025 molmiddotLminus1) were introduced in the cell
with a syringe before the CO2 was added
112 Summary of the Results
FT-IR spectroscopy was used as an analytical method for the understanding of crown
ethers-water interaction The chosen crown ether for this study was 18-Crown-6 and
D2O was used instead of water to avoid overlapping of CO2 intense signal and water
peaks in the wave number range between 3500 and 3800 cmminus1
Three types of bonding were observed between the crown ether and the water
The first one (Figure 15(c)) can only be observed at high crown to D2O concentra-
tion ratio The configuration is a ldquosandwichrdquo formed with two 18-crown-6 molecules
surrounding one water molecule The sandwich configuration is one possible con-
figuration among many examples of other configurations being the ldquooffsetrdquo or the
ldquoperpendicularrdquo This configuration is characterized by a broad peak at 2590 cmminus1
At low crown to D2O concentration ratio a water molecule can bond with a crown
ether molecule in two different ways The first type is a bridge configuration (Figure
15(a)) formed by hydrogen bonds between D2O and two oxygen atoms that belong
to the crown cavity The bonds involved in this configuration have the same nature
as the one in the sandwich configuration thus their respective FT-IR peaks are over-
lapping The second type is a single configuration (Figure 15(b)) where D2O makes
a single hydrogen bond with an oxygen atom belonging to the crown ether cavity
It is characterized by two peaks at 2679 and 2733 cmminus1 assigned respectively to the
hydrogen-bonded OndashD stretching and the unbonded OndashD stretching
The equilibrium constants of formation Ks and Kb for the single and the bridge
11 Crown Ether-Water Interaction In Supercritical CO2 62
Figure 15 Molecular structure of the water-crown ether interaction in the bridgeform (a) the single configuration (b) and the sandwich form (c)
configurations were calculated with the CO2 density increased at several step from
850 to 960 gmiddotLminus1 For the single configuration Ks was found to vary between 16 plusmn
4 and 9 plusmn 2 Lmiddotmolminus1 For the bridge configuration Kb was found to vary between
10 plusmn 3 and 5 plusmn 2 Lmiddotmolminus1 in the range of CO2 densities considered Different
equilibrium constant measurements at constant pressure and variable temperature
allow the calculation of the enthalpy of the hydrogen bond for the two complexes
Their values were calculated to be -12 plusmn 2 kJmiddotmolminus1 for the single complex and -38
plusmn 3 kJmiddotmolminus1 for the bridge one These values are in agreement with hydrogen bond
enthalpy values found in the literature for other solvents57
113 Additional Description
The equilibrium parameters of crown ether-water interaction in supercritical CO2
found by FT-IR need to be compared with the equilibrium parameters in solvents
analyzed by NMR The later is described in section 12 NMR is an analytical tech-
nique that does not allow the differentiation of the two configurations being bridge
or single Thus the equilibrium parameters of both the single and the bridge con-
figurations need to be calculated from the FT-IR study in supercritical fluids For
this purpose the equilibrium is described next in the section covering the theoretical
11 Crown Ether-Water Interaction In Supercritical CO2 63
analysis
Theoretical Calculations
The equilibrium relation is given as
2 18C6 + 2 D2O 18C6middotD2Osingle + 18C6middotD2O
bridge (111)
From this equilibrium the constant K can be defined as
K =[18C6middotD2O
single][18C6middotD2Obridge]
[D2O]2[18C6]2= Ks middotKb (112)
where
Ks =[18C6middotD2O
single]
[D2O][18C6]and Kb =
[18C6middotD2Obridge]
[D2O][18C6](113)
and the molar fraction k of crown ether bonded to water is given as
k =[18C6middotD2O
single] + [18C6middotD2Obridge]
[18C6middotD2Osingle] + [18C6middotD2O
bridge] + [18C6]middot (114)
The molar enthalpy (∆H) of the hydrogen bond at constant pressure can be
determined from the equilibrium constant (equation 112) using the well-known ther-
modynamic relations (equation 115 116 and 117)(part∆G
partT
)P
= minus∆S =∆Gminus∆H
T (115)
∆G0 = minusRT ln K (116)
and (part ln K
part(1T )
)P
= minus∆H
R (117)
where T is the absolute temperature in K ∆S is the entropy in Jmiddotmolminus1middotKminus1 ∆G is
the Gibbs free energy in Jmiddotmolminus1 and R is the molar gas constant in JmiddotKminus1middotmolminus1
11 Crown Ether-Water Interaction In Supercritical CO2 64
Table 11 Equilibrium parameters for water-crown-ether interaction in supercriticalfluids
Pressure temp density K = Ks timesKb k [D2O]MPa C gcmminus3 L2middotmolminus2 molmiddotLminus1
202 60 0724 34 33 0035202 50 0784 62 35 0034202 40 0840 161 45 0031201 35 0866 108 40 0032200 33 0876 174 45 0030200 31 0886 242 47 0029200 25 0913 298 54 0028
202 40 0840 161 45 0031303 40 0910 53 34 0035354 40 0935 61 35 0034405 40 0956 64 35 0034
405 25 1004 178 44 0030
Typical Statistical errors are Pressure plusmn 01 MPa Temperature plusmn 1 C Kplusmn 10and kplusmn 10
Results and Discussion
The variation of the constant of formation K and the molar fraction of crown ether
bonded to water k with pressure and temperature are shown in Table 11 The
constant of formation K varies from 34 plusmn 4 to 300 plusmn 30 L2middotmolminus2 when the temper-
ature decreases from 60 to 25 C at constant pressure (of sim20 MPa) At constant
temperature (40 C) K tends to decrease with pressure increase (from 20 to 40 MPa)
The same trend is observed for the molar fraction k of crown ether bonded to
water Figure 16 shows this trend at constant pressure (20 MPa) When the density
increases (ie the temperature decreases) the value of k increases from 33 plusmn 4
to 54 plusmn 6 Therefore there is more water molecules bonded to the crown at low
temperature or at high density for a constant pressure of 20 MPa
The variations of k at constant temperature (40 C) versus density is shown in
11 Crown Ether-Water Interaction In Supercritical CO2 65
25
30
35
40
45
50
55
060 065 070 075 080 085 090 095 100
k (
)
Density of CO2 (gcm-3)
Figure 16 Molar fraction of crown ether bonded to water k versus density at constantpressure (20 MPa) Lines are guides for the eyes and do not have any theoretical oranalytical value
Figure 17 When the density increases (ie pressure increases) the value of k
decreases rapidly at first and then reaches a plateau at approximately 35 when the
density exceeds 900 gmiddotLminus1 At lower pressure values there is more water bonded
to the crown ether However pressure does not appear to influence the amount of
bonded water for pressures higher than 30 MPa
Equation 117 shows that the plot of ln K versus 1T at constant temperature
(Figure 18) can give the value of the molar enthalpy ∆H of the hydrogen bond
between water and 18C6 To demonstrate this linear regression of the plotted data
is needed and the resulting slope multiplied by the inverse of the molar gas constant
(R = 83144 JmiddotKminus1middotmolminus1) gives directly the value of ∆H At 20 MPa ∆H was found
equal to -51 plusmn 6 kJmiddotmolminus1
Consequently the complexation process is exothermic and since the species are
more entropically ordered it explains the decrease of the K values with the increase of
temperature In other respects it is important to remember that for this calculation
11 Crown Ether-Water Interaction In Supercritical CO2 66
30
35
40
45
50
080 082 084 086 088 090 092 094 096 098 100
k (
)
Density of CO2 (gcm-3)
Figure 17 Molar fraction of crown ether bonded to water k versus density at constanttemperature (40 C) Lines are guides for the eyes and do not have any theoretical oranalytical value
I needed to assume that ∆H is independent of density This result is in accordance
with the values for hydrogen bonding in the literature57
Figure 19 shows the dependence of [D2O] on the global equilibrium constant K
The amount of free water in CO2 decreases when K increases This dependence
appears to be linear simply because the range of the water concentration data is too
narrow to clearly display any curvature as expected from equation 112
Conclusion
This section was devoted to the study of water-crown ether interaction in sub- and
supercritical CO2 using FT-IR This analytical technique allows us to see the different
configurations including bridge single and sandwich forms between water and crown
ethers The equilibrium constant the molar fraction of crown ether bonded to water
and the amount of free water were determined for the bridge and single configurations
at different pressures and temperatures From these data the enthalpy of the hydro-
11 Crown Ether-Water Interaction In Supercritical CO2 67
0
1
2
3
4
5
6
7
29 30 31 32 33 34 35
ln K
1000T
Figure 18 Dependence of ln K on 1000T at 20 MPa
gen bond was found to be -12 plusmn 2 kJmiddotmolminus1 and -38 plusmn 3 kJmiddotmolminus1 for the single and
the bridge configurations respectively These results correspond to a total enthalpy
of -51 kJmiddotmolminus1for the two hydrogen bond configurations as found in the global study
that lumps together the equilibra of the bridge and the single configuration in one
equilibrium This last group of results will be compared in the next section section
123 to the one in organic solvent using NMR (Nuclear Magnetic Resonance) as a
method of analysis
11 Crown Ether-Water Interaction In Supercritical CO2 68
0026
0028
0030
0032
0034
0036
0038
0040
0 50 100 150 200
[D2O
] free
(m
olL
-1)
K = Ks x Kb (L-2mol-2)
Figure 19 Dependence of free water [D2O] on the equilibrium constant K
12 Crown Ether-Water Interaction in Solvents
Introduction
The main objective of the work describe in this section is to understand the role of
the solvent in the interaction between water and crown ethers This interaction will
be compared to the one in supercritical CO2 described in the previous section The
description of this interaction will lead to a better understanding of cesium extraction
using crown ethers This interaction was studied with Nuclear Magnetic Resonance
(NMR) spectroscopy I will therefore describe this analytical tool before discussing
the water-crown ether interaction in more detail
The history of NMR started in the late thirties with the discovery by Rabi of
the magnetic moment In 1946 two different research groups observed for the first
time an NMR signal Bloch Hanse and Packard from Stanford University detected
the signal 1H of water while Purcell Torrey and Pound from Harvard University
detected it in paraffin wax Bloch and Purcell shared the Nobel prize of Physics
in 1952 for this discovery Since then numerous improvements have been made and
NMR is nowadays the most important and most used technique to determine chemical
structures or to perform Magnetic Resonance Imaging (MRI)
Basically the NMR spectroscopic technique is based on measuring the absorption
of Radio Frequency (RF) radiation from the nucleus in a strong magnetic field After
the absorption of the radiation the spin of the nucleus will go to its highest energy
state Thereafter the nucleus will return to its initial state by emitting RF radiation
which is recorded versus time for the spectrum
The principle of the NMR operation is described in more details as follows The
nucleus of some atoms has an angular moment ~M these nuclei are therefore similar
to an electric charge in rotation As a result the nucleus has a nuclear magnetic
moment ~micro that is directly proportional to the angular moment The constant of pro-
portionality γ is called magnetogyric ratio and it is a characteristic of each particular
12 Crown Ether-Water Interaction in Solvents 70
nucleus When a nucleus with a magnetic moment is placed in a magnetic field ~H0
it gains an excess of potential energy Es where
Es = minus~micro middot ~H0 = minusγ ~M middot ~H0 (118)
The projection of ~M over ~H0 is quantified in the sense that it can only take integral
or half integral multiples of ~ which is the Plank constant (h = 66261times 10minus34J middot s)
divided by 2π Hence this projection Mz can take 2I+1 values
Mz isin I~ (I minus 1)~ (1minus I)~minus~ (119)
where I is the nuclear spin quantum number The spin quantum number I can take
different values (0 12 1 32 2 cf Table 12) depending on the nucleus
Table 12 Values of I the quantum spin number for different nucleus
1H 2H 12C 13C 14N 15N 19F 31P 16O 17O 133Cs 137Cs12 1 0 12 1 12 12 12 0 52 72 72
Nuclei with a nuclear spin quantum number equal to zero do not have a nuclear
magnetic moment and therefore can not be seen by NMR The analysis of the spin
state I = 12 is very straightforward because of its spherical charge distribution with
no electric quadrupole moment This is why NMR is intensively used to analyze
hydrogen nuclei and to less extent carbon 13 fluorine 19 and phosphorous 31 nuclei
Therefore for the rest of this presentation I will consider only the properties of the
I = 12 spin state
According to equations 118 and 119 with a spin state of I=12 Mz = 12~ or
minus12~ and Es = minus12~γH0 or +12~γH0 Therefore a nucleus which has a potential
energy E in the absence of magnetic field will have two different possible energies
when placed in a magnetic field ~H0 (Figure 110 The difference between these two
energies ∆E is equal to γ~H0
The number of nuclei in each energy state follows the Boltzmann relation
n2
n1
= eminus∆EkBT = eminusγ~H0kBT (120)
12 Crown Ether-Water Interaction in Solvents 71
Figure 110 Potential energy of a nucleus with a spin state I=12 outside and insidea magnetic field
where n1 and n2 are the number of nuclei in the state E1 = E + Es1 and E2 =
E +Es2 kB is the constant of Boltzmann (kB = 138066times 10minus23J middotKminus1) and T is the
temperature in K Consequently more nuclei are in the state E1 than in the state E2
However nuclei can transit from state E1 to E2 under an adequate electromagnetic
field The frequency of this electromagnetic wave follows the Einstein equation
hν = ∆E = γ~H0 (121)
which leads to defining the frequency
ν =γH0
2π(122)
which is generally in the radio frequency wavelength ie from 20 to 900 MHz for a
magnetic field strength between 1 and 20 Tesla For comparison the earth magnetic
field is approximately 10minus4 T and the energy of a IR transition is a thousand times
greater whereas the one of an electronic transition is nearly one million times greater
NMR is a sensitive and non destructive analytical method but it has drawbacks
The equipment is very expensive because it needs to be able to observe a very little
change in frequency or energy and at the same time it needs to be capable of pro-
ducing a very strong magnetic field A typical NMR experiment setup is represented
as a simplified diagram in Figure 111 During the NMR experiment represented in
figure 112 the sample is placed in a tunable magnetic field and irradiated with RF
12 Crown Ether-Water Interaction in Solvents 72
waves from a transmitter The wave frequency is maxed out for the proton NMR
(ie it is chosen close to 500 MHz when a 500 MHz spectrometer is used and close
to 300 MHz with a 300 MHz spectrometer) The time during which the sample is
irradiated is called pulse-width and lasts 1 to 30 micros depending on the system studied
The pulse-width can also be given in degrees which correspond to the angle that the
spin has with the z-axes at the end of the pulse During irradiation waves having
the same energy as the energy difference between the spin states of the nuclei are ab-
sorbed in the sample This matching of energies (frequencies) is called the resonance
When the nuclei in the sample returns to its normal state RF waves are emitted and
acquired by the receiver Wave intensities are then recorded as a function of time
and the resulting graph is called the Free Induction Decay (FID) Acquisition lasts
for several seconds and the process is performed several times to reduce the signal to
noise ratio In between pulses the sample has to go back to equilibrium (relaxation)
to avoid the overlapping of the signals this is the relaxation delay that takes 5 to 20
seconds depending on the sample Therefore the time between scans is equal to the
pulse-width (which is relatively small and can be ignored) plus the acquisition time
plus the relaxation delay After the last scan the FID is finally Fourier transformed
to obtain the spectra of the intensities versus frequencies
Proton NMR (PNMR) is the most commonly used NMR spectroscopy because
of the abundance of hydrogen in organic molecules and because of the simplicity of
its spectral interpretation Each peak in such spectra offers three characteristics
location intensity and coupling
First the location of a peak is defined as the frequency at which the proton enters
in resonance This property depends on the electron(s) surrounding the nucleus
Electrons are responsible for bonds between atoms and as charged particles they are
responsive to the external magnetic field When electrons are put in a magnetic field
H0 they would move to compensate for the effect of H0 and therefore shield the
nucleus that will enter in resonance at a higher frequency As a consequence one can
12 Crown Ether-Water Interaction in Solvents 73
Figure 111 Nuclear magnetic resonance experiment4
have an idea of the surrounding of the atom observed depending on the location of a
peak The downside is that this location will differ from one spectrometer to another
indeed the location of a peak is dependent on both the RF and the strength of the
magnetic field and the later can not be standardized due to magnet differences To go
around this problem most scientist use as a reference a compound that is chemically
nonreactive gives a single sharp peak and does not interfere with the resonances of
the species in the sample studied The compound that meets all these specifications is
TetraMethylSilane (CH3)4Si or TMS The frequency of a peak δ is called a chemical
shift (from that of the TMS taken as a reference) Nevertheless there is another
problem with the spacing between the peaks being still not standardized The way
to solve his problem is to divide the frequency observed of the peak by the frequency
of the spectrometer (ie 100 or 500 MHz) Since the number obtained is very small
(Hz divided by MHz) the result is multiplied by one million and the part per million
unit (ppm)is used
12 Crown Ether-Water Interaction in Solvents 74
Figure 112 Acquisition sequence for a nuclear magnetic resonance experiment
The second characteristic of a PNMR spectrum is intensity The intensity of a peak
for a nucleus type is directly proportional to the number of nuclei having exactly the
same electronic surroundings These nuclei are called isochronous because they show
at the same chemical shift For example the peak of the three protons of a methyl
group will show at the same chemical shift and the peak will have an intensity three
times greater than the one of an alcohol group
Coupling is the third major property of a PNMR spectrum When different sets
of hydrogen atoms are close together in a molecule (ie when there is generally three
bonds or less in between them) there is a spin-spin interaction and their nuclei are
coupled For example the spectrum of ethanal (CH3CHO Figure 113) can be looked
at In this molecule a proton from the methyl can ldquoseerdquo the proton from the aldehyde
group they are coupled Therefore the methyl peak will be split in a doublet In the
same way the proton from the aldehyde group can ldquoseerdquo the three protons from the
methyl group and the proton peak from the aldehyde will split in a quartet (Figure
114 a)
12 Crown Ether-Water Interaction in Solvents 75
In all cases the space between the coupled peaks is constant for a given multiplet
and it is called coupling constant (J) J is independent of the magnetic field strength
and is the same for both groups of the same spin-spin interaction Quantitatively J
value is generally between 2 and 10 Hz In Figure 114 the ideal splitting patterns are
shown with their intensities A group will split in a doublet if itldquoseesrdquo one proton to
a triplet if it ldquoseesrdquo two in a quartet if it ldquoseesrdquo three etc The global intensity is the
same as the one you would have with a single peak but the relative intensity depends
on the tree shown in Figure 114 b It happens nevertheless that the chemical shifts
are too close to one another and the pattern of the multiplets are distorted
In this section I will present the experimental setup and a summary of the results
that are detailed in the paper ldquoPartition Coefficients and Equilibrium Constants of
Crown Ethers between Water and Organic Solvents Determined by Proton Nuclear
Magnetic Resonancerdquo which I published with other colleagues This paper is repro-
duced as appendix G At last I will compare the results from this section to the one
using FT-IR in solvents
121 Experimental Section
All chemicals were purchased from Aldrich Chemical Company and used without
further purification Chloroform was used in its deuterated form (995 CDCl3) and
the water phase contains 5 D2O by volume
The crown ethers were diluted in the CDCl3 + CCl4 mixtures with a concentration
range of 002 to 02 molmiddotLminus1 These solutions were subsequently mixed with an equal
volume of the D2O-enriched water and the equilibrium was reached by shaking the two
phases with a wrist-type shaker for 2 hours or more The studies involving 15-crown-
5 18-crown-6 and dicyclohexano-18-crown-6 in solvents containing high percentages
of CCl4 required longer shaking time to get consistent data After the shaking the
mixtures were centrifuged for one hour
The remaining organic and aqueous phases were then analyzed by proton NMR
12 Crown Ether-Water Interaction in Solvents 76
using a 500 MHz Bruker DRX500 spectrometer To obtain quantitative results 16
scans were taken and for each the pulse interval was set to 113 sec (acquisition time
33 sec relaxation delay 8 sec) The pulse-width was 30 degrees (corresponding to a 2
micros pulse) in all systems (organic aqueous with or without chelator agent) Chemical
shifts in the organic phase were calibrated by setting the chloroform chemical shift to
724 ppm For the solvent mixtures containing CCl4 the chloroform resonance peak
shifts upfield (lower ppm) as CCl4 was added The shift was measured by turning
off the field lock this operation allows the comparison of the solvent mixtures at
constant field A 014 ppm shift was observed when the solvent used is 25 CHCl3 in
CCl4 instead of 100 CHCl3 An upfield correction was then added for all mixed
solvent samples run with a CDCl3 field lock The intensity (based on integrated area
calculations for all data) of the water peaks in the Proton-NMR (PNMR) spectra
was corrected for the 5 D2O (by volume) present in the water phase For the 100
CCl4 mixture an insert filled up with benzene-d6 has been used as a reference for
the intensity and the chemical shift which was set at 715 ppm
Typical PNMR spectra for 18-crown-6 in the CDCl3 phase are shown in Figure
115 A single resonance peak for the protons belonging to unsubstituted crown ethers
is generally observed in the region between 3 and 4 ppm The free water and the
bonded water are in rapid exchange in solution due to the equilibrium The observed
water resonance peak consists then of an average of the resonance of the free water
and the bonded water Thus the resonance peak for the water shifts downfield as the
concentration of the bonded water is increased which correspond to an increase in
ligand concentration The concentration of the ligand in the organic phase has been
corrected for its solubility in the aqueous phase based on PNMR measurements of its
partition between the two phases
12 Crown Ether-Water Interaction in Solvents 77
122 Summary of Results
The influence of solvent on water-crown ethers interaction was studied by NMR in
chloroform and carbon tetrachloride mixtures The two configurations (single or
bridge) of 11 water-crown ether complex that have been observed by Moyer et al36
in carbon tetrachloride using FTIR cannot be distinguished by NMR analysis There-
fore only one complex taking in account the two configurations is used for the differ-
ent calculations The analysis of the data shows that water and crown ether form a
11 complex in rapid exchange with uncomplexed ligand and water The crown ether
concentrations used for this study are small enough to avoid the formation of a 12
complex or ldquosandwichrdquo between one water and two crown ether molecules
Different constants were determined in the course of this study First the partition
coefficient (D) for crown ether between the two phases was found to depend strongly
on the solvent Its value for 18-crown-6 varies from 025 plusmn 002 in a 100 CDCl3 so-
lution to 48 plusmn 3 in a 100 CCl43 Otherwise D stays in the same order of magnitude
for different crown ethers soluble in water Second the equilibrium constant (K) and
the molar fraction (k) of crown ether complexed with water were measured They
were found to depend strongly on the cavity size For example k varies from 15 plusmn
1 for 12-crown-4 to 97 plusmn 5 for 18-crown-6 in chloroform Moreover the molar
fraction k is reduced to 70 for DC18C6 in 100 CDCl3 which shows the effect of a
substituant like the cyclohexane In the other hand the molar fraction k varies from
97 plusmn 5 in 100 CDCl3 to 61 plusmn 3 in 25 CDCl3 in CCl4 for 18-crown-6 which
shows that k is also affected by the solvent used Last the chemical shifts of free and
complexed water in the organic phase were determined for each solvent mixture and
each crown ether
123 Comparison to FT-IR Results in CO2
Beside the difference in solvent and in the spectroscopic tool used there is a third
difference between the two experiments In the first experiment (using FT-IR in CO2)
12 Crown Ether-Water Interaction in Solvents 78
the total amount of water in the organic phase is constant and completely dissolved
in the organic phase In the second experiment (using NMR in solvents) the amount
of free water is constant but the total amount of water is not constant as there
is a reservoir of water allowing water to go in the organic phase to be bonded to
crown ether when the crown ether concentration increases Therefore the partition
coefficient of water between the organic and the water phase was not determined in
the first experiment The only data that I can compare is the equilibrium constant
(K) and the molar fraction of ligand complexed to water (k) In an effort to clarify
this distinction in the rest of this section these constants will be respectively called
K1 and k1 for the first experiment using FT-IR in CO2 and K2 and k2 for the second
experiment using PNMR in solvents The values of theses constants are detailed in
Table 13
Table 13 Comparison of the values of the equilibrium constants K1 and K2 and ofthe molar fractions of ligand complexed to water k1 and k2
CO2 CDCl3CCl4 mixturesPressure Temperature Density K1 k1 CDCl3 K2 k2
MPa C gmiddotLminus1 L2middotmolminus2 vol Lmiddotmolminus1
202 60 724 34 33 25 141 61202 40 840 161 45 50 97 63200 25 913 298 54 75 102 79
202 40 840 161 45 50 97 63405 40 956 64 35 100 545 97
In CO2 at constant pressure the values of K1 and k1 decrease with an increase
in temperature and their values decrease as well at constant temperature with an
increase in pressure Whereas in CDCl3 and CCl4 mixtures the values of K2 and k2
decreases as the percentage of CDCl3 in CCl4 decreases Therefore at high pressure
and temperature regarding the equilibrium constants and the molar fraction of ligand
bonded to the water CO2 behave more like CCl4 which is a nonpolar solvent (its
12 Crown Ether-Water Interaction in Solvents 79
dielectric constant ε = 224 and its electric dipole moment in the gas phase micro is equal
to zero58) On the other hand when the temperature and pressure of CO2 decreases
its properties are closer to the one of CDCl3 which is a polar solvent (CHCl3 dielectric
constant ε = 481 and CHCl3 electric dipole moment in the gas phase micro = 101 D58
the isotopic effect is weak for these properties and their values should be closed to
the one of CDCl3)
The amount of free water in solvents can be compared to the one in CO2 Numer-
ous published studies have recorded the solubility of water in sub and supercritical
CO25960 Values obtained from Argonne National laboratory in collaboration with
Michael J Chen6162 are reproduced in Table 14 and are compared with the one from
Fulton et al59 to the one in different mixtures of CCl4 and CDCl3 At constant tem-
perature and at increased pressure [H2O] increases to reach approximately the value
of free water in CDCl3 when the density exceeds 08 gcmminus3 When the density is fixed
at 900 gmiddotLminus1 or the pressure is fixed at 345 MPa the amount of free water increases
rapidly when the temperature is increasing Regarding water solubility CO2 behaves
like CCl4 at low pressure and temperature and shifts to a behavior resembling that
of CDCl3 when the temperature andor the pressure increases
Table 14 Comparison of water solubilities in solvents and in CO2
CO2 CDCl3CCl4 mixturesPressure Temperature Density [D2O] CDCl3 [H2O]
MPa C gmiddotLminus1 molmiddotLminus1 vol molmiddotLminus1
83a 35 576 0032 0 000176a 35 845 0067 25 0011262a 35 909 0074 50 0017362a 50 905 0122 75 0037455a 65 901 0183 100 0060345b 50 804 0137345b 75 896 0271
a Michael J Chen6162 b Fulton et al59
12 Crown Ether-Water Interaction in Solvents 80
Conclusion
This study shows that interaction between water and crown ethers depends strongly
on the crown ether used and on the nature of solvents The main factor of this
dependence is the polarity of the solvent As the polarity increases (decrease of
CCl4 concentration in CDCl3) the molar fraction (k) of crown ether complexed with
water increases from 61 to 97 for 18-crown-6 These values can be compared to the
ones in supercritical fluids where regarding the values of k CO2 behaves more like
CDCl3 at low temperature and low pressure These tendencies are the same regarding
the equilibrium constant K in both systems whereas it is the opposite for the quantity
of free water in the oil that is the same as the solubility of water in oil This value
increases with the polarity of the solvent and increases with increasing pressure and
temperature Therefore CO2 is a tunable solvent that can behave like a polar or non
polar solvent depending on the property observed and its pressure temperature and
density
These data are important for understanding and improvement of liquid-liquid
extraction of metallic ions with crown ethers where water plays an important role
Section 13 will show this importance for cesium extraction
12 Crown Ether-Water Interaction in Solvents 81
1211
109
87
65
43
21
0
240
220
200
180
160
140
120
100
8060
4020
0
CD
Cl 3
QE
-300
Figure 113 P-NMR spectrum of the ethanal molecule (CH3CHO)5
12 Crown Ether-Water Interaction in Solvents 82
Figure 114 coupling due to spin-spin interactions and relative intensities
12 Crown Ether-Water Interaction in Solvents 83
Figure 115 Typical PNMR spectra of 18-crown-6 in the CDCl3 phase The concen-trations of 18-crown-6 after equilibrium with water are 000 0002 0075 and 0153molmiddotLminus1 (from top to bottom) and the water peaks are at 1565 1874 2393 and2668 ppm respectively
13 Introduction to Cesium Extraction Equilibrium
Using Crown Ethers
Introduction
The purpose of this section is to show the importance of the water in the equilibrium
describing the solvent extraction of cesium picrate using Dicyclohexano-18-crown-6
(DCH18C6) as a ligand This section complements the previous presentation of the
interaction between water and crown ethers in various solvents (section 12) I must
first describe the origin and properties of cesiumndash137 before venturing into the details
of its extraction equilibria
Cesiumndash137 (137Cs) is an isotope produced by the fission of uranium-235 which
takes place in nuclear reactors or when an atomic bomb is detonated It is radioactive
with a physical half-life of 3017 years It can be found in the soil and is metabolized
in plants and animals Its concentration is particularly high in wild animals and in
mushrooms because of the specificity of game way of eating and mushrooms accumu-
lation mechanisms Furthermore those species are generally found in forests where
the soil is protected from rain washing and wind dispersion causing a slow natural
decrease in concentration
Soil contamination is mainly the result of atmospheric nuclear weapon tests and
of the Chernobyl reactor accident The contamination is high in Ukraine and Russia
and still a concern in western Europe 137Cs is dangerous for the human consumption
because it is recognized by the body and accumulated mimicking potassium which is
important in the transmission of nerve messages Like any radioactive material it also
increases the risk of cancer when inhaled or ingested 137Cs contamination of land
and foodstuffs in the territories around Chernobyl is a major problem as thousands
of square miles of land in Belarus Russia and Ukraine cannot be used for agricultural
production whereas in some areas the population had to be relocated These social
and economic consequences of 137Cs contamination will remain for decades unless a
13 Introduction to Cesium Extraction Equilibrium 85
decontamination solution is found
Nuclear waste from power plants is another source of 137Cs This isotope is abun-
dant in Spent Nuclear Fuel (SNF) and is largely responsible for the heat produced in
such waste 137Cs has a relatively long half-life (3017 years) and therefore it survives
the short-term storage period of 10 years commonly allocated for SNF In order to
recycle the uranium and the plutonium from nuclear waste one should clean it up
by removing other isotopes like strontium-90 and 137Cs Furthermore 137Cs can be
recycled and used for radiotherapy at cancer medical centers
Crown ethers with their particular geometry can be used to extract and separate
alkali ions from soil water or other media Their cavity varies in size depending on
the number of oxygen atoms forming it They can thus be selective for one specific
ion size like the cesium cation In this section I am presenting a new model allowing
the calculation of the interaction between crown ether water and cesium picrate
in a two-phases medium The crown ether chosen for this study is dicyclohexano-
18-crown-6 (Figure 116 a) Its cavity size is compatible with the extraction of
the cesium ion The two cyclohexane molecules attached to the crown ether force
the cavity to be open in a ldquoplanerdquo conformation which is more favorable for the
extraction Furthermore the DCH18C6 is not soluble in water which simplifies the
calculations and the understanding of the equilibrium Because of the explosive nature
of the picrate ion (Figure 116 b) chosen as a counter ion I could not analyze these
interactions in supercritical fluid by FT-IR I had to use like in the previous section
NMR as an analytical instrument and chloroform as a solvent The radioactive 137Cs
and the stable Cesium-133 isotopes have the same chemical properties therefore I
used 133Cs isotope for the following experiments that describe crown etherndashwaterndash
cesium picrate interactions that occur during the extraction of cesium from water
with chloroform
13 Introduction to Cesium Extraction Equilibrium 86
Figure 116 Molecular structure of dicyclohexano-18-Crown-6 (a) and of Cesiumpicrate (b)
131 Experimental Work
Dicyclohexano-18-crown-6 (DCH18C6 98 pur) chloroform-d (995 CDCl3) were
purchased from Aldrich Chemical Company and used with no further purification
Cesium picrate was synthesized from cesium chloride and picric acid and was recrys-
tallized in water Its purity is estimated to be over 95 because no impurity peak
can be seen in the NMR spectra of the specie dissolved in water (5 D2O)
The ligand was dissolved in chloroform-d (in the concentration range of 005ndash04
molmiddotLminus1) whereas the cesium picrate was dissolved in water (in the concentration
range of 001ndash012 molmiddotLminus1) The two solutions were mixed in equal volume for 4
hours to reach equilibrium Both phases were analyzed with a 500 MHz Brucker
DRX500 spectrometer The pulse interval was set to 9 sec (acquisition time 3 sec
relaxation delay 6 sec) DCH18C6 has a very low solubility in water and is not
detectable in the water phase by NMR Thus its solubility in water was considered
equal to zero and it was used as a standard for the peak integration in the organic
phase
Two typical PNMR spectra for DCH18C6 with water and cesium picrate in the
CDCl3 phase are shown in Figure 117 where the initial ligand concentration ([L]) is
13 Introduction to Cesium Extraction Equilibrium 87
04 molmiddotLminus1 and the initial cesium picrate concentration ([CsPi]) is 30 mmolmiddotLminus1 and
in Figure 118 where [L] = 005 molmiddotLminus1 and [CsPi] = 8 mmolmiddotLminus1 The chloroform
chemical shift was set at 724 ppm and used for the calibration of all other chemical
shifts in the organic phase The group of peaks around 36 ppm is attributed to
the 20 protons of the crown ether ring whereas the 4 peaks for the protons of the
cyclohexanes are between 1 and 2 ppm The single resonance peak for the two equiv-
alent protons of the picrate ion is found at 88 ppm The free water and the bonded
water are in rapid exchange in the solution due to their equilibrium The observed
water resonance peak consists of an average of the resonance of the free water and
the bonded water in CDCl3 Thus the resonance peak for the water shifts downfield
as the ligand concentration is increased In these spectra the water resonance in
CDCl3 is found at 22 ppm (Figure 118) and 29 ppm (Figure 117) In this last
figure the concentrations are very low and the contamination of a water droplet can
be seen at 47 ppm which correspond to the chemical shift of water in water
00 20 40 60 80 100
ppm
Figure 117 Typical PNMR spectrum for DCH18C6 (at 04 molmiddotLminus1) with water andcesium picrate (at 30 mmolmiddotLminus1) in the CDCl3 phase)
13 Introduction to Cesium Extraction Equilibrium 88
00 20 40 60 80 100
ppm
Figure 118 Typical PNMR spectrum for DCH18C6 (at 005 molmiddotLminus1) with waterand cesium picrate (at 8 mmolmiddotLminus1) in the CDCl3 phase)
132 Calculations
NMR spectra give directly the total concentration of cesium picrate (CsPi) ligand
(L) and water in the organic phase by an integration of the peaks belonging to the
former species In order to simplify the notation the suffix ldquoaqrdquo was added to the
species in the aqueous phase whereas no suffix was added to the species in the organic
phase
Equilibrium Model Between the Two Phases
The partition of water crown ether and cesium picrate between the organic and the
aqueous phase is described as
H2Oaq H2O (123)
Laq L (124)
CsPiaq CsPi (125)
13 Introduction to Cesium Extraction Equilibrium 89
Equilibrium Model in the Organic Phase
In the organic phase the interaction between water cesium picrate and DC18C6
follows the equilibrium reactions
CsPi + L CsPiL (126)
CsPiL + L CsPiL2 (127)
L + H2O LmiddotH2O (128)
CsPiL + H2O CsPiLmiddotH2O (129)
CsPiL2 + H2O CsPiL2middotH2O (130)
Equilibrium Constants
Equilibrium constants corresponding to equations (126) through (130) are respec-
tively defined as
K1 =[CsPiL]
[CsPi][L](131)
K2 =[CsPiL2]
[CsPiL][L](132)
Ka =[LmiddotH2O]
[L][H2O](133)
Kb =[CsPiLmiddotH2O]
[CsPiL][H2O](134)
Kc =[CsPiL2middotH2O]
[CsPiL2][H2O](135)
13 Introduction to Cesium Extraction Equilibrium 90
Determining the Concentration of Different Species
The total unbonded water concentration [H2O] is constant at equilibrium because of
the equilibrium relation (123) To facilitate further calculation the following notation
is employed for the former equilibrium constants
kx = [H2O]Kx (136)
with x = a b or c
Material balance at equilibrium leads to equations (138) (140) and (142) where
the ldquoorgrdquo suffix is used for the total concentration in the organic phase
[L]org = [L] + [LmiddotH2O] + [CsPiL] + [CsPiLmiddotH2O] + 2[CsPiL2] + 2[CsPiL2middotH2O]
(137)
rArr [L]org = (1 + ka)[L] + (1 + kb)[CsPiL] + 2(1 + kc)[CsPiL2] (138)
[CsPi]org = [CsPi] + [CsPiL] + [CsPiLmiddotH2O] + [CsPiL2] + [CsPiL2middotH2O] (139)
Cesium picrate solubility in the organic phase is very low and considered as null
rArr [CsPi]org = 0[L] + (1 + kb)[CsPiL] + (1 + kc)[CsPiL2] (140)
[H2O]org = [H2O] + [LmiddotH2O] + [CsPiLmiddotH2O] + [CsPiL2middotH2O] (141)
rArr [H2O]org minus [H2O] = ka[L] + kb[CsPiL] + kc[CsPiL2] (142)
Equations (138) (140) and (142) can be put in a matrix product as follows
[L]org
[CsPi]org[H2O]org minus [H2O]
= A
[L][CsPiL][CsPiL2]
(143)
13 Introduction to Cesium Extraction Equilibrium 91
where A is a 3times3 matrix defined as
A =
1 + ka 1 + kb 2(1 + kc)0 1 + kb 1 + kc
ka kb kc
middot (144)
The resulting [L] [CsPiL] and [CsPiL2] concentrations can then be found by solving
equation (143) to get
[L][CsPiL][CsPiL2]
= Aminus1
[L]org[CsPi]org
[H2O]org minus [H2O]
(145)
where
Aminus1 =1
minusDmiddotB (146)
B =
kb minus kc minuskb(kc + 2) + kc (1 + kb)(1 + kc)minuska(kc + 1) ka(kc + 2)minus kc (1 + ka)(1 + kc)ka(kb + 1) kb minus ka minus(1 + ka)(1 + kb)
(147)
and
D = (1 + ka)(kc minus kb)minus ka(1 + kb)(1 + kc) (148)
The unbonded water concentration calculations are shown later on in this section
Other species concentration can be derived directly from the ka kb and kc values as
shown by equations (133) through (136)
Determination of ka and k
The molar fraction of water molecules bonded to the ligand k is defined by
k =[LmiddotH2O]
[L]+[LmiddotH2O](149)
13 Introduction to Cesium Extraction Equilibrium 92
Because of equilibrium (123) the unbonded water concentration in the organic phase
([H2O]) is independent of the other species dissolved and thus independent of the
[LmiddotH2O][L] ratio and k
When no cesium picrate is added to the solution the material balance is
[H2O]org = [H2O] + [LmiddotH2O] (150)
[L]org = [L] + [LmiddotH2O] (151)
Combining the material balance relations (150) and (151) with equation (149) the
linear relation
[H2O]org = k[L]org + [H2O] (152)
can be derived According to this equation a linear plot of [H2O]org versus [L]org
should give the value of k as the slope and the unbonded water concentration that
is constant and is independent of the other dissolved species as the y-axes intercept
Replacing [LmiddotH2O] by ka[L] using equations (133) and (136) in equation (149) leads
us to determine the relationship between k and ka from
k =ka
1 + ka
(153)
or
ka =k
1minus k(154)
Determination of the Constants kb and kc
The constants kb and kc are respectively dependent on the concentrations of the
CsPiL complex and on the CsPiL2 ldquosandwichrdquo which are used to calculate K2 There-
13 Introduction to Cesium Extraction Equilibrium 93
fore the correct values of kb and kc are the one for which K2 is constant for a large
set of data As a consequence values of the constants kb and kc were calculated
by minimizing the standard deviation on the equilibrium constant K2 for different
concentrations in ligand (from 005 to 040 molmiddotLminus1) and in cesium picrate (up to 012
molmiddotLminus1)
133 Results and Discussion
The total water versus cesium picrate concentration in the organic phase for different
ligand concentrations is shown in Figure 119 Since unbonded cesium picrate is
insoluble in the organic phase all the cesium picrate in these experiments is bonded
As expected the total water concentration in the organic phase decreases when the
cesium picrate concentration increases Indeed the cesium picrate is captured inside
the crown ether cavity instead of water There is then less water than can be carried
out from the water phase to the organic phase by crown ether
000
005
010
015
020
025
030
035
040
000 002 004 006 008 010 012
[H2O
] org
(m
olL
)
[CsP]org (molL)
[L] = 040 M[L] = 030 M[L] = 020 M[L] = 010 M[L] = 005 M
Figure 119 Total cesium picrate concentration versus water concentration in theorganic phase for different initial ligand (L = DCH18C6) concentrations (from 005to 04 molmiddotLminus1)
13 Introduction to Cesium Extraction Equilibrium 94
The y axis intercept value for each ligand concentration in Figure 119 gives the
water concentration in the organic phase when no cesium picrate is added to the
solution A plot of this value versus the ligand concentration is shown on Figure 120
000
005
010
015
020
025
030
035
040
00 01 02 03 04 05
[H2O
] org
(m
olL
)
[L]org (molL)
Figure 120 Total water concentration versus total ligand concentration in the organicphase
The constant unbonded water concentration in the organic phase is found to be
007 plusmn 001 molmiddotLminus1 using the linear regression on the data shown in Figure 120
and equation (152) This value is in good agreement with the experiment and with
another calculation made in section (121) on page 75 that involved different crown
ethers and water equilibrium in chloroform The equation (152) also gives the molar
fraction of water molecules bonded to the ligand (k) It is found to be 73 plusmn 4 and
confirms the value found in section (122) for DC18C6 (70) Therefore about 30
of water in solution is not bonded to the crown
The equilibrium constant Ka was found via equation (136) and (154) to be equal
to 38 plusmn 13 L middotmolminus1 This result is in accordance with the previous study in section
(121) where Ka (named K in section (121)) was equal to 32 plusmn 3 Lmiddotmolminus1
13 Introduction to Cesium Extraction Equilibrium 95
The equilibrium constant Kc was found to be equal to zero Therefore there
is no sandwich between two crown ethers and one cesium picrate when the water
is involved The only sandwich forms in the organic phase are not complexed with
water
The equilibrium constant Kb was found to be equal to 21 plusmn 7 L middotmolminus1 Thus the
111 complex between crown ether water and cesium picrate is preferred to the one
without water
The equilibrium constant K2 was found to be equal to 47 plusmn 15 L middot molminus1 This
last result implies that when no water is involved in the complexion process the
sandwich form between two crown ethers and one cesium picrate is preferred than
the 11 complex between one crown ether and one cesium picrate
Conclusion
In this section the cesium picrate-water-crown ether interactions were fully described
using chloroform as a solvent The importance of the role of water in the solvent
extraction of cesium was demonstrated The molar fraction of water bonded to the
ligand (DCH18C6) k was calculated from the measured data and found to be 73 plusmn
4 This result confirms the value calculated in the study of the crown etherndashwater
interaction in chloroform without cesium picrate (ie 70 plusmn 4 in section 122 page
77) This result implies that there is only 30 of the water that is not bonded in the
organic phase
Cesium extraction was described using four equilibrium reactions The calculation
of the equilibrium constants leads to three conclusions
1 The sandwich configuration in between two crown ether and one cesium picrate
is not possible if water is part of it
2 The onendashtondashone complex of the cesium picrate with the crown ether is preferred
with water than without
13 Introduction to Cesium Extraction Equilibrium 96
3 the ldquosandwichrdquo configuration is preferred to the onendashtondashone complex when no
water is involved
It was also observed that the amount of water in the organic phase decreases with
the increase of the cesium picrate concentration (Figure 119) It seems that the water
is competing with crown ether to be carried out of the water phase The efficiency of
the extraction might be enhanced in a ldquowaterndashfreerdquo extraction
For future consideration additional experiments need to be performed in super-
critical CO2 to find out if cesium extraction is efficient enough and confirm the fea-
sibility of large scale plants to extract cesium from spent nuclear fuel (SNF) or clean
large contaminated areas
Conclusion 97
Conclusion
In this chapter the interaction between water and crown ethers was studied in sub and
supercritical CO2 and in organic solvents that have physical properties comparable to
the ones of CO2 Two different spectroscopies were used to describe these interactions
First the FT-IR spectroscopy used in CO2 and second the NMR spectroscopy used
in organic solvents These two spectroscopies have their specific advantages and
drawbacks The FT-IR spectroscopy is a simple and affordable technique and most
chemical laboratories possess a FT-IR spectrometer The interpretation of a FT-IR
spectrum can shed light on the bonds involved in a chemical system On the other
hand NMR is very accurate in regard to the qualitative and quantitative analysis
and its spectrum interpretation is straightforward However it is an expensive device
that is complex to operate and because of these reasons it is not as easily usable as
FT-IR in a non-conventional way The versatility of the FT-IR technique allows the
conduct of experiments in supercritical fluids that were not possible to perform with
our NMR equipment
First the crown etherndashwater interaction were studied in supercritical CO2 and
then in solvents that have a low dielectric constant and that are believed to have
solubility parameters in the same magnitude as the one of CO2 Carbon tetrachloride
and chloroform were selected as solvents and to investigate their properties mixtures
of these two solvents at different volume ratios were used It was demonstrated that
regarding the equilibrium constant K and the molar fraction of ligand complexed
with water k CO2 acts like a solvent with high dielectric constant at low temperature
and pressure and its behavior gets closer to the one of CCl4 when temperature and
pressure increase On the other hand with regards to the solubility of water in the
CO2 phase (amount of free water) it is the opposite That is the solubility increases
with an increase in temperature and pressure in the same manner it increases as the
dielectric constant of the solvent increases
Conclusion 98
Finally experiments were conducted with cesium and the important role of water
in the extraction process was demonstrated No sandwich can be formed between
two crown ethers and a cesium picrate with water bonded to it Conversely the 11
complex seems to be preferred with water The amount of water tends to increase
with an increase in the concentration of the ligand in the organic phase because the
ligand carries water into the oil It was also observed that the amount of water in
oil decreases with the increase of the cesium picrate concentration Therefore the
efficiency of the extraction might be enhanced if the water is removed from the sample
Indeed water competes with cesium for space in the crown ether cavity in which they
are carried into the organic phase
More experiments need to be performed in supercritical CO2 to ascertain whether
cesium extraction is efficient enough to build a large scale plant to reprocess spent
nuclear fuel (SNF) or to be able to clean large contaminated areas For the SNF
retreatment a cesium extraction plant could be combined to a uranium extraction
plant using a PUREX (Plutonium Uranium Recovery by Extraction) like process in
supercritical CO2 Using the fact that CO2 is a tunable solvent such a plant could
also be used to extract and separate other radioactive elements reducing the risk
and the cost of having several extraction plants The next chapter will describe the
feasibility of supercritical CO2 processes for the extraction of uranium
Chapter 2
TriButyl PhosphatendashWaterndashNitricAcid Interaction
Introduction
This chapter is focused on the most important constituent of various nuclear waste
uranium This study complements and benefits from the previous chapter where the
supercritical fluid extraction (SFE) of cesium was investigated and the role of the
water in this extraction was detailed Nitric acid and TriButyl Phosphate (TBP)
complexes are used as oxidizing agent and ligand to extract uranium in supercritical
CO2 The antisolvent effect is observed when the TBPndashwater and the TBPndashnitric
acidndashwater adducts are dissolved in a solvent This effect was investigated in order
to have a better understanding of the mechanism of the extraction I conclude this
chapter by presenting a practical application TBPndashnitric acidndashwater adducts were
used for the supercritical fluid extraction of uranium from incineration ash of the
byproduct of the nuclear fuel production However before describing my research
work in more detail I will present a brief background on solvent extraction and
especially on the PUREX (Plutonium Recovery by Extraction) process on which the
supercritical extraction of uranium is based
Numerous physical and chemical processes have been envisaged to separate repro-
cess and recycle spent nuclear fuel and nuclear waste Some thought to use neutrons
absorption to transmute highly radioactive isotopes to stable or fast decaying ones
100
but this costly method has not been proven viable yet and has many drawbacks Oth-
ers thought of chemical processes to separate radioisotopes that can be reprocessed
and recycled The first chemical process used in a large scale plant (1945 Hanford
Washington State USA) was the bismuth phosphate process10 which is designed to
precipitate the plutonium with bismuth phosphate This process was abandoned
in the late forties for solvent extraction processes because it had too many steps
generated a large amount of waste and required a succession of dissolutions and pre-
cipitations that cannot be automated in a continuous way Solvent extraction has
the advantage of reprocessing both uranium and plutonium in a continuous way The
first large-scale plant that used solvent extraction was built by GE (General Electric
company) at Hanford in 1951 This plant used the Redox process which consists of
salting the aqueous solution containing the waste with aluminum nitrate and using
2-hexanone as an extractant for uranyl and plutonyl nitrate This plant was replaced
with a PUREX (Plutonium Recovery by Extraction) plant in 1956 after it was suc-
cessfully used by the DuPont company in Savannah River (South Carolina State
USA) plutonium production plant The Purex process uses nitric acid as a oxidizing
agent and TBP (TriButyl Phosphate) and kerosene as an extractant This process is
still the most commonly used nowadays and I will describe it in more details later
but first I will describe the properties of TBP
TBP is a molecule that has three butyl ether groups attached to the phosphorus
atom which is also double-bonded to a single oxygen atom Recent molecular dy-
namics studies shown that this single oxygen can be hydrogen bonded to water or
nitric acid6364 Indeed the oxygen of the P=O bond in TBP is very electronegative
making TBP a Lewis base that can be engaged in hydrogen bonding with water or
other lewis acids like nitric acid Figure 21 shows one possible configuration of hy-
drogen bonds between a TBP a nitric acid and a water molecule TBP is a colorless
liquid at room temperature (boiling point is 289 C at normal pressure65) it is almost
non-volatile and it is non-miscible with water (solubility in water at 25 C = 039
101
gmiddotLminus1) It does not react with nitric acid it is stable under high level of radiation
and it is miscible with common organic solvents such as kerosene dodecane alcohol
acetone chloroform and carbon dioxide26
Figure 21 One of the possible configurations of hydrogen bonds between a TBP anitric acid and a water molecule
Figure 22 (simplified from a schematic drawing in ldquoNuclear Chemical Engineer-
ingrdquo13) describes the principal steps for the Purex process First the matrix contain-
ing the uranium and the plutonium which can be spent nuclear fuel or other waste
needs to be prepared for the dissolution This preparation the so-called decladding
is used when the matrix is cladded which is common for spent nuclear fuel it consists
of opening the cladding with mechanical and chemical methods This preparation
will allow the dissolution of the matrix which is the second step The matrix is dis-
solved in hot nitric acid Nitric acid is used to oxidize the uranium to an oxidation
state VI Both of these steps produce radioactive gases and mostly NOx that can be
converted to nitric acid and recycled After the dissolution the remaining cladding
hulls are discarded and the acidity of the feed solution is adjusted to a desirable
value For the primary extraction a mixture of TBP (30 by volume) and kerosene
102
is added to the nitric acid solution and the uranium and the plutonium are separated
from the other water soluble contaminants After the primary decontamination the
plutonium is separated from the uranium by reducing the plutonium(IV) to pluto-
nium(III) which is not soluble in the organic phase Both uranium and plutonium
nitrates are thereafter purified separatly using a succession of solvent extractions
The aqueous solutions are finally evaporated and the uranium and the plutonium
nitrates are converted to their oxide form by calcination
The Purex process has numerous advantages the volume of waste is low compared
to preceding methods and the salting agent (HNO3) can be removed by evaporation
TBP is less volatile and flammable than hexanone and the cost of operation is low
Nevertheless the process needs kerosene or dodecane in large volume These solvents
are flammable toxic for the environment and cannot be easily recycled therefore the
use of carbon dioxide which can be released in the atmosphere after the extraction
will add a real plus to the process Furthermore the physical properties of super-
critical CO2 can enhance the extraction efficiency especially when the extractants
are deeply bonded to the matrix and when the Purex process is not efficient In this
chapter I will demonstrate the efficiency of uranium extraction for a pilot plant in
which the uranium is extracted from ash (incineration of byproduct of the manufac-
ture of UO2 pellets) using a TBP-nitric acid solution in supercritical CO2 but before
that I needed to present a study of the TBP-water-nitric acid complex in supercritical
CO2 and in solvents using FT-IR and NMR
Some compounds are more soluble in one solvent than in another therefore when
a change of solvent occurs to a chemical system the solute can precipitate out of the
system This phenomenon has been used for a long time for example to precipitate
the soap after the saponification process and it is called the salting-out effect The
changes in the solvent can be induced by the addition of a poor solvent for the solute
or by the addition of a salt very soluble in the solvent When this technique is used
in supercritical fluids it is called the antisolvent effect and it is induced by a change
103
of pressure or temperature and therefore a change in solubility of the fluid
When the TBP-water complex is diluted in a solvent like CO2 or CDCl3 some
water droplets appear immediately due to the anti-solvent effect Some nitric acid
droplets at different concentrations are also observed when the TBP-nitric acid com-
plex is used It is believed that these droplets improve the extraction of uranium with
CO2 over the traditional Purex process by improving the dissolution and oxidation
of uranium dioxide In this chapter this phenomenon is quantified by using FT-IR as
an analytical device in super- and sub-critical CO2 This study was then compared to
the one using proton NMR spectroscopy in organic solvents Last I demonstrate the
efficiency of uranium extraction for a pilot plant where the uranium is extracted from
the ash which is the product of the nuclear fuel fabrication waste using a TBP-nitric
acid solution in supercritical CO2
104
Figure 22 Principal steps of the Purex process
21 Interaction of Tributyl Phosphate with Water
Introduction
In this section an investigation of the interaction between TBP and water in different
solvents is presented The knowledge of this interaction is important as a first step to
have a better understanding of the interaction between TBP water and nitric acid in
the uranium extraction process For this process TBP-nitric acid-water complexes
are mixed with CO2 to oxidize uranium(IV) to its hexavalent state and to extract
it into the CO2 phase When one of these TBP complexes is mixed with a solvent
having a low dielectric constant some micro-droplets appear due to the antisolvent
effect The amount and acidity of these droplets are believed to play important role in
the extraction of uranium with supercritical CO2 This phenomenon is also observed
when a TBP-water complex is diluted in an organic solvent such as chloroform or
liquid and supercritical CO2 To study this effect the interaction of TBP and water
was studied in supercritical and liquid CO2 and in chloroform
211 Interaction of Tributyl Phosphate with Water in Super-critical CO2 Analyzed by Fourier Transform Infra-RedSpectroscopy
This first part of the section is devoted to describing the TBP-water interaction in
sub- and supercritical CO2 The FT-IR spectroscopy was used as an analytical tool
Experimental Work
The experiment setup including the protocol the cell the spectrometer and the FT-
IR settings are the same as described in chapter 111 on page 58 As mentioned
previously D2O was used instead of H2O because strong CO2 absorption peaks be-
tween 3500 and 3800 cmminus1 are overlapping the H2O signal
Tributyl Phosphate or TBP (ge 99 purity) and D2O (100 D 9996 pure)
were purchased from Aldrich Chemical Co and used without further purification
21 Interaction of Tributyl Phosphate with Water 106
CO2 (purity ge 9999) was obtained from Scott Speciality Gases Inc
A series of mixtures composed of a fixed D2O concentration (0054 molmiddotLminus1) and
variable TBP concentrations (from 004 to 016 molmiddotLminus1) were used to study the
nature of TBP-water hydrogen bonding in liquid and supercritical CO2 Each solution
was introduced in the cell with a syringe before the addition of CO2 The pressure
and temperature of CO2 were controlled in order to record the first spectrum at the
lower density The density was then increased by lowering the temperature (from 70
to 25 C) before increasing the pressure (from 200 to 40 MPa) In this manner a set
of spectra was recorded at different densities for each solution
Peak Assignments
The FT-IR spectra of free and bonded D2O at different TBP concentrations (0-016
molmiddotLminus1) and at one fixed D2O concentration (0054 molmiddotLminus1) in supercritical CO2
(40 C 20 MPa) is shown on Figure 23 The peak assignments for those spectra is
based on the one made for the crown ether-water interaction in CO2 detailed in my
published paper ldquoAn FT-IR study of crown ether-water complexation in supercritical
CO2rdquo which is reproduced here as appendix F
The spectrum of pure D2O (ie without any TBP) gives directly the position of
the free water peaks the O-D stretching asymmetric peak is at 2761 cmminus1 whereas
the symmetric one is at 2654 cmminus1 Those values are in agreement with the ones
found in the literature3555 When TBP was added to the system an additional peak
appeared between 2730 and 2732 cmminus1 This peak corresponds to the unbonded O-D
stretching vibration marked as (2) in Figure 24 Unlike the case in the crown-ether-
water spectrum we cannot observe any peak for the bonded O-D stretching vibration
marked as (1) on Figure 24 the TBP might have a different effect on this bond than
crown ether and its peak might have shifted and became superposed on a stronger
peak from which it could not be distinguished
At higher TBP concentration an additional peak appears at 2560 cmminus1 This
21 Interaction of Tributyl Phosphate with Water 107
000
001
002
003
004
005
006
2500 2550 2600 2650 2700 2750 2800
Abs
orba
nce
(au)
wavenumber (cm-1)
0 molL-1
004 molL-1
008 molL-1
016 molL-1
Figure 23 FT-IR spectra of free and bonded D2O at different TBP concentrations(0-016 molmiddotLminus1) and at one fixed D2O concentration (0054 molmiddotLminus1) in supercriticalCO2 (40 C 20 MPa)
Figure 24 Possible configurations of the hydrogen bond between a D2O and a TBPmolecule
21 Interaction of Tributyl Phosphate with Water 108
Figure 25 Possible configurations of the hydrogen bond between a D2O and twoTBP molecules
peak is at the same wavenumber as the double hydrogen bond in the crown ether-
water study I therefore believe that it is due to the formation of a complex between
2 TBP molecules and one water molecule as represented in Figure 25
Theoretical Calculations
The equilibrium between water and TBP can be described as the equilibrium between
water and crown ether detailed in the paper ldquoAn FT-IR study of crown ether-water
complexation in supercritical CO2rdquo reproduced as appendix F page 183 At low TBP
concentration where there is no significant amount of a 21 complex between TBP
and water the equilibrium is
TBP + D2O TBPmiddotD2O (21)
From this equilibrium the equilibrium constant K can be defined from
K =[TBPmiddotD2O]
[D2O][TBP]middot (22)
The molar fraction of the TBP complexed to water k is defined as
21 Interaction of Tributyl Phosphate with Water 109
k =[TBPmiddotD2O]
[TBPmiddotD2O] + [TBP]middot (23)
The molar enthalpy of the hydrogen bond (∆H) can be determined from the
measurements of the equilibrium constant at different temperatures and at constant
pressure via the well-known thermodynamic relations
(part∆G
partT
)P
= minus∆S =∆Gminus∆H
T (24)
∆G0 = minusRT ln K (25)
and (part ln K
part(1T )
)P
= minus∆H
Rmiddot (26)
T is the absolute temperature in K ∆S is the entropy in Jmiddotmolminus1middotKminus1 ∆G is the
Gibbs free energy in Jmiddotmolminus1 and R is the molar gas constant in JmiddotKminus1middotmolminus1
Equilibrium Parameters
The results of this study are summarized in Table 21 These results show that
the changes in the values of the equilibrium constant K the molar fraction of water
bonded to the TBP (k) and the amount of free water are small when the temperature
and pressure of the CO2 change Nevertheless the changes are sufficient to observe
trends as the different graphs show
In Figure 26 the density effect on the equilibrium constant K at constant tem-
perature and at constant pressure is shown When the pressure increases from 20 to
40 MPa K decreases from 12 to 10 Lmiddotmolminus1 On the other hand when the tempera-
ture decreases from 70 to 31 C K increases from 9 to 14 Lmiddotmolminus1 and drops to 12
at 25 C This unexpected change is certainly due to the change of phase Indeed
CO2 is no more supercritical at 25 C but it is liquid
In the same way the dependence of the molar fraction of TBP bonded to water
k on the density is shown on Figure 27 It is evident that k increases with density at
21 Interaction of Tributyl Phosphate with Water 110
Table 21 Equilibrium parameters for water-TBP interaction in supercritical CO2
Pressure temp density K [D2O]free kMPa C gmiddotLminus1 Lmiddotmolminus1 molmiddotLminus1
200 70 659 9 0025 18200 60 724 10 0024 19200 50 784 12 0022 20200 40 840 12 0021 21200 35 866 13 0021 21200 31 886 14 0020 21200 25 913 12 0021 21350 40 935 10 0024 19400 40 956 10 0024 19400 25 1004 12 0022 20
Typical statistical errors Pressure plusmn 01 MPa Temperature plusmn 1 C Kplusmn 5[D2O]freeplusmn 5 and kplusmn 2
80
90
100
110
120
130
140
060 065 070 075 080 085 090 095 100
K (
Lm
ol-1
)
Density of CO2 (gcm-3)
Figure 26 Density effect on the equilibrium constant K at constant temperature (N40 C) and at constant pressure (H 20 MPa)
21 Interaction of Tributyl Phosphate with Water 111
constant pressure (20 MPa) from 18 to 21 and decreases with density at constant
temperature (40 C) from 21 to 19
180
185
190
195
200
205
210
215
220
060 065 070 075 080 085 090 095 100
k (
)
Density of CO2 (gcm-3)
Figure 27 Molar fraction of TBP bonded to water k versus density at constanttemperature (N 40 C) and at constant pressure (H 20 MPa)
Figure 28 shows the increase of the free D2O concentration from 20 to 25 mmolmiddotLminus1
when the temperature increases from 31 to 70 C In the same way the free D2O con-
centration dependence on the density is shown on Figure 29 the concentration [D2O]
increases from 21 to 24 mmolmiddotLminus1 when the density increases at constant tempera-
ture and decreases from 25 to 20 mmolmiddotLminus1 when the density increases at constant
pressure
From this set of data the molar enthalpy of the hydrogen bond between TBP
and water can be determined using equation (26) and the linear regression of the
plot of ln K versus the inverse of the temperature in Kelvin (Figure 210) The
slope is 111 times 103 K and ∆H is equal to -92 plusmn 06 kJmiddotmolminus1 at 20 MPa with R =
83144 JmiddotKminus1middotmolminus1 This result implies that the process is exothermic as expected
for hydrogen binding Furthermore since the species are more entropically ordered
21 Interaction of Tributyl Phosphate with Water 112
0000
0005
0010
0015
0020
0025
0030
0 10 20 30 40 50 60 70 80
[D2O
] (m
mol
L)
Temperature (eth C)
Figure 28 Concentration of free D2O versus temperature at 20 MPa
0010
0012
0014
0016
0018
0020
0022
0024
0026
0028
0030
060 065 070 075 080 085 090 095 100
[D2O
] free
(m
olL
-1)
Density of CO2 (gcm-3)
Figure 29 Free D2O concentration versus density for at constant temperature (N40 C) and at constant pressure (H 20 MPa)
21 Interaction of Tributyl Phosphate with Water 113
it explains the decrease of the K values wi7th the increase of temperature In other
respects it is important to remember that for this calculation I needed to assume that
∆H is independent of density This result is in accordance with the enthalpies values
for hydrogen bonding in supercritical fluids that are found in the literature353857
20
21
22
23
24
25
26
27
28
28 29 30 31 32 33 34
ln K
1000T
Figure 210 Dependence of ln K on 1000T (T in K) at 20 MPa
Figure 211 shows the dependence of [D2O] on the equilibrium constant K The
amount of free water in CO2 decreases when K increases The dependence appears
to be linear only because the range of the water concentration data is too narrow to
see the curvature as predicted by equation (22)
The Antisolvent Effect
TBP and water make a one-to-one complex when mixed together with the molar
fraction of water bonded to the TBP almost at 100 it was determined by NMR to
be equal to 97 plusmn 2 When this 11 complex is mixed with an organic solvent (like
dodecane chloroform kerozene CO2 etc) some micro-droplets of water precipitate
out of the organic phase because of the antisolvent effect When the micro-droplets
21 Interaction of Tributyl Phosphate with Water 114
0020
0021
0022
0023
0024
0025
0026
80 90 100 110 120 130 140
[D2O
] free
(m
olL
-1)
K (Lmol-1)
Figure 211 Dependence of the free water concentration [D2O] on the equilibriumconstant K
are formed a clouding of the solution is observed Subsequently the droplets grow
in size and agglomerate on the wall of the container The volume of these droplets
can be quantified knowing the molar fraction of TBP bonded to the water and the
solubility of water in the solvent In the preceding experiments the molar fraction
of water bonded to the TBP dropped from nearly 100 to approximatly 20 Some
of the resulting unbonded water will dissolve in the organic solvent This amount of
free water is equal to the solubility limit of water in the solvent The remaining water
will precipitate out of the organic phase In this scenario there is a reservoir of water
unlike in the preceding experiments where the amount of water was fixed at a value
below the solubility limit of water in the supercritical fluid Therefore the values of
the free water found before are not equal to the solubility limit of the water in the
fluid and these values were only used to determined the equilibrium parameters that
are the same in both cases
The solubility of water in CO2 for different temperatures and pressures is reported
21 Interaction of Tributyl Phosphate with Water 115
in table 22 Some values were found in the literature67 whereas others were extrap-
olated from the values in the literature according to the linear regression shown in
Figure 212 The amount of water droplets was determined using the following set of
equations The water and TBP material balance in number of moles is
nD2Otot = nD2Oorg + nD2Oaq + nTBP middotD2Oorg (27)
nTBPtot = nTBPorg + nTBPaq + nTBP middotD2Oorg (28)
(29)
The suffixes ldquototrdquo ldquoorgrdquo and ldquoaqrdquo refer to the total the organic and the aqueous
phase respectively The solubility of TBP in water is very low therefore nTBPaq is
equal to zero and equation (23) can be written as
nTBP middotD2Oorg = k middot nTBPtot (210)
Knowing the solubility of water in the organic phase ([D2O]) the value of nD2Oorg is
found and the volume of the water droplets can finally be found from the number of
mole of water in the aqueous phase which is given by
nD2Oaq = nD2Otot minus nD2Oorg minus k middot nTBPtot middot (211)
Table 22 shows for different pressure and temperatures the solubility of water the
molar fraction of water bonded to TBP k and the amount of micro-droplets formed
when 05 mL of the water saturated TBP is mixed with CO2 in a 10 mL cell For
the two pressure values used (20 and 40 MPa) the amount of droplets was found to
increase when the density increases This is shown in Figure 213 for the pressure
of 20 MPa On the other hand at constant temperature the amount of droplets
decreases when the density increases
Conclusion
I successfully used the FT-IR technique to determine the equilibrium constant and the
molar fraction of water complexed to TBP in CO2 as function of temperature and the
21 Interaction of Tributyl Phosphate with Water 116
Table 22 Antisolvent effect for a water saturated TBP mixed with CO2 at differentdensities
Pressure temp densitya [D2O]maxfree k water dropletsd
MPa C molLminus1 molmiddotLminus1 microL
200 70 16444 0152c 18 -1e
200 60 16444 0136c 19 2200 50 17821 0121b 20 4200 40 19082 0102c 21 7200 35 19671 0094c 21 9200 31 20123 0085b 21 10200 25 20773 0078b 21 11400 40 21724 0136c 19 1400 25 22818 0092b 20 10
a values from NIST Chemistry WebBook56
b values from R Wiebe6
c values extrapolate from R Wiebe6 cf Figure 212d 05 mL of water saturated TBP mixed with CO2 in a 10 mL celle no water droplet formed
000
005
010
015
020
025
030
0 20 40 60 80 100
[H2O
] max
(m
olL
-1)
Temperature (oC)
Figure 212 linear regression of the molar solubility of water67 in CO2 versus thetemperature at constant pressure (20 (N) and 40 (H) MPa)
21 Interaction of Tributyl Phosphate with Water 117
-2
0
2
4
6
8
10
12
14
20 30 40 50 60 70
Wat
er d
ropl
ets
(microL)
Temperature (oC)
Figure 213 Volume of water droplets when 500microL of water saturated TBP is mixedwith CO2 in a 10 mL cell versus the temperature at constant pressure (20 MPa)
pressure of the supercritical fluid I also found the value of the molar enthalpy for the
hydrogen bond between TBP and water (∆H = -92 kJmiddotmolminus1) Most importantly
the FT-IR technique can be used to predict the amount of water droplets produced
by the antisolvent effect when the TBP-water complex is mixed with CO2 This
technique should be used to determine the amount of nitric acid droplets when the
TBP-water-nitric acid complex is added to a solvent Unfortunately nitric acid is
very corrosive and I could not achieve this with the equipment available In order
to overcome this problem the interactions between water TBP and nitric acid are
studied in chloroform using the NMR spectroscopy This study will be presented later
in section 22
21 Interaction of Tributyl Phosphate with Water 118
212 Interaction of Tributyl Phosphate with Water in Sol-vent Analyzed by Nuclear Magnetic Resonance Spec-troscopy
In this section the TBP-water interaction is detailed using the Nuclear Magnetic
Resonance spectroscopy (NMR) in a conventional solvent like chloroform The results
obtained are compared to the one of the previous section where the same interaction
was studied in CO2 using the Fourier Transform Infra-Red spectroscopy (FT-IR)
Experimental Work
TBP (98 purity) was purchased from Avocado Research Chemicals Ltd (ordered
through Alpha Aesar Co) and used with no further purification Chloroform was used
in the deuterated form (999 atom D) and was purchased from Aldrich Chemical
Company
The TBPmiddotH2O adduct was prepared by mixing TBP with water in a glass tube
with a stopper The mixture of TBP and water was manually shaken vigorously for
4 minutes followed by centrifuging for an hour When the remaining organic phase
is mixed with a solvent like CDCl3 some water droplets appear In order to quantify
this phenomenon a study of the interaction between TBP and water in CDCl3 was
carried out using different dilutions of TBP in CDCl3 These solutions were mixed
with an equal volume of water shaken for 3 hours and centrifuged for another hour
The remaining organic phase was taken for analysis Longer mixing and centrifuging
times were tried without any significant changes in the data
Proton NMR (PNMR) measurements were carried out using a 300 and a 500
MHz Bruker spectrometer The pulse interval was set to 5 sec (acquisition time 3 sec
relaxation delay 2 sec) and 32 scans were taken Chemical shifts were calibrated by
using an insert filled with benzene-d6 (purchased from Aldrich Chemical Company)
as an external standard Benzene-d6 chemical shift was settled to 715 ppm A typical
PNMR spectrum of TBPmiddotH2O dissolved in CDCl3 can be seen in Figures 214 The
21 Interaction of Tributyl Phosphate with Water 119
Figure 214 300MHz 1H-NMR spectra of TBPmiddotH2O in CDCl3
21 Interaction of Tributyl Phosphate with Water 120
total water concentration in the organic phase [H2O]0org can be determined directly
from the integrated intensity of the water peak observed in these spectra These
intensities are calibrated on the TBP and CHCl3 peaks for which the concentrations
are known The nonlinear regression and curve fitting analysis were performed using
the NRLEG ( Phillip H Sherrod) program
Theoretical Calculations
Chemical Shifts It is well known that the observed chemical shift δH2O of a fast
exchange between various sites forming n different species is given by
δH2O =nsum
i=1
δiχi (212)
where δi is the chemical shift of the specie i and χi is its molecular fraction
TBPWater Interaction in an Organic Phase A binary system composed of
a ligand (TBP) and water forming an one-to-one hydrate in the organic phase can be
modeled by the following chemical equations
H2Oaq H2Oorg (213)
TBPorg TBPaq (214)
H2Oorg + TBPorg TBPmiddotH2Oorg (215)
where the subscript ldquoorgrdquo defines the organic phase that contains water TBP and
CDCl3 and the subscript ldquoaqrdquo defines the aqueous phase The partition coefficient
for TBP can be determined from equation (214) by the following relation
D1 =[TBP]aq[TBP]org
(216)
The solubility of TBP in water is very low (15 times 10minus3 molmiddotLminus1) compared to the
solubility in CDCl3 (024 molmiddotLminus1) For this reason the D1 value was considered as
21 Interaction of Tributyl Phosphate with Water 121
nil in all our experiments The equilibrium constant K is defined by
K =[TBPmiddotH2O]org
[TBP]org[H2O]org(217)
In addition k the molar fraction of ligand molecules complexed to water is written
as
k =[TBPmiddotH2O]org
[TBP]org + [TBPmiddotH2O]org=
K[H2O]org1 + K[H2O]org
(218)
There are two ways to determine the initial ligand concentration [TBP]0ini First the
total amount introduced during the sample preparation can be calculated and second
by material balance at equilibrium
[TBP]0ini = [TBP]org + [TBPmiddotH2O]org + [TBP]aq (219)
The term [TBP]aq is negligible considering that the TPB solubility in water is very
low Therefore
[TBP]0org = [TBP]org + [TBPmiddotH2O]orgmiddot (220)
The water concentration in the organic phase [H2O]0org can also be defined by material
balance at equilibrium
[H2O]0org = [H2O]org + [TBPmiddotH2O]org (221)
Combining the material balance relations (219) and (220) with equation (217) the
linear relation
[H2O]0org = k [TBP]0org + [H2O]org (222)
can be derived According to equation (222) it is easy to determine the free water
concentration [H2O]org and the k value by a plot of [H2O]0org versus [TBP]0org From
these data and equation (218) the equilibrium constant K is obtained
Results and Discussion
Peak Assignment Different concentrations of TBP (up to 18 molmiddotLminus1) in CDCl3
were mixed in equal volume with H2O and analyzed by NMR A typical proton
21 Interaction of Tributyl Phosphate with Water 122
Table 23 intensities and coupling constants of the TBP multiplets
multiplet δ (ppm) Intensities Coupling constants
quartet 397 11 29 30 11 671 671 671quintet 156 13 38 60 43 12 672 732 733 671sextet 131 13 54 100 96 52 12 731 732 794 732 733triplet 083 12 20 12 732 733
NMR spectrum taken at 300 MHz of TBPmiddotH2O dissolved in CDCl3 can be seen in
Figure 214 The CHCl3 peak is a singlet that was calibrated at 724 ppm The water
droplets should appear at 47 ppm because it corresponds to the chemical shift of
water in water Unfortunately the peak is not visible on this spectrum The total
water in oil peak varies from 152 to 310 ppm depending on H2O concentration in
the organic phase in Figure 214 it is at 216 ppm Finally the TBP peaks are at
084 132 160 and 393 ppm An enlargement of these TBP peaks taken from a
500MHz spectrum is shown in Figure 215 and the intensities and coupling of each
multiplet is shown in Table 23 The three butyl ether groups are equivalent in the
TBP molecule For this reason and to simplify the peak assignment I will describe
only the branches numbered in Figure 216
The triplet at 08 ppm has an intensity environ 50 larger than the other peaks
which indicates that it is associated with the hydrogens of the methyl group (carbon
4 in Figure 216) The quartet at 40 ppm is at higher ppm certainly because it
is partially deshielded by the oxygen However there is no hydrogen coupled to
three other hydrogens in the TBP molecule and for this reason no quartet should
appear However the phosphorus (31P) has the same spin quantum number than the
hydrogens (12) and a heteronuclear coupling is possible between the proton and the
phosphorus This quartet corresponds therefore to the hydrogens of the carbon 1 in
Figure 216 Finally there is a quintet and a sextet at 16 and 13 ppm) The protons
associated with the the quintet can ldquoseerdquo four hydrogens whereas the ones associated
21 Interaction of Tributyl Phosphate with Water 123
05
10
15
20
25
30
35
40
ppm
Figure 215 Enlargement of a 500MHz 1H-NMR spectra of TBPmiddotHNO3middotH2O inCDCl3
21 Interaction of Tributyl Phosphate with Water 124
Figure 216 Possible configuration for the TBP hydrate
with the sextet can ldquoseerdquo 5 protons Consequently the protons of the quintet belong
to the carbon 2 and the ones of the sextet belong to the carbon 3 in Figure 216
Water Chemical Shift The water in the system studied is in fast exchange be-
tween its free state and the state where it is bonded to TBP Because a NMR spectrum
needs several seconds to be recorded the spectrum shows the average value of the
two states instead of each of them separately Therefore the H20 and the TBPmiddotH2O
peaks are combined in one peak and its chemical shift δH2O follows the equation
δH2O = δ0χH2O + δ1χTBP middotH2O (223)
which is derived from equation (212) where δH2O is the observed chemical shift for
water and δ0 and δ1 are the water chemical shift in 100 CDCl3 and 100 TBP
respectively The molar fractions χH2O and χTBP middotH2O are defined as follows
21 Interaction of Tributyl Phosphate with Water 125
00
05
10
15
20
25
30
35
00 02 04 06 08 10
δ H2O
(pp
m)
χi (i=H2O or TBPH2O)
f(χH2O)f(χTBPH2O)
Figure 217 Chemical shift observed of water in CDCl3 and in TBP versus themolecular fractions of free water (H) and of bonded water (N) The dashed linescorresponds to their linear regression fits
χH2O =[H2O]org
[H2O]0org(224)
and
χTBP middotH2O =[H2O]0org minus [H2O]org
[H2O]0org(225)
In Figure 217 the plot of the observed water chemical shift δH2O versus the molar
fraction of free water χH2O is shown for different water and TBP concentrations in
CDCl3 This plot shows that δH2O increases linearly when the molar fraction of free
water rises The linear regression on this plot allows the determination of δ0 = 151 plusmn
004 ppm which corresponds to where the fitted line intersects with the ordinate In
the same figure the plot of δH2O versus the molar fraction of bonded water χTBP middotH2O
is shown for the same set of data Similarly the fitted line intersects with the ordinate
at 351 plusmn 004 ppm which corresponds to the value of δ1
In Figure 218 the observed chemical shift δH2O is plotted versus the total water
21 Interaction of Tributyl Phosphate with Water 126
00
05
10
15
20
25
30
35
000 005 010 015 020 025 030 035 040
δ H2O
(pp
m)
[H20]0org (molL)
Figure 218 Chemical shift observed (black points) and calculated (thin line) of waterin CDCl3 and in TBP versus total water concentration in the organic phase
concentration in the organic phase [H2O]0org The shift δH2O increases rapidly until
the total water concentration in the organic reaches 013 molmiddotLminus1 At higher water
concentration the increase slows down and plateaus to an asymptotic value below 36
ppm The dependency of δH2O on [H2O]0org can be obtained using equations (223)
(224) and (221) which are combined to give the following
δH2O =δ0[H2O] + δ1([H2O]0org minus [H2O]org)
[H2O]0org (226)
where δ0 and δ1 are the constants previously determined and [H2O]org = 007 plusmn 002
molmiddotLminus1as demonstrated in the paragraph describing the chemical equilibrium later
in this section (page 128) The plot of the calculated values of δH2O versus [H2O]0org
as given by equation (226) is shown in Figure 218
Chloroform Chemical Shift There is some weak hydrogen bonds between TBP
and CDCl3 and for the same reasons as the ones explained previously the chemical
shift between pure chloroform and chloroform mixed with TBP varies slightly de-
21 Interaction of Tributyl Phosphate with Water 127
70
72
74
76
78
80
00 05 10 15 20
δ CH
Cl 3 (
ppm
)
[TBP] (molL-1)
Figure 219 Chemical shift observed of CHCl3 in TBP and in CDCl3 versus the TBPconcentration in the organic phase
pending on the TBP concentration66 The dependency of the chloroform chemical
shift δCHCl3 on the TBP concentration was studied using the same set of spectra as
previously A plot of these results is represented in Figure 219 The chemical shift
is shown to increase slowly when the TBP concentration in CDCl3 increases
From this same set of results the chemical shift of pure chloroform δ2 and the
one of chloroform dissolved in TBP with 11 ratio δ3 can be found using the relation
δCHCl3 = δ2χCHCl3 + δ3χCHCl3middotTBP (227)
which is derived from equation (212) The δ2 value was calculated at 727 plusmn 003
ppm as expected because it corresponds to the chemical shift of CHCl3 in CHCl3
On the other hand δ3 is equal to 920 plusmn 003 ppm This is an obvious but important
result Indeed one can set the CHCl3 chemical shift at its right value depending on
TBP concentrations in CDCl3 and use it as a chemical shift reference without having
to use any additives like TetraMethylSilane (TMS)
21 Interaction of Tributyl Phosphate with Water 128
000
005
010
015
020
025
030
035
040
00 02 04 06 08 10 12 14 16 18
[H2O
]0 org
(mol
L)
[TBP]0org (molL)
Figure 220 Total water ([H2O]0org) versus total TBP ([TBP]0org) in the organic phase
Chemical Equilibrium The plot of total water concentration [H2O]0org versus
the total TBP concentration [TBP]0org is represented in Figure 220 The total water
concentration is shown to increase as the total TBP concentration increases This was
expected because TBP forms a strong hydrogen bond with water therefore increasing
the total water solubility in the organic phase when the TBP concentration increases
The free water concentration in CDCl3 [H2O]org can be determined using equation
(222) According to this equation the linear regression of the plot of [H2O]org versus
the total TBP concentration intersects with the ordinate at the value of the free
water concentration [H2O]org = 007 plusmn 002 molmiddotLminus1 This result is consistent with
the value of the solubility of water in CHCl3 found in the previous study of the crown
ether-water interaction in CDCl3 detailed in section 121 page 75 and section 133
page 94
The molar fraction of TBP complexed to water in CDCl3 k can also be obtained
from equation (222) It corresponds to the slope of the linear regression of [H2O]0org
21 Interaction of Tributyl Phosphate with Water 129
versus the total TBP concentration (Figure 220) In this study k was found equal
to 015 plusmn 001 The remaining water which amounts to 85 of the total is released
in the form of fine droplets when the water-saturated TBP solution is dissolved in
CDCl3 The amount of micro-droplets of water formed because of the antisolvent
effect can be calculated from the value of k knowing that the water solubility in
pure CDCl3 [H2O]org is 007 plusmn 002 molmiddotLminus1 For this calculation equations (27)
to (211) described in section 211 on page 115 are needed If 05mL of the water
saturated TBP is mixed with chloroform in a 10 mL volumetric viol the volume of
micro-droplets will be 14 plusmn 1 microL
Last the equilibrium constant (K) can be deduced from the value of k by using
equation (218) Its value is K = 27 plusmn 02 Lmiddotmolminus1
Conclusion
This section describes the analysis of the water-TBP equilibrium in supercritical
CO2 using the FT-IR spectroscopy This equilibrium was also analyzed in chloroform
using the NMR spectroscopy The two analytical methods complement each other to
give a complete picture of the equilibrium Significant results include obtaining the
molar fraction of water bonded to TBP k and the equilibrium constants in the oil
phase In CDCl3 k was found equal to 015 plusmn 001 which is lower than the lowest
value obtained in supercritical CO2 (ie 018 plusmn 001 at 70 C and 20 MPa) This
result shows that there is more water bonded to TBP in the supercritical fluid at the
conditions of my experiments In pure CDCl3 the amount of free water [H2O]org
is 007 plusmn 002 molmiddotLminus1and the standardized amount of micro-droplets was found
equal to 14 plusmn 1 microL The amount of micro-droplets formed is at least 3 microL lower in
CO2 considering the experimental conditions used
NMR also gave information on the chemical shift of water and chloroform in the
TBP-water-CDCl3 system They can both be determined theoretically knowing the
TBP concentration
21 Interaction of Tributyl Phosphate with Water 130
The analysis of the experiments discussed in this section is not complete with-
out consideration of adding nitric acid which is essential to the supercritical fluid
extraction of uranium This part will be presented in the next section
22 Interactions with Nitric Acid Analyzed by Nu-
clear Magnetic Resonance
Introduction
The study of TBPmiddot(HNO3)xmiddot(H2O)y adducts comprise an essential step to the under-
standing of the supercritical fluid extraction of uranium Therefore I will describe
first in this section various TBP-water-nitric acid adducts using the Nuclear Magnetic
Resonance (NMR) as a spectroscopic tool
An interesting observation was made when these adducts are mixed with an or-
ganic solvent some micro-droplets of nitric acid immediately appear in the oil due to
the so-called antisolvent effect Throughout this work I came to believe that the acid-
ity and quantity of these micro-droplets enhance the extraction of uranium To have a
better understanding of the formation of these micro-droplets I will describe later in
this section the interactions between TBPmiddot(HNO3)xmiddot(H2O)y adducts and chloroform
Chloroform was selected as a solvent because of its physical properties which are
comparable to supercritical CO2 and because of its non-interference with the NMR
data collection
221 Experimental Work
The experimental work for this section is similar to the one in the study of the TBP-
water interaction by NMR section 212 page 118
TBP (98 purity) was purchased from Avocado Research Chemicals Ltd (ordered
through Alpha Aesar Co) and used with no further purification and chloroform
was used in the deuterated form (999 atom D) and was purchased from Aldrich
Chemical Company Nitric acid (694 (ww) ) was obtained from Fisher Chemical
(New Jersey) and was diluted to 155 molmiddotLminus1 with deionized water
The TBPmiddot(HNO3)xmiddot(H2O)y complexes were prepared by mixing TBP with a 155
molmiddotLminus1 solution of nitric acid in a glass tube with a stopper Different volume ratio
of nitric acid and TBP (from 110 to 61 nitric acid to TBP volume ratio) were
22 Interactions with Nitric Acid Analyzed by NMR 132
prepared Thereafter the mixture was manually shaken vigorously for 4 minutes
followed by centrifuging for an hour The organic phase was then extracted with a
pipette and analyzed When the remaining organic phase is mixed with a solvent like
CDCl3 some water droplets appear In order to quantify this phenomenon a study
of the interaction between TBP and water in CDCl3 was carried out using different
dilutions of TBP in CDCl3 These solutions were mixed with an equal volume of
nitric acid (155 molmiddotLminus1) shaken for 3 hours and centrifuged for another hour The
remaining organic phase was taken for analysis Longer mixing and centrifuging times
were tried out with no significant change in the data
4
5
6
7
8
9
10
0 2 4 6 8 10 12 14 16 18
δ HN
O3 (
ppm
)
[HNO3]ini (molL)
Figure 221 Chemical shift of nitric acid observed from the droplets (H) and fromnitric acid solutions in water (N) and calculated (dashed line) using equation (229)versus total nitric acid concentration
The concentration of H2O in the organic phase was measured by Karl-Fischer
titration (Aquacounter AQ-7 Hiranuma Japan) The concentration of HNO3 in the
organic phase was measured with an automatic titrator (COM-450 Hiranum Japan)
with 01 molmiddotLminus1 NaOH solution after adding large excess amount of deionized water
The concentration of HNO3 in the water droplets was determined by comparison of the
22 Interactions with Nitric Acid Analyzed by NMR 133
chemical shift of different concentrations of nitric acid in water as shown on Figure
(221) and confirmed by titration methods Proton NMR (PNMR) measurements
were carried out using a 500 MHz Bruker DX500 spectrometer The pulse interval
was set to 5 sec (acquisition time 3 sec relaxation delay 2 sec) and 32 scans were taken
Chemical shifts were calibrated by using an insert filled with benzene-d6 (purchased
from Aldrich Chemical Company) as an external standard Benzene-d6 chemical
shift was settled to 715 ppm A typical PNMR spectrum of TBPmiddot(HNO3)xmiddot(H2O)y
dissolved in CDCl3 can be seen in Figures 222 In this spectrum the four groups of
peaks between 1 and 5 ppm belong to the butyl ether groups of the TBP molecule
as describe in detail in section 212 page 121 The peak at 1180 ppm belong to the
nitric acid and the water These two compounds are bonded in different ways to the
TBP and because of the fast equilibrium in between them only one peak shows as
an average of all
00 20 40 60 80 100 120
ppm
Figure 222 A typical proton NMR spectrum of TBPmiddot(HNO3)xmiddot(H2O)y with abenzene-d6 insert The sample was prepared by mixing 10 mL of 155M HNO3 with40 mL of 98 TBP
Finally the nonlinear regression and curve fitting analysis were performed using
22 Interactions with Nitric Acid Analyzed by NMR 134
the NRLEG ( ccopy Phillip H Sherrod) program
222 Results and Discussion
In this part I will describe first the trivial relationship between the chemical shift
of nitric acid in water and its concentration This result allow the determination of
the acid concentration in the micro-droplets formed when TBP complexes are mixed
with a solvent Second I will describe the TBPmiddot(HNO3)xmiddot(H2O)y complex without
solvent In these adducts the values of x and y represent the number of nitric acid and
water molecules per TBP molecule respectively Last I will describe the interaction
between TBP water and nitric acid in chloroform
Chemical Shift of HNO3 in Water
Before studying a more complex system equation (212) on page 120 was used to
determine the chemical shift of the HNO3H2O peak in water depending on nitric
acid concentration For this system
δobs = δ4χHNO3 + δ5χH2O (228)
where δ4 is the chemical shift for pure H3O+ ion and δ5 is the chemical shift for pure
water The water concentration in water was taken at 556 molmiddotLminus1 Equation (228)
can also be written as
δobs = δ4χHNO3 + δ5(1minus χHNO3) = (δ4 minus δ5)χHNO3 + δ5 (229)
where
χHNO3 =[H3O
+]
[H3O+] + 556
middot (230)
According to equation (229) the plot of the linear relationship between δobs and
the nitric acid molecular fraction gives directly the values of δ5 = 476 plusmn 003 ppm
and δ4 = 246 plusmn 02 ppm Figure 221 shows the plot of the chemical shift of nitric
acid in water and the calculated fit using equation (229) versus the total nitric acid
concentration Combining equations (229) and (230) with the calculated values of
22 Interactions with Nitric Acid Analyzed by NMR 135
δ4 and δ5 the acid concentration can be expressed in terms of the observed chemical
shift δobs using the following equation
[H3O+] = 556times 476minus δobs
δobs minus 246middot (231)
This equation can be used to calculate concentration of the acid droplets resulting of
the antisolvent effect with the simple knowledge of their chemical shift
TBPmiddot((HNO3)xmiddot((H2O)y System without Solvent
The values of x and y in the TBPmiddot(HNO3)xmiddot(H2O)y adduct represent the number of
nitric acid and water molecules per TBP molecule respectively The value of x is
calculated by dividing the concentration of nitric acid in the organic phase by the
concentration of TBP In the same way the value of y is calculated by dividing the
water concentration by the TBP concentration
Different concentrations of HNO3 or water in TBP influence the dissolution of
uranium oxides29 For this reason it is important to determine the exact composition
of the TBP complex Figure 223 shows the combined chemical shift of H2O and HNO3
versus the number of molecules of nitric acid per molecule of TBP x The chemical
shift increases rapidly from 89 to 126 ppm when the nitric acid to water mole ratio
increases When this ratio reaches unity the chemical shift reaches its maximum and
starts to decrease slowly to 120 ppm which corresponds to a ratio of 24 molecules
of nitric acid for each molecule of water
Table 24 summarizes the different experiments performed and gives the corre-
sponding values of the nitric acid and water ratio in TBP These values were obtained
using NMR spectra in both organic and aqueous phases in addition to titration meth-
ods
The number of molecules of HNO3 per molecule of TBP x versus the initial
volume ratio of HNO3 (at 155 molL in water) to TBP is shown in Figure 224 When
the initial volume ratio is under unity the value of x increases rapidly as the volume
ratio increases The curve is shown to level at a maximum of 24 corresponding to
22 Interactions with Nitric Acid Analyzed by NMR 136
7
8
9
10
11
12
13
14
15
00 05 10 15 20 25
δ HN
O3
and
H2O
(pp
m)
x = [HNO3]org [TBP]org
Figure 223 Chemical shift observed of nitric acid and water in TBP versus the moleratio of nitric acid on TBP in the organic phase
a concentration of 62 molmiddotLminus1in nitric acid This concentration correspond to the
maximum solubility of HNO3 in TBP These results indicate that TBP as a Lewis
base can carry acids in an organic phase This property can be used to perform
chemical reactions with acids in sub- or supercritical CO2 because acids are generally
not very soluble in CO2
From the same set of data the partition coefficient of HNO3 between the aque-
ous phase and the TBP phase (DHNO3) can be found by plotting [HNO3]aq versus
[HNO3]org according to the following equation
DHNO3 =[HNO3]aq[HNO3]org
middot (232)
The linear regression analysis performed on the data of the nitric acid concentrations
in the aqueous and in the organic phase gives DHNO3 = 24plusmn 08 This result implies
that there is nearly 24 times more nitric acid in the aqueous phase than in the organic
phase when the equilibrium is achieved for an initial concentration of 155 molmiddotLminus1 in
nitric acid
22 Interactions with Nitric Acid Analyzed by NMR 137
Table 24 Composition of TBPmiddot(HNO3)xmiddot(H2O)y complexes
Vol Vol x = y = Molecular ratio forHNO3 TBP [HNO3][TBP]org [H2O][TBP]org TBPHNO3H2O
0 5 0 106 1 0 1105 5 042 083 1 04 081 10 042 074 1 04 071 6 071 073 1 07 071 5 081 042 1 08 041 45 088 046 1 09 051 4 097 041 1 10 041 3 113 036 1 11 041 2 138 040 1 14 041 1 180 044 1 18 042 1 213 054 1 21 053 1 229 048 1 23 056 1 237 053 1 24 07
Initial volume (mL) used for complex preparation with TBP at 98 and HNO3 at155 molmiddotLminus1
Figure 225 shows the mole ratio of HNO3H2O xy in the TBP phase at equi-
librium versus the initial volume ratio of HNO3 to TBP First the xy ratio increases
rapidly when the amount of nitric acid in the organic phase increases then it flattens
out under 5 In the condition of my experiment the mole ratio of nitric acid to water
can not exceed 5 in the TBP phase This maximum ratio is reached rapidly when the
volume ratio of HNO3TBP exceeds unity
When the TBPmiddot(HNO3)xmiddot(H2O)y complex is diluted in an organic solvent the
excess water and nitric acid precipitate out of the organic phase as micro-droplets
due to the antisolvent effect The acidity of these micro-droplets is important because
it is related to the efficiency of extraction of uranium as an example I will therefore
describe next the properties of the TBP complex when it is mixed with chloroform
22 Interactions with Nitric Acid Analyzed by NMR 138
0
05
1
15
2
25
0 1 2 3 4 5 6 7
x =
[HN
O3]
org
[TB
P] o
rg
initial volume ratio of HNO3 (155 molL in water) on TBP
Figure 224 Number of moles of HNO3 in the TBP phase at equilibrium (or x) versusthe initial volume ratio of HNO3 (at 155 molmiddotLminus1 in water) on TBP
0
1
2
3
4
5
6
0 1 2 3 4 5 6 7
xy
= [H
NO
3]or
g[H
2O] o
rg
initial volume ratio of HNO3 (155 molL in water) on TBP
Figure 225 Mole ratio of HNO3H2O in the TBP phase at equilibrium (or xy)versus the initial volume ratio of HNO3 (at 155 molmiddotLminus1 in water) on TBP
22 Interactions with Nitric Acid Analyzed by NMR 139
00 20 40 60 80 100 120
ppm
Figure 226 Proton NMR spectrum of TBPmiddot(HNO3)xmiddot(H2O)y in CDCl3 The complexwas prepared by mixing 4 mL of TBP and 1 mL of 155 molmiddotLminus1 HNO3 volume ratioof TBPmiddot(HNO3)xmiddot(H2O)y to CDCl3 = 11
00 20 40 60 80 100 120
ppm
Figure 227 Proton NMR spectrum of TBPmiddot(HNO3)xmiddot(H2O)y in CDCl3 The com-plex was prepared by mixing 2 mL of TBP and 2 mL of 155 molmiddotLminus1 HNO3 volumeratio of TBPmiddot(HNO3)xmiddot(H2O)y to CDCl3 = 11
22 Interactions with Nitric Acid Analyzed by NMR 140
TBPmiddot(HNO3)xmiddot(H2O)y System in a Solvent
Figures 226 and 227 are two proton NMR spectra of TBPmiddot(HNO3)xmiddot(H2O)y in CDCl3
The first one shown in Figure 226 was recorded after mixing the 11004 complex
at equal volume with CDCl3 The complex (11004) was formed by adding 4 mL of
TBP to 1 mL of nitric acid following the experimental procedure explained in detail in
section 221 (page 131) The second spectrum shown in Figure 227 was made after
mixing the 11804 complex at equal volume with CDCl3 Using the same procedure
as previously the 11804 complex was formed by adding 2 mL of TBP to 2 mL of
nitric acid
In both spectra the peaks of the butyl ether groups belonging to the TBP molecule
are shown between 0 and 5 ppm The singlet peak of nitric acid and water in the
organic phase is the average resonance of bonded to TBP water free water and nitric
acid This peak is observed at 1248 ppm as shown in Figure 226 In Figure 227
the same peak is observed at 1208 ppm This result demonstrates that the chemical
shift of nitric acid and water is shifted upfield when the total concentration in nitric
acid increases in the organic phase
In both spectra two other singlet peaks appear at 648 ppm in Figure 226 and
at 812 ppm in Figure 227 These peaks are due to the micro-droplets of nitric acid
in water that are formed when the TBP complex is mixed with chloroform The
concentration in acid of these droplets can be determined using equation (231) For
the 11004 complex the concentration [HNO3]aq = 52 molmiddotLminus1 whereas for the
11804 complex the concentration [HNO3]aq = 113 molmiddotLminus1 These results show
that the concentration of the nitric acid in the droplets increases when the ratio of
nitric acid to water increases in the TBP complex
Another experiment was performed to study the micro-droplet formation phe-
nomenon in more details For this experiment solutions of TBP at different concen-
trations in chloroform where mixed at equal volume with nitric acid (155 molmiddotLminus1)
NMR spectra of the remaining organic phase were taken and the pH of the aqueous
22 Interactions with Nitric Acid Analyzed by NMR 141
phase was determined using titration methods
80
85
90
95
100
105
110
115
120
00 05 10 15 20 25
δ HN
O3
and
H2O
(pp
m)
[HNO3]org + [H2O]org
Figure 228 Chemical shift of the nitric acid and the water versus total water andnitric acid concentration in the organic phase
In Figure 228 the chemical shift of the nitric acid and the water is plotted versus
the total water and nitric acid concentration in CDCl3 The chemical shift is shown
to increase rapidly until the total concentration reaches 05 molmiddotLminus1 When the
total concentration in acid and water exceeds 05 molmiddotLminus1 the chemical shift increase
flattens out and approaches a plateau at 115 ppm
The plot of the concentration of nitric acid in the aqueous phase [HNO3]aq ver-
sus initial TBP concentration in the organic phase [TBP]ini is shown in Figure 229
The overall trend is for the nitric acid concentration in water to decrease as [TBP]ini
increases However this trend is not monotonic as three stages can be recognized
First [HNO3]aq decrease fast until [TBPini reaches approximately 05 molmiddotLminus1 Sec-
ond the nitric acid concentration in the water stays constant (or increases slightly)
as the TBP concentration increases up to sim1 molmiddotLminus1 Last the [HNO3]aq starts to
decrease again for TBP concentrations higher than unity
The total water and nitric acid concentration in the organic phase is shown to
22 Interactions with Nitric Acid Analyzed by NMR 142
90
95
100
105
110
00 05 10 15 20
[HN
O3]
aq (
mol
L-1
)
[TBP]ini (molL-1)
Figure 229 Concentration of nitric acid in the aqueous phase versus initial TBPconcentration in the organic phase
00
05
10
15
20
25
00 05 10 15 20
[HN
O3]
org+
[H2O
] org
(m
olL
-1)
[TBP]ini (molL-1)
Figure 230 Total water and nitric acid concentration in CDCl3 versus initial TBPconcentration
22 Interactions with Nitric Acid Analyzed by NMR 143
increase linearly with the initial concentration of TBP according to the plot in Figure
230 This kind of linear plot was obtained before where the two values were not linear
An example of it has been given in section 211 page 113 where the dependence of
[D2O] on the equilibrium constant K is plotted In this example the data range was
too narrow to see the curvature predicted by the theoretical equations Therefore I
can not be sure of the linearity of the plot in Figure 230
In the absence of TBP the concentration of water and nitric acid in the organic
phase is the one of free water and nitric acid This free concentration corresponds
to the solubility limit of nitric acid and water in chloroform This value is given
by the y-axis intercept of the plot of the total water and nitric acid in the organic
phase versus the initial concentration of TBP If the relationship in between this two
variables is properly represented as linear the regression of the data shown in Figure
230 gives [HNO3]free + [H2O]free = 001plusmn 008 molmiddotLminus1
Conclusion
In this section the different TBPmiddot(HNO3)xmiddot(H2O)y complexes were first studied with-
out solvent Their composition was determined depending on the initial volume ratio
of TBP and nitric acid at 155 molmiddotLminus1 in water Later the complexes were studied
in chloroform as solvent The formation of micro-droplets of acid due to the antisol-
vent effect was demonstrated using NMR when the TBP complexes were mixed with
chloroform The utility of these complexes will be shown by means of spectroscopy in
the next section (section 23 page 144) for which TBP-water-nitric acid complexes
were used to extract uranium in supercritical CO2
23 Practical Application Uranium Extraction
from Solid Matrices
Introduction
This section describes a practical extension of the present experimental and theoretical
achievements The objectives of this applied research cover not only demonstrating
but also optimizing uranium extraction from ash using supercritical CO2 The differ-
ent uranium-containing ash types that were used originated from the incineration of
byproducts generated in the course of nuclear fuel pellet manufacturing at AREVA
(Framatome-ANP) facilities in Richland and Lynchburg USA My work to develop
and optimize the extraction process was successful to prove the feasibility of a pilot
plant in Richland which is currently under construction
The TBP-nitric acid-water complexes described in detail in the previous sections
were used to oxidize the uranium and as chelating agent The apparatus I constructed
and the different conditions tested to optimize the extraction process will be described
in detail along with the gamma spectroscopy used to quantify the extraction efficiency
The gamma spectroscopy was the main spectroscopic tool used for the experiments
described in this section Gamma rays come from the radiation of nucleus when they
transit from a high energy state to a lower one
A gamma spectrometer is generally composed of a scintillation counter probe
connected to a computer The scintillation probe has a phosphor (generally a sodium
iodide crystal for gamma detection) that emits a flash of light when struck by a
radiation The emitted light is directed to a photo-cathode that produce electrons by
photoelectric effect The electronic signal is then amplified and send to a computer
for analysis The resulting spectrum gives the number of count ie the number of
radiations that hits the probe window versus the energy of the transition that is
responsible for the radiation The energy and magnitude of peaks provide the means
for identifying the presence of certain isotopes and and a measure of their quantity
23 Practical Application Uranium Extraction from Solid Matrices 145
Numerous experiments have been done to inquire whether Supercritical Fluid Ex-
traction (SFE) of uranium with CO2 using a PUREX-like process is possible27ndash3067
However published research reported no significant progress beyond simple theoreti-
cal treatment or discussion of idealized conditions Some experiments were reported
but these were performed with lab-synthesized matrices containing uranium6869
It appears that unpublished work in Japan points to more progress in this area as
suggested by a pilot project under construction utilizing the so-called Super-DIREX
process This project appears to deal with similar issues as treated in this thesis
research however there are no detailed results available in the open literature that
can be used as a starting point
The next section is devoted to demonstrating that it is possible to recover uranium
from real matrices including incineration ash generated as byproduct of nuclear fuel
manufacturing
231 Experimental Work
Chemicals
Tributyl phosphate (97 pure) was purchased from Sigma-Aldrich Chemical Co and
used without further purification Utra pure water was obtained using the Milli-Q
water purification system from millipore Company Nitric acid (63-64 ww) was
purchased from VWR international and was diluted to 155 molmiddotLminus1 with ultra pure
water Carbon dioxide (purity ge9999 Coleman grade) was obtained from Polar
cryogenics AREVA provided 3 different matrices from where the uranium was to
be extracted The composition of those matrices is shown in table 25 L and R are
inceniration ashes from the Lynchburg and Richland sites and Y is a yellow residu
from classical purex extraction For the titration Sodium hydroxide was purchased
from Fisher chemicals and was diluted with ultra pure water to 01 molmiddotLminus1 or lower
Potassium oxalate was purchased from Fisher chemical and was dissolved in water up
to saturation and neutralized to a pH 7 with nitric acid Phenolphthalein was added
23 Practical Application Uranium Extraction from Solid Matrices 146
Table 25 Composition of the different matrices used for extraction determined bymass spectroscopy
Name Symbol L(mgg) R(mgg) Y(mgg)
Antimony Sb 1630 988 609Barium Ba 825 1020 913Calcium Ca 10500 9500 5900Chromium Cr 1790 2690 130Copper Cu 2380 9920 461Gadolinium Gd 89 154 115Iron Fe 86100 103000 132000Lead Pb 665 2180 109Manganese Mn 1040 768 886Molybdenum Mo 687 1090 10500Nickel Ni 5120 1550 748Phosphorous P 17900 32800 14100Tin Sn 1560 1050 769Titanium Ti 73200 44600 223000Uranium U 55700 126000 563000Zinc Zn 9810 31100 350Zirconium Zr 6370 5630 38400
Enrichment 235U 369 327 294
to the potassium oxalate solution to be used as a titration indicator
Experimental Setup
The TBPmiddot(HNO3)xmiddot(H2O)y complexes were prepared by mixing TBP with a 155
molmiddotLminus1 solution of nitric acid in a glass tube with a stopper Different volume ratios
of TBP to nitric acid were prepared according to table 24 on page 137 Thereafter
the mixture was manually shaken vigorously for 5 minutes followed by centrifuging
for an hour The organic phase was then extracted with a pipette and stored
The experimental setup is shown in Figure (231) It consists of a syringe pump
(ISCO model 260D) that pressurizes regulates and delivers CO2 to the system The
entire setup is rated up to 30 MPa The mixing cell (MC) is a 3 mL cylinder with
an entry and an exit for the fluid at each end The two high pressure extraction cells
23 Practical Application Uranium Extraction from Solid Matrices 147
Figure 231 UO2 extraction experimental setup
23 Practical Application Uranium Extraction from Solid Matrices 148
(EC1 and EC2) were especially designed for these experiments They are composed
of a filter that is shaped like a beaker and fits inside the cells The flow goes into the
cell from the top through the filter and goes out under the filter on the lower side of
the cell The internal volume of each extraction cell is 9 mL The stripping cell (SC)
has a 15 mL internal volume The fluid goes in from the top The outputs are at
the top or at the bottom of the cell to retrieve the CO2 phase or the water phase
respectively All cells are insulated and heated by a hot plate Thermocouples were
used to monitor the temperature with a tolerance of plusmn 1 C For practical reasons
the thermocouples were installed inside the cell for EC1 or between the cell and the
insulation for EC2 and SC A magnetic stirrer was used to mechanically stir the
solutions in SC Several valves were used to control the flow at the entrance and exits
of each cell
Before the first extraction 05 to 3 mL of the TBPHNO3 solution was injected
into the mixing cell and 02 to 2 g of ashes were introduced in each filter before placing
them in the extraction cells The stripping cell was filled with 2 to 5 mL of water
The system and all the valves were then closed and the pump was turned on The
heaters were turned on for each cell The mixing cell was then pressurized and the
TBPHNO3 complex was left with CO2 to be dissolved for sim30 min or until the other
cells reached an equilibrium temperature The valve between the mixing cell and the
first extraction cell was then open The system was left for a static extraction for 1
hour or more After the static extraction period the valve between EC1 and EC2
was slightly open to allow a dynamic extraction from EC1 to EC2 The flowrate was
set at 5 mLmin or lower After EC2 was filled the same protocol as the one used
for EC1 was followed
After the extraction was finished the organic phase was directed into SC by
opening slightly the valve between them When SC become full the magnet stirrer
was turned one and the two phases were mixed for at least one hour The valve
between EC2 and SC was then closed and the water phase was extracted from the
23 Practical Application Uranium Extraction from Solid Matrices 149
lower part and the TBP phase was extracted along with CO2 from the upper part
of the stripping cell The remaining ash and both solutions were then analyzed
To improve the stripping efficiency known amount of uranium nitrate and nitric
acid were dissolved in water and extracted with TBP in CO2 under various conditions
Most experiments were done at 20 MPa and 50 C with a TBP to water volume ratio
of 119 The water and the TBP solutions were thereafter analyzed with gamma
spectroscopy and the nitric acid content was determined by titration
Some stripping experiments were performed at ambient pressure (without CO2)
were also experimented The organic phase was composed of TBP with a concentra-
tion of 535 gmiddotLminus1 of uranium and 5 molmiddotLminus1 of nitric acid For these experiments
the organic phase was stripped with an equal volume of warm water (50 C) The
two phases were then separated The aqueous phase was analyzed and the remaining
organic phase was stripped again with an equal volume of warm water This process
was repeated several times
Analysis
The analysis of the samples was performed using different techniques The content
in uranium was determine using the gamma spectroscopy and important results were
confirmed using Inductively Coupled Plasma Mass Spectroscopy (ICP-MS) The ICP-
MS analysis was performed by an external lab facility which was arranged by AREVA
The pH of the different solutions was measured using titration methods
Gamma Spectroscopy The gamma spectrometer used (Canberra Industries) was
composed of a scintillation counter (NaI phosphor) connected to a computer running
the Genie 2000 software which manages data collection and performed spectral anal-
ysis The gamma probe was protected from the outside radiations with a cylindrical
lead shield with a lead cover A specially designed plastic tray was placed over the
gamma probe The tray restrained the sample glass tube to be sure it is in the exact
same position relative to the probe for all measurements
23 Practical Application Uranium Extraction from Solid Matrices 150
Before the acquisition the sample glass tubes were filled with 05 mL of the liquid
sample or 05 g of solid sample and placed over the probe The lead cover was put over
the sample and the probe to shield them The gamma radiations were counted for
2000 seconds The gamma spectrum (count versus energy) was then plotted After
each spectrum acquisition the sample was rotated Five spectral measurements were
taken and averaged out
Typical gamma spectra are shown in Figure 232 for the background radiation
and for the UO2+2 ion radiations in an aqueous solution and in a TBP solution The
background spectrum is flat demonstrating that the sample is well shielded For both
uranyl solutions four major peaks can be seen at 633 926 1438 and 1857 keV
The peaks at 633 and 926 keV correspond to the energy of radiation emitted by
thorium-234 The peaks at 1438 and 1857 keV correspond to the gamma radiations
emitted by uranium-235 Thorium-234 comes from the alpha decay of uranium-238
In appendix B the disintegrations of 235U and 238U are detailed in two tables
000
10000
20000
30000
40000
50000
50 100 150 200
coun
t
Energy (keV)
aqueousTBP
Figure 232 Gamma spectra of the background and of uranyl ion enriched at 31in 235U and at 87 gmiddotLminus1 of uranium in water and of the UO2+
2 ion (29 235U) at 24gmiddotLminus1 in TBP
23 Practical Application Uranium Extraction from Solid Matrices 151
The gamma energies were calibrated using a solution at high concentration of
uranium nitrate in water For each energy (peak position) the number of counts
is proportional to the concentration of the isotope that emits the gamma radiation
at that energy The ratio between the number of counts and the concentration was
calculated by using standard solutions in TBP and water or by using a standard
amount of ash before extraction For a better accuracy the area of the peak was
used to determine the concentrations Figure 233 shows the calibration curves for
the uranyl ion in TBP and water For both calibration and measurements only the
235U peak at 1857 keV was used because it has the highest abundance (53) The
other 235U peak at 1438 keV is to small and if chosen (abundance of 10) the area
measurements would have been less accurate The thorium peaks are overlapping
with peaks from other decay isotopes and can therefore not be used for analysis The
dectection limit with maintained accuracy of this experimental setup was 003 gmiddotLminus1
of 235U which corresponds to 15 gUmiddotLminus1 or to 750 microg of total uranium
0
5000
10000
15000
20000
25000
0 05 1 15 2 25 3
Pea
k ar
ea
[235-U] (gL)
Figure 233 Calibration curves for UO2+2 ion in water (H 31 235U) and in TBP
(N 29 in 235U)
23 Practical Application Uranium Extraction from Solid Matrices 152
pH Analysis Uranyl nitrate (also called uranium nitrate UO2(NO3)2) can react
with hydroxide ions to form uranyl hydroxide according to the following chemical
equation
UO2(NO3)2 + 2NaOH rarr UO2(OH)2 + 2NaNO3 (233)
To avoid the formation of uranyl hydroxide 5 mL of a potassium oxalate solution at
pH 7 was added to 02 mL of the aqueous solutions prior to titration The potassium
oxalate is added in excess to react with the uranium nitrate and therefore it makes it
impossible for the uranium nitrate to react with sodium hydroxide This procedure
allows the determination of the free acid concentration The pH indicator used was
phenolphthaleine and it was dissolved in the potassium oxalate solution before its
neutralization The solutions were thereafter titrated with sodium hydroxide at 01
molmiddotLminus1 or lower depending on the acid concentration
To titrate the organic phase the acid was first stripped out from the organic
phase using a large quantity of water This water was thereafter titrated with the
same protocol as the one used to directly titrate the aqueous phase with the exception
that the sodium hydroxide concentration was lower
232 Extraction of UO2 from Different Matrices
During the extraction the uranium(IV) dioxide (UO2) is oxidized into uranium(IV)
nitrate with the help of nitric acid which is the oxidizing agent This oxidation
follows the chemical reaction
3 UO2 + 8 HNO3 rarr 3 UO2(NO3)2 + 2 NO + 4 H2O (234)
When TBP is used one uranium nitrate bonds to two TBP molecules according to
this chemical equation
UO2(NO3)2 + 2 TBP + 2 H2O rarr UO2(NO3)2middot2TBPmiddot2H2O (235)
The supercritical fluid extraction of uranium for any TBPmiddot(HNO3)xmiddot(H2O)y com-
plexes can be described using two equations Equations (236) and (237) When the
23 Practical Application Uranium Extraction from Solid Matrices 153
molecular ratio of nitric acid to TBP x is greater than or equal to 43 and the
molecular ratio of water to TBP y is greater than or equal to 13 the extraction
follows the chemical reaction of equation (236)
UO2 + 2 TBPmiddot(HNO3)xmiddot(H2O)y rarr
UO2(NO3)2middot2TBPmiddot2H2O +2
3NO +
6y minus 2
3H2O +
6xminus 8
3HNO3 (236)
Independently of the value of x equation 237 describes in a general way the
extraction of uranium
3 UO2 + (6 + z) TBPmiddot(HNO3)xmiddot(H2O)y rarr
3 UO2(NO3)2 middot 2TBPmiddot2H2O + 2 NO + (6yminus 2 + z) H2O + (6xminus 8 + z) HNO3 (237)
where z is equal of greater than 6xminus 8
In the following part I will first describe the different parameters that can influence
the extraction efficiency and then I will summarize the optimized parameters obtained
for the system studied
Extraction Efficiency Improvement
Different parameters were adjusted to obtain the best extraction efficiency with an
acceptable protocol Such protocol needed to be conservative regarding safety and
should be cost and energy efficient
The gamma spectroscopy was used to determine the yield of the extraction by
analyzing the matrices before and after extraction These results were confirmed
by the analyze of the amount of uranium extracted in the TBP phase using gamma
spectroscopy Mass Spectroscopy was also used to confirm the gamma data In Figure
234 the gamma spectrum of the three types of matrices used for uranium extraction
are shown
The different parameters that were adjusted are the TBP complex composition
the temperature and pressure the TBPmatrix ratio the static extraction time and
the flowrate and the number of successive extractions
23 Practical Application Uranium Extraction from Solid Matrices 154
000
50000
100000
150000
200000
250000
300000
50 100 150 200
coun
t
Energy (keV)
ash Lash Yash R
Figure 234 gamma spectra of the background and of the three kind of matrices (RL and Y) used for extraction
TBP Complex Composition Different TBP complexes can be prepared by mix-
ing TBP with nitric acid at different volume ratios as detailed in section 222 page
135 The ideal composition is the one that has a sufficient amount of nitric acid
to oxidize uranium dioxide into uranium nitrate (UO2(NO3)2) at a reasonable rate
The quantity of TBP should also be enough to carry the uranium nitrate into the
CO2 phase
Theoretically TBPmiddot(HNO3)18middot(H2O)04 is the best composition Indeed it has the
highest nitric acid to water molecular ratio with a sufficient amount of TBP according
to Table 24 on page 137 Furthermore Wai et al29 have shown that this complex
is the most efficient to dissolve UO2 For these reasons the TBPmiddot(HNO3)18middot(H2O)04
complex was chosen for the extraction of uranium
Several other complexes were briefly tried out The one with a lower nitric acid
to water molecular ratio lowered the amount of uranium extracted from the ash
which is not acceptable On the other hand the one with higher nitric acid to TBP
23 Practical Application Uranium Extraction from Solid Matrices 155
molecular ratio did not improve the extraction efficiency significantly and would make
the stripping of the uranium from TBP into water more difficult
Temperature and Pressure Higher temperatures generally improve the rate of
any reaction but in supercritical CO2 it also lower the density of the supercritical
fluid At lower density CO2 is less able to dissolve species such as the TBP-water-
nitric acid or the TBP-uranium nitrate complexes To counteract the effect of the
higher temperature on the density the pressure can be increased Unfortunately for
safety reasons the pressure needed to be kept at a reasonable level (ie under 40
MPa)
It is known that the dissolution of UO2 in supercritical CO2 depends on the density
of the fluid Samsonov et al28 have shown that the best condition for the dissolution
of UO2 is 65 C and 250 atm which correspond to a density of 7656 gLminus1 This
was therefore the starting condition that I used Higher pressures and temperatures
(up to 125 C and 40 MPa) were tried out without a significant improvement in the
extraction On the other hand by lowering the pressure and temperature to 20 MPa
and 60 C for a density of 7237 gLminus1 the recovery yield was unchanged Further
lowering in the temperature and pressure were tried out but the efficiency was greatly
affected Therefore a temperature and pressure of 60 C and 20 MPa were selected
for the extraction as optimum values
TBPMatrix Ratio For a good extraction efficiency an excess of nitric acid
and therefore an excess of TBP-water-nitric acid complex is needed On the other
hand a large excess will lower the concentration of uranium nitrate and increase
the concentration of nitric acid Both of these consequences decrease the stripping
efficiency The best yield was obtained with 2 mL of TBPmiddot(HNO3)18middot(H2O)04 per
gram of ash
23 Practical Application Uranium Extraction from Solid Matrices 156
Static Extraction Time and Flowrate The static extraction time allows the
reaction between nitric acid and UO2 to be completed No change in the extraction
efficiency was observed after one hour of static extraction therefore the extraction
time was set to one hour
After the static extraction is finished the dynamic extraction is initiated and the
fluid goes first to the second extraction cell and then goes to the stripping cell The
flowrate of the dynamic extraction had to be adjusted to be as fast as possible without
compromising the extraction High flowrates result in depressurizing CO2 and thus
reducing its density and consequently reducing its ability to is to dissolve the uranium
nitrate-TBP complex that needs to be extracted No changes were observed in the
amount of uranium recovered when the flowrate was kept under 05 mL per minute
Number of Extractions After the optimization of the other parameters (ie
temperature pressure complex composition static extraction time flowrate and
TBPmatrix ratio) the number of successive extractions did not improve the extrac-
tion efficiency any further I believe that the remaining uranium is strongly bonded
to the matrix and is not removable with supercritical fluid extraction process used in
these experiments
Nevertheless two extraction vessels were used in series (Figure 231) to improve
the concentration of uranium in the TBP phase and therefore enhance the stripping
of uranium into water
Optimal Parameters for the Extraction
The optimized parameters used are shown in Table 26 Table 27 summarized the
optimum recovery efficiencies which I obtained for the three types of matrices used
in the experiments
The efficiency of supercritical fluid extraction is well beyond the one of the tra-
ditional Purex process For this application the supercritical fluid extraction has
another advantage over the Purex process the ashes are dry after extraction and the
23 Practical Application Uranium Extraction from Solid Matrices 157
Table 26 Optimal parameters for the supercritical CO2 extraction
Parameters unit Optimal Values
Pressure MPa 200Temperature C 60Density gmiddotLminus1 7237TBPmiddotNO3)xmiddot(H2O)y complex molecular ratio 11804TBP complexmatrix ratio mLg 21Static extraction time hour 1flowrate mLmin le 05Number of extractions 1
Table 27 Optimum uranium recovery efficiencies
Matrix extracted U before U after optimized
R 85 104 16 yesL 90 62 06 yesY 25 35 26 no
extra water and nitric acid do not need to be evaporated
233 Stripping of the Uranium from TBP Media to Water
After the extraction the cell had to be slowly depressurized inside a sample glass
tube in which the CO2 deposits the TBPmiddotUO2middot(NO3)2 complex with excess of nitric
acid and TBP It is important to recover the uranium from the TBP solution into
water because it will allow the recycling of the TBP and an easy reprocessing of
the enriched UO2 This is called stripping and it was carried out with water at
atmospheric pressure or with CO2 and water continuously with the extraction as
shown on Figure 231
After the stripping gamma analysis of the water and TBP phases were carried
out to determine the efficiency of the stripping In Figure 235 an example of the
spectrum of the TBP stripped solution and the aqueous solution is shown
23 Practical Application Uranium Extraction from Solid Matrices 158
000
20000
40000
60000
80000
100000
50 100 150 200
coun
t
Energy (keV)
aqueousTBP
Figure 235 gamma spectra of the background and of the uranyl ion (29 U) in theTBP stripped solution at and in the aqueous solution
Stripping at Atmospheric Pressure
In this section the efficiency of the stripping with water at atmospheric pressure was
evaluated The conditions were optimized to maximize the stripping efficiency ie
the concentration in the organic phase was high in uranium and low in acid and the
water temperature was elevated to 50 C Figure 236 is shows the results of this
experiment The total mass of uranium stripped is plotted versus the total amount
of water used A total of 15 plusmn 1 of uranium was stripped from the TBP phase with
a 51 volume ratio of the aqueous phase to the organic phase The total uranium
concentration in the organic phase was 14 plusmn 1 gmiddotLminus1
Stripping under Pressure Continuous with the Extraction
Some experiments were performed to improve the stripping efficiency of uranium
from the TBP phase to the aqueous phase Standard solutions of uranium nitrate
and nitric acid in water were extracted with TBP and CO2 The remaining phases
23 Practical Application Uranium Extraction from Solid Matrices 159
000
002
004
006
008
010
0 1 2 3 4 5 6
Tot
al m
ass
strip
ped
(g)
Volume used (mL)
Figure 236 Total mass of uranium stripped versus total volume of water used Theline is a guide for the eyes and does not have any theoretical or analytical value
were titrated and analyzed with gamma spectroscopy
Figure 237 shows the partition of the nitric acid between the two phases The
initial amount of acid or uranium in the aqueous phase does not influence the acid
partition The partition coefficient D is obtained from equation (238) and Figure
237
D = [HNO3]aq[HNO3]org (238)
D was found equal to 14 plusmn 04 when the extraction occurred at 50 C and 20 MPa
and with a volume ratio of 119 between the organic and the aqueous phases This
result implies that 60 of the acid is in the aqueous phase whereas 40 goes in the
organic phase
In Figure 238 the partition of uranium between the organic and the aqueous
phases is shown for three initial nitric acid concentrations (16 33 and 7 molmiddotLminus1)
with the same conditions as above It is shown that the continuous stripping of
uranium into the aqueous phase is less efficient when the initial amount of nitric acid
23 Practical Application Uranium Extraction from Solid Matrices 160
00
05
10
15
20
25
30
35
40
0 1 2 3 4 5 6
[HN
O3]
org
(mol
L)
[HNO3]aq (molL)
Figure 237 Partition of HNO3 between the organic and the aqueous phases at 50C 20 MPa and with a TBPwater volume ratio of 119
is greater
Table 28 provides detailed results of the stripping experiments It shows the ef-
ficiency of the uranium stripping at 50C 20 MPa and with a 119 TBP to water
volume ratio As shown in Figure 238 an increase in the initial acidic concentration
lowers the stripping efficiency On the other hand at higher concentrations of nitric
acid the initial uranium concentration greatly influence the efficiency Indeed the
percentage of uranium in the aqueous phase drops from 39 to 5 when the initial
uranium concentration decreases from 219 to 58 gmiddotL This phenomenum is not ob-
served at lower acidic concentration where the efficiency is the same regardless of the
initial uranium concentration and considering the experimental errors
The preceding data were all collected at the same conditions ie 50 C 20 MPa
and a volume ratio of 119 of the organic to the aqueous phase Next I will show
the changes when other conditions were used In Figure 239 the percentage loss of
extraction efficiency is plotted versus the initial nitric acid concentration The loss of
23 Practical Application Uranium Extraction from Solid Matrices 161
Table 28 Results of the stripping experiments at 50C 20 MPa and with a 119TBP to water volume ratioa
[U]ini [HNO3]ini stripping [U]org [U]aq [HNO3]aq [HNO3]org
(gmiddotLminus1) (molmiddotLminus1) efficiency () (gmiddotLminus1) (gmiddotLminus1) (molmiddotLminus1) (molmiddotLminus1)
219 83 39 133 86 50 63162 67 31 112 50 48 36108 71 18 88 19 54 3259 74 5 56 3 59 28
174 48 31 120 54 37 21110 47 28 79 31 33 2734 43 23 26 8 24 35
182 33 47 97 85 24 18130 33 40 77 52 23 2091 33 31 63 28 21 23
187 27 35 121 66 19 1765 28 32 44 21 19 18
205 19 56 90 115 13 11147 15 53 69 78 10 11112 19 49 58 54 13 12106 17 57 46 60 14 0675 18 54 35 41 13 11
205 12 62 79 126 10 05205 12 61 81 124 10 04103 07 91 9 94 06 01
a Typical statistic errors are less than 5 for the uranium concentrations andare less than 10 for the nitric acid concentrations and the stripping efficiency
23 Practical Application Uranium Extraction from Solid Matrices 162
0
20
40
60
80
100
120
140
160
0 20 40 60 80 100 120
[UO
2]or
g (g
L)
[UO2]aq (gL)
[HNO3]ini = 70 molL[HNO3]ini = 33 molL[HNO3]ini = 16 molL
Figure 238 Partition of uranium between the organic and the aqueous phases fordifferent initial nitric acid concentrations The experiment was performed at 50 C20 MPa and with a TBPwater volume ratio of 119 Lines are guides for the eyesand do not have any theoretical or analytical value
efficiency is the most important (up to 68) when the volume of the aqueous phase
is reduced The decrease in the stripping temperature to 24 C has a lesser impact
on the efficiency (le 32) However a general tendency is observed independently
of the condition changed At high acidic concentration the loss of efficiency is more
important than at low nitric acid concentration An increase in the efficiency is even
shown at 24 C for initial concentrations in nitric acid below 2 molmiddotLminus1
Conclusion
During this research work the extraction of uranium from ash and other matrices
has been proven possible with a very good yield The stripping stage performed
continuously with the extraction has also been shown to be feasible Continuous
stripping was shown to be more efficient than the separate process at atmospheric
pressure Supercritical fluid extraction allows the recovery of dry processed ashes
23 Practical Application Uranium Extraction from Solid Matrices 163
-10
0
10
20
30
40
50
60
70
80
0 1 2 3 4 5 6 7
Lost
of e
ffici
ency
(
)
[HNO3]ini (molL)
vol ratio 1124 oC
Figure 239 Lost of efficiency when the volume ratio is 11 between the two phases(H) and when the temperature is 24 C (N)
with a low radioactive content These two advantages are very important because
the ashes can be disposed of as low-level waste without further cleaning or processing
Nevertheless there is still room for further improvement before using this process
in a large-scale plant which is outside the scope of this work For example the
extraction efficiency could be potentially enhanced with the use of an ultra-sonic
bath Other suggestions to improve the stripping efficiency include the use of pulse
columns electrolysis and osmosis
Conclusion 164
Conclusion
This chapter was dedicated to the study of the supercritical fluid extraction of ura-
nium from different matrices such as incineration ash coming from the byproducts of
nuclear fuel production For this project I used a mixture of the TriButyl Phosphate
(TPB) as a complexing agent and nitric acid as an oxidizing agent As part of
this research the interaction TBP and water was studied in supercritical CO2 and in
chloroform using the Fourier Transform Infra-Red (FT-IR) and the Nuclear Magnetic
Resonance (NMR) spectroscopies It was found that TBP and water make a onendash
tondashone complex when mixed with an excess of water When this complex is mixed
with another solvent such as chloroform or supercritical CO2 some microdroplets of
water appear in the oil due to the antisolvent effect The amount of these droplets
was calculated for a sim119 volume ratio of TBP complex to solvent When chloroform
was chosen as a solvent 14 plusmn 1microL of microdroplets of water were formed In sub-
and supercritical CO2 the amount of microdroplets varies between none to sim11 microL
when the temperature decreases from 70 to 25 C at a constant pressure of 200 bar
This amount decreases from sim7 to sim1 microL when the pressure increases from 200 to
400 bar at 40 C Chloroform is therefore comparable to CO2 at low temperature and
pressure regarding the amount of microdroplets formed
Next the composition of different TBPndashwaterndashnitric acid complexes was deter-
mined without a solvent using the NMR spectroscopy In the condition of my ex-
periments the maximum number of nitric acid molecules per water molecule in the
TBPmiddot(HNO3)xmiddot(H2O)y adducts does not exceed five Thereafter I studied the forma-
tion of microdroplets when these TBP adducts are mixed with a solvent (chloroform)
The acidic concentration in the droplets depends on the composition of the TBPndash
waterndashnitric acid complex The amount of nitric acid in the microdroplets increases
greatly when the molecular ratio of nitric acid to water increases
To bring the topic of this chapter to closure the feasibility of extracting UO2
Conclusion 165
from different matrices was demonstrated Some of these matrices are incineration
ash coming from the byproducts of the nuclear fuel pellet fabrication The conditions
of the extraction ie temperature pressure TBPndashwaterndashnitric acid complex used
extraction time flow-rate etc were optimized At least 85 of the enriched uranium
was recovered from the ash at these optimized conditions After the extraction
CO2 can be released in the air and the extracted uranium is recovered as a TBP
complex with an excess of TBP and nitric acid Uranium can not be recycled in the
fuel fabrication proces in this form It needs to be stripped into an aqueous phase
The simple stripping at atmospheric pressure with warm water is not efficient enough
This stripping would need a great amount of water that would have to be evaporated
A better way of stripping the uranium out of the organic phase is to do it continuously
with the extraction The efficiency of this stripping method was optimized using
standard solutions A smaler amount of water was needed for the continuous stripping
compared to the normal stripping at atmospheric pressure Based on this research
work a pilot plant is now operational at the AREVA (Framatome-ANP) facility in
Richland Washington
Some improvements are suggested for the experimental setup to make the extrac-
tion and the stripping more efficient For example the extraction cells can be put in
an ultra-sonic bath This technique might enhance the extraction efficiency by liber-
ating the uranium strongly bonded to the matrix On the other hand the stripping
can also be enhanced by using a pulse column or replaced for electrolysis which could
be used to precipitate out UO2 Osmosis can be also a good alternative where the
process has been already optimized on large scale for desalting sea water
General Conclusions
This research work was devoted to the understanding of the supercritical fluid ex-
traction of cesium and uranium These two elements were especially chosen because
of their abundance in various types of nuclear waste and because of their importance
in the reprocessing and recycling of such waste Original contributions were made
to the understanding of the phenomena and interactions involved which further the
advance of the extraction chemistry and technology
In the following paragraphs I will give a synopsis of the different parts of my work
and mention the findings and contributions from each part
Supercritical fluid extraction of metal ions requires the use of a chelating agent
Crown ethers have been chosen as ligand in the extraction of cesium where often
water plays a important role Therefore the interaction between crown ethers and
water was first described in chapter 1 This interaction was studied in sub- and
supercritical CO2 using FT-IR The differentiation between three waterndashcrown ether
configurations (ie the bridge the single and the sandwich forms) was made with the
help of this analytical technique The sandwich configuration in the organic phase
between two crown ethers and a water molecule was first discovered through this
work The equilibrium parameters (ie the equilibrium constant the molar fraction
of crown ether bonded to water and the amount of free water) were determined for the
bridge and single configurations at different pressures and temperatures The value
of these parameters were also determined for the global study that lumps together
the equilibria of the bridge and the single configuration in one equilibrium This last
set of results was compared with the one in organic solvent found using NMR as a
General Conclusions 168
method of analysis
The study of the waterndashcrown ether interaction in organic solvents shows that the
interaction depends strongly on the crown ether used and on the nature of solvents
The main factor of this dependence is the polarity of the solvent As the polarity
increases the molar fraction (k) of crown ether complexed with water increases from
61 to 97 for 18-crown-6 These values can be compared to the ones in supercritical
fluids where k varied from 33 to 54 as the temperature decreases at constant
pressure (sim20 MPa) These results show that at least 46 of the water is free in
CO2 where less than 39 is free in CDCl3 and CCl4 mixtures
The role of water in the cesium extraction equilibrium was discussed at the closure
of Chapter 1 The cesium extraction was described using four equilibrium reactions
The calculation of the equilibrium constants leads to three conclusions
1 The sandwich configuration between two crown ethers and one cesium picrate
is not possible if water is part of it
2 The one-to-one complex of the cesium picrate with the crown ether is preferred
with water than without water
3 The ldquosandwichrdquo configuration is preferred to the one-to-one complex when water
is involved
It was also observed that the amount of water in oil decreases with the increase
of the cesium picrate concentration It seems that the water is competing with crown
ether to be carried out of the water phase The efficiency of the extraction might be
enhanced in a ldquowater-freerdquo extraction
The second chapter of this thesis work is focused on the supercritical fluid ex-
traction of uranium TBP-nitric acid-water complexes were used as chelating agent
When TBP-water or TBP-nitric acid-water complexes are mixed with a solvent char-
acterized with a low dielectric constant some micro-droplets appear due to the anti-
solvent effect Therefore the first part of the chapter was devoted to the understand-
General Conclusions 169
ing of the TBP-water and the TBP-nitric acid-water interactions in various solvents
FT-IR technique was successfully used to describe the TBP-water complex in sub-
and supercritical CO2 The equilibrium constant and the molar fraction of water
complexed to TBP in CO2 as function of temperature and pressure were determined
Most importantly the FT-IR technique was used to predict the amount of water
droplets produced by the antisolvent effect when the TBP-water complex is mixed
with CO2 These results where compared with the measurement obtained in chloro-
form using NMR as an analytical tool These two analytical methods complement
each other to give a complete picture of the equilibrium The analysis of the molar
fraction of TBP bonded to water shows that there is more water bonded to TBP in
the supercritical fluid Consequently the amount of free water is larger in the organic
phase when CDCl3 is chosen as a solvent In pure CDCl3 the standardized amount
of micro-droplets was found equal to 14 plusmn 1 microL This is 3 microL more than the highest
volume obtain in CO2 where the pressure and temperature were at the lowest setting
studied (ie 20 MPa and 25 C)
A further understanding of the interactions was acquired when the TBP-water
equilibrium was studied with the addition of nitric acid which is essential to the
supercritical fluid extraction of uranium Different TBP(HNO3)x(H2O)y complexes
were studied without solvent to determine their composition depending on the initial
volume ratio of TBP and nitric acid The formation of micro-droplets of acid due to
the antisolvent effect was demonstrated using NMR when the TBP complexes were
mixed with chloroform It was found that the pH of these micro-droplets decreases
when the nitric acid to water molecular ratio increases in the TBP complex
Finally a practical application for the TBP-nitric acid-water adducts was demon-
strated when they were used to extract uranium from nuclear fuel manufacturing
incineration ash and other solid matrices into supercritical CO2 The extraction of
uranium has been proven possible with a very good yield The stripping stage per-
formed continuously with the extraction has also been shown to be feasible and more
General Conclusions 170
efficient than the separate process at atmospheric pressure The uranium extraction
process developed and optimized through this work has been received well in the
nuclear industry where a pilot plant applying this new process has been recently
commissioned at the AREVA Framatome-ANP fuel manufacturing facility in Rich-
land USA
To sum up this research work has successfully demonstrated that supercritical
fluid extraction could be used to recover uranium and cesium These and other ele-
ments can be extracted from high level radioactive waste on a large scale Gradually
and in a controlled manner each element could be removed from the main waste al-
lowing a specific waste management solution for each element In particular extracted
plutonium and uranium could be reused as fuel for power-plants Other isotopes could
be used for research or medical purposes whereas low level waste could be easily for-
gotten underground Even if no practical use were found for certain isotopes their
recycling andor storage would be much easier when separated from the bulk The
remaining high level waste could be processed as traditionally envisioned ie using
short term storage long term storage and neutron transmutation that is of course
when such technology matures eventually It would be necessary to monitor the wa-
ter and hydrogen level in such plant Indeed due to radiolysis effects potentially
explosive hydrogen gas is generated from water in these materials
For future consideration and extension of my work I suggest that other important
elements that were not included in this experimental work such as plutonium neptu-
nium and americium should be also studied If shown to be successful the benefits
of a supercritical fluid extraction plant would be greatly expanded
Appendix A
Mass Yield of the Fission Element
172
Table A1 Mass (g) and radioactivity (Ci) of elements (150 days after discharge froma PWR) per ton (Mg) of uranium (freshly loaded in the reactor) for all elements
Element Symbol Atomic number Mass (gMg) Radioactivity (CiMg)
Uranium U 92 954E+05 405E+00Neptunium Np 93 749E+02 181E+01Plutonium Pu 94 903E+03 108E+05Americium Am 95 140E+02 188E+02Curium Cm 96 470E+01 189E+04
Selenium Se 34 487E+01 396E-01Bromine Br 35 138E+01 000E+00Krypton Kr 36 360E+02 110E+04Rubidium Rb 37 323E+02 190E+02Strontium Sr 38 868E+02 174E+05Yttrium Y 39 453E+02 238E+05Zirconium Zr 40 342E+03 277E+05Niobium Nb 41 116E+01 521E+05Molybdenum Mo 42 309E+03 000E+00Technetium Tc 43 752E+02 143E+01Ruthenium Ru 44 190E+03 499E+05Rhodium Rh 45 319E+02 499E+05Palladium Pd 46 849E+02 000E+00Silver Ag 47 421E+01 275E+03Cadmium Cd 48 475E+01 595E+01Indium In 49 109E+00 357E-01Tin Sn 50 328E+01 385E+04Antimony Sb 51 136E+01 796E+03Tellurium Te 52 485E+02 134E+04Iodine I 53 212E+02 222E+00Xenon Xe 54 487E+03 312E+00Cesium Cs 55 240E+03 321E+05Barium Ba 56 120E+03 100E+05Lanthanum La 57 114E+03 492E+02Cerium Ce 58 247E+03 827E+05Praseodymium Pr 59 109E+03 771E+05Neodymium Nd 60 351E+03 947E+01Promethium Pm 61 110E+02 100E+05Samarium Sm 62 696E+02 125E+03Europium Eu 63 126E+02 135E+04Gadolinium Gd 64 629E+01 232E+01Terbium Tb 65 125E+00 302E+02Dysprosium Dy 66 628E-01 000E+00
Appendix B
Decay Series
174
Table B1 Main decay energies for 238-Uranium
Isotope AtomicMass
Half-life DecayMode
DecayEnergy(MeV)
GammaEnergy(keV)
GammaRayIntensity()
23892U 2380508 446x109 y α 4955 007
23490Th 2340436 2410 d βminus1 0270 6329 38
9235 279278 2711280 024
234m91 Pa 117 min 999 βminus1 229 76641 21
013 IT 100100 6523491Pa 2340433 670 h βminus1 2199 1312 20
5695 1188324 12
23492U 2340409 245x105 y α 4856 5323 12
23090Th 2300331 754x104 y α 4771
22688Ra 2260254 1600 y α 4870 1861 330
22286Rn 2220176 382 d α 5590 510 007
21884Po 311 min α 6114
21482Pb 2139998 268 min βminus1 1032 24192 75
29509 19235187 3778582 11
21483Bi 2139987 199 min βminus1 327 60931 461
76835 49112027 15123810 596176449 159
21484Po 2139952 164 microsec α 7833
21082Pb 2099842 223 y βminus1 063
21083Bi 2094841 501 d βminus1 116
21084Po 2099828 1384 d α 5407 80313 0001
20682Pb 2059744 stable
y = year(s) d = day(s) h = hour(s) min = minute(s) s = second(s) α = alpha particle emission βminus1 = negative beta emission IT Isomeric transition uncertainties le 04
175
Table B2 Main decay energies for 235-Uranium
Isotope AtomicMass
Half-life DecayMode
DecayEnergy(MeV)
GammaEnergy(keV)
GammaRayIntensity()
23592U 2350439 704x108 y α 46793 10917 15
14378 10516338 4718574 5320213 1520533 47
23190Th 2310363 252 d βminus1 0389 2564 15
84203 6623191Pa 2310359 327x104 y α 5148 27396 93
30007 2422789Ac 2270278 216 y 986 βminus1 0041
14 α 514822790Th 2270277 1872 d α 6146 5014 85
23597 11225624 67
22387Fr 2230197 218 min βminus1 1147 5014 33
7972 8922388Ra 2230185 1143 d α 5979 15418 56
26939 1421986Rn 2190095 396 sec α 6946 27113 99
40170 6621584Po 2149994 178 msec α 7526
21182Pb 2109887 361 min βminus1 1379 40486 38
42700 178306 38
21183Bi 2109873 214 min 03 βminus1 0584 3501 128
997 α21184Po 2109866 052 sec α 7594 5695
89723 05220782Tl 2069774 477 min βminus1 1427 89723 024
20782Pb 2069759 stable
y = year(s) d = day(s) h = hour(s) min = minute(s) s = second(s) α = alpha particle emission βminus1 = negative beta emission IT Isomeric transition uncertainties le 01
Appendix C
Acronyms
ATW Accelerator Transmutation of Waste
DOE Department Of Energy
FID Free Induction Decay
FT-IR Fourrier Transform Infra Red
HLW High level Waste
IASR Industrial Accident Safety Rate
ICP-MS Inductively Coupled Plasma Mass Spectroscopy
ILW Intermediate level Waste
INSC International Nuclear Safety Center
LLW Low level Waste
LMFBR Liquid Metal Fast Breeder Reactors
MCT Mercury-Cadmium-Telluride
MRI Magnetic Resonance Imaging
MS Mass Spectroscopy
NIST National Institute of standards and Technology
NMR Nuclear Magnetic Resonance
NRC Nuclear Regulatory Commission
PNMR Proton Nuclear Magnetic Resonance
PUREX Plutonium Uranium Recovery by Extraction
178
PWR Pressurized Water Reactors
RF Radio Frequency
SFC Supercritical Fluid Chromatography
SF-CO2 Supercritical Fluid Extraction using CO2
SFE Supercritical Fluid Extraction
SNF Spent Nuclear Fuel
TBP Tri-nButyl Phosphate
TMS TetraMethylSilane
UV Ultra Violet
Appendix D
Curriculum Vitae
Address
France 41grandrsquorue68280 ANDOLSHEIM
USA 106 Edgewood DriveRichland WA 99352
phone +1 509 628 3030
e-mail Anne Farawilahotmailcom
Academic History
1994 - 1998 Louis Pasteur University Strasbourg (France)- Diploma of general undergraduate studies (DEUG) of chemistry- Bachelor (Licence) of chemistry and physics
The American equivalence of this diploma is a bachelor degree with an academicmajor in chemistry and an academic minor in physics and mathematics
1998 - 2000 Louis Pasteur University Strasbourg (France)- Maıtrise of chemistry and physics- Diploma of thorough studies (DEA) of chemistry and physics
The American equivalence of this diploma is a master degree with an academicmajor in chemistry and an academic minor in physics
180
2000 - 2005 Louis Pasteur University Strasbourg (France)and University of Idaho Moscow (Idaho USA)- PhD of physical chemistry June 2005 (thesis herein presented)
Master Publications and Conference Presentations
1 Fluorescence spectroscopy of U(VI) in the presence of perchlorate ions Rusten-holtz A Billard I Duplatre G Lutzenkirchen K Semon L RadiochimActa 2001 89 83ndash89
2 Fluorescence of UO2+2 in a non-complexing medium HClO4NaClO4 up to 10
M Billard I Rustenholtz A Semon L Lutzenkirchen K Chem Phys2001 270 345ndash354
3 Anne Rustenholtz Isabelle Billard Fluorescence spectroscopy of U(VI) in thepresence of perchlorate ions Poster presented in the 7emes Journees Nationalesde Radiochimie et de Chimie Nucleaire Saint Remy les Chevreuses FranceSeptembre 27ndash29 2000
PhD Publications and Conference Presentations
1 Characterization of a Tri-n-butyl Phosphate-Nitric Acid Complex a CO2 -Soluble Extractant for Dissolution of Uranium Dioxide Enokida Y TomiokaO Lee S-C Rustenholtz A Wai C M Ind Eng Chem Res 200342(21) 5037ndash5041
2 Partition Coefficients and Equilibrium Constants of Crown Ethers between Wa-ter and Organic Solvents Determined by Proton Nuclear Magnetic ResonanceCheng H-W Rustenholtz A Porter R A Ye X R Wai C M J ChemEng Data 2004 49(3) 594ndash598
3 An FT-IR Study of Crown Ether-Water Complexation in Supercritical CO2Rustenholtz A Fulton J L Wai C M J Phys Chem A 2003 107(50)11239ndash11244
4 A F Rustenholtz An FT-IR Study of crown ether complexation with waterin liquid and supercritical CO2 Poster presented in the 225th ACS Nationalmeeting New Orleans March 23ndash27 2003
Appendix E
Abstract
Supercritical Fluid Extraction Spectroscopic Study of Inter-actions Comparison to Solvent Extraction
Supercritical fluid carbon dioxide (SF-CO2) was chosen to study Supercritical Fluid
Extraction (SFE) of cesium and uranium At first crown ethers were considered
as chelating agents for the SFE of cesium The role of water and its interaction
with crown ethers were especially studied using Fourier-Transform Infra-Red (FT-
IR) spectroscopy in SF-CO2 A sandwich configuration between two crown ethers
and a water molecule was observed in the SF-CO2 phase for the first time The equi-
librium between the single and the bridge configurations was defined The enthalpy of
the hydrogen bond formation was also calculated These results were then compared
to the one in different mixtures of chloroform and carbon tetrachloride using Nuclear
Magnetic Resonance (NMR) To conclude this first part and in order to understand
the whole picture of the recovery of cesium I studied the role of water in the equi-
librium between the cesium and the dicyclohexano18-crown-6
In a second part the supercritical fluid extraction of uranium was studied in SF-CO2
For this purpose different complexes of TriButyl Phosphate (TBP) nitric acid and
water were used as chelating and oxidizing agents I first used FT-IR to study the
TBP-water interaction in SF-CO2 These results were then compared to the one
obtained with NMR in chloroform NMR spectroscopy was also used to understand
the TBP-nitric acid-water interaction first alone and then in chloroform To conclude
182
my research work I succeeded to improve the efficiency of uranium extraction and
stripping into water for a pilot-plant where enriched uranium is extracted from incin-
erated waste coming from nuclear fuel fabrication TBP-nitric acid complexes were
used in SF-CO2 for the extraction of uranium from ash
Keywords Reprocessing ndash Nuclear waste ndash NMR ndash FT-IR ndash Extraction ndash SFE ndash
Supercritical fluids ndash Solvents ndash Water ndash Uranium ndash Cesium ndash Crown ethers ndash Carbon
dioxide ndash CO2 ndash TBP ndash TriButyl Phosphate ndash Nitric acid ndash Antisolvent effect ndash Uranyl
ndash Hydrogen bond
Appendix F
An FT-IR Study of CrownEther-Water Complexation inSupercritical CO2
[signalement bibliographique ajouteacute par ULP ndash SCD ndash Service des thegraveses eacutelectroniques]
Anne Rustenholtz John L Fulton and Chien M Wai
An FT-IR study of crown ether-water complexation in supercritical CO2
J Chem Phys A 107 11239-11244 (2003)
Pages 11239-11244
La publication preacutesenteacutee ici dans la thegravese est soumise agrave des droits deacutetenus par un eacutediteur
commercial
Pour les utilisateurs ULP il est possible de consulter cette publication sur le site de
leacutediteur
httppubsacsorgcgi-binarticlecgijpcafh2003107i50pdfjp035798ypdf
Il est eacutegalement possible de consulter la thegravese sous sa forme papier ou den faire une
demande via le service de precirct entre bibliothegraveques (PEB) aupregraves du Service Commun
de Documentation de lULP pebsciencesscd-ulpu-strasbgfr
Appendix G
Partition Coefficients andEquilibrium Constants of CrownEthers between Water and OrganicSolvents Determined by ProtonNuclear Magnetic Resonance
[signalement bibliographique ajouteacute par ULP ndash SCD ndash Service des thegraveses eacutelectroniques]
Han-Wen Cheng Anne Rustenholtz Richard A Porter Xiang R Ye and Chien M
Wai
Partition coefficients and equilibrium constants of crown ethers between water
and organic solvents determined by proton nuclear magnetic resonance
J Chem Eng Data 49 594-598 (2004)
Pages 594-598
La publication preacutesenteacutee ici dans la thegravese est soumise agrave des droits deacutetenus par un eacutediteur
commercial
Pour les utilisateurs ULP il est possible de consulter cette publication sur le site de
leacutediteur
httppubsacsorgcgi-binarticlecgijceaax200449i03pdfje034195cpdf
Il est eacutegalement possible de consulter la thegravese sous sa forme papier ou den faire une
demande via le service de precirct entre bibliothegraveques (PEB) aupregraves du Service Commun
de Documentation de lULP pebsciencesscd-ulpu-strasbgfr
Appendix H
Characterization of a Tri-n-butylPhosphate-Nitric Acid Complex aCO2-Soluble Extractant forDissolution of Uranium Dioxide
[signalement bibliographique ajouteacute par ULP ndash SCD ndash Service des thegraveses eacutelectroniques]
Youichi Enokida Osamu Tomioka Su-Chen Lee Anne Rustenholtz and Chien M
Wai
Characterization of a tri-n-butyl phosphate-nitric acid complex a CO2-soluble
extractant for dissolution of uranium dioxide
Ind Eng Chem Res 42 5037-5041 (2003)
Pages 5037-5041
La publication preacutesenteacutee ici dans la thegravese est soumise agrave des droits deacutetenus par un eacutediteur
commercial
Pour les utilisateurs ULP il est possible de consulter cette publication sur le site de
leacutediteur
httppubsacsorgcgi-binarticlecgiiecred200342i21pdfie030010jpdf
Il est eacutegalement possible de consulter la thegravese sous sa forme papier ou den faire une
demande via le service de precirct entre bibliothegraveques (PEB) aupregraves du Service Commun
de Documentation de lULP pebsciencesscd-ulpu-strasbgfr
REFERENCES 203
References
1 ldquohttpwwwinscanlgovpwrmapsmapworld mapphprdquo
2 ldquohttpsci2knetchernobylradiationhtmlrdquo
3 Benedict M Pigford T H Levi H W Nuclear Chemical Engineering 2nd
ed McGraw-Hill New York 1981 p 388
4 Roberts J D Nuclear Magnetic Resonance McGraw-Hill 1959 p 14
5 ldquohttpwwwsigmaaldrichcomrdquo
6 Wiebe R Chem Rev 1941 29 475ndash481
7 Charastil J J Phys Chem 1982 86 3016
8 Benedict M Pigford T H Levi H W Nuclear Chemical Engineering 2nd
ed McGraw-Hill New York 1981 p 565
9 ldquohttpwwwocrwmdoegovrdquo
10 Benedict M Pigford T H Levi H W Nuclear Chemical Engineering 2nd
ed McGraw-Hill New York 1981 p 458ndash459
11 Sailor W C Beard C A Venneri F Davidson J W Progress in Nuclear
Energy 1994 July 7
12 ldquohttpwwwpnlgovatwrdquo
13 Benedict M Pigford T H Levi H W Nuclear Chemical Engineering 2nd
ed McGraw-Hill New York 1981 p 467
14 Smart N G Carleson T Kast T Clifford A A Burford M D Wai C M
Talanta 1997 44 137
15 Lin Y Smart N G Wai C M Trends Anal Chem 1995 14 123
REFERENCES 204
16 Wai C M Lin Y Brauer R D Wang S Beckert W F Talanta 1993
40 1325
17 Laintz K E Wai C M Yonker C R Smith R D Anal Chem 1992 64
2875
18 Dietz M L Horwitz E P Rhoads S Bartsch R A Krzykawski J J
Solvent Extr Ion Exch 1996 14 1ndash12
19 Iwacho T Sadakane A Tei K Bul Chem Soc Japan 1978 51 629
20 Kolthoff I M Can J Chem 1981 59 1548ndash1551
21 Shamsipur M Popov A I J Phys Chem 1987 91 447
22 Kolthoff I M Chantooni M K J Chem Eng Data 1997 42 49
23 Talanova G G Elkarim N S A Jr V S T R E H Hwang H
Bartsch R A Rogers R D J Am Chem Soc 1999 121 11281
24 Mochizuki S Wada N Jr R L S Inomata H Anal Commun 1999 36
51ndash52
25 Wai C M Kulyako Y M Myasoedov B F Mendeleev Commun 1999
180ndash181
26 Meguro Y Sasaki T Yoshida Z Anal Chem 1998 70 774
27 Tomioka O Meguro Y Enokida Y Yoshida Z Yamamoto I J Nucl
Sci Technol 2001 38 1097ndash1102
28 Samsonov M D Wai C M Lee S-C Kulyako Y Smart N G Chem
Commun 2001 1868ndash1869
29 Enokida Y El-Fatah S A Wai C M Ind Eng Chem Res 2002 41
2282ndash2286
REFERENCES 205
30 Carrott M J Waller B E Smart N G Wai C M Chem Commun 1998
373ndash374
31 Carrott M J Wai C M Anal Chem 1998 70 2421ndash2425
32 de Jong F Reinhoudt D N Smit C J Tetrahedron Lett 1976 17 1371ndash
1374
33 Golovkova L P Telyatnik A I Bidzilya V A Theor Exp Chem (Eng
Transl) 1984 20 219ndash222 Teor Eksp Khim 1984 20 231-234
34 Wallen S L Schoenbachler L K Dawson E D Blatchford M A Anal
Chem 2000 72(17) 4230ndash4234
35 Rustenholtz A Fulton J L Wai C M J Phys Chem A 2003 107 11239ndash
11244
36 Bryan S A Willis R R Moyer B A J Phys Chem 1990 94 5230ndash5233
37 Fulton J L Yee G G Smith R D J Am Chem Soc 1991 113 8327
38 Gupta R B Combes J R Johnston K P J Phys Chem 1993 97 707
39 Yamamoto Iwai Y Nakajima T Arai Y J Phys Chem A 1999 103
3525
40 Xu Q Han B Yan H J Phys Chem A 1999 103 5240
41 Izatt R M Pawlak K Bradshaw J S Chem Rev 1991 91 1721ndash2085
42 Dietz M L Bond A H Hay B P Chiarizia R Huber V J Her-
linger A W Chem Commun 1999 13 1177ndash1178
43 Phelps C L Smart N G Wai C M J Chem Educ 1996 12 1163ndash1168
44 Steed J W Junk P J Chem Soc Dalton Trans 1999 13 2141ndash2146
REFERENCES 206
45 Horwitz E P Schulz W W Metal-Ion Separation and Preconcentration A
H Bond and M L Dietz and R D Rogers ACS Symp Ser 716 ed Chap 2
p 20ndash50
46 Yakshin V V Vilkova O M Russ J Inorg Chem (Eng Transl) 1998 43
1629ndash1632 Zh Neorg Khim 1998 43(10) 1753-1755
47 Muzet N Engler E Wipff G J Phys Chem B 1998 102 10772ndash10788
48 Barakat N Burgard M Asfari Z Vicens J Montavon G Duplatre G
Polyhedron 1998 17 3649ndash3656
49 Mei E Dye J L Popov A L J Am Chem Soc 19760 98 1619ndash1620
50 Mei E Popov A L Dye J L J Am Chem Soc 1977 99 6532ndash6536
51 Thury M N Bryan J C Lamare V Dozol J F Asfari Z Vicens J J
Chem Soc Dalton Trans 1997 22 4191ndash4202
52 de Namor A F D Yelarde F J S Casal A R Pugliese A Goitia M T
Montero M Lopez F F J Chem Soc Faraday Trans 1997 93 3955ndash3959
53 Rhangino G Romano S Lehn J M Wipff G J Am Chem Soc 1985
103 7873
54 Vayssiere P Wipff G Phys Chem Chem Phys 2003 5 127
55 Herzberg G Molecular spectra amp molecular structure Infrared and Raman Spec-
tra of polyatomic molecules Van Norstrand Reinhold LTD Company 1945 p
282
56 ldquohttpwebbooknistgovrdquo
57 OShea K E Kirmse K M Fox M A Johnston K P J Phys Chem
1991 95 7863
REFERENCES 207
58 Weast R C Ed Handbook of chemistry and physics CRC press Inc Boca
Raton Florida first student ed 1988 Endash44 and Endash52
59 Jackson K Bowman L E Fulton J L Anal Chem 1995 67(14) 2368ndash2372
60 Penninger J M L Supercritical fluid technology Elsevier Science Amsterdam
1985 p 191
61 Chen M J private communication on NMR experiments done in Argonne Na-
tional Laboratory 2001
62 Woelk K Rathke J W Klinger R J J magn reson A 1994 109 137ndash146
63 Baaden M Schurhammer R Wipff G J Phys Chem B 2002 106 434ndash441
64 Schurhammer R Wipff G New J Chem 2002 26 229ndash233
65 Weast R C Ed Handbook of chemistry and physics CRC press Inc Boca
Raton Florida first student ed 1988 C-428
66 Choi K Tedder D W Spectrochim acta A 1995 51 2301ndash2305
67 Meguro Y Iso S Takeishi H Yoshida Z Radiochim acta 1996 75 185
68 Tomioka O Meguro Y ISO S Yoshida Z Enokida Y Yamamoto I J
Nucl Sci Technol 2001 38 461ndash462
69 Shimada T Ogumo S Ishihara N Kosaka Y Mori Y J Nucl Sci
Technol 2002 3 757ndash760
Extraction en Milieu Supercritique
Etude Spectroscopic des Interactions ndash
Comparaison avec des Solvants Classiques
par
Anne RUSTENHOLTZ FARAWILA1
Sous la direction de
Dr Isabelle BILLARD KLEIN2 et Prof Chien M WAI3
Le dioxyde de carbone supercritique (SF-CO2) a ete choisi afin drsquoetudier lrsquoextraction enmilieu supercritique drsquoions metalliques tels que le cesium et lrsquouranium Un interet parti-culier a ete porte au role de lrsquoeau lors de ces extractions ainsi qursquoa son interaction avecdes agents chelateurs (AC) En premiere partie les ethers couronne ont ete choisis commeAC du cesium et leur interaction avec lrsquoeau a ete etudiee dans le SF-CO2 en utilisant laspectroscopie InfraRouge a Transformee de Fourier (IR-TF) Une configuration sandwichentre deux ethers couronne et une molecule drsquoeau a ete observee dans le SF-CO2 Pour lesconfigurations simple et pontee lrsquoequilibre a ete defini et lrsquoenthalpie de formation de la liai-son hydrogene a ete calculee Ces resultats ont ensuite ete compares a ceux obtenus dansdes melanges de CHCl3 et de CCl4 en utilisant la spectroscopie a Resonance MagnetiqueNucleaire (RMN) Pour conclure cette premiere partie le role de lrsquoeau a ete etudie lorsde lrsquoextraction du picrate de cesium par le DCH18C6 et les constantes drsquoequilibre ont etedetermineesDans une deuxieme partie lrsquoextraction de lrsquouranium a ete etudiee dans le SF-CO2 Descomplexes de Phosphate de TriButyle (TBP) drsquoeau et drsquoacide nitrique ont ete utilisescomme AC et oxydants LrsquoIR-TF a ete utilisee pour etudier lrsquointeraction entre le TBP etlrsquoeau dans le SF-CO2 Ces resultats ont ete compares a ceux trouves dans le CHCl3 enutilisant la RMN Cette meme spectroscopie a ete utilisee pour comprendre les inter-actions entre lrsquoacide nitrique le TBP et lrsquoeau seuls puis dissous dans du CHCl3 Laformation de microgouttelettes drsquoacide et drsquoeau dues a lrsquoeffet anti-solvant a ete observeeet quantifiee Pour conclure ce travail de these jrsquoai reussi a optimiser lrsquoextraction et larecuperation drsquouranium enrichi provenant de cendres drsquoincineration de dechets de fabri-cation de combustible nucleaire Un complexe de TBP drsquoeau et drsquoacide nitrique dissousdans du SF-CO2 a ete utilise a cette finMots clefs Retraitement ndash Dechets nucleaires ndash RMN ndash IR ndash Extraction ndash Fluides su-percritiques ndash CO2 ndash Dioxyde de carbone ndash Solvants ndash Acide nitrique ndash Uranium ndash Cesiumndash Eau ndash Ethers couronne ndash TBP ndash Uranyle ndash Liaison hydrogene ndash Effet anti-solvant
1Anne Farawilahotmailcom2IReS UMR7500 CNRSIN2P3 - ULP Chimie Nucleaire ndash Bat 35 ndash 23 rue de Loess ndash BP 28
ndash 67037 Strasbourg cedex 2 ndash France3University of Idaho ndash Department of Chemistry ndash Moscow ID 83844-2344 ndash USA

to Hobbi
Remerciements - Acknowledgment
I thank je remercie
bull Mes Parents pour leur aide et leur soutien tout au long de ma scolarite ainsique le reste de ma famille
bull My husband for his love and support I would not have finished this projecton time without him I also thank him for being my first and best proof-readerand for his help with LATEX and Gnuplot
bull Dr Isabelle Billard pour mrsquoavoir enseignee les bases du travail de recherchescientifique et pour mrsquoavoir mise en contact avec Professeur Chien M Wai etde ce fait permis drsquoaller aux Etats Unis Merci aussi pour ses conseils et lesdiscussions interessantes que nous avons partagees tant par email que de vivevoix
bull The University of Idaho and Professor Chien M Wai for his kindness hisencouragement and his help with his scientific knowledge and ideas as well ashis financial support all along my PhD research
bull Les membres du Jury Professeur Wipff avec lequel jrsquoai eu de tres interessantesconversations lors de mes passages en France et Dr Stephane Sarrade que jrsquoaieu le plaisir de rencontrer pour la premiere fois lors de ma soutenance Dr OlegEgorov for his great comments that helped me to improve this thesis and forhis friendship
bull Pacific Northwest National Laboratories and Mr John Fulton for his kindnessand for sharing his laboratory and his knowledge which were indispensable forthe FTIR experiments
bull AREVA and Mr Syd Koegler for allowing me to perform some practical re-search in one of Framatome-ANP laboratories in Richland Washington
bull Dr Alexander Blumenfeld for sharing his knowledge of RMN
bull Mr Thomas Eichenberg Dr Scott Franz Miss Virginia Sliman and Dr PeterHalverson for their editing help and their comments that helped me to improvethis thesis Dr Michel Billaux pour ses commentaires et ses corrections dans lapartie Fran caise
Remerciements - Acknowledgment 6
bull M Antony Jean-Mertens pour son amitie et pour mrsquoavoir ouvert lrsquoesprit surdrsquoautres mondes et mrsquoavoir fait decouvrir les Etats-Unis Mes autres amis alsa-ciens avec qui jrsquoai passe des moments inoubliables
bull Dr Mari Hannele Mannila for being my best ldquosac de sablerdquo during unforgettablemotorcycle trips in the wild North West of the United States I owe her mybiggest laughs and she is the best friend that someone should hope for Kitos
bull My Idahorsquos friends Abeer Hatem Mohammed et al for their friendship andthe good time that we spent together
bull Mme Beatrice Henrioulle pour srsquoetre occupee de sa poupouille afin que je puissefinir la redaction de cette these ainsi que pour sa bonne humeur generale sonamitie et ses encouragements
bull Enfin mon fils Mohamed Yousef III pour mrsquoavoir laissee un peu de temps pourecrire entre deux pleurs et deux gazouillis
Contents
Remerciements - Acknowledgment 5
Resume 19
Titre 19
Resume Court 19
Mots Clefs 20
Introduction 20
01 Interactions entre Ethers Couronne et Eau 21
011 En Milieu Supercritique 21
012 Dans des Solvants Classiques 24
013 Role de lrsquoeau dans lrsquoequilibre etabli lors de lrsquoextraction du cesium
par les ethers couronne 25
02 Interaction entre le TBP lrsquoEau et lrsquoAcide Nitrique 26
021 Interaction entre le TBP et lrsquoEau 26
022 Interaction entre le TBP lrsquoEau et lrsquoAcide Nitrique 28
023 Mise en Pratique Extraction de lrsquoUranium a lrsquoAide de Phos-
phate de Tributyle et drsquoAcide Nitrique 29
Conclusion 31
General Introduction 33
1 Crown Ether-Water Interaction 49
Introduction 49
CONTENTS 8
11 Crown Ether-Water Interaction In Supercritical CO2 53
Introduction 53
111 Experimental Work 58
112 Summary of the Results 61
113 Additional Description 62
Conclusion 66
12 Crown Ether-Water Interaction in Solvents 69
Introduction 69
121 Experimental Section 75
122 Summary of Results 77
123 Comparison to FT-IR Results in CO2 77
Conclusion 80
13 Introduction to Cesium Extraction Equilibrium Using Crown Ethers 84
Introduction 84
131 Experimental Work 86
132 Calculations 88
133 Results and Discussion 93
Conclusion 95
Conclusion 97
2 TriButyl PhosphatendashWaterndashNitric Acid Interaction 99
Introduction 99
21 Interaction of Tributyl Phosphate with Water 105
Introduction 105
211 Interaction of Tributyl Phosphate with Water in Supercritical
CO2 Analyzed by Fourier Transform Infra-Red Spectroscopy 105
212 Interaction of Tributyl Phosphate with Water in Solvent Ana-
lyzed by Nuclear Magnetic Resonance Spectroscopy 118
CONTENTS 9
Conclusion 129
22 Interactions with Nitric Acid Analyzed by Nuclear Magnetic Resonance 131
Introduction 131
221 Experimental Work 131
222 Results and Discussion 134
Conclusion 143
23 Practical Application Uranium Extraction
from Solid Matrices 144
Introduction 144
231 Experimental Work 145
232 Extraction of UO2 from Different Matrices 152
233 Stripping of the Uranium from TBP Media to Water 157
Conclusion 162
Conclusion 164
General Conclusions 167
A Mass Yield of the Fission Element 171
B Decay Series 173
C Acronyms 177
D Curriculum Vitae 179
Address 179
Academic History 179
Master Publications and Conference Presentations 180
PhD Publications and Conference Presentations 180
E Abstract 181
CONTENTS 10
F An FT-IR Study of Crown Ether-Water Complexation in Supercrit-
ical CO2 183
G Partition Coefficients and Equilibrium Constants of Crown Ethers
between Water and Organic Solvents Determined by Proton Nuclear
Magnetic Resonance 191
H Characterization of a Tri-n-butyl Phosphate-Nitric Acid Complex
a CO2-Soluble Extractant for Dissolution of Uranium Dioxide 197
List of Figures
1 Schema experimental de la spectroscopie infrarouge a transformee de
Fourier 22
2 Structure moleculaire des trois types de liaisons entre ethers couronne
et eau Conformations pontee (a) simple (b) et en sandwich (c) 23
3 Une des configurations possible pour les liaisons hydrogenes entre une
molecule de TBP drsquoacide nitrique et drsquoeau 29
4 Schema experimental pour lrsquoextraction drsquoUO2 30
5 World map of nuclear reactors from the International Nuclear Safety
Center (INSC) web page1 34
6 Gamma radiation map in the Chernobyl area results of the May 29
1986 Gamma Radiation Survey2 37
7 Phase diagram for CO2 the shaded areas are the subcritical and su-
percritical fluid regions 41
8 Mass (g) of elements (150 days after discharge from a PWR) per ton
(Mg) of uranium (freshly loaded in the reactor) versus the atomic num-
ber of the element3 43
9 Representation of a crown ether (18-crown-6) and the TBP and nitric
acid molecules 46
11 Molecular structure of 12-Crown-4 (a) 15-Crown-5 (b) 18-Crown-6
(c) 24-Crown-8 (d) 51
LIST OF FIGURES 12
12 Molecular structure of dicyclohexano-18-Crown-6 (a) and of dibenzo-
18-Crown-6 (b) 52
13 Fourier Transform Infra-Red (FT-IR) spectrometer 55
14 Fourier Transform Infra-Red (FT-IR) experimental setup 59
15 Molecular structure of the water-crown ether interaction in the bridge
form (a) the single configuration (b) and the sandwich form (c) 62
16 Molar fraction of crown ether bonded to water k versus density at
constant pressure (20 MPa) Lines are guides for the eyes and do not
have any theoretical or analytical value 65
17 Molar fraction of crown ether bonded to water k versus density at
constant temperature (40 C) Lines are guides for the eyes and do not
have any theoretical or analytical value 66
18 Dependence of ln K on 1000T at 20 MPa 67
19 Dependence of free water [D2O] on the equilibrium constant K 68
110 Potential energy of a nucleus with a spin state I=12 outside and inside
a magnetic field 71
111 Nuclear magnetic resonance experiment4 73
112 Acquisition sequence for a nuclear magnetic resonance experiment 74
113 P-NMR spectrum of the ethanal molecule (CH3CHO)5 81
114 coupling due to spin-spin interactions and relative intensities 82
115 Typical PNMR spectra of 18-crown-6 in the CDCl3 phase The con-
centrations of 18-crown-6 after equilibrium with water are 000 0002
0075 and 0153 molmiddotLminus1 (from top to bottom) and the water peaks are
at 1565 1874 2393 and 2668 ppm respectively 83
116 Molecular structure of dicyclohexano-18-Crown-6 (a) and of Cesium
picrate (b) 86
117 Typical PNMR spectrum for DCH18C6 (at 04 molmiddotLminus1) with water
and cesium picrate (at 30 mmolmiddotLminus1) in the CDCl3 phase) 87
LIST OF FIGURES 13
118 Typical PNMR spectrum for DCH18C6 (at 005 molmiddotLminus1) with water
and cesium picrate (at 8 mmolmiddotLminus1) in the CDCl3 phase) 88
119 Total cesium picrate concentration versus water concentration in the
organic phase for different initial ligand (L = DCH18C6) concentra-
tions (from 005 to 04 molmiddotLminus1) 93
120 Total water concentration versus total ligand concentration in the or-
ganic phase 94
21 One of the possible configurations of hydrogen bonds between a TBP
a nitric acid and a water molecule 101
22 Principal steps of the Purex process 104
23 FT-IR spectra of free and bonded D2O at different TBP concentrations
(0-016 molmiddotLminus1) and at one fixed D2O concentration (0054 molmiddotLminus1)
in supercritical CO2 (40 C 20 MPa) 107
24 Possible configurations of the hydrogen bond between a D2O and a
TBP molecule 107
25 Possible configurations of the hydrogen bond between a D2O and two
TBP molecules 108
26 Density effect on the equilibrium constant K at constant temperature
(N 40 C) and at constant pressure (H 20 MPa) 110
27 Molar fraction of TBP bonded to water k versus density at constant
temperature (N 40 C) and at constant pressure (H 20 MPa) 111
28 Concentration of free D2O versus temperature at 20 MPa 112
29 Free D2O concentration versus density for at constant temperature (N
40 C) and at constant pressure (H 20 MPa) 112
210 Dependence of ln K on 1000T (T in K) at 20 MPa 113
211 Dependence of the free water concentration [D2O] on the equilibrium
constant K 114
LIST OF FIGURES 14
212 linear regression of the molar solubility of water67 in CO2 versus the
temperature at constant pressure (20 (N) and 40 (H) MPa) 116
213 Volume of water droplets when 500microL of water saturated TBP is mixed
with CO2 in a 10 mL cell versus the temperature at constant pressure
(20 MPa) 117
214 300MHz 1H-NMR spectra of TBPmiddotH2O in CDCl3 119
215 Enlargement of a 500MHz 1H-NMR spectra of TBPmiddotHNO3middotH2O in
CDCl3 123
216 Possible configuration for the TBP hydrate 124
217 Chemical shift observed of water in CDCl3 and in TBP versus the
molecular fractions of free water (H) and of bonded water (N) The
dashed lines corresponds to their linear regression fits 125
218 Chemical shift observed (black points) and calculated (thin line) of
water in CDCl3 and in TBP versus total water concentration in the
organic phase 126
219 Chemical shift observed of CHCl3 in TBP and in CDCl3 versus the
TBP concentration in the organic phase 127
220 Total water ([H2O]0org) versus total TBP ([TBP]0org) in the organic
phase 128
221 Chemical shift of nitric acid observed from the droplets (H) and from
nitric acid solutions in water (N) and calculated (dashed line) using
equation (229) versus total nitric acid concentration 132
222 A typical proton NMR spectrum of TBPmiddot(HNO3)xmiddot(H2O)y with a benzene-
d6 insert The sample was prepared by mixing 10 mL of 155M
HNO3 with 40 mL of 98 TBP 133
223 Chemical shift observed of nitric acid and water in TBP versus the
mole ratio of nitric acid on TBP in the organic phase 136
LIST OF FIGURES 15
224 Number of moles of HNO3 in the TBP phase at equilibrium (or x)
versus the initial volume ratio of HNO3 (at 155 molmiddotLminus1 in water) on
TBP 138
225 Mole ratio of HNO3H2O in the TBP phase at equilibrium (or xy)
versus the initial volume ratio of HNO3 (at 155 molmiddotLminus1 in water) on
TBP 138
226 Proton NMR spectrum of TBPmiddot(HNO3)xmiddot(H2O)y in CDCl3 The com-
plex was prepared by mixing 4 mL of TBP and 1 mL of 155 molmiddotLminus1 HNO3
volume ratio of TBPmiddot(HNO3)xmiddot(H2O)y to CDCl3 = 11 139
227 Proton NMR spectrum of TBPmiddot(HNO3)xmiddot(H2O)y in CDCl3 The
complex was prepared by mixing 2 mL of TBP and 2 mL of 155
molmiddotLminus1 HNO3 volume ratio of TBPmiddot(HNO3)xmiddot(H2O)y to CDCl3 = 11 139
228 Chemical shift of the nitric acid and the water versus total water and
nitric acid concentration in the organic phase 141
229 Concentration of nitric acid in the aqueous phase versus initial TBP
concentration in the organic phase 142
230 Total water and nitric acid concentration in CDCl3 versus initial TBP
concentration 142
231 UO2 extraction experimental setup 147
232 Gamma spectra of the background and of uranyl ion enriched at 31
in 235U and at 87 gmiddotLminus1 of uranium in water and of the UO2+2 ion
(29 235U) at 24 gmiddotLminus1 in TBP 150
233 Calibration curves for UO2+2 ion in water (H 31 235U) and in TBP
(N 29 in 235U) 151
234 gamma spectra of the background and of the three kind of matrices
(R L and Y) used for extraction 154
235 gamma spectra of the background and of the uranyl ion (29 U) in
the TBP stripped solution at and in the aqueous solution 158
LIST OF FIGURES 16
236 Total mass of uranium stripped versus total volume of water used
The line is a guide for the eyes and does not have any theoretical or
analytical value 159
237 Partition of HNO3 between the organic and the aqueous phases at 50
C 20 MPa and with a TBPwater volume ratio of 119 160
238 Partition of uranium between the organic and the aqueous phases for
different initial nitric acid concentrations The experiment was per-
formed at 50 C 20 MPa and with a TBPwater volume ratio of 119
Lines are guides for the eyes and do not have any theoretical or ana-
lytical value 162
239 Lost of efficiency when the volume ratio is 11 between the two phases
(H) and when the temperature is 24 C (N) 163
List of Tables
1 Supercritical fluids critical values 42
11 Equilibrium parameters for water-crown-ether interaction in supercrit-
ical fluids 64
12 Values of I the quantum spin number for different nucleus 70
13 Comparison of the values of the equilibrium constants K1 and K2 and
of the molar fractions of ligand complexed to water k1 and k2 78
14 Comparison of water solubilities in solvents and in CO2 79
21 Equilibrium parameters for water-TBP interaction in supercritical CO2110
22 Antisolvent effect for a water saturated TBP mixed with CO2 at dif-
ferent densities 116
23 intensities and coupling constants of the TBP multiplets 122
24 Composition of TBPmiddot(HNO3)xmiddot(H2O)y complexes 137
25 Composition of the different matrices used for extraction determined
by mass spectroscopy 146
26 Optimal parameters for the supercritical CO2 extraction 157
27 Optimum uranium recovery efficiencies 157
28 Results of the stripping experiments at 50C 20 MPa and with a 119
TBP to water volume ratioa 161
A1 Mass (g) and radioactivity (Ci) of elements (150 days after discharge
from a PWR) per ton (Mg) of uranium (freshly loaded in the reactor)
for all elements 172
LIST OF TABLES 18
B1 Main decay energies for 238-Uranium 174
B2 Main decay energies for 235-Uranium 175
Resume
Titre
Extraction en Milieu Supercritique Etude Spectroscopique des Interactions ndash Com-
paraison avec des Solvants Classiques
Resume Court
Le dioxyde de carbone supercritique (SF-CO2) a ete choisi afin drsquoetudier lrsquoextraction
en milieu supercritique drsquoions metalliques tels que le cesium et lrsquouranium Un interet
particulier a ete porte au role de lrsquoeau lors de ces extractions ainsi qursquoa son interaction
avec des agents chelateurs (AC) En premiere partie les ethers couronne ont ete
choisis comme AC du cesium et leur interaction avec lrsquoeau a ete etudiee dans le
SF-CO2 en utilisant la spectroscopie InfraRouge a Transformee de Fourier (IR-TF)
Une configuration sandwich entre deux ethers couronne et une molecule drsquoeau a ete
observee dans le SF-CO2 Pour les configurations simple et pontee lrsquoequilibre a ete
defini et lrsquoenthalpie de formation de la liaison hydrogene a ete calculee Ces resultats
ont ensuite ete compares a ceux obtenus dans des melanges de CHCl3 et de CCl4 en
utilisant la spectroscopie a Resonance Magnetique Nucleaire (RMN) Pour conclure
cette premiere partie le role de lrsquoeau a ete etudie lors de lrsquoextraction du picrate de
cesium par le DCH18C6 et les constantes drsquoequilibre ont ete determinees
Dans une deuxieme partie lrsquoextraction de lrsquouranium a ete etudiee dans le SF-CO2
Des complexes de Phosphate de TriButyle (TBP) drsquoeau et drsquoacide nitrique ont ete
utilises comme AC et oxydants LrsquoIR-TF a ete utilisee pour etudier lrsquointeraction
LIST OF TABLES 20
entre le TBP et lrsquoeau dans le SF-CO2 Ces resultats ont ete compares a ceux trouves
dans le CHCl3 en utilisant la RMN Cette meme spectroscopie a ete utilisee pour
comprendre les interactions entre lrsquoacide nitrique le TBP et lrsquoeau seuls puis dissous
dans du CHCl3 La formation de microgouttelettes drsquoacide et drsquoeau dues a lrsquoeffet
anti-solvant a ete observee et quantifiee Pour conclure ce travail de these jrsquoai reussi
a optimiser lrsquoextraction et la recuperation drsquouranium enrichi provenant de cendres
drsquoincineration de dechets de fabrication de combustible nucleaire Un complexe de
TBP drsquoeau et drsquoacide nitrique dissous dans du SF-CO2 a ete utilise a cette fin
Mots Clefs
RMN ndash IR ndash Extraction ndash Fluides supercritiques ndash CO2 ndash Dioxyde de carbone ndash
Solvants ndash Acide nitrique ndash Uranium ndash Cesium ndash Eau ndash Ethers couronne ndash TBP ndash
Uranyle ndash Retraitement ndash Dechets nucleaires ndash Liaison hydrogene ndash Effet anti-solvant
Introduction
Mon travail de these est base sur lrsquoextraction de cations metalliques a lrsquoaide de diox-
ide de carbone supercritique Lrsquouranium et le cesium ont ete specialement choisis
pour leur abondance dans les dechets nucleaires drsquoorigines diverses Lrsquoeau fait partie
integrante de ces systemes et jrsquoai concentre une partie de mon travail de recherche
sur le role de lrsquoeau dans ces extractions Mais avant de discuter en details ce tra-
vail je vais decrire brievement les caracteristiques de lrsquoextraction a lrsquoaide de fluides
supercritiques
Les fluides supercritiques du fait de leurs proprietes uniques sont de plus en
plus utilises pour lrsquoextraction drsquoions metalliques provenant de materiaux liquides ou
solides Le fluide le plus souvent utilise dans ces procedes est le dioxyde de carbone
(CO2) Il a de nombreux avantages il est peu toxique bon marche et relativement
benin pour lrsquoenvironnement ses constantes critiques sont moderees (Tc = 310 C et
Pc = 738 MPa) et son pouvoir de solvatation peut etre modifie par simple changement
01 Interactions entre Ethers Couronne et Eau 21
de temperature etou de pression
Neanmoins le dioxyde de carbone est un solvant apolaire et necessite souvent
lrsquoadjonction drsquoagents chelateurs pour faciliter lrsquoextraction drsquoions metalliques Afin
drsquoameliorer qualitativement et quantitativement lrsquoextraction ces agents doivent avoir
des proprietes specifiques ils doivent etre solubles dans le CO2 et selectifs de lrsquoion
metallique que lrsquoon veut extraire Durant mon travail de these deux types drsquoagents
chelateurs ont ete etudies les ethers couronne et le phosphate de tributyle
01 Interactions entre Ethers Couronne et Eau
Les ethers couronne sont des macrocycles pouvant abriter au centre de leur cavite des
cations de differentes tailles Ils sont souvent utilises pour extraire des ions alcalins
tel que le lithium le potassium ou le cesium La taille de la cavite depend de lrsquoether
couronne utilise le rendant generalement specifique a un cation donne Les ethers
couronne sont relativement solubles dans le dioxyde de carbone et dans de nombreux
solvants Ils sont donc indiques en tant qursquoagents chelateurs dans le traitement de
dechets contenant des cations metalliques Ils peuvent etre utilises par exemple pour
le traitement de dechets nucleaires contenant du cesium 137 Ce traitement peut etre
realise a lrsquoaide de dioxyde de carbone supercritique
De tels dechets sont souvent extraits de matrices contenant de lrsquoeau Lrsquoeau fait
partie integrante du procede drsquoextraction Il est donc necessaire de connaıtre les
interactions entre lrsquoeau et les ethers couronne dans differents solvants
011 En Milieu Supercritique
Pour cette etude la spectroscopie infrarouge a transformee de Fourier (IR-TF) a ete
utilisee comme methode drsquoanalyse (Figure 1) Cette methode permet de distinguer
trois types de liaisons entre les ethers couronne (18-couronne-6 pour cette etude) et
lrsquoeau Le D2O a ete prefere a lrsquoH2O afin drsquoeviter la superposition des raies intenses
provenant du dioxyde de carbone entre 3500 cmminus1 et 3800 cmminus1 et celles de lrsquoeau
01 Interactions entre Ethers Couronne et Eau 22
Figure 1 Schema experimental de la spectroscopie infrarouge a transformee deFourier
Le premier type de configuration nrsquoest observe qursquoa haut rapport de concentra-
tion entre les ethers couronne et le D2O il srsquoagit drsquoun ldquosandwichrdquo compose de deux
molecules de 18-couronne-6 entourant une molecule drsquoeau (Figure 2 c) A faibles rap-
ports de concentrations une molecule drsquoeau peut etre liee a un seul ether couronne de
deux manieres differentes (Figure 2 a et b) Le premier type de configuration est dit
ponte et consiste en deux liaisons hydrogene entre le D2O et deux atomes drsquooxygene
provenant de la cavite de 18-couronne-6 Le deuxieme type de configuration est dit
simple le D2O forme une seule liaison hydrogene avec un atome drsquooxygene provenant
de la cavite de lrsquoether couronne
Les constantes drsquoequilibre de ces deux types de configurations ont ete calculees
et varient entre 16(4) et 9(2) Lmiddotmolminus1 pour la configuration simple et entre 10(3) et
5(2) Lmiddotmolminus1 pour la configuration pontee lorsque la densite du dioxyde de carbone
01 Interactions entre Ethers Couronne et Eau 23
Figure 2 Structure moleculaire des trois types de liaisons entre ethers couronne eteau Conformations pontee (a) simple (b) et en sandwich (c)
augmente de 850 a 960 gmiddotLminus1 La mesure des constantes drsquoequilibre a differentes
temperatures et a pression constante a permis de calculer lrsquoenthalpie de formation
des deux complexes consideres Elle vaut -12(2) kJmiddotmolminus1 pour le complexe simple
et -38(3) kJmiddotmolminus1 pour le complexe ponte Ces valeurs sont en accord avec celles
reportees pour des solvants classiques
Lrsquoequilibre entre la forme pontee et la forme simple est decrit comme suit
2 18C6 + 2 D2O 18C6middotD2Osimple + 18C6middotD2O
pontee (1)
A partir de cet equilibre la constante drsquoequilibre K est donnee par
K =[18C6middotD2O
simple][18C6middotD2Opontee]
[D2O]2[18C6]2= Ks middotKp (2)
avec
Ks =[18C6middotD2O
simple]
[D2O][18C6]et Kp =
[18C6middotD2Opontee]
[D2O][18C6](3)
Ceci mrsquoa permis de comparer ces resultats a ceux obtenus par la spectroscopie
RMN (Resonance Magnetique Nucleaire) cette derniere ne permettant pas de dis-
tinguer la forme pontee de la forme simple La constante drsquoequilibre K varie entre
34(4) et 300(30) L2middotmolminus2 lorsque la densite du CO2 augmente a pression constante
01 Interactions entre Ethers Couronne et Eau 24
(sim20 MPa) Dans les meme conditions la fraction molaire k drsquoether couronne liee a
lrsquoeau varie entre 33(3) et 54(5)
012 Dans des Solvants Classiques
Lrsquointeraction ethers couronneeau dans des melanges de chloroforme (CHCl3) et de
tetrachlorure de carbone (CCl4) a egalement ete etudiee afin de determiner lrsquoinfluence
du solvant sur cette interaction Pour cette etude la RMN a ete utilisee comme
methode drsquoanalyse
La RMN ne permet pas de distinguer les deux types de configurations possibles
(simple et pontee) entre un ether couronne et une molecule drsquoeau De ce fait les
differentes configurations ne peuvent pas etre precisees par cette methode Il faut
aussi noter que les concentrations choisies sont suffisamment faibles pour que la con-
figuration ldquosandwichrdquo entre deux molecules drsquoether couronne et une molecule drsquoeau
ne puisse pas etre observee Lrsquoequilibre est donc decrit par la formation drsquoun com-
plexe 11 entre une molecule drsquoeau et un ether couronne en rapide echange avec des
molecules non complexees drsquoeau et de ligand
La fraction molaire k drsquoether couronne complexe avec une molecule drsquoeau a ete
calculee pour differents ethers couronne Si k augmente avec la taille de la cavite de
15(1) pour 12-couronne-4 a 97(5) pour 18-couronne-6 lrsquoaddition de tetrachlorure
de carbone abaisse la valeur de k pour tous les ethers couronne en equilibre avec lrsquoeau
et la constante est proche de zero dans le CCl4 pur Au contraire le coefficient de
partage des ethers couronne entre la phase organique et la phase aqueuse augmente
exponentiellement avec le pourcentage de CCl4 dans cette phase
Cette etude montre que lrsquointeraction entre lrsquoeau et les ethers couronne depend
fortement de la nature du solvant utilise Il a ete demontre qursquoun solvant a faible con-
stante dielectrique comme le CCl4 nrsquoest pas favorable a la formation drsquoun complexe
entre lrsquoether couronne et lrsquoeau Ceci a aussi ete demontre pour le dioxyde de car-
bone a haute pression et temperature Lorsque la valeur de la constante dielectrique
01 Interactions entre Ethers Couronne et Eau 25
augmente en utilisant le CHCl3 comme solvant ou lorsque le CO2 est utilise a basse
pression et temperature les ethers couronne sont plus enclins a former un complexe
avec lrsquoeau Ces resultats sont importants car lrsquoeau joue un role primordial dans
lrsquoextraction drsquoions metalliques utilisant des ethers couronne comme extractant
013 Role de lrsquoeau dans lrsquoequilibre etabli lors de lrsquoextractiondu cesium par les ethers couronne
La RMN comme precedemment a ete utilisee en tant que methode drsquoanalyse pour
cette etude Lrsquointroduction de cesium (sous la forme de picrate de cesium) dans
lrsquoequilibre induit de nouvelles relations drsquoequilibre dans la phase organique Elle sont
decrites comme suit
CsP + L CsPL avec K1 =[CsPL]
[CsP][L](4)
CsPL + L CsPL2 avec K2 =[CsPL2]
[CsP][L](5)
L + H2O LmiddotH2O avec Ka =[LmiddotH2O]
[L][H2O](6)
CsPL + H2O CsPLmiddotH2O avec Kb =[CsPLmiddotH2O]
[CsPL][H2O](7)
CsPL2 + H2O CsPL2middotH2O avec Kc =[CsPL2middotH2O]
[CsPL2][H2O](8)
avec P pour picrate et L pour ligand (dicyclohexane18-couronne-6 ou DCH18-couronne-
6)
Les resultats de lrsquointeraction entre DCH18-couronne-6 et lrsquoeau sont similaires a
ceux trouves precedemment sans addition de cesium En effet la fraction molaire k
drsquoether couronne lie a lrsquoeau vaut 73(8) et la constante drsquoequilibre Ka vaut 38(13)
Lmiddotmolminus1 Il a egalement ete montre que la constante Kc est nulle Il nrsquoy a donc pas
de formation de sandwich entre deux ethers couronne un picrate de cesium et une
molecule drsquoeau La constante K2 est egale a 47(15) Lmiddotmolminus1 ce qui implique qursquoen
lrsquoabsence drsquoeau le sandwich entre deux ethers couronne et un picrate de cesium
02 Interaction entre le TBP lrsquoEau et lrsquoAcide Nitrique 26
est prefere au complexe simple ne comprenant qursquoun ether couronne et un picrate de
cesium Quant a la constante Kb elle vaut 27(7) Lmiddotmolminus1 ce qui indique une preference
pour le complexe hydrate CsPLmiddotH2O sur celui non hydrate Ces resultats montrent
lrsquoimportance de lrsquoeau dans lrsquoextraction drsquoions metalliques a lrsquoaide de polyethers macro-
cycliques
02 Interaction entre le TBP lrsquoEau et lrsquoAcide Ni-
trique
Le phosphate de tributyle (TBP) est employe depuis des annees dans le systeme
PUREX (Plutonium URanium EXtraction) pour extraire et separer lrsquouranium Le
CO2 peut remplacer avantageusement le dodecane ou le kerosene habituellement
utilises dans de tels procedes Ce solvant a en effet deux avantages sur les solvants
classiques il est beaucoup moins toxique pour lrsquoenvironnement et du fait de sa
supercriticalite il peut penetrer plus en profondeur des matrices solides comme des
cendres ou de la terre Lrsquoacide nitrique et le TBP forment un complexe relativement
soluble dans le CO2 et permettent drsquooxyder et drsquoextraire lrsquouranium
021 Interaction entre le TBP et lrsquoEau
En Milieu Supercritique
Une etude similaire a celle faite dans le cas des ethers couronne et de lrsquoeau a ete
conduite pour etudier lrsquointeraction entre le TBP et lrsquoeau dans le CO2
Comme pour le cas des ethers couronne a haute concentration en TBP la con-
figuration comprenant deux molecules de TBP liees a une seule molecule drsquoeau est
observee La partie quantitative de cette etude a ete realisee a faible concentration
en TBP dans ces conditions il y a formation drsquoun complexe 11 entre le TBP et
lrsquoeau en rapide echange avec du TBP et de lrsquoeau non lies Lrsquoenthalpie de formation
de ce complexe est egale a -9(2) kJmiddotmolminus1 alors que sa constante de formation varie
entre 12(3) et 9(2) Lmiddotmolminus1 lorsque la pression de CO2 augmente de 20 a 40 MPa a
02 Interaction entre le TBP lrsquoEau et lrsquoAcide Nitrique 27
constante temperature (40 C)
La fraction molaire k de TBP complexe avec une molecule drsquoeau varie entre 18(1)
et 22(1) avec lrsquoaugmentation de la densite du dioxyde de carbone En lrsquoabsence
de solvant la fraction molaire k est de 100 car une solution de TBP saturee en
eau a un rapport molaire de 11 Cette difference fait que lorsqursquoune solution de
TBP saturee en eau est dissoute dans un solvant il y a formation instantanee de
micro-gouttelettes drsquoeau Lors de cette formation un nuage est drsquoabord observe puis
les micelles srsquoagglomerent pour former de plus grosses gouttelettes qui finalement se
collent aux parois du recipient Ce phenomene existe aussi lorsque de lrsquoacide nitrique
est ajoute au melange TBP-eau Connaissant la solubilite de lrsquoeau dans le CO2 aux
conditions experimentales utilisees la quantite des micro-goutelettes a ete determinee
apres equilibre Lorsque 05 mL de TBP sature en eau (rapport molaire 11 entre le
TBP et lrsquoeau) est melange au CO2 dans une cellule de 10 mL la quantite de micro-
gouttelettes formees varie de 0 a 11(2) microL lorsque la temperature diminue de 70 a 25
C a pression constante (sim20 MPa)
Dans des Solvants Classiques
Une etude similaire a ete realisee en utilisant la RMN et en remplacant le dioxyde
de carbone par du chloroforme afin drsquoexplorer lrsquoeffet du solvant sur lrsquoequilibre Les
concentrations choisies sont telles que seul le complexe 11 entre le TBP et lrsquoeau est
observe Differentes quantites de TBP ont ete dissoutes dans du chloroforme Ces
solutions ont ensuite ete melangees avec le meme volume drsquoeau et apres equilibre la
phase organique a ete analysee par RMN
A partir des mesures du deplacement chimique de lrsquoeau dans le TBP et le CDCl3
les deplacements chimiques δ0 et δ1 de lrsquoeau dans du chloroforme pur et dans du TBP
pur ont ete calcules δ0 = 151(004) ppm et δ1 = 351(004) ppm Le deplacement
chimique du chloroforme en fonction de sa concentration dans le TBP a egalement
ete calcule
02 Interaction entre le TBP lrsquoEau et lrsquoAcide Nitrique 28
Lrsquoanalyse de ces donnees mrsquoa egalement permis de calculer la constante de for-
mation (K = 27(02) Lmiddotmolminus1) du complexe TBP-eau et la fraction molaire k de
TBP complexee avec une molecule drsquoeau (k = 15(1)) Cette valeur est inferieure
a celle trouvee pour le CO2 montrant qursquoil y a moins de complexes TBP-eau formes
dans le chloroforme que dans le CO2 La concentration de lrsquoeau libre crsquoest a dire
non complexee au TBP dans le chloroforme a egalement ete calculee ([H2O]org =
007(002) molmiddotLminus1) cette valeur correspond aux valeurs trouvees dans la litterature
Enfin la quantite de micro-gouttelettes a ete calculee Elle vaut 14(1) microL dans les
memes conditions que precedemment (lorsque le CO2 a ete utilise comme solvant)
Cette valeur est superieure de 3 microL a la valeur maximale trouvee pour le CO2 (11(1)
microL a 20 MPa et 25 C)
022 Interaction entre le TBP lrsquoEau et lrsquoAcide Nitrique
Le phosphate de tributyle forme des liaisons hydrogene avec lrsquoacide nitrique et lrsquoeau
donnant un complexe TBPmiddot(HNO3)xmiddot(H2O)y tres soluble dans le dioxyde de carbone
supercritique (Figure 3) Le nombre de molecules drsquoacide nitrique par molecule de
TBP x peut prendre des valeurs comprises entre 0 et 25 Drsquoun autre cote le nom-
bre de molecules drsquoeau par molecule de TBP y varie entre 04 et 08 Lorsqursquoun
tel complexe est dissous dans un solvant il y a formation instantanee de micro-
gouttelettes drsquoacide nitrique Ces gouttelettes ont ete detectees par RMN Il a ete
prouve que la concentration en acide des micro-gouttelettes augmente lorsque le nom-
bre de molecules drsquoacide par molecule drsquoeau xy dans le complexe de TBP augmente
La quantite et lrsquoacidite des micro-gouttelettes ainsi formees peut jouer un role impor-
tant dans la dissolution et lrsquooxydation de dioxyde drsquouranium lors de lrsquoextraction de
tels composes avec du dioxyde de carbone
02 Interaction entre le TBP lrsquoEau et lrsquoAcide Nitrique 29
Figure 3 Une des configurations possible pour les liaisons hydrogenes entre unemolecule de TBP drsquoacide nitrique et drsquoeau
023 Mise en Pratique Extraction de lrsquoUranium a lrsquoAidede Phosphate de Tributyle et drsquoAcide Nitrique
La societe AREVA (a Richland Etat de Washington USA) mrsquoa permis drsquoutiliser
la technique drsquoextraction supercritique afin de recuperer lrsquouranium enrichi contenu
dans differentes matrices Certaines de ces matrices sont des cendres venant de
lrsquoincineration de dechets secondaires a la fabrication du combustible nucleaire Ces
cendres contiennent de 5 a 10 drsquouranium enrichi a 2-3
Lrsquoextraction se deroule en deux etapes Premierement lrsquooxyde drsquouranium UO2
contenu dans la matrice est oxyde avec de lrsquoacide nitrique et le nitrate drsquouranyle
resultant est extrait avec du TBP et du CO2 Pour cette premiere etape un complexe
TBPmiddot(HNO3)xmiddot(H2O)y est dissous dans le dioxyde de carbone Deuxiemement lrsquoion
uranyle est recupere dans de lrsquoeau pour etre recycle Ces deux etapes sont presentees
en details sur la Figure 4
Les conditions optimales de lrsquoextraction sont les suivantes (i) le complexe utilise
est TBPmiddot(HNO3)18middot(H2O)04 (ii) la temperature et la pression drsquoextraction sont re-
02 Interaction entre le TBP lrsquoEau et lrsquoAcide Nitrique 30
Figure 4 Schema experimental pour lrsquoextraction drsquoUO2
spectivement de 60 C et de 20 MPa (iii) pour chaque gramme de cendre 2 mL du
complexe de TBP sont necessaires (iv) le temps de lrsquoextraction statique est drsquoune
heure et le debit est inferieur a 05 mLmin
Lrsquouranium a ete recupere de la phase organique de deux manieres Premierement
la phase organique avait une concentration en acide de 5 molmiddotLminus1 et lrsquouranium (a
535 gmiddotLminus1) a ete extrait avec de lrsquoeau a 50 C Seulement 15(1) de lrsquouranium a ete
recupere de cette maniere Deuxiemement lrsquouranium a ete recupere sous pression et
en ligne avec lrsquoextraction Les conditions optimum sont 20 MPa et 50 C avec
19 mL drsquoeau par mL de TBP Le rendement de la recuperation sous pression est
bien meilleur que celui de la recuperation a pression atmospherique Ce rendement
diminue lorsque la concentration en acide augmente ou lorsque la concentration en
uranium diminue Lorsque les conditions ont ete modifiees (temperature reduite a
24 C ou volume drsquoeau reduit a 1 mL par mL de TBP) une perte allant jusqursquoa
02 Interaction entre le TBP lrsquoEau et lrsquoAcide Nitrique 31
68 dans lrsquoefficacite de la recuperation de lrsquouranium a ete observee Cette perte est
moindre a basse concentration en acide nitrique
Conclusion
Durant ce travail de these deux types drsquoextractants drsquoions metalliques ont ete etudies
Les premiers appeles ethers couronne sont utilises pour extraire des cations alcalins
comme le cesium Leurs interactions avec lrsquoeau ont ete etudiees a lrsquoaide de deux
methodes drsquoanalyse differentes La premiere methode utilisee est la spectroscopie IR-
TF Cette methode manque de precision mais permet de distinguer les differentes
configurations possibles Lrsquoautre methode utilisee est la RMN Cette methode est plus
precise quantitativement mais ne permet pas de discerner les configurations simples
et pontees entre les ethers couronne et lrsquoeau Elle permet neanmoins drsquoetudier sans
interferences des systemes plus compliques tel que le systeme ether couronne eau
et picrate de cesium Il nrsquoa malheureusement pas ete possible de lrsquoutiliser dans les
fluides supercritiques lrsquoequipement a disposition ne le permettant pas
Lrsquoautre type drsquoextractant utilise est le TBP Cet extractant peut former un com-
plexe en se melangeant a lrsquoacide nitrique Ce complexe a ete caracterise et etudie
dans differents solvants Lorsqursquoil est dilue dans le dioxyde de carbone la formation
de micro-gouttelettes drsquoacide facilite lrsquooxydation de lrsquoUO2 et lrsquoextraction de lrsquoUO2+2
Il a ete prouve que ce principe peut etre utilise pour extraire lrsquouranium de milieux
tels que des cendres provenant de lrsquoincineration de dechets secondaires a la fabricaton
du combustible nucleaire De nombreux progres peuvent etre faits dans la mise en
application a grande echelle de ce procede ecologique drsquoextraction notamment en ce
qui concerne la recuperation de lrsquouranium
General Introduction
My thesis work is focused on the supercritical fluid extraction of uranium and cesium
These elements are present in nuclear waste such as nuclear manufacturing byprod-
ucts or Spent Nuclear Fuel (SNF) Uranium is the main element constituting the fuel
and Cesium-137 is an abundant fission product with a relatively long half-life that
contributes largely to the heat production in SNF The processing of uranium and
cesium is of particular importance for waste management
Water is often present in such waste and it plays an important role in the extrac-
tion process which I studied as part of this research I used different spectroscopic
methods for analyzing the relevant chemical interaction in supercritical fluids and in
solvents such as chloroform and carbon tetrachloride In this introduction I will first
describe the origins and the diversity of nuclear waste and current practical methods
of managing them as well as the futuristic waste management processes envisioned
by scientists I will then describe the industry standard reprocessing technique which
is solvent extraction Supercritical fluids especially carbon dioxide are good alterna-
tives to organic solvents in this process I will therefore describe their characteristics
Thereafter I will relate the special characteristics of uranium and cesium as well as
the chelating agents I used to extract them Last the spectroscopic techniques that
I used will be briefly described
Nuclear Wastes and Nuclear Waste Management
Nuclear byproducts and waste have been a serious issue from the dawn of the nuclear
age The first use of nuclear energy for military purposes during the world war II was
General Introduction 34
accompanied by the generation of large quantities of waste that continued to grow
during the arms race between the United States and the Soviet Union as well as other
countries with nuclear arms The peaceful applications of nuclear energy particularly
for generating electric power are also responsible for producing large quantities of
heavy metal and radioactive waste through different steps of the fuel cycle Hundreds
of nuclear power plants are operating today in many countries (Figure 5) There are
many other industrial applications of nuclear materials and they are used routinely
in hospitals for medical diagnosis and treatments
Figure 5 World map of nuclear reactors from the International Nuclear Safety Center(INSC) web page1
Nuclear waste management is not only a problem in the present but also will be
in the future Indeed the fuel industry declining the oil supply is going down and
developing countries like India and China have a huge demand for power which is a
basic need and is required for economic growth Furthermore to reverse the global
warming effect the emission of greenhouse gases from industry transportation and
power plants needs to be reduced The solution to this problem is electricity produced
from plants that do not generate greenhouse effect gases The electricity can be for
industrial use home use or public transportation Natural gas is cleaner than coal
General Introduction 35
because it does not produce as many particles and byproducts as coal or oil but 4 of
natural gas is lost during transport The contribution of methane to global warming
is 25 worse than that of CO2 which is also produced by these plants On the other
hand renewable energy (ie hydroelectric windpower solar etc) has now reached a
plateau There are not many large dams that can still be built on the worldrsquos rivers
wind-mills are expensive inefficient and consume too much space solar energy lacks
power and is expensive The only obvious way to overcome the energy crisis that is
building is to increase the number of nuclear power plants
For the same amount of energy produced one can find more uranium in the
filters and waste of a coal power plant than in a nuclear power plant Furthermore
the Industrial Accident Safety Rate (IASR) based on the number of accidents per
hour and per worker in American nuclear power plants is well below the IASR for
manufacturing industries and is at the same level as the IASR for banks or real estate
agencies For these reasons the approval rate for new nuclear power plants in general
opinion polls in America increased up to 60 recently This approval rate is even
greater in places where a nuclear power plant is already in place
The majority of nuclear waste is associated with the uranium fuel cycle The
front end of the fuel cycle the so called pre-fission stage which includes mining and
enrichment and fuel fabrication activities generates uranium-containing byproducts
and waste The back end of the fuel cycle the stage after the fuel is irradiated in
the reactors generates large quantities of radioactive waste products While these
fission products are intentionally generated in production reactors for the purpose of
processing to extract weapons grade plutonium they are considered waste products
when generated by power reactors Most of the nuclear waste generated today comes
from power plants and is stored without reprocessing particularly in the United
States European countries and Japan continue to make progress in reprocessing
which can reduce the volume of highly radioactive waste and allow the recycling of
useful isotopes Regardless of the sources of nuclear waste ndash power plants the legacy
General Introduction 36
of cold war nuclear weapons hospital waste food irradiation etc ndash improvements
in the technology of handling and reprocessing are necessary for the economics of the
respective application as well as for environmental protection These reprocessing
techniques are basically chemical in nature and this thesis is a contribution in this
direction
Nuclear waste can be divided into four categories depending on its toxicity8
(i) Low-Level Waste (LLW) The level of radioactivity and the half-life of the radioac-
tive isotopes in low-level waste are both relatively small and LLW does not require
shielding during handling and transport To reduce its volume it is often compacted
or incinerated before disposal Storing the waste for a period of 10 to 50 years will
allow most of the radioactive isotopes in low-level waste to decay at which point the
waste is not considered radioactive and can be disposed as normal waste This kind
of waste for example is generated by hospitals and industries
(ii) Intermediate-Level Waste (ILW) contains higher amounts of radioactivity and
some requires shielding This waste for example is made of contaminated materials
from the manufacture of nuclear fuel eg gloves shielding outfits plastic containers
papers etc In such cases the contaminated material can be incinerated to lower the
amount of waste and the resulting ash can be treated and then discarded as LLW
(iii) High-Level Waste (HLW) comes mostly from the core of nuclear reactors and
from nuclear weapons processing HLW contains fission products including uranium
and plutonium generated in the reactor core HLW is highly radioactive and some
isotopes have extremely long half-lives (some longer than 100000 years) Therefore
HLW will take a long time to return to safe levels of radioactivity
(iv) Transuranic Wastes have atomic numbers greater than uranium They come
mainly from weapons production and consist of clothing tools rags residues de-
bris and other such items contaminated with small amounts of radioactive elements
mostly plutonium Because of the long half-lives of these elements this waste is not
disposed of as either low-level or intermediate-level waste It does not have the very
General Introduction 37
high radioactivity of high-level waste nor its high heat generation
In addition to the problems arising from the management of accumulating waste
there is another concern the pollution generated by the Chernobyl incident which
quickly covered a large area (Figure 6) This disaster turned a localized problem into
a major environmental one Unless another solution is found the population in the
area affected by such pollution must wait for the intensity of radioactivity to decay
and disperse sufficiently in order to return and pursue farming However certain
places eg proximal to a source of drinking water will need real decontamination
efforts
Figure 6 Gamma radiation map in the Chernobyl area results of the May 29 1986Gamma Radiation Survey2
Different ways of disposing of nuclear waste have been under investigation and
trial8 First short-term storage can be used It decreases the radioactivity of HLW
up to 100 times in 10 years Unfortunately the decay of radioactive material is not
General Introduction 38
linear but exponential which limits the usefulness of passive storage Short-term
storage is a necessity for HLW because these materials cannot be shipped or handled
easily when they are just coming out of the core of a reactor It is important to
know that short-term storage is not a final option it only lowers the danger level
of the waste but does not eliminate it The waste will still need to be processed or
stored in another way afterward It is important to make sure that the storage area
is stable and well protected from accidents or natural disaster The spread of such
radioactive material in drinking water or on agricultural and hunting lands would be
a catastrophe
As a follow-up or as a second option long-term storage can be used for HLW
or ILW HLW and long-lived waste from ILW (from fuel reprocessing) are generally
buried deep underground whereas ILWrsquos short-lived waste (mainly from reactors) is
generally buried in shallow repositories Forgetting them underground until the dan-
ger is no longer present seems to be a good idea but it does not take into account the
fact that some waste has a very long half-life and nobody can assure that humanity
will remember it after several thousand years We are still discovering artifacts that
are less than five thousand years old for instance in Egypt Even the ancient Egyp-
tian language and alphabet were forgotten Will the archaeologist of the future dig
with a Geiger counter Besides the earth is moving all the time in an unpredictable
manner Nobody can assure that the waste will remain stable and not be dispersed
with underground water or seismic activity
The toxicity of the waste beyond its radioactivity is another aspect to consider
Indeed some of this waste contains plutonium one of the most toxic of all elements
Some people consider sending such waste into space but the cost would be enormous
and unethical
Nevertheless there is a way of minimizing the consequences of leaks or other
problems that might cause the waste to be scattered it is the vitrification process
before storage With this method radioactive waste is mixed with silica and melted
General Introduction 39
into glass beads This process should prevent radioactive elements from going into
the atmosphere or the groundwater even if they are in direct contact with it
In the United States the Nuclear Regulatory Commission (NRC) uses the funds
collected from nuclear power plant taxes to develop waste disposal programs There
is a long-term underground storage currently under development at Yucca Mountain
Nevada9
Another way to get rid of such waste is to process it10 One way of processing
nuclear waste is to transmute the unstable isotopes to stable ones in the same way
alchemists would transform or transmute lead into gold There have been some at-
tempts to use photons in the x-ray range in a high-powered electron linear accelerator
The use of a laser to remove neutrons from a radioactive isotope also has been inves-
tigated If the use of this technology were possible Cesium-137 could be transmuted
to Cesium-136 with a half-life of 131 days instead of 302 years Unfortunately this
seems to be only an alchemistrsquos dream A more realistic way to use transmutation is
to irradiate an isotope with neutrons in an accelerator to allow the isotope to absorb
a neutron With this process iodine-129 can be transmuted to stable xenon with
neutron absorption The Accelerator Transmutation of Waste (ATW) system is cur-
rently being developed at Los Alamos National Laboratory in New Mexico1112 The
downside of ATW is that long-lived radioisotopes should be isolated for them to be
transmuted without interferences and without transmuting good radioisotopes into
bad ones For example Uranium-238 which is the main constituent of Spent Nuclear
Fuel (SNF) can be transmuted into Plutonium-239 239Pu is not as manageable as
238U and has a half-life of 25 thousand years
Solvent Extraction
Solvent extraction has already been proven to be a good method to separate radioiso-
topes from SNF One of the most famous solvent extraction processes is the PUREX
(Plutonium Uranium Recovery by Extraction) process The principle of this pro-
General Introduction 40
cess is to separate uranium and plutonium from the fission products and from one
another First the pellets are prepared for the dissolution (ie decladded) Then
the SNF is dissolved in a solution of nitric acid in which the tetravalent uranium is
oxidized to uranium(VI) Second the uranium(VI) and plutonium(IV) nitrates are
extracted from the nitric acid solution with a mixture of kerosene and Tri-n-Butyl
Phosphate (TBP) (at 70 and 30 respectively) while the fission products remain in
the aqueous nitric phase13 The plutonium is then reduced to an oxidation state III
In the trivalent state the plutonium is insoluble in the organic phase and is therefore
easily stripped out with water Finally the remaining uranium nitrate is stripped
out of the organic solution with heated water Uranium(VI) and plutonium(III) can
also be purified and converted to uranium trioxide (UO3) and plutonium dioxide
(PuO2) Despite this solvent extraction has a big downside its secondary waste
production If the organic solvents used in a Purex-like process could be exchanged
for a volatile solvent that is harmless to the environment the functioning cost would
be reduced That is exactly what Supercritical Fluid Extraction (SFE) does by using
carbon dioxide
Supercritical Fluids
A fluid is called supercritical when both its temperature and pressure exceed their
critical values (Tc for the critical temperature and Pc for the critical pressure) See
Figure 7 A phase diagram for CO2 is shown in Figure 7 with a representation of
the supercritical and the subcritical region When a substance is at a pressure and
temperature that is near the supercritical area its state is called subcritical
Supercritical fluid density depends on pressure and temperature The density
generally increases with a pressure increase and decreases with a temperature increase
Near the critical point it is not unusual to observe inconsistency in density or other
physical properties The system can be greatly disturbed by a small difference in
temperature or pressure or by adding a substance or an impurity to the fluid It
General Introduction 41
Figure 7 Phase diagram for CO2 the shaded areas are the subcritical and supercrit-ical fluid regions
is then important to pursue quantitative measurements in the neighborhood of the
critical values
Different fluids such as water methanol ammonia etc can be in the supercritical
state see Table 1 Supercritical CO2 offers numerous advantages over the other fluids
it has moderate critical values and it is inert nontoxic nonflammable inexpensive
and widely available in purified form Furthermore it is a gas at normal temperature
and pressure allowing an easy recovery of the extracted species without generation
of secondary wastes that are very hard to discard or reprocess
The solubility of a substance in Supercritical CO2 is related to its density and
temperature Solubility increases with an increase in density at constant temperature
and decreases with increasing temperature at constant pressure714 With regard to
the above factors we can see that supercritical CO2 is more economic in the long
run Besides the fact that supercritical CO2 requires less energy to reach its critical
parameters its density can be easily raised to improve solubility
General Introduction 42
Table 1 Supercritical fluids critical values
Name Symbol Tc Pc ρac
(C) (MPa) (gmiddotLminus1)
Methanol CH3-OH 240 plusmn 1 81 plusmn 01 273Methane CH4 -826 plusmn 03 461 plusmn 003 162Carbon dioxide CO2 3103 plusmn 004 7380 plusmn 0015 467Ammonia NH3 1323 plusmn 001 11300 plusmn 0005 225Water H2O 374 plusmn 2 22064 plusmn 0005 322Nitrogen N2 -2730248 plusmn 00005 12619 plusmn 0001 952
Source The National Institute of Standards and Technology (NIST) Chemistry Web-Book httpwebbooknistgova uncertainty on densities le 2 (gmiddotLminus1)
CO2 is the most widely used substance for supercritical fluid applications For
many years it has been used on a large scale to remove caffeine from coffee and
tea CO2 is also used to extract other lipophylic substances such as nicotine The
extraction of metallic ions is more challenging because they are generally insoluble in
CO2 To circumvent this problem neutral chelating agents are chosen15ndash17 and I will
describe in details their action later in this general introduction
During my thesis work I studied supercritical fluid extraction (SFE) directly or
indirectly with the use of organic solvents such as chloroform or carbon tetrachloride
I focused on the extraction of two elements present in nuclear waste and nuclear
contamination sites The first one cesium-137 is a man-made isotope produced by
the fission of uranium-235 Its half-life is 3017 years Cesium-137 is present in a
radio-contaminated environment such as the Chernobyl area but it is more of an
issue in nuclear power plant waste The second uranium is the main isotope present
in Spent Nuclear Fuel (SNF) and is also found in nuclear weapons and in ILW
Cesium and Uranium Elements
Cesium-137 is a relatively long-lived isotope with a large contribution to the heat
production in SNF As shown on Figure 8 and appendix A cesium is one of the
General Introduction 43
most abundant fission products in SNF from Pressurized Water Reactors (PWR) 150
days after its discharge The amount of cesium produced per ton of uranium in the
fresh fuel load is even greater in Liquid Metal Fast Breeder Reactors (LMFBR) such
as Super-Phenix in France Recovering the cesium from waste is a very interesting
project because it lowers the radioactivity of the matrices from where it is extracted
allowing the remaining material to be more easily handled and discarded After
separation from the waste 137Cs is a good candidate for long-term storage because
of its moderate half-life Cesium-137 can also be recycled and used for radiotherapy
for example
Cesium-137 is also a concern in cesium-contaminated areas such as the Chernobyl
area It is accumulated in the human body mimicking potassium which disturbs the
transmission of nerve messages Extracting cesium from cesium-contaminated areas
along with other isotope cleaning can effectively reduce the waiting period (sim300
years for 137Cs) required to return the land to the people
01
1
10
100
1000
10000
30 35 40 45 50 55 60 65 70
Mas
s yi
eld
of th
e fis
sion
ele
men
t (g
Mg)
Atomic number
Cs
Figure 8 Mass (g) of elements (150 days after discharge from a PWR) per ton (Mg)of uranium (freshly loaded in the reactor) versus the atomic number of the element3
General Introduction 44
The other element in which I was interested is uranium The uranium in nuclear
waste generally contains a higher uranium-235 isotope fraction than it does in natural
form which makes it attractive to recover and recycle for use as fuel in power reactors
This recycling strategy would reduce the energy needed and reduce the pollution
generated to enrich uranium Recycling uranium from waste is particularly relevant
considering that the natural abundance of the uranium-235 isotope is only 072
while recovered uranium (from fuel manufacturing waste for example) contains up to
sim4 235U
Chelating Agents
Because supercritical CO2 is a nonpolar solvent there is a weak solute-solvent in-
teraction in the Supercritical Fluid Extraction (SFE) of metal ions Consequently
supercritical CO2 needs the presence of a chelating agent14ndash17 also called ligand to
enhance its ability to extract metal ions and their counter ions into a hydrophilic
liquid
The role of a chelating agent is to bind with the metal ion to form a metal chelate
that is soluble in CO2 Furthermore a good chelating agent needs to have the fol-
lowing properties it has to be soluble in CO2 selective for the species that needs to
be extracted and relatively harmless for the environment or easily recyclable
Metal chelates can be formed in CO2 using two methods First the chelating agent
is dissolved in CO2 which is then directed into the sample containing the metal ions
In the second method the ligand is introduced into the sample before the SFE is
initiated
Most matrices from which metal ions are extracted contain water During the
extraction chelating agents change the hydration sphere of the ions Some water
can be solubilized in the organic phase with or without the help of the chelating
agent Consequently the presence of water has a great effect on the efficiency of the
extraction1618 Therefore the understanding of the water interaction with ligands
General Introduction 45
and metal ions has a significant impact on the understanding of the thermodynamics
of the extraction The understanding of these interactions might lead to the discovery
of new ways to enhance the extraction efficiency
Crown ethers have been intensively studied for their selectivity in the solvent ex-
traction of cations and especially alkaline-earth-metal cations18ndash23 See Figure 9 for
a representation of 18-crown-6 Furthermore crown ethers have relatively high sol-
ubility in sub- and supercritical CO214 These properties make crown ethers highly
attractive for Supercritical Fluid Extraction (SFE) of cesium A study24 used crown
ethers to extract sodium and potassium cations in supercritical CO2 with perfluoro-
carboxylic acid as a counter ion Another study performed by Wai et al25 showed a
successful extraction of cesium with crown ethers and fluorinated compounds Nev-
ertheless the role of water and the interactions involved in the chelating process
were not detailed in these publications I paid special attention to these important
properties in my work
On the other hand the TBP-nitric acid efficiency in the Purex process has been
proven13 See Figure 9 for the representation of TBP and nitric acid respectively
TBP is highly soluble in supercritical CO21426 and forms an adduct with nitric acid
This adduct can be used to dissolve uranium oxides27ndash29 The resulting metal chelate
2TBPmiddotUO2(NO3)2middot2H2O is known to have very high solubility in CO23031 Conse-
quently TBP-nitric acid adducts were chosen as chelating agents for the extraction
of uranium
Spectroscopic Methods Used
For this research work two experimental devices were used Proton Nuclear Magnetic
Resonance (NMR) and Fourier Transform Infra-Red spectroscopy (FT-IR) NMR is
a precise analytical tool for the quantitative understanding of water interactions in
organic solvents3233 The crown ether-water interactions with and without cesium
picrate and the TBP-nitric acid-water interactions in solvents were determined using
General Introduction 46
Figure 9 Representation of a crown ether (18-crown-6) and the TBP and nitric acidmolecules
this analytical technique Unfortunately I was unable to use it with supercritical
fluids in spite of numerous attempts I tried to use capillaries but they were not
suitable for my system where many compounds were dissolved in CO2 I also tried to
use a PEEK (TM)1 polymer high-pressure cell34 in collaboration with C Yonker (Pa-
cific Northwest National Laboratory Richland Washington) but the results obtained
were random and not reproducible The reasons for this failure might be the inability
to have a lock on the NMR spectroscope or a consistent standard for concentration
determination
I was not able to use the NMR for quantitative measurement in supercritical
fluids with the materials that I tried Nevertheless as an alternative technique I
used FT-IR spectroscopy with the help of John Fulton and his lab equipment35 in
the Fundamental Science Directorate of the Pacific Northwest National Laboratory in
Richland Washington FT-IR is not as accurate as NMR and the overlapping of rays
from different species can be a problem However if the system is kept simple with
a limited number of compounds it can be used for quantitative measurements with
1Manufactured by Victrex plc
General Introduction 47
an acceptable accuracy Indeed it has been used successfully in the past few years
to study hydrogen bonding in supercritical CO236ndash40 I used FT-IR successfully to
understand crown ether-water and TBP-water interactions in super- and subcritical
CO2 Furthermore I was able to distinguish different crown ether-water configura-
tions where the NMR was showing only an average of all configurations
Finally I used gamma spectroscopy to monitor the enhancement of the uranium
extraction from ash with supercritical CO2 This gamma spectroscopy technique
lacks accuracy but gives fast and inexpensive approximate measurements of uranium
which is used to estimate the extraction efficiency Key samples were analyzed by
Inductively Coupled Plasma Mass Spectroscopy (ICP-MS) for higher accuracy
Overview of the Thesis Structure
My thesis is divided into two chapters The first one focuses on cesium extraction
with crown ethers and the second one on uranium extraction with a TBPnitric acid
complex
In the first chapter I describe the crown-ether water interaction because the water
plays an important role in solvent extraction To pursue this goal I first used the
FT-IR spectroscopy in supercritical CO2 and then the NMR technique in organic
solvents for comparison To finalize this part of my research I show the results of the
addition of cesium picrate to the system in order to understand the whole picture of
the recovery of cesium
In the second chapter I describe the antisolvent effect of the TBP-water and
the TBP-water-nitric acid systems in supercritical CO2 and in solvents using FT-IR
and NMR To conclude this part I demonstrate the efficiency of supercritical fluid
extraction for a pilot plant where the uranium is extracted from the incineration ash
of the byproduct of the nuclear fuel production For this work I used the TBP-nitric
acid solutions described in supercritical CO2 Lastly I will summarize the conclusions
of this research thesis
Chapter 1
Crown Ether-Water Interaction
Introduction
The scope of work presented in this chapter covers the various mechanisms of the
cesium extraction in supercritical fluids and solvents using crown ethers as ligands
Special attention is focused on the role of water The interaction in sub- and super-
critical CO2 were studied in detail This was complemented and compared with a
parallel study using solvents specifically chloroform and carbon tetrachloride mix-
tures Different spectroscopic tools Fourier Transformed Infra-Red (FT-IR) and Nu-
clear Magnetic Resonance (NMR) were used for the analysis thus yielding detailed
information about the molecule structure and the interaction equilibria as these tech-
niques complement each other To conclude the work of this chapter the role of water
was studied in the cesium extraction equilibrium using crown ethers
I will first describe the crown ethers properties Crown ethers are macrocycles
formed of a succession of ether molecules (-H2C-O-CH2- named methoxymethane or
methyl methyl ether) bonded together through the carbon atoms to form a ring The
carbon atoms are positioned outside of the ring whereas the oxygen atoms are inside
the cavity and therefore form a powerful attractor for positively charged atoms or
molecules Furthermore the number of ether molecules forming the ring determines
the size of the internal cavity and is therefore very selective of the cation extracted
Representations of different crown ethers are shown in Figure 11 When unsub-
50
stituted their nomenclature depend on the number of chemical bonds and oxygen
atoms in their cycle For example a macrocycle composed of 12 chemical bonds and
4 oxygen atoms is called 12-crown-4 or 12C4 and a macrocycle composed of 18 bonds
and 6 oxygen atoms is called 18-crown-6 or 18C6 Unsubstituted crown ethers can
be in various conformations The most represented conformation for 18-crown-6 is
D3d (Figure 11) but other conformations are possible where the crown is more or
less closed on itself like a jaw Different substitutes can take the place of the hydro-
gen atoms outside the ring Some substitutes such as the cyclohexane or benzene
molecules are very commonly used and are represented in Figure 12 When these
substitutes are used with 18-crown-6 they force the crown ether to be in a ldquoplanerdquo
or D3d conformation
Solvent extraction technique is commonly applied for the removal of metal or-
ganic molecules or ions from soil or aqueous solutions using many acidic anionic
or neutral extractants41ndash46 Crown ethers have been intensively used as extractants
for their selectivity and efficiency to extract cations and especially alkaline-earth-
metallic cations from aqueous solutions making them ideal for the extraction of
cesium414748 Furthermore crown ethers are soluble in a large variety of solvents
like carbon tetrachloride chloroform or supercritical carbon dioxide making them
suitable for environmentally friendly processes using supercritical CO2
In such extractions the organic or the CO2 phase contains often water and its
interaction in the solvent needs to be taken in account especially since Dietz et al18
showed that the efficiency of a solvent extraction depends on the solubility of water
in the organic phase
Most published research on solvent extraction do not discuss the role of water
in sufficient detail183649ndash53 For example Dietz et al18 studied the extraction of
cesium from acidic nitrate media using crown ethers as extractant in various organic
solvents An increase in the efficiency of the extraction was observed when the water
solubility in the organic phase increased The enhanced extraction efficiency was
51
Figure 11 Molecular structure of 12-Crown-4 (a) 15-Crown-5 (b) 18-Crown-6 (c)24-Crown-8 (d)
partly attributed to the water-saturated organic phase Another study52 states that
the role of the water must be taken into account in the description of the equilibria of
the extraction from water since the organic phase is water saturated Some molecular
dynamics studies54 showed that the water is mainly bridge-bonded to the crown ether
in a D3d conformation In addition Moyer et al36 used FT-IR to describe the general
equilibrium between water and 18-crown-6 in carbon tetrachloride This study neither
discusses the effect of the solvent nor describes the ligand partition between the two
phases Moreover no published work described the water-crown ether interaction in
supercritical fluids
It was therefore important as a first step in this work to analyze the crown ether-
52
Figure 12 Molecular structure of dicyclohexano-18-Crown-6 (a) and of dibenzo-18-Crown-6 (b)
water interaction in supercritical and liquid CO2 Thereafter I used Nuclear Magnetic
Resonance (NMR) to study the role of the solvent in this interaction Solvents such
as chloroform and carbon tetrachloride were used I finally worked on constructing a
more complete picture of the cesium extraction by introducing some cesium picrate
to the water-crown ether equilibrium
11 Crown Ether-Water Interaction In Supercriti-
cal CO2
Introduction
The purpose of this section is to provide in-depth understanding of the interaction
between water and crown ethers in supercritical fluids The description of this inter-
action is important to give an insight into cesium extraction using crown ethers This
interaction was studied in supercritical CO2 using the Fourier Transform Infra-Red
(FT-IR) spectroscopy I will therefore describe this analytical tool in more details
because of the impact on the specific adaptations necessary for my experiments
The FT-IR spectroscopy is the spectroscopic technique most widely used to ana-
lyze molecular structures It is a fast and sensitive method for most chemical systems
Furthermore it is an economically attractive device that is easy to use Essentially
FT-IR is used for the understanding of the chemical bonds Chemical bonds have
frequencies of vibration that are mostly in the infra-red domain These frequencies
depend on the nature and on the environment of chemical bonds Thus if a molecule
is irradiated with a range of waves within the infra-red region it will absorb all the
waves that have the same frequency as the frequency of vibration of the bonds of
the molecule Therefore the absorption spectra can be represented by the plot of the
intensity of the transmitted beam versus the frequency of vibration The analysis of
such spectra can give the molecular structure of the molecule irradiated At a fun-
damental level the vibration between two atoms can be explained with the classical
mechanics model of the harmonic oscillator composed of two masses attached to the
opposite ends of a spring According to this model the frequency of the oscillations
(ω) in rads is obtained from
ω =radic
ks micro (11)
where ks is a constant related to the strength of the chemical bond analogous to the
spring constant which is the ratio between the spring force and the displacement The
11 Crown Ether-Water Interaction In Supercritical CO2 54
reduced mass micro is defined as
micro =m1m2
m1 + m2
(12)
where m1 and m2 are the masses of the atoms 1 and 2 respectively The frequency of
oscillation ω in rads is related to the frequency (ν) in Hertz according to
ω = 2πν (13)
and to the wavenumber (ν) in cmminus1 is obtained from
ν =ν
100 c(14)
where c is the speed of light in ms Combining the above equations the wave number
is
ν =
radicks
200πc
radicm1 + m2
m1m2
(15)
which demonstrates that the wave number (proportional to the frequency of vibration)
clearly depends on the mass of the atoms ie the isotopes used
Utilizing the previous equations the OndashH bond in the water molecule can be
approximated as a diatomic molecule Thus a significant shift in wave number should
be expected by using deutered water instead of normal water This is confirmed by
the following calculations where the constant ks for the OndashD and the OndashH bond
was assumed to be the same as an approximation The two frequencies are related
according to
νO-D = νO-H
radicmicroO-H
microO-D
= νO-H
radic16times 1
16 + 1
16times 2
16 + 2= 073times νO-Hmiddot (16)
This approximation is very good given that the symmetric stretching vibration wave
numbers for OndashH and OndashD are known to be 3652 and 2666 cmminus1 respectively55 the
ratio of the measured frequencies is 26663652 = 073 confirming the accuracy of
equation 16 In the work presented in this section I used this property to avoid the
overlapping of intense CO2 absorption bands between 3500 and 3800 cmminus1 with water
bands by using D2O instead of H2O
11 Crown Ether-Water Interaction In Supercritical CO2 55
Most of the IR spectrometers are Fourier transformed Their principle of operation
is described here with reference to Figure 13 A laser source of infra-red radiation
is used to generate the main beam This beam travels from the source to a half-
transparent mirror (beam-splitter) positioned at 135 degrees which splits the beam
in two The first beam (11) is reflected at 90 degrees and hit a mirror that is fixed
and perpendicular to the beam The second beam (22) is transmitted and bounces
off a mirror that is perpendicular to the beam This mirror can be moved to change
the length of the optical path Both beams return to the beam-splitter where half of
all the photons travel toward the source and are lost and the other half are reflected
(2) or transmitted (1) to the sample with a phase difference due to their different
path-lengths The combined beam transmitted through the sample finally arrives at
a detector placed at the other side of the test sample and the resulting signal will be
analyzed
Figure 13 Fourier Transform Infra-Red (FT-IR) spectrometer
11 Crown Ether-Water Interaction In Supercritical CO2 56
Due to the difference in optical path (δ) the two beams with two different phases
will go through the sample It will therefore produce some interferences that are either
constructive or destructive resulting in intensity changes depending on the value of
δ As a result the graph of the intensity as function of δ can be plotted To obtain
the spectrum which is a plot of intensity versus frequency a mathematical tool is
needed This tool is called the Fourier transformation and it is generally done by a
computer connected to the spectrometer
The resulting spectrum is composed of peaks of varying width As explained
before the position of those peaks depends on the bond energy and therefore depends
on the nature of the bond and on its chemical environment On the other hand at
relatively low concentration the intensity (I) of a peak at a given wave number can
be used to calculate the concentration of the molecule responsible for the peak using
the Beer Lambert law
I = I0eminusε l C (17)
where I0 is the initial intensity (before the sample) l is the light path-length in
the sample C is the concentration of the molecule responsible for the signal and ε
is the wavelength dependent molar absorptivity coefficient The coefficient ε needs
to be calculated from the spectra of the molecule at known concentrations Gener-
ally the computer connected to the spectrometer transforms the intensities values in
absorbance (A) which is defined from
A = minus lnI
I0
(18)
The absorbance is therefore directly proportional to the concentration C and ac-
cording to the Beer-Lambert law
A = ε l Cmiddot (19)
To minimize the interference of the background noise and thus improve accuracy
one can sum up the absorbances for the entire width of the peak In such case the
11 Crown Ether-Water Interaction In Supercritical CO2 57
Beer-Lambert law would be written asint ν2
ν1
A dν =
int ν2
ν1
ε l C dν = l C
int ν2
ν1
ε dν (110)
where ν1 and ν2 are the wavenumbers for which the peak begins and ends
This spectroscopic technique can be used in supercritical fluids and it has been
used successfully in the past few years to study hydrogen bonding in CO237ndash40 I
used FT-IR to understand crown ether-water and TBP-water interactions in super-
and subcritical CO2 Because FT-IR actually measures the bond energy between
atoms and molecules it provides structural information and good understanding of
how the species are bonded in a solution Furthermore there are vast databases
of spectra available which is helpful for the recognition of most of the bonds in very
different molecules The main problem with FT-IR is its low accuracy for quantitative
measurements The spectral peaks are generally broad and the determination of the
intensities generally lacks precision FT-IR can be easily overloaded with a system
that contains too many different species causing the overlapping of peaks In such
cases the intensity and therefore the concentration determination will be even less
accurate Nevertheless with a system kept as simple as possible and with the use of
innovative techniques to avoid overlapping as I did with substituting deuterium for
hydrogen FT-IR can be used effectively for quantitative analysis Moreover with the
use of a specially designed high pressure cell it can be easily used for measurement
in supercritical fluids
In this section I will present the experimental setup and a summary of the results
that are detailed in the paper ldquoAn FT-IR study of crown ether-water complexation in
supercritical CO2rdquo which I published with other colleagues This paper is reproduced
here as appendix F Generalization and more details beyond the published work will
be presented
11 Crown Ether-Water Interaction In Supercritical CO2 58
111 Experimental Work
Chemicals
D2O (100 D 9996 pure) 18-Crown-6 (995 pure) dicyclohexano-18-crown-6
(98 pure) methanol-d (995+ atom D) and carbon tetrachloride (999 pure)
were purchased from Aldrich Chemicals Company and used without further purifi-
cation Carbon dioxide was obtained as Supercritical Fluid Chromatography (SFC)
grade (purity ge 9999) from Scott Specialty Gases Inc
Experimental Setup
The experimental setup is shown in Figure (14) It consists of a syringe pump
(ISCO model 100DX) that pressurizes regulates and delivers CO2 to a specially
designed high pressure cell A detailed description of the high pressure cell will
be presented later The pressure is measured with an electronic transducer (Precise
Sensor Inc model D451-10) with a plusmn 01 MPa accuracy To avoid any incident caused
by over pressurization a rupture disc was installed on the line between the cell and
the syringe pump The cell is heated with four electric cartridge heaters and the
temperature is monitored by a controller (Watlow company) with a plusmn 1 C accuracy
For safety reasons the controller was set up to shut down the heater if the temperature
exceeds 80 C The different solutions inside the cell were analyzed using a Bruker
IFS 66V FT-IR spectrometer with a Mercury-Cadmium-Telluride (MCT) detector
(Kolmar Technologies) A 5 min acquisition time and an 80 kHz scanner velocity
for a 4 cmminus1 wavenumber resolution were used to optimize the spectrum quality and
signal-to-noise ratio Spectrum analysis and corrections including curve fitting and
spectrum subtraction were performed with the OPUS (Bruker Optics) software At
the end of each experiment the solutions were released to a hood
The stainless steel cell is rated up to 50 MPa and has an internal volume of 92 mL
It has an observation window made of sapphire which allows visual determination of
the number of phases present inside the cell This kind of information is important for
11 Crown Ether-Water Interaction In Supercritical CO2 59
Figure 14 Fourier Transform Infra-Red (FT-IR) experimental setup
11 Crown Ether-Water Interaction In Supercritical CO2 60
quantitative analysis as some water droplets can potentially form in the path of the
beam which would alter the measured spectral data The infrared beam is focused
along two conical holes and passes through two small diamond windows providing a
path-length of 100 microm The stirring of the solution during the whole experiment was
done using a Teflon-coated magnetic stirring bar
Water contamination from the atmosphere or from previous cleaning can change
equilibrium parameters and lead to erroneous results Such contamination of the cell
and its content must be avoided Thus for each experiment the cell was purged with
nitrogen and chemicals were introduced to the cell under a glove box The cell was
then connected to the line and the CO2 was introduced The solutions were stirred
for 20 to 30 minutes to reach equilibrium after each change of experimental condi-
tions such as chemicals concentration of species pressure and temperature Longer
experimental times were tested without any significant change in the IR spectra
Heavy water (D2O) was used instead of H2O to avoid the overlapping of water
peaks and strong CO2 absorption bands between the wave numbers of 3500 and 3800
cmminus1 The pure CO2 density was varied from 660 to 1040 gmiddotLminus1 by adjusting the
temperature between 25 and 70 C and the pressure between 20 and 40 MPa The
pure CO2 density was determined using a reported table from the National Institute
of Standards and Technology (NIST) Chemistry WebBook56
It is important to contain the chemicals inside the cell to maintain accuracy for
quantitative analysis and to avoid any back flow to the pump Therefore any decrease
in density was prevented in successive experiments that did not require new chemicals
but simply required increasing pressure andor decreasing temperature After each
set of experiments the cell was cleaned several times with CO2 and acetone and dried
using nitrogen A blank spectrum was taken to be certain that there is no contam-
ination It was also used to subtract the empty cell spectrum including the signal
from the diamond windows from the spectrum of each sample Another background
correction was performed because of the overlapping of weak 18-crown-6 bands (C-H
11 Crown Ether-Water Interaction In Supercritical CO2 61
stretch) and D2O bands The spectrum of pure 18-crown-6 at the same pressure and
temperature as the sample was also subtracted
To study the nature of crown-water hydrogen bonding in liquid and supercritical
CO2 a series of mixtures composed of a fixed D2O concentration (0049 molmiddotLminus1) and
variable 18-crown-6 concentrations (up to 025 molmiddotLminus1) were introduced in the cell
with a syringe before the CO2 was added
112 Summary of the Results
FT-IR spectroscopy was used as an analytical method for the understanding of crown
ethers-water interaction The chosen crown ether for this study was 18-Crown-6 and
D2O was used instead of water to avoid overlapping of CO2 intense signal and water
peaks in the wave number range between 3500 and 3800 cmminus1
Three types of bonding were observed between the crown ether and the water
The first one (Figure 15(c)) can only be observed at high crown to D2O concentra-
tion ratio The configuration is a ldquosandwichrdquo formed with two 18-crown-6 molecules
surrounding one water molecule The sandwich configuration is one possible con-
figuration among many examples of other configurations being the ldquooffsetrdquo or the
ldquoperpendicularrdquo This configuration is characterized by a broad peak at 2590 cmminus1
At low crown to D2O concentration ratio a water molecule can bond with a crown
ether molecule in two different ways The first type is a bridge configuration (Figure
15(a)) formed by hydrogen bonds between D2O and two oxygen atoms that belong
to the crown cavity The bonds involved in this configuration have the same nature
as the one in the sandwich configuration thus their respective FT-IR peaks are over-
lapping The second type is a single configuration (Figure 15(b)) where D2O makes
a single hydrogen bond with an oxygen atom belonging to the crown ether cavity
It is characterized by two peaks at 2679 and 2733 cmminus1 assigned respectively to the
hydrogen-bonded OndashD stretching and the unbonded OndashD stretching
The equilibrium constants of formation Ks and Kb for the single and the bridge
11 Crown Ether-Water Interaction In Supercritical CO2 62
Figure 15 Molecular structure of the water-crown ether interaction in the bridgeform (a) the single configuration (b) and the sandwich form (c)
configurations were calculated with the CO2 density increased at several step from
850 to 960 gmiddotLminus1 For the single configuration Ks was found to vary between 16 plusmn
4 and 9 plusmn 2 Lmiddotmolminus1 For the bridge configuration Kb was found to vary between
10 plusmn 3 and 5 plusmn 2 Lmiddotmolminus1 in the range of CO2 densities considered Different
equilibrium constant measurements at constant pressure and variable temperature
allow the calculation of the enthalpy of the hydrogen bond for the two complexes
Their values were calculated to be -12 plusmn 2 kJmiddotmolminus1 for the single complex and -38
plusmn 3 kJmiddotmolminus1 for the bridge one These values are in agreement with hydrogen bond
enthalpy values found in the literature for other solvents57
113 Additional Description
The equilibrium parameters of crown ether-water interaction in supercritical CO2
found by FT-IR need to be compared with the equilibrium parameters in solvents
analyzed by NMR The later is described in section 12 NMR is an analytical tech-
nique that does not allow the differentiation of the two configurations being bridge
or single Thus the equilibrium parameters of both the single and the bridge con-
figurations need to be calculated from the FT-IR study in supercritical fluids For
this purpose the equilibrium is described next in the section covering the theoretical
11 Crown Ether-Water Interaction In Supercritical CO2 63
analysis
Theoretical Calculations
The equilibrium relation is given as
2 18C6 + 2 D2O 18C6middotD2Osingle + 18C6middotD2O
bridge (111)
From this equilibrium the constant K can be defined as
K =[18C6middotD2O
single][18C6middotD2Obridge]
[D2O]2[18C6]2= Ks middotKb (112)
where
Ks =[18C6middotD2O
single]
[D2O][18C6]and Kb =
[18C6middotD2Obridge]
[D2O][18C6](113)
and the molar fraction k of crown ether bonded to water is given as
k =[18C6middotD2O
single] + [18C6middotD2Obridge]
[18C6middotD2Osingle] + [18C6middotD2O
bridge] + [18C6]middot (114)
The molar enthalpy (∆H) of the hydrogen bond at constant pressure can be
determined from the equilibrium constant (equation 112) using the well-known ther-
modynamic relations (equation 115 116 and 117)(part∆G
partT
)P
= minus∆S =∆Gminus∆H
T (115)
∆G0 = minusRT ln K (116)
and (part ln K
part(1T )
)P
= minus∆H
R (117)
where T is the absolute temperature in K ∆S is the entropy in Jmiddotmolminus1middotKminus1 ∆G is
the Gibbs free energy in Jmiddotmolminus1 and R is the molar gas constant in JmiddotKminus1middotmolminus1
11 Crown Ether-Water Interaction In Supercritical CO2 64
Table 11 Equilibrium parameters for water-crown-ether interaction in supercriticalfluids
Pressure temp density K = Ks timesKb k [D2O]MPa C gcmminus3 L2middotmolminus2 molmiddotLminus1
202 60 0724 34 33 0035202 50 0784 62 35 0034202 40 0840 161 45 0031201 35 0866 108 40 0032200 33 0876 174 45 0030200 31 0886 242 47 0029200 25 0913 298 54 0028
202 40 0840 161 45 0031303 40 0910 53 34 0035354 40 0935 61 35 0034405 40 0956 64 35 0034
405 25 1004 178 44 0030
Typical Statistical errors are Pressure plusmn 01 MPa Temperature plusmn 1 C Kplusmn 10and kplusmn 10
Results and Discussion
The variation of the constant of formation K and the molar fraction of crown ether
bonded to water k with pressure and temperature are shown in Table 11 The
constant of formation K varies from 34 plusmn 4 to 300 plusmn 30 L2middotmolminus2 when the temper-
ature decreases from 60 to 25 C at constant pressure (of sim20 MPa) At constant
temperature (40 C) K tends to decrease with pressure increase (from 20 to 40 MPa)
The same trend is observed for the molar fraction k of crown ether bonded to
water Figure 16 shows this trend at constant pressure (20 MPa) When the density
increases (ie the temperature decreases) the value of k increases from 33 plusmn 4
to 54 plusmn 6 Therefore there is more water molecules bonded to the crown at low
temperature or at high density for a constant pressure of 20 MPa
The variations of k at constant temperature (40 C) versus density is shown in
11 Crown Ether-Water Interaction In Supercritical CO2 65
25
30
35
40
45
50
55
060 065 070 075 080 085 090 095 100
k (
)
Density of CO2 (gcm-3)
Figure 16 Molar fraction of crown ether bonded to water k versus density at constantpressure (20 MPa) Lines are guides for the eyes and do not have any theoretical oranalytical value
Figure 17 When the density increases (ie pressure increases) the value of k
decreases rapidly at first and then reaches a plateau at approximately 35 when the
density exceeds 900 gmiddotLminus1 At lower pressure values there is more water bonded
to the crown ether However pressure does not appear to influence the amount of
bonded water for pressures higher than 30 MPa
Equation 117 shows that the plot of ln K versus 1T at constant temperature
(Figure 18) can give the value of the molar enthalpy ∆H of the hydrogen bond
between water and 18C6 To demonstrate this linear regression of the plotted data
is needed and the resulting slope multiplied by the inverse of the molar gas constant
(R = 83144 JmiddotKminus1middotmolminus1) gives directly the value of ∆H At 20 MPa ∆H was found
equal to -51 plusmn 6 kJmiddotmolminus1
Consequently the complexation process is exothermic and since the species are
more entropically ordered it explains the decrease of the K values with the increase of
temperature In other respects it is important to remember that for this calculation
11 Crown Ether-Water Interaction In Supercritical CO2 66
30
35
40
45
50
080 082 084 086 088 090 092 094 096 098 100
k (
)
Density of CO2 (gcm-3)
Figure 17 Molar fraction of crown ether bonded to water k versus density at constanttemperature (40 C) Lines are guides for the eyes and do not have any theoretical oranalytical value
I needed to assume that ∆H is independent of density This result is in accordance
with the values for hydrogen bonding in the literature57
Figure 19 shows the dependence of [D2O] on the global equilibrium constant K
The amount of free water in CO2 decreases when K increases This dependence
appears to be linear simply because the range of the water concentration data is too
narrow to clearly display any curvature as expected from equation 112
Conclusion
This section was devoted to the study of water-crown ether interaction in sub- and
supercritical CO2 using FT-IR This analytical technique allows us to see the different
configurations including bridge single and sandwich forms between water and crown
ethers The equilibrium constant the molar fraction of crown ether bonded to water
and the amount of free water were determined for the bridge and single configurations
at different pressures and temperatures From these data the enthalpy of the hydro-
11 Crown Ether-Water Interaction In Supercritical CO2 67
0
1
2
3
4
5
6
7
29 30 31 32 33 34 35
ln K
1000T
Figure 18 Dependence of ln K on 1000T at 20 MPa
gen bond was found to be -12 plusmn 2 kJmiddotmolminus1 and -38 plusmn 3 kJmiddotmolminus1 for the single and
the bridge configurations respectively These results correspond to a total enthalpy
of -51 kJmiddotmolminus1for the two hydrogen bond configurations as found in the global study
that lumps together the equilibra of the bridge and the single configuration in one
equilibrium This last group of results will be compared in the next section section
123 to the one in organic solvent using NMR (Nuclear Magnetic Resonance) as a
method of analysis
11 Crown Ether-Water Interaction In Supercritical CO2 68
0026
0028
0030
0032
0034
0036
0038
0040
0 50 100 150 200
[D2O
] free
(m
olL
-1)
K = Ks x Kb (L-2mol-2)
Figure 19 Dependence of free water [D2O] on the equilibrium constant K
12 Crown Ether-Water Interaction in Solvents
Introduction
The main objective of the work describe in this section is to understand the role of
the solvent in the interaction between water and crown ethers This interaction will
be compared to the one in supercritical CO2 described in the previous section The
description of this interaction will lead to a better understanding of cesium extraction
using crown ethers This interaction was studied with Nuclear Magnetic Resonance
(NMR) spectroscopy I will therefore describe this analytical tool before discussing
the water-crown ether interaction in more detail
The history of NMR started in the late thirties with the discovery by Rabi of
the magnetic moment In 1946 two different research groups observed for the first
time an NMR signal Bloch Hanse and Packard from Stanford University detected
the signal 1H of water while Purcell Torrey and Pound from Harvard University
detected it in paraffin wax Bloch and Purcell shared the Nobel prize of Physics
in 1952 for this discovery Since then numerous improvements have been made and
NMR is nowadays the most important and most used technique to determine chemical
structures or to perform Magnetic Resonance Imaging (MRI)
Basically the NMR spectroscopic technique is based on measuring the absorption
of Radio Frequency (RF) radiation from the nucleus in a strong magnetic field After
the absorption of the radiation the spin of the nucleus will go to its highest energy
state Thereafter the nucleus will return to its initial state by emitting RF radiation
which is recorded versus time for the spectrum
The principle of the NMR operation is described in more details as follows The
nucleus of some atoms has an angular moment ~M these nuclei are therefore similar
to an electric charge in rotation As a result the nucleus has a nuclear magnetic
moment ~micro that is directly proportional to the angular moment The constant of pro-
portionality γ is called magnetogyric ratio and it is a characteristic of each particular
12 Crown Ether-Water Interaction in Solvents 70
nucleus When a nucleus with a magnetic moment is placed in a magnetic field ~H0
it gains an excess of potential energy Es where
Es = minus~micro middot ~H0 = minusγ ~M middot ~H0 (118)
The projection of ~M over ~H0 is quantified in the sense that it can only take integral
or half integral multiples of ~ which is the Plank constant (h = 66261times 10minus34J middot s)
divided by 2π Hence this projection Mz can take 2I+1 values
Mz isin I~ (I minus 1)~ (1minus I)~minus~ (119)
where I is the nuclear spin quantum number The spin quantum number I can take
different values (0 12 1 32 2 cf Table 12) depending on the nucleus
Table 12 Values of I the quantum spin number for different nucleus
1H 2H 12C 13C 14N 15N 19F 31P 16O 17O 133Cs 137Cs12 1 0 12 1 12 12 12 0 52 72 72
Nuclei with a nuclear spin quantum number equal to zero do not have a nuclear
magnetic moment and therefore can not be seen by NMR The analysis of the spin
state I = 12 is very straightforward because of its spherical charge distribution with
no electric quadrupole moment This is why NMR is intensively used to analyze
hydrogen nuclei and to less extent carbon 13 fluorine 19 and phosphorous 31 nuclei
Therefore for the rest of this presentation I will consider only the properties of the
I = 12 spin state
According to equations 118 and 119 with a spin state of I=12 Mz = 12~ or
minus12~ and Es = minus12~γH0 or +12~γH0 Therefore a nucleus which has a potential
energy E in the absence of magnetic field will have two different possible energies
when placed in a magnetic field ~H0 (Figure 110 The difference between these two
energies ∆E is equal to γ~H0
The number of nuclei in each energy state follows the Boltzmann relation
n2
n1
= eminus∆EkBT = eminusγ~H0kBT (120)
12 Crown Ether-Water Interaction in Solvents 71
Figure 110 Potential energy of a nucleus with a spin state I=12 outside and insidea magnetic field
where n1 and n2 are the number of nuclei in the state E1 = E + Es1 and E2 =
E +Es2 kB is the constant of Boltzmann (kB = 138066times 10minus23J middotKminus1) and T is the
temperature in K Consequently more nuclei are in the state E1 than in the state E2
However nuclei can transit from state E1 to E2 under an adequate electromagnetic
field The frequency of this electromagnetic wave follows the Einstein equation
hν = ∆E = γ~H0 (121)
which leads to defining the frequency
ν =γH0
2π(122)
which is generally in the radio frequency wavelength ie from 20 to 900 MHz for a
magnetic field strength between 1 and 20 Tesla For comparison the earth magnetic
field is approximately 10minus4 T and the energy of a IR transition is a thousand times
greater whereas the one of an electronic transition is nearly one million times greater
NMR is a sensitive and non destructive analytical method but it has drawbacks
The equipment is very expensive because it needs to be able to observe a very little
change in frequency or energy and at the same time it needs to be capable of pro-
ducing a very strong magnetic field A typical NMR experiment setup is represented
as a simplified diagram in Figure 111 During the NMR experiment represented in
figure 112 the sample is placed in a tunable magnetic field and irradiated with RF
12 Crown Ether-Water Interaction in Solvents 72
waves from a transmitter The wave frequency is maxed out for the proton NMR
(ie it is chosen close to 500 MHz when a 500 MHz spectrometer is used and close
to 300 MHz with a 300 MHz spectrometer) The time during which the sample is
irradiated is called pulse-width and lasts 1 to 30 micros depending on the system studied
The pulse-width can also be given in degrees which correspond to the angle that the
spin has with the z-axes at the end of the pulse During irradiation waves having
the same energy as the energy difference between the spin states of the nuclei are ab-
sorbed in the sample This matching of energies (frequencies) is called the resonance
When the nuclei in the sample returns to its normal state RF waves are emitted and
acquired by the receiver Wave intensities are then recorded as a function of time
and the resulting graph is called the Free Induction Decay (FID) Acquisition lasts
for several seconds and the process is performed several times to reduce the signal to
noise ratio In between pulses the sample has to go back to equilibrium (relaxation)
to avoid the overlapping of the signals this is the relaxation delay that takes 5 to 20
seconds depending on the sample Therefore the time between scans is equal to the
pulse-width (which is relatively small and can be ignored) plus the acquisition time
plus the relaxation delay After the last scan the FID is finally Fourier transformed
to obtain the spectra of the intensities versus frequencies
Proton NMR (PNMR) is the most commonly used NMR spectroscopy because
of the abundance of hydrogen in organic molecules and because of the simplicity of
its spectral interpretation Each peak in such spectra offers three characteristics
location intensity and coupling
First the location of a peak is defined as the frequency at which the proton enters
in resonance This property depends on the electron(s) surrounding the nucleus
Electrons are responsible for bonds between atoms and as charged particles they are
responsive to the external magnetic field When electrons are put in a magnetic field
H0 they would move to compensate for the effect of H0 and therefore shield the
nucleus that will enter in resonance at a higher frequency As a consequence one can
12 Crown Ether-Water Interaction in Solvents 73
Figure 111 Nuclear magnetic resonance experiment4
have an idea of the surrounding of the atom observed depending on the location of a
peak The downside is that this location will differ from one spectrometer to another
indeed the location of a peak is dependent on both the RF and the strength of the
magnetic field and the later can not be standardized due to magnet differences To go
around this problem most scientist use as a reference a compound that is chemically
nonreactive gives a single sharp peak and does not interfere with the resonances of
the species in the sample studied The compound that meets all these specifications is
TetraMethylSilane (CH3)4Si or TMS The frequency of a peak δ is called a chemical
shift (from that of the TMS taken as a reference) Nevertheless there is another
problem with the spacing between the peaks being still not standardized The way
to solve his problem is to divide the frequency observed of the peak by the frequency
of the spectrometer (ie 100 or 500 MHz) Since the number obtained is very small
(Hz divided by MHz) the result is multiplied by one million and the part per million
unit (ppm)is used
12 Crown Ether-Water Interaction in Solvents 74
Figure 112 Acquisition sequence for a nuclear magnetic resonance experiment
The second characteristic of a PNMR spectrum is intensity The intensity of a peak
for a nucleus type is directly proportional to the number of nuclei having exactly the
same electronic surroundings These nuclei are called isochronous because they show
at the same chemical shift For example the peak of the three protons of a methyl
group will show at the same chemical shift and the peak will have an intensity three
times greater than the one of an alcohol group
Coupling is the third major property of a PNMR spectrum When different sets
of hydrogen atoms are close together in a molecule (ie when there is generally three
bonds or less in between them) there is a spin-spin interaction and their nuclei are
coupled For example the spectrum of ethanal (CH3CHO Figure 113) can be looked
at In this molecule a proton from the methyl can ldquoseerdquo the proton from the aldehyde
group they are coupled Therefore the methyl peak will be split in a doublet In the
same way the proton from the aldehyde group can ldquoseerdquo the three protons from the
methyl group and the proton peak from the aldehyde will split in a quartet (Figure
114 a)
12 Crown Ether-Water Interaction in Solvents 75
In all cases the space between the coupled peaks is constant for a given multiplet
and it is called coupling constant (J) J is independent of the magnetic field strength
and is the same for both groups of the same spin-spin interaction Quantitatively J
value is generally between 2 and 10 Hz In Figure 114 the ideal splitting patterns are
shown with their intensities A group will split in a doublet if itldquoseesrdquo one proton to
a triplet if it ldquoseesrdquo two in a quartet if it ldquoseesrdquo three etc The global intensity is the
same as the one you would have with a single peak but the relative intensity depends
on the tree shown in Figure 114 b It happens nevertheless that the chemical shifts
are too close to one another and the pattern of the multiplets are distorted
In this section I will present the experimental setup and a summary of the results
that are detailed in the paper ldquoPartition Coefficients and Equilibrium Constants of
Crown Ethers between Water and Organic Solvents Determined by Proton Nuclear
Magnetic Resonancerdquo which I published with other colleagues This paper is repro-
duced as appendix G At last I will compare the results from this section to the one
using FT-IR in solvents
121 Experimental Section
All chemicals were purchased from Aldrich Chemical Company and used without
further purification Chloroform was used in its deuterated form (995 CDCl3) and
the water phase contains 5 D2O by volume
The crown ethers were diluted in the CDCl3 + CCl4 mixtures with a concentration
range of 002 to 02 molmiddotLminus1 These solutions were subsequently mixed with an equal
volume of the D2O-enriched water and the equilibrium was reached by shaking the two
phases with a wrist-type shaker for 2 hours or more The studies involving 15-crown-
5 18-crown-6 and dicyclohexano-18-crown-6 in solvents containing high percentages
of CCl4 required longer shaking time to get consistent data After the shaking the
mixtures were centrifuged for one hour
The remaining organic and aqueous phases were then analyzed by proton NMR
12 Crown Ether-Water Interaction in Solvents 76
using a 500 MHz Bruker DRX500 spectrometer To obtain quantitative results 16
scans were taken and for each the pulse interval was set to 113 sec (acquisition time
33 sec relaxation delay 8 sec) The pulse-width was 30 degrees (corresponding to a 2
micros pulse) in all systems (organic aqueous with or without chelator agent) Chemical
shifts in the organic phase were calibrated by setting the chloroform chemical shift to
724 ppm For the solvent mixtures containing CCl4 the chloroform resonance peak
shifts upfield (lower ppm) as CCl4 was added The shift was measured by turning
off the field lock this operation allows the comparison of the solvent mixtures at
constant field A 014 ppm shift was observed when the solvent used is 25 CHCl3 in
CCl4 instead of 100 CHCl3 An upfield correction was then added for all mixed
solvent samples run with a CDCl3 field lock The intensity (based on integrated area
calculations for all data) of the water peaks in the Proton-NMR (PNMR) spectra
was corrected for the 5 D2O (by volume) present in the water phase For the 100
CCl4 mixture an insert filled up with benzene-d6 has been used as a reference for
the intensity and the chemical shift which was set at 715 ppm
Typical PNMR spectra for 18-crown-6 in the CDCl3 phase are shown in Figure
115 A single resonance peak for the protons belonging to unsubstituted crown ethers
is generally observed in the region between 3 and 4 ppm The free water and the
bonded water are in rapid exchange in solution due to the equilibrium The observed
water resonance peak consists then of an average of the resonance of the free water
and the bonded water Thus the resonance peak for the water shifts downfield as the
concentration of the bonded water is increased which correspond to an increase in
ligand concentration The concentration of the ligand in the organic phase has been
corrected for its solubility in the aqueous phase based on PNMR measurements of its
partition between the two phases
12 Crown Ether-Water Interaction in Solvents 77
122 Summary of Results
The influence of solvent on water-crown ethers interaction was studied by NMR in
chloroform and carbon tetrachloride mixtures The two configurations (single or
bridge) of 11 water-crown ether complex that have been observed by Moyer et al36
in carbon tetrachloride using FTIR cannot be distinguished by NMR analysis There-
fore only one complex taking in account the two configurations is used for the differ-
ent calculations The analysis of the data shows that water and crown ether form a
11 complex in rapid exchange with uncomplexed ligand and water The crown ether
concentrations used for this study are small enough to avoid the formation of a 12
complex or ldquosandwichrdquo between one water and two crown ether molecules
Different constants were determined in the course of this study First the partition
coefficient (D) for crown ether between the two phases was found to depend strongly
on the solvent Its value for 18-crown-6 varies from 025 plusmn 002 in a 100 CDCl3 so-
lution to 48 plusmn 3 in a 100 CCl43 Otherwise D stays in the same order of magnitude
for different crown ethers soluble in water Second the equilibrium constant (K) and
the molar fraction (k) of crown ether complexed with water were measured They
were found to depend strongly on the cavity size For example k varies from 15 plusmn
1 for 12-crown-4 to 97 plusmn 5 for 18-crown-6 in chloroform Moreover the molar
fraction k is reduced to 70 for DC18C6 in 100 CDCl3 which shows the effect of a
substituant like the cyclohexane In the other hand the molar fraction k varies from
97 plusmn 5 in 100 CDCl3 to 61 plusmn 3 in 25 CDCl3 in CCl4 for 18-crown-6 which
shows that k is also affected by the solvent used Last the chemical shifts of free and
complexed water in the organic phase were determined for each solvent mixture and
each crown ether
123 Comparison to FT-IR Results in CO2
Beside the difference in solvent and in the spectroscopic tool used there is a third
difference between the two experiments In the first experiment (using FT-IR in CO2)
12 Crown Ether-Water Interaction in Solvents 78
the total amount of water in the organic phase is constant and completely dissolved
in the organic phase In the second experiment (using NMR in solvents) the amount
of free water is constant but the total amount of water is not constant as there
is a reservoir of water allowing water to go in the organic phase to be bonded to
crown ether when the crown ether concentration increases Therefore the partition
coefficient of water between the organic and the water phase was not determined in
the first experiment The only data that I can compare is the equilibrium constant
(K) and the molar fraction of ligand complexed to water (k) In an effort to clarify
this distinction in the rest of this section these constants will be respectively called
K1 and k1 for the first experiment using FT-IR in CO2 and K2 and k2 for the second
experiment using PNMR in solvents The values of theses constants are detailed in
Table 13
Table 13 Comparison of the values of the equilibrium constants K1 and K2 and ofthe molar fractions of ligand complexed to water k1 and k2
CO2 CDCl3CCl4 mixturesPressure Temperature Density K1 k1 CDCl3 K2 k2
MPa C gmiddotLminus1 L2middotmolminus2 vol Lmiddotmolminus1
202 60 724 34 33 25 141 61202 40 840 161 45 50 97 63200 25 913 298 54 75 102 79
202 40 840 161 45 50 97 63405 40 956 64 35 100 545 97
In CO2 at constant pressure the values of K1 and k1 decrease with an increase
in temperature and their values decrease as well at constant temperature with an
increase in pressure Whereas in CDCl3 and CCl4 mixtures the values of K2 and k2
decreases as the percentage of CDCl3 in CCl4 decreases Therefore at high pressure
and temperature regarding the equilibrium constants and the molar fraction of ligand
bonded to the water CO2 behave more like CCl4 which is a nonpolar solvent (its
12 Crown Ether-Water Interaction in Solvents 79
dielectric constant ε = 224 and its electric dipole moment in the gas phase micro is equal
to zero58) On the other hand when the temperature and pressure of CO2 decreases
its properties are closer to the one of CDCl3 which is a polar solvent (CHCl3 dielectric
constant ε = 481 and CHCl3 electric dipole moment in the gas phase micro = 101 D58
the isotopic effect is weak for these properties and their values should be closed to
the one of CDCl3)
The amount of free water in solvents can be compared to the one in CO2 Numer-
ous published studies have recorded the solubility of water in sub and supercritical
CO25960 Values obtained from Argonne National laboratory in collaboration with
Michael J Chen6162 are reproduced in Table 14 and are compared with the one from
Fulton et al59 to the one in different mixtures of CCl4 and CDCl3 At constant tem-
perature and at increased pressure [H2O] increases to reach approximately the value
of free water in CDCl3 when the density exceeds 08 gcmminus3 When the density is fixed
at 900 gmiddotLminus1 or the pressure is fixed at 345 MPa the amount of free water increases
rapidly when the temperature is increasing Regarding water solubility CO2 behaves
like CCl4 at low pressure and temperature and shifts to a behavior resembling that
of CDCl3 when the temperature andor the pressure increases
Table 14 Comparison of water solubilities in solvents and in CO2
CO2 CDCl3CCl4 mixturesPressure Temperature Density [D2O] CDCl3 [H2O]
MPa C gmiddotLminus1 molmiddotLminus1 vol molmiddotLminus1
83a 35 576 0032 0 000176a 35 845 0067 25 0011262a 35 909 0074 50 0017362a 50 905 0122 75 0037455a 65 901 0183 100 0060345b 50 804 0137345b 75 896 0271
a Michael J Chen6162 b Fulton et al59
12 Crown Ether-Water Interaction in Solvents 80
Conclusion
This study shows that interaction between water and crown ethers depends strongly
on the crown ether used and on the nature of solvents The main factor of this
dependence is the polarity of the solvent As the polarity increases (decrease of
CCl4 concentration in CDCl3) the molar fraction (k) of crown ether complexed with
water increases from 61 to 97 for 18-crown-6 These values can be compared to the
ones in supercritical fluids where regarding the values of k CO2 behaves more like
CDCl3 at low temperature and low pressure These tendencies are the same regarding
the equilibrium constant K in both systems whereas it is the opposite for the quantity
of free water in the oil that is the same as the solubility of water in oil This value
increases with the polarity of the solvent and increases with increasing pressure and
temperature Therefore CO2 is a tunable solvent that can behave like a polar or non
polar solvent depending on the property observed and its pressure temperature and
density
These data are important for understanding and improvement of liquid-liquid
extraction of metallic ions with crown ethers where water plays an important role
Section 13 will show this importance for cesium extraction
12 Crown Ether-Water Interaction in Solvents 81
1211
109
87
65
43
21
0
240
220
200
180
160
140
120
100
8060
4020
0
CD
Cl 3
QE
-300
Figure 113 P-NMR spectrum of the ethanal molecule (CH3CHO)5
12 Crown Ether-Water Interaction in Solvents 82
Figure 114 coupling due to spin-spin interactions and relative intensities
12 Crown Ether-Water Interaction in Solvents 83
Figure 115 Typical PNMR spectra of 18-crown-6 in the CDCl3 phase The concen-trations of 18-crown-6 after equilibrium with water are 000 0002 0075 and 0153molmiddotLminus1 (from top to bottom) and the water peaks are at 1565 1874 2393 and2668 ppm respectively
13 Introduction to Cesium Extraction Equilibrium
Using Crown Ethers
Introduction
The purpose of this section is to show the importance of the water in the equilibrium
describing the solvent extraction of cesium picrate using Dicyclohexano-18-crown-6
(DCH18C6) as a ligand This section complements the previous presentation of the
interaction between water and crown ethers in various solvents (section 12) I must
first describe the origin and properties of cesiumndash137 before venturing into the details
of its extraction equilibria
Cesiumndash137 (137Cs) is an isotope produced by the fission of uranium-235 which
takes place in nuclear reactors or when an atomic bomb is detonated It is radioactive
with a physical half-life of 3017 years It can be found in the soil and is metabolized
in plants and animals Its concentration is particularly high in wild animals and in
mushrooms because of the specificity of game way of eating and mushrooms accumu-
lation mechanisms Furthermore those species are generally found in forests where
the soil is protected from rain washing and wind dispersion causing a slow natural
decrease in concentration
Soil contamination is mainly the result of atmospheric nuclear weapon tests and
of the Chernobyl reactor accident The contamination is high in Ukraine and Russia
and still a concern in western Europe 137Cs is dangerous for the human consumption
because it is recognized by the body and accumulated mimicking potassium which is
important in the transmission of nerve messages Like any radioactive material it also
increases the risk of cancer when inhaled or ingested 137Cs contamination of land
and foodstuffs in the territories around Chernobyl is a major problem as thousands
of square miles of land in Belarus Russia and Ukraine cannot be used for agricultural
production whereas in some areas the population had to be relocated These social
and economic consequences of 137Cs contamination will remain for decades unless a
13 Introduction to Cesium Extraction Equilibrium 85
decontamination solution is found
Nuclear waste from power plants is another source of 137Cs This isotope is abun-
dant in Spent Nuclear Fuel (SNF) and is largely responsible for the heat produced in
such waste 137Cs has a relatively long half-life (3017 years) and therefore it survives
the short-term storage period of 10 years commonly allocated for SNF In order to
recycle the uranium and the plutonium from nuclear waste one should clean it up
by removing other isotopes like strontium-90 and 137Cs Furthermore 137Cs can be
recycled and used for radiotherapy at cancer medical centers
Crown ethers with their particular geometry can be used to extract and separate
alkali ions from soil water or other media Their cavity varies in size depending on
the number of oxygen atoms forming it They can thus be selective for one specific
ion size like the cesium cation In this section I am presenting a new model allowing
the calculation of the interaction between crown ether water and cesium picrate
in a two-phases medium The crown ether chosen for this study is dicyclohexano-
18-crown-6 (Figure 116 a) Its cavity size is compatible with the extraction of
the cesium ion The two cyclohexane molecules attached to the crown ether force
the cavity to be open in a ldquoplanerdquo conformation which is more favorable for the
extraction Furthermore the DCH18C6 is not soluble in water which simplifies the
calculations and the understanding of the equilibrium Because of the explosive nature
of the picrate ion (Figure 116 b) chosen as a counter ion I could not analyze these
interactions in supercritical fluid by FT-IR I had to use like in the previous section
NMR as an analytical instrument and chloroform as a solvent The radioactive 137Cs
and the stable Cesium-133 isotopes have the same chemical properties therefore I
used 133Cs isotope for the following experiments that describe crown etherndashwaterndash
cesium picrate interactions that occur during the extraction of cesium from water
with chloroform
13 Introduction to Cesium Extraction Equilibrium 86
Figure 116 Molecular structure of dicyclohexano-18-Crown-6 (a) and of Cesiumpicrate (b)
131 Experimental Work
Dicyclohexano-18-crown-6 (DCH18C6 98 pur) chloroform-d (995 CDCl3) were
purchased from Aldrich Chemical Company and used with no further purification
Cesium picrate was synthesized from cesium chloride and picric acid and was recrys-
tallized in water Its purity is estimated to be over 95 because no impurity peak
can be seen in the NMR spectra of the specie dissolved in water (5 D2O)
The ligand was dissolved in chloroform-d (in the concentration range of 005ndash04
molmiddotLminus1) whereas the cesium picrate was dissolved in water (in the concentration
range of 001ndash012 molmiddotLminus1) The two solutions were mixed in equal volume for 4
hours to reach equilibrium Both phases were analyzed with a 500 MHz Brucker
DRX500 spectrometer The pulse interval was set to 9 sec (acquisition time 3 sec
relaxation delay 6 sec) DCH18C6 has a very low solubility in water and is not
detectable in the water phase by NMR Thus its solubility in water was considered
equal to zero and it was used as a standard for the peak integration in the organic
phase
Two typical PNMR spectra for DCH18C6 with water and cesium picrate in the
CDCl3 phase are shown in Figure 117 where the initial ligand concentration ([L]) is
13 Introduction to Cesium Extraction Equilibrium 87
04 molmiddotLminus1 and the initial cesium picrate concentration ([CsPi]) is 30 mmolmiddotLminus1 and
in Figure 118 where [L] = 005 molmiddotLminus1 and [CsPi] = 8 mmolmiddotLminus1 The chloroform
chemical shift was set at 724 ppm and used for the calibration of all other chemical
shifts in the organic phase The group of peaks around 36 ppm is attributed to
the 20 protons of the crown ether ring whereas the 4 peaks for the protons of the
cyclohexanes are between 1 and 2 ppm The single resonance peak for the two equiv-
alent protons of the picrate ion is found at 88 ppm The free water and the bonded
water are in rapid exchange in the solution due to their equilibrium The observed
water resonance peak consists of an average of the resonance of the free water and
the bonded water in CDCl3 Thus the resonance peak for the water shifts downfield
as the ligand concentration is increased In these spectra the water resonance in
CDCl3 is found at 22 ppm (Figure 118) and 29 ppm (Figure 117) In this last
figure the concentrations are very low and the contamination of a water droplet can
be seen at 47 ppm which correspond to the chemical shift of water in water
00 20 40 60 80 100
ppm
Figure 117 Typical PNMR spectrum for DCH18C6 (at 04 molmiddotLminus1) with water andcesium picrate (at 30 mmolmiddotLminus1) in the CDCl3 phase)
13 Introduction to Cesium Extraction Equilibrium 88
00 20 40 60 80 100
ppm
Figure 118 Typical PNMR spectrum for DCH18C6 (at 005 molmiddotLminus1) with waterand cesium picrate (at 8 mmolmiddotLminus1) in the CDCl3 phase)
132 Calculations
NMR spectra give directly the total concentration of cesium picrate (CsPi) ligand
(L) and water in the organic phase by an integration of the peaks belonging to the
former species In order to simplify the notation the suffix ldquoaqrdquo was added to the
species in the aqueous phase whereas no suffix was added to the species in the organic
phase
Equilibrium Model Between the Two Phases
The partition of water crown ether and cesium picrate between the organic and the
aqueous phase is described as
H2Oaq H2O (123)
Laq L (124)
CsPiaq CsPi (125)
13 Introduction to Cesium Extraction Equilibrium 89
Equilibrium Model in the Organic Phase
In the organic phase the interaction between water cesium picrate and DC18C6
follows the equilibrium reactions
CsPi + L CsPiL (126)
CsPiL + L CsPiL2 (127)
L + H2O LmiddotH2O (128)
CsPiL + H2O CsPiLmiddotH2O (129)
CsPiL2 + H2O CsPiL2middotH2O (130)
Equilibrium Constants
Equilibrium constants corresponding to equations (126) through (130) are respec-
tively defined as
K1 =[CsPiL]
[CsPi][L](131)
K2 =[CsPiL2]
[CsPiL][L](132)
Ka =[LmiddotH2O]
[L][H2O](133)
Kb =[CsPiLmiddotH2O]
[CsPiL][H2O](134)
Kc =[CsPiL2middotH2O]
[CsPiL2][H2O](135)
13 Introduction to Cesium Extraction Equilibrium 90
Determining the Concentration of Different Species
The total unbonded water concentration [H2O] is constant at equilibrium because of
the equilibrium relation (123) To facilitate further calculation the following notation
is employed for the former equilibrium constants
kx = [H2O]Kx (136)
with x = a b or c
Material balance at equilibrium leads to equations (138) (140) and (142) where
the ldquoorgrdquo suffix is used for the total concentration in the organic phase
[L]org = [L] + [LmiddotH2O] + [CsPiL] + [CsPiLmiddotH2O] + 2[CsPiL2] + 2[CsPiL2middotH2O]
(137)
rArr [L]org = (1 + ka)[L] + (1 + kb)[CsPiL] + 2(1 + kc)[CsPiL2] (138)
[CsPi]org = [CsPi] + [CsPiL] + [CsPiLmiddotH2O] + [CsPiL2] + [CsPiL2middotH2O] (139)
Cesium picrate solubility in the organic phase is very low and considered as null
rArr [CsPi]org = 0[L] + (1 + kb)[CsPiL] + (1 + kc)[CsPiL2] (140)
[H2O]org = [H2O] + [LmiddotH2O] + [CsPiLmiddotH2O] + [CsPiL2middotH2O] (141)
rArr [H2O]org minus [H2O] = ka[L] + kb[CsPiL] + kc[CsPiL2] (142)
Equations (138) (140) and (142) can be put in a matrix product as follows
[L]org
[CsPi]org[H2O]org minus [H2O]
= A
[L][CsPiL][CsPiL2]
(143)
13 Introduction to Cesium Extraction Equilibrium 91
where A is a 3times3 matrix defined as
A =
1 + ka 1 + kb 2(1 + kc)0 1 + kb 1 + kc
ka kb kc
middot (144)
The resulting [L] [CsPiL] and [CsPiL2] concentrations can then be found by solving
equation (143) to get
[L][CsPiL][CsPiL2]
= Aminus1
[L]org[CsPi]org
[H2O]org minus [H2O]
(145)
where
Aminus1 =1
minusDmiddotB (146)
B =
kb minus kc minuskb(kc + 2) + kc (1 + kb)(1 + kc)minuska(kc + 1) ka(kc + 2)minus kc (1 + ka)(1 + kc)ka(kb + 1) kb minus ka minus(1 + ka)(1 + kb)
(147)
and
D = (1 + ka)(kc minus kb)minus ka(1 + kb)(1 + kc) (148)
The unbonded water concentration calculations are shown later on in this section
Other species concentration can be derived directly from the ka kb and kc values as
shown by equations (133) through (136)
Determination of ka and k
The molar fraction of water molecules bonded to the ligand k is defined by
k =[LmiddotH2O]
[L]+[LmiddotH2O](149)
13 Introduction to Cesium Extraction Equilibrium 92
Because of equilibrium (123) the unbonded water concentration in the organic phase
([H2O]) is independent of the other species dissolved and thus independent of the
[LmiddotH2O][L] ratio and k
When no cesium picrate is added to the solution the material balance is
[H2O]org = [H2O] + [LmiddotH2O] (150)
[L]org = [L] + [LmiddotH2O] (151)
Combining the material balance relations (150) and (151) with equation (149) the
linear relation
[H2O]org = k[L]org + [H2O] (152)
can be derived According to this equation a linear plot of [H2O]org versus [L]org
should give the value of k as the slope and the unbonded water concentration that
is constant and is independent of the other dissolved species as the y-axes intercept
Replacing [LmiddotH2O] by ka[L] using equations (133) and (136) in equation (149) leads
us to determine the relationship between k and ka from
k =ka
1 + ka
(153)
or
ka =k
1minus k(154)
Determination of the Constants kb and kc
The constants kb and kc are respectively dependent on the concentrations of the
CsPiL complex and on the CsPiL2 ldquosandwichrdquo which are used to calculate K2 There-
13 Introduction to Cesium Extraction Equilibrium 93
fore the correct values of kb and kc are the one for which K2 is constant for a large
set of data As a consequence values of the constants kb and kc were calculated
by minimizing the standard deviation on the equilibrium constant K2 for different
concentrations in ligand (from 005 to 040 molmiddotLminus1) and in cesium picrate (up to 012
molmiddotLminus1)
133 Results and Discussion
The total water versus cesium picrate concentration in the organic phase for different
ligand concentrations is shown in Figure 119 Since unbonded cesium picrate is
insoluble in the organic phase all the cesium picrate in these experiments is bonded
As expected the total water concentration in the organic phase decreases when the
cesium picrate concentration increases Indeed the cesium picrate is captured inside
the crown ether cavity instead of water There is then less water than can be carried
out from the water phase to the organic phase by crown ether
000
005
010
015
020
025
030
035
040
000 002 004 006 008 010 012
[H2O
] org
(m
olL
)
[CsP]org (molL)
[L] = 040 M[L] = 030 M[L] = 020 M[L] = 010 M[L] = 005 M
Figure 119 Total cesium picrate concentration versus water concentration in theorganic phase for different initial ligand (L = DCH18C6) concentrations (from 005to 04 molmiddotLminus1)
13 Introduction to Cesium Extraction Equilibrium 94
The y axis intercept value for each ligand concentration in Figure 119 gives the
water concentration in the organic phase when no cesium picrate is added to the
solution A plot of this value versus the ligand concentration is shown on Figure 120
000
005
010
015
020
025
030
035
040
00 01 02 03 04 05
[H2O
] org
(m
olL
)
[L]org (molL)
Figure 120 Total water concentration versus total ligand concentration in the organicphase
The constant unbonded water concentration in the organic phase is found to be
007 plusmn 001 molmiddotLminus1 using the linear regression on the data shown in Figure 120
and equation (152) This value is in good agreement with the experiment and with
another calculation made in section (121) on page 75 that involved different crown
ethers and water equilibrium in chloroform The equation (152) also gives the molar
fraction of water molecules bonded to the ligand (k) It is found to be 73 plusmn 4 and
confirms the value found in section (122) for DC18C6 (70) Therefore about 30
of water in solution is not bonded to the crown
The equilibrium constant Ka was found via equation (136) and (154) to be equal
to 38 plusmn 13 L middotmolminus1 This result is in accordance with the previous study in section
(121) where Ka (named K in section (121)) was equal to 32 plusmn 3 Lmiddotmolminus1
13 Introduction to Cesium Extraction Equilibrium 95
The equilibrium constant Kc was found to be equal to zero Therefore there
is no sandwich between two crown ethers and one cesium picrate when the water
is involved The only sandwich forms in the organic phase are not complexed with
water
The equilibrium constant Kb was found to be equal to 21 plusmn 7 L middotmolminus1 Thus the
111 complex between crown ether water and cesium picrate is preferred to the one
without water
The equilibrium constant K2 was found to be equal to 47 plusmn 15 L middot molminus1 This
last result implies that when no water is involved in the complexion process the
sandwich form between two crown ethers and one cesium picrate is preferred than
the 11 complex between one crown ether and one cesium picrate
Conclusion
In this section the cesium picrate-water-crown ether interactions were fully described
using chloroform as a solvent The importance of the role of water in the solvent
extraction of cesium was demonstrated The molar fraction of water bonded to the
ligand (DCH18C6) k was calculated from the measured data and found to be 73 plusmn
4 This result confirms the value calculated in the study of the crown etherndashwater
interaction in chloroform without cesium picrate (ie 70 plusmn 4 in section 122 page
77) This result implies that there is only 30 of the water that is not bonded in the
organic phase
Cesium extraction was described using four equilibrium reactions The calculation
of the equilibrium constants leads to three conclusions
1 The sandwich configuration in between two crown ether and one cesium picrate
is not possible if water is part of it
2 The onendashtondashone complex of the cesium picrate with the crown ether is preferred
with water than without
13 Introduction to Cesium Extraction Equilibrium 96
3 the ldquosandwichrdquo configuration is preferred to the onendashtondashone complex when no
water is involved
It was also observed that the amount of water in the organic phase decreases with
the increase of the cesium picrate concentration (Figure 119) It seems that the water
is competing with crown ether to be carried out of the water phase The efficiency of
the extraction might be enhanced in a ldquowaterndashfreerdquo extraction
For future consideration additional experiments need to be performed in super-
critical CO2 to find out if cesium extraction is efficient enough and confirm the fea-
sibility of large scale plants to extract cesium from spent nuclear fuel (SNF) or clean
large contaminated areas
Conclusion 97
Conclusion
In this chapter the interaction between water and crown ethers was studied in sub and
supercritical CO2 and in organic solvents that have physical properties comparable to
the ones of CO2 Two different spectroscopies were used to describe these interactions
First the FT-IR spectroscopy used in CO2 and second the NMR spectroscopy used
in organic solvents These two spectroscopies have their specific advantages and
drawbacks The FT-IR spectroscopy is a simple and affordable technique and most
chemical laboratories possess a FT-IR spectrometer The interpretation of a FT-IR
spectrum can shed light on the bonds involved in a chemical system On the other
hand NMR is very accurate in regard to the qualitative and quantitative analysis
and its spectrum interpretation is straightforward However it is an expensive device
that is complex to operate and because of these reasons it is not as easily usable as
FT-IR in a non-conventional way The versatility of the FT-IR technique allows the
conduct of experiments in supercritical fluids that were not possible to perform with
our NMR equipment
First the crown etherndashwater interaction were studied in supercritical CO2 and
then in solvents that have a low dielectric constant and that are believed to have
solubility parameters in the same magnitude as the one of CO2 Carbon tetrachloride
and chloroform were selected as solvents and to investigate their properties mixtures
of these two solvents at different volume ratios were used It was demonstrated that
regarding the equilibrium constant K and the molar fraction of ligand complexed
with water k CO2 acts like a solvent with high dielectric constant at low temperature
and pressure and its behavior gets closer to the one of CCl4 when temperature and
pressure increase On the other hand with regards to the solubility of water in the
CO2 phase (amount of free water) it is the opposite That is the solubility increases
with an increase in temperature and pressure in the same manner it increases as the
dielectric constant of the solvent increases
Conclusion 98
Finally experiments were conducted with cesium and the important role of water
in the extraction process was demonstrated No sandwich can be formed between
two crown ethers and a cesium picrate with water bonded to it Conversely the 11
complex seems to be preferred with water The amount of water tends to increase
with an increase in the concentration of the ligand in the organic phase because the
ligand carries water into the oil It was also observed that the amount of water in
oil decreases with the increase of the cesium picrate concentration Therefore the
efficiency of the extraction might be enhanced if the water is removed from the sample
Indeed water competes with cesium for space in the crown ether cavity in which they
are carried into the organic phase
More experiments need to be performed in supercritical CO2 to ascertain whether
cesium extraction is efficient enough to build a large scale plant to reprocess spent
nuclear fuel (SNF) or to be able to clean large contaminated areas For the SNF
retreatment a cesium extraction plant could be combined to a uranium extraction
plant using a PUREX (Plutonium Uranium Recovery by Extraction) like process in
supercritical CO2 Using the fact that CO2 is a tunable solvent such a plant could
also be used to extract and separate other radioactive elements reducing the risk
and the cost of having several extraction plants The next chapter will describe the
feasibility of supercritical CO2 processes for the extraction of uranium
Chapter 2
TriButyl PhosphatendashWaterndashNitricAcid Interaction
Introduction
This chapter is focused on the most important constituent of various nuclear waste
uranium This study complements and benefits from the previous chapter where the
supercritical fluid extraction (SFE) of cesium was investigated and the role of the
water in this extraction was detailed Nitric acid and TriButyl Phosphate (TBP)
complexes are used as oxidizing agent and ligand to extract uranium in supercritical
CO2 The antisolvent effect is observed when the TBPndashwater and the TBPndashnitric
acidndashwater adducts are dissolved in a solvent This effect was investigated in order
to have a better understanding of the mechanism of the extraction I conclude this
chapter by presenting a practical application TBPndashnitric acidndashwater adducts were
used for the supercritical fluid extraction of uranium from incineration ash of the
byproduct of the nuclear fuel production However before describing my research
work in more detail I will present a brief background on solvent extraction and
especially on the PUREX (Plutonium Recovery by Extraction) process on which the
supercritical extraction of uranium is based
Numerous physical and chemical processes have been envisaged to separate repro-
cess and recycle spent nuclear fuel and nuclear waste Some thought to use neutrons
absorption to transmute highly radioactive isotopes to stable or fast decaying ones
100
but this costly method has not been proven viable yet and has many drawbacks Oth-
ers thought of chemical processes to separate radioisotopes that can be reprocessed
and recycled The first chemical process used in a large scale plant (1945 Hanford
Washington State USA) was the bismuth phosphate process10 which is designed to
precipitate the plutonium with bismuth phosphate This process was abandoned
in the late forties for solvent extraction processes because it had too many steps
generated a large amount of waste and required a succession of dissolutions and pre-
cipitations that cannot be automated in a continuous way Solvent extraction has
the advantage of reprocessing both uranium and plutonium in a continuous way The
first large-scale plant that used solvent extraction was built by GE (General Electric
company) at Hanford in 1951 This plant used the Redox process which consists of
salting the aqueous solution containing the waste with aluminum nitrate and using
2-hexanone as an extractant for uranyl and plutonyl nitrate This plant was replaced
with a PUREX (Plutonium Recovery by Extraction) plant in 1956 after it was suc-
cessfully used by the DuPont company in Savannah River (South Carolina State
USA) plutonium production plant The Purex process uses nitric acid as a oxidizing
agent and TBP (TriButyl Phosphate) and kerosene as an extractant This process is
still the most commonly used nowadays and I will describe it in more details later
but first I will describe the properties of TBP
TBP is a molecule that has three butyl ether groups attached to the phosphorus
atom which is also double-bonded to a single oxygen atom Recent molecular dy-
namics studies shown that this single oxygen can be hydrogen bonded to water or
nitric acid6364 Indeed the oxygen of the P=O bond in TBP is very electronegative
making TBP a Lewis base that can be engaged in hydrogen bonding with water or
other lewis acids like nitric acid Figure 21 shows one possible configuration of hy-
drogen bonds between a TBP a nitric acid and a water molecule TBP is a colorless
liquid at room temperature (boiling point is 289 C at normal pressure65) it is almost
non-volatile and it is non-miscible with water (solubility in water at 25 C = 039
101
gmiddotLminus1) It does not react with nitric acid it is stable under high level of radiation
and it is miscible with common organic solvents such as kerosene dodecane alcohol
acetone chloroform and carbon dioxide26
Figure 21 One of the possible configurations of hydrogen bonds between a TBP anitric acid and a water molecule
Figure 22 (simplified from a schematic drawing in ldquoNuclear Chemical Engineer-
ingrdquo13) describes the principal steps for the Purex process First the matrix contain-
ing the uranium and the plutonium which can be spent nuclear fuel or other waste
needs to be prepared for the dissolution This preparation the so-called decladding
is used when the matrix is cladded which is common for spent nuclear fuel it consists
of opening the cladding with mechanical and chemical methods This preparation
will allow the dissolution of the matrix which is the second step The matrix is dis-
solved in hot nitric acid Nitric acid is used to oxidize the uranium to an oxidation
state VI Both of these steps produce radioactive gases and mostly NOx that can be
converted to nitric acid and recycled After the dissolution the remaining cladding
hulls are discarded and the acidity of the feed solution is adjusted to a desirable
value For the primary extraction a mixture of TBP (30 by volume) and kerosene
102
is added to the nitric acid solution and the uranium and the plutonium are separated
from the other water soluble contaminants After the primary decontamination the
plutonium is separated from the uranium by reducing the plutonium(IV) to pluto-
nium(III) which is not soluble in the organic phase Both uranium and plutonium
nitrates are thereafter purified separatly using a succession of solvent extractions
The aqueous solutions are finally evaporated and the uranium and the plutonium
nitrates are converted to their oxide form by calcination
The Purex process has numerous advantages the volume of waste is low compared
to preceding methods and the salting agent (HNO3) can be removed by evaporation
TBP is less volatile and flammable than hexanone and the cost of operation is low
Nevertheless the process needs kerosene or dodecane in large volume These solvents
are flammable toxic for the environment and cannot be easily recycled therefore the
use of carbon dioxide which can be released in the atmosphere after the extraction
will add a real plus to the process Furthermore the physical properties of super-
critical CO2 can enhance the extraction efficiency especially when the extractants
are deeply bonded to the matrix and when the Purex process is not efficient In this
chapter I will demonstrate the efficiency of uranium extraction for a pilot plant in
which the uranium is extracted from ash (incineration of byproduct of the manufac-
ture of UO2 pellets) using a TBP-nitric acid solution in supercritical CO2 but before
that I needed to present a study of the TBP-water-nitric acid complex in supercritical
CO2 and in solvents using FT-IR and NMR
Some compounds are more soluble in one solvent than in another therefore when
a change of solvent occurs to a chemical system the solute can precipitate out of the
system This phenomenon has been used for a long time for example to precipitate
the soap after the saponification process and it is called the salting-out effect The
changes in the solvent can be induced by the addition of a poor solvent for the solute
or by the addition of a salt very soluble in the solvent When this technique is used
in supercritical fluids it is called the antisolvent effect and it is induced by a change
103
of pressure or temperature and therefore a change in solubility of the fluid
When the TBP-water complex is diluted in a solvent like CO2 or CDCl3 some
water droplets appear immediately due to the anti-solvent effect Some nitric acid
droplets at different concentrations are also observed when the TBP-nitric acid com-
plex is used It is believed that these droplets improve the extraction of uranium with
CO2 over the traditional Purex process by improving the dissolution and oxidation
of uranium dioxide In this chapter this phenomenon is quantified by using FT-IR as
an analytical device in super- and sub-critical CO2 This study was then compared to
the one using proton NMR spectroscopy in organic solvents Last I demonstrate the
efficiency of uranium extraction for a pilot plant where the uranium is extracted from
the ash which is the product of the nuclear fuel fabrication waste using a TBP-nitric
acid solution in supercritical CO2
104
Figure 22 Principal steps of the Purex process
21 Interaction of Tributyl Phosphate with Water
Introduction
In this section an investigation of the interaction between TBP and water in different
solvents is presented The knowledge of this interaction is important as a first step to
have a better understanding of the interaction between TBP water and nitric acid in
the uranium extraction process For this process TBP-nitric acid-water complexes
are mixed with CO2 to oxidize uranium(IV) to its hexavalent state and to extract
it into the CO2 phase When one of these TBP complexes is mixed with a solvent
having a low dielectric constant some micro-droplets appear due to the antisolvent
effect The amount and acidity of these droplets are believed to play important role in
the extraction of uranium with supercritical CO2 This phenomenon is also observed
when a TBP-water complex is diluted in an organic solvent such as chloroform or
liquid and supercritical CO2 To study this effect the interaction of TBP and water
was studied in supercritical and liquid CO2 and in chloroform
211 Interaction of Tributyl Phosphate with Water in Super-critical CO2 Analyzed by Fourier Transform Infra-RedSpectroscopy
This first part of the section is devoted to describing the TBP-water interaction in
sub- and supercritical CO2 The FT-IR spectroscopy was used as an analytical tool
Experimental Work
The experiment setup including the protocol the cell the spectrometer and the FT-
IR settings are the same as described in chapter 111 on page 58 As mentioned
previously D2O was used instead of H2O because strong CO2 absorption peaks be-
tween 3500 and 3800 cmminus1 are overlapping the H2O signal
Tributyl Phosphate or TBP (ge 99 purity) and D2O (100 D 9996 pure)
were purchased from Aldrich Chemical Co and used without further purification
21 Interaction of Tributyl Phosphate with Water 106
CO2 (purity ge 9999) was obtained from Scott Speciality Gases Inc
A series of mixtures composed of a fixed D2O concentration (0054 molmiddotLminus1) and
variable TBP concentrations (from 004 to 016 molmiddotLminus1) were used to study the
nature of TBP-water hydrogen bonding in liquid and supercritical CO2 Each solution
was introduced in the cell with a syringe before the addition of CO2 The pressure
and temperature of CO2 were controlled in order to record the first spectrum at the
lower density The density was then increased by lowering the temperature (from 70
to 25 C) before increasing the pressure (from 200 to 40 MPa) In this manner a set
of spectra was recorded at different densities for each solution
Peak Assignments
The FT-IR spectra of free and bonded D2O at different TBP concentrations (0-016
molmiddotLminus1) and at one fixed D2O concentration (0054 molmiddotLminus1) in supercritical CO2
(40 C 20 MPa) is shown on Figure 23 The peak assignments for those spectra is
based on the one made for the crown ether-water interaction in CO2 detailed in my
published paper ldquoAn FT-IR study of crown ether-water complexation in supercritical
CO2rdquo which is reproduced here as appendix F
The spectrum of pure D2O (ie without any TBP) gives directly the position of
the free water peaks the O-D stretching asymmetric peak is at 2761 cmminus1 whereas
the symmetric one is at 2654 cmminus1 Those values are in agreement with the ones
found in the literature3555 When TBP was added to the system an additional peak
appeared between 2730 and 2732 cmminus1 This peak corresponds to the unbonded O-D
stretching vibration marked as (2) in Figure 24 Unlike the case in the crown-ether-
water spectrum we cannot observe any peak for the bonded O-D stretching vibration
marked as (1) on Figure 24 the TBP might have a different effect on this bond than
crown ether and its peak might have shifted and became superposed on a stronger
peak from which it could not be distinguished
At higher TBP concentration an additional peak appears at 2560 cmminus1 This
21 Interaction of Tributyl Phosphate with Water 107
000
001
002
003
004
005
006
2500 2550 2600 2650 2700 2750 2800
Abs
orba
nce
(au)
wavenumber (cm-1)
0 molL-1
004 molL-1
008 molL-1
016 molL-1
Figure 23 FT-IR spectra of free and bonded D2O at different TBP concentrations(0-016 molmiddotLminus1) and at one fixed D2O concentration (0054 molmiddotLminus1) in supercriticalCO2 (40 C 20 MPa)
Figure 24 Possible configurations of the hydrogen bond between a D2O and a TBPmolecule
21 Interaction of Tributyl Phosphate with Water 108
Figure 25 Possible configurations of the hydrogen bond between a D2O and twoTBP molecules
peak is at the same wavenumber as the double hydrogen bond in the crown ether-
water study I therefore believe that it is due to the formation of a complex between
2 TBP molecules and one water molecule as represented in Figure 25
Theoretical Calculations
The equilibrium between water and TBP can be described as the equilibrium between
water and crown ether detailed in the paper ldquoAn FT-IR study of crown ether-water
complexation in supercritical CO2rdquo reproduced as appendix F page 183 At low TBP
concentration where there is no significant amount of a 21 complex between TBP
and water the equilibrium is
TBP + D2O TBPmiddotD2O (21)
From this equilibrium the equilibrium constant K can be defined from
K =[TBPmiddotD2O]
[D2O][TBP]middot (22)
The molar fraction of the TBP complexed to water k is defined as
21 Interaction of Tributyl Phosphate with Water 109
k =[TBPmiddotD2O]
[TBPmiddotD2O] + [TBP]middot (23)
The molar enthalpy of the hydrogen bond (∆H) can be determined from the
measurements of the equilibrium constant at different temperatures and at constant
pressure via the well-known thermodynamic relations
(part∆G
partT
)P
= minus∆S =∆Gminus∆H
T (24)
∆G0 = minusRT ln K (25)
and (part ln K
part(1T )
)P
= minus∆H
Rmiddot (26)
T is the absolute temperature in K ∆S is the entropy in Jmiddotmolminus1middotKminus1 ∆G is the
Gibbs free energy in Jmiddotmolminus1 and R is the molar gas constant in JmiddotKminus1middotmolminus1
Equilibrium Parameters
The results of this study are summarized in Table 21 These results show that
the changes in the values of the equilibrium constant K the molar fraction of water
bonded to the TBP (k) and the amount of free water are small when the temperature
and pressure of the CO2 change Nevertheless the changes are sufficient to observe
trends as the different graphs show
In Figure 26 the density effect on the equilibrium constant K at constant tem-
perature and at constant pressure is shown When the pressure increases from 20 to
40 MPa K decreases from 12 to 10 Lmiddotmolminus1 On the other hand when the tempera-
ture decreases from 70 to 31 C K increases from 9 to 14 Lmiddotmolminus1 and drops to 12
at 25 C This unexpected change is certainly due to the change of phase Indeed
CO2 is no more supercritical at 25 C but it is liquid
In the same way the dependence of the molar fraction of TBP bonded to water
k on the density is shown on Figure 27 It is evident that k increases with density at
21 Interaction of Tributyl Phosphate with Water 110
Table 21 Equilibrium parameters for water-TBP interaction in supercritical CO2
Pressure temp density K [D2O]free kMPa C gmiddotLminus1 Lmiddotmolminus1 molmiddotLminus1
200 70 659 9 0025 18200 60 724 10 0024 19200 50 784 12 0022 20200 40 840 12 0021 21200 35 866 13 0021 21200 31 886 14 0020 21200 25 913 12 0021 21350 40 935 10 0024 19400 40 956 10 0024 19400 25 1004 12 0022 20
Typical statistical errors Pressure plusmn 01 MPa Temperature plusmn 1 C Kplusmn 5[D2O]freeplusmn 5 and kplusmn 2
80
90
100
110
120
130
140
060 065 070 075 080 085 090 095 100
K (
Lm
ol-1
)
Density of CO2 (gcm-3)
Figure 26 Density effect on the equilibrium constant K at constant temperature (N40 C) and at constant pressure (H 20 MPa)
21 Interaction of Tributyl Phosphate with Water 111
constant pressure (20 MPa) from 18 to 21 and decreases with density at constant
temperature (40 C) from 21 to 19
180
185
190
195
200
205
210
215
220
060 065 070 075 080 085 090 095 100
k (
)
Density of CO2 (gcm-3)
Figure 27 Molar fraction of TBP bonded to water k versus density at constanttemperature (N 40 C) and at constant pressure (H 20 MPa)
Figure 28 shows the increase of the free D2O concentration from 20 to 25 mmolmiddotLminus1
when the temperature increases from 31 to 70 C In the same way the free D2O con-
centration dependence on the density is shown on Figure 29 the concentration [D2O]
increases from 21 to 24 mmolmiddotLminus1 when the density increases at constant tempera-
ture and decreases from 25 to 20 mmolmiddotLminus1 when the density increases at constant
pressure
From this set of data the molar enthalpy of the hydrogen bond between TBP
and water can be determined using equation (26) and the linear regression of the
plot of ln K versus the inverse of the temperature in Kelvin (Figure 210) The
slope is 111 times 103 K and ∆H is equal to -92 plusmn 06 kJmiddotmolminus1 at 20 MPa with R =
83144 JmiddotKminus1middotmolminus1 This result implies that the process is exothermic as expected
for hydrogen binding Furthermore since the species are more entropically ordered
21 Interaction of Tributyl Phosphate with Water 112
0000
0005
0010
0015
0020
0025
0030
0 10 20 30 40 50 60 70 80
[D2O
] (m
mol
L)
Temperature (eth C)
Figure 28 Concentration of free D2O versus temperature at 20 MPa
0010
0012
0014
0016
0018
0020
0022
0024
0026
0028
0030
060 065 070 075 080 085 090 095 100
[D2O
] free
(m
olL
-1)
Density of CO2 (gcm-3)
Figure 29 Free D2O concentration versus density for at constant temperature (N40 C) and at constant pressure (H 20 MPa)
21 Interaction of Tributyl Phosphate with Water 113
it explains the decrease of the K values wi7th the increase of temperature In other
respects it is important to remember that for this calculation I needed to assume that
∆H is independent of density This result is in accordance with the enthalpies values
for hydrogen bonding in supercritical fluids that are found in the literature353857
20
21
22
23
24
25
26
27
28
28 29 30 31 32 33 34
ln K
1000T
Figure 210 Dependence of ln K on 1000T (T in K) at 20 MPa
Figure 211 shows the dependence of [D2O] on the equilibrium constant K The
amount of free water in CO2 decreases when K increases The dependence appears
to be linear only because the range of the water concentration data is too narrow to
see the curvature as predicted by equation (22)
The Antisolvent Effect
TBP and water make a one-to-one complex when mixed together with the molar
fraction of water bonded to the TBP almost at 100 it was determined by NMR to
be equal to 97 plusmn 2 When this 11 complex is mixed with an organic solvent (like
dodecane chloroform kerozene CO2 etc) some micro-droplets of water precipitate
out of the organic phase because of the antisolvent effect When the micro-droplets
21 Interaction of Tributyl Phosphate with Water 114
0020
0021
0022
0023
0024
0025
0026
80 90 100 110 120 130 140
[D2O
] free
(m
olL
-1)
K (Lmol-1)
Figure 211 Dependence of the free water concentration [D2O] on the equilibriumconstant K
are formed a clouding of the solution is observed Subsequently the droplets grow
in size and agglomerate on the wall of the container The volume of these droplets
can be quantified knowing the molar fraction of TBP bonded to the water and the
solubility of water in the solvent In the preceding experiments the molar fraction
of water bonded to the TBP dropped from nearly 100 to approximatly 20 Some
of the resulting unbonded water will dissolve in the organic solvent This amount of
free water is equal to the solubility limit of water in the solvent The remaining water
will precipitate out of the organic phase In this scenario there is a reservoir of water
unlike in the preceding experiments where the amount of water was fixed at a value
below the solubility limit of water in the supercritical fluid Therefore the values of
the free water found before are not equal to the solubility limit of the water in the
fluid and these values were only used to determined the equilibrium parameters that
are the same in both cases
The solubility of water in CO2 for different temperatures and pressures is reported
21 Interaction of Tributyl Phosphate with Water 115
in table 22 Some values were found in the literature67 whereas others were extrap-
olated from the values in the literature according to the linear regression shown in
Figure 212 The amount of water droplets was determined using the following set of
equations The water and TBP material balance in number of moles is
nD2Otot = nD2Oorg + nD2Oaq + nTBP middotD2Oorg (27)
nTBPtot = nTBPorg + nTBPaq + nTBP middotD2Oorg (28)
(29)
The suffixes ldquototrdquo ldquoorgrdquo and ldquoaqrdquo refer to the total the organic and the aqueous
phase respectively The solubility of TBP in water is very low therefore nTBPaq is
equal to zero and equation (23) can be written as
nTBP middotD2Oorg = k middot nTBPtot (210)
Knowing the solubility of water in the organic phase ([D2O]) the value of nD2Oorg is
found and the volume of the water droplets can finally be found from the number of
mole of water in the aqueous phase which is given by
nD2Oaq = nD2Otot minus nD2Oorg minus k middot nTBPtot middot (211)
Table 22 shows for different pressure and temperatures the solubility of water the
molar fraction of water bonded to TBP k and the amount of micro-droplets formed
when 05 mL of the water saturated TBP is mixed with CO2 in a 10 mL cell For
the two pressure values used (20 and 40 MPa) the amount of droplets was found to
increase when the density increases This is shown in Figure 213 for the pressure
of 20 MPa On the other hand at constant temperature the amount of droplets
decreases when the density increases
Conclusion
I successfully used the FT-IR technique to determine the equilibrium constant and the
molar fraction of water complexed to TBP in CO2 as function of temperature and the
21 Interaction of Tributyl Phosphate with Water 116
Table 22 Antisolvent effect for a water saturated TBP mixed with CO2 at differentdensities
Pressure temp densitya [D2O]maxfree k water dropletsd
MPa C molLminus1 molmiddotLminus1 microL
200 70 16444 0152c 18 -1e
200 60 16444 0136c 19 2200 50 17821 0121b 20 4200 40 19082 0102c 21 7200 35 19671 0094c 21 9200 31 20123 0085b 21 10200 25 20773 0078b 21 11400 40 21724 0136c 19 1400 25 22818 0092b 20 10
a values from NIST Chemistry WebBook56
b values from R Wiebe6
c values extrapolate from R Wiebe6 cf Figure 212d 05 mL of water saturated TBP mixed with CO2 in a 10 mL celle no water droplet formed
000
005
010
015
020
025
030
0 20 40 60 80 100
[H2O
] max
(m
olL
-1)
Temperature (oC)
Figure 212 linear regression of the molar solubility of water67 in CO2 versus thetemperature at constant pressure (20 (N) and 40 (H) MPa)
21 Interaction of Tributyl Phosphate with Water 117
-2
0
2
4
6
8
10
12
14
20 30 40 50 60 70
Wat
er d
ropl
ets
(microL)
Temperature (oC)
Figure 213 Volume of water droplets when 500microL of water saturated TBP is mixedwith CO2 in a 10 mL cell versus the temperature at constant pressure (20 MPa)
pressure of the supercritical fluid I also found the value of the molar enthalpy for the
hydrogen bond between TBP and water (∆H = -92 kJmiddotmolminus1) Most importantly
the FT-IR technique can be used to predict the amount of water droplets produced
by the antisolvent effect when the TBP-water complex is mixed with CO2 This
technique should be used to determine the amount of nitric acid droplets when the
TBP-water-nitric acid complex is added to a solvent Unfortunately nitric acid is
very corrosive and I could not achieve this with the equipment available In order
to overcome this problem the interactions between water TBP and nitric acid are
studied in chloroform using the NMR spectroscopy This study will be presented later
in section 22
21 Interaction of Tributyl Phosphate with Water 118
212 Interaction of Tributyl Phosphate with Water in Sol-vent Analyzed by Nuclear Magnetic Resonance Spec-troscopy
In this section the TBP-water interaction is detailed using the Nuclear Magnetic
Resonance spectroscopy (NMR) in a conventional solvent like chloroform The results
obtained are compared to the one of the previous section where the same interaction
was studied in CO2 using the Fourier Transform Infra-Red spectroscopy (FT-IR)
Experimental Work
TBP (98 purity) was purchased from Avocado Research Chemicals Ltd (ordered
through Alpha Aesar Co) and used with no further purification Chloroform was used
in the deuterated form (999 atom D) and was purchased from Aldrich Chemical
Company
The TBPmiddotH2O adduct was prepared by mixing TBP with water in a glass tube
with a stopper The mixture of TBP and water was manually shaken vigorously for
4 minutes followed by centrifuging for an hour When the remaining organic phase
is mixed with a solvent like CDCl3 some water droplets appear In order to quantify
this phenomenon a study of the interaction between TBP and water in CDCl3 was
carried out using different dilutions of TBP in CDCl3 These solutions were mixed
with an equal volume of water shaken for 3 hours and centrifuged for another hour
The remaining organic phase was taken for analysis Longer mixing and centrifuging
times were tried without any significant changes in the data
Proton NMR (PNMR) measurements were carried out using a 300 and a 500
MHz Bruker spectrometer The pulse interval was set to 5 sec (acquisition time 3 sec
relaxation delay 2 sec) and 32 scans were taken Chemical shifts were calibrated by
using an insert filled with benzene-d6 (purchased from Aldrich Chemical Company)
as an external standard Benzene-d6 chemical shift was settled to 715 ppm A typical
PNMR spectrum of TBPmiddotH2O dissolved in CDCl3 can be seen in Figures 214 The
21 Interaction of Tributyl Phosphate with Water 119
Figure 214 300MHz 1H-NMR spectra of TBPmiddotH2O in CDCl3
21 Interaction of Tributyl Phosphate with Water 120
total water concentration in the organic phase [H2O]0org can be determined directly
from the integrated intensity of the water peak observed in these spectra These
intensities are calibrated on the TBP and CHCl3 peaks for which the concentrations
are known The nonlinear regression and curve fitting analysis were performed using
the NRLEG ( Phillip H Sherrod) program
Theoretical Calculations
Chemical Shifts It is well known that the observed chemical shift δH2O of a fast
exchange between various sites forming n different species is given by
δH2O =nsum
i=1
δiχi (212)
where δi is the chemical shift of the specie i and χi is its molecular fraction
TBPWater Interaction in an Organic Phase A binary system composed of
a ligand (TBP) and water forming an one-to-one hydrate in the organic phase can be
modeled by the following chemical equations
H2Oaq H2Oorg (213)
TBPorg TBPaq (214)
H2Oorg + TBPorg TBPmiddotH2Oorg (215)
where the subscript ldquoorgrdquo defines the organic phase that contains water TBP and
CDCl3 and the subscript ldquoaqrdquo defines the aqueous phase The partition coefficient
for TBP can be determined from equation (214) by the following relation
D1 =[TBP]aq[TBP]org
(216)
The solubility of TBP in water is very low (15 times 10minus3 molmiddotLminus1) compared to the
solubility in CDCl3 (024 molmiddotLminus1) For this reason the D1 value was considered as
21 Interaction of Tributyl Phosphate with Water 121
nil in all our experiments The equilibrium constant K is defined by
K =[TBPmiddotH2O]org
[TBP]org[H2O]org(217)
In addition k the molar fraction of ligand molecules complexed to water is written
as
k =[TBPmiddotH2O]org
[TBP]org + [TBPmiddotH2O]org=
K[H2O]org1 + K[H2O]org
(218)
There are two ways to determine the initial ligand concentration [TBP]0ini First the
total amount introduced during the sample preparation can be calculated and second
by material balance at equilibrium
[TBP]0ini = [TBP]org + [TBPmiddotH2O]org + [TBP]aq (219)
The term [TBP]aq is negligible considering that the TPB solubility in water is very
low Therefore
[TBP]0org = [TBP]org + [TBPmiddotH2O]orgmiddot (220)
The water concentration in the organic phase [H2O]0org can also be defined by material
balance at equilibrium
[H2O]0org = [H2O]org + [TBPmiddotH2O]org (221)
Combining the material balance relations (219) and (220) with equation (217) the
linear relation
[H2O]0org = k [TBP]0org + [H2O]org (222)
can be derived According to equation (222) it is easy to determine the free water
concentration [H2O]org and the k value by a plot of [H2O]0org versus [TBP]0org From
these data and equation (218) the equilibrium constant K is obtained
Results and Discussion
Peak Assignment Different concentrations of TBP (up to 18 molmiddotLminus1) in CDCl3
were mixed in equal volume with H2O and analyzed by NMR A typical proton
21 Interaction of Tributyl Phosphate with Water 122
Table 23 intensities and coupling constants of the TBP multiplets
multiplet δ (ppm) Intensities Coupling constants
quartet 397 11 29 30 11 671 671 671quintet 156 13 38 60 43 12 672 732 733 671sextet 131 13 54 100 96 52 12 731 732 794 732 733triplet 083 12 20 12 732 733
NMR spectrum taken at 300 MHz of TBPmiddotH2O dissolved in CDCl3 can be seen in
Figure 214 The CHCl3 peak is a singlet that was calibrated at 724 ppm The water
droplets should appear at 47 ppm because it corresponds to the chemical shift of
water in water Unfortunately the peak is not visible on this spectrum The total
water in oil peak varies from 152 to 310 ppm depending on H2O concentration in
the organic phase in Figure 214 it is at 216 ppm Finally the TBP peaks are at
084 132 160 and 393 ppm An enlargement of these TBP peaks taken from a
500MHz spectrum is shown in Figure 215 and the intensities and coupling of each
multiplet is shown in Table 23 The three butyl ether groups are equivalent in the
TBP molecule For this reason and to simplify the peak assignment I will describe
only the branches numbered in Figure 216
The triplet at 08 ppm has an intensity environ 50 larger than the other peaks
which indicates that it is associated with the hydrogens of the methyl group (carbon
4 in Figure 216) The quartet at 40 ppm is at higher ppm certainly because it
is partially deshielded by the oxygen However there is no hydrogen coupled to
three other hydrogens in the TBP molecule and for this reason no quartet should
appear However the phosphorus (31P) has the same spin quantum number than the
hydrogens (12) and a heteronuclear coupling is possible between the proton and the
phosphorus This quartet corresponds therefore to the hydrogens of the carbon 1 in
Figure 216 Finally there is a quintet and a sextet at 16 and 13 ppm) The protons
associated with the the quintet can ldquoseerdquo four hydrogens whereas the ones associated
21 Interaction of Tributyl Phosphate with Water 123
05
10
15
20
25
30
35
40
ppm
Figure 215 Enlargement of a 500MHz 1H-NMR spectra of TBPmiddotHNO3middotH2O inCDCl3
21 Interaction of Tributyl Phosphate with Water 124
Figure 216 Possible configuration for the TBP hydrate
with the sextet can ldquoseerdquo 5 protons Consequently the protons of the quintet belong
to the carbon 2 and the ones of the sextet belong to the carbon 3 in Figure 216
Water Chemical Shift The water in the system studied is in fast exchange be-
tween its free state and the state where it is bonded to TBP Because a NMR spectrum
needs several seconds to be recorded the spectrum shows the average value of the
two states instead of each of them separately Therefore the H20 and the TBPmiddotH2O
peaks are combined in one peak and its chemical shift δH2O follows the equation
δH2O = δ0χH2O + δ1χTBP middotH2O (223)
which is derived from equation (212) where δH2O is the observed chemical shift for
water and δ0 and δ1 are the water chemical shift in 100 CDCl3 and 100 TBP
respectively The molar fractions χH2O and χTBP middotH2O are defined as follows
21 Interaction of Tributyl Phosphate with Water 125
00
05
10
15
20
25
30
35
00 02 04 06 08 10
δ H2O
(pp
m)
χi (i=H2O or TBPH2O)
f(χH2O)f(χTBPH2O)
Figure 217 Chemical shift observed of water in CDCl3 and in TBP versus themolecular fractions of free water (H) and of bonded water (N) The dashed linescorresponds to their linear regression fits
χH2O =[H2O]org
[H2O]0org(224)
and
χTBP middotH2O =[H2O]0org minus [H2O]org
[H2O]0org(225)
In Figure 217 the plot of the observed water chemical shift δH2O versus the molar
fraction of free water χH2O is shown for different water and TBP concentrations in
CDCl3 This plot shows that δH2O increases linearly when the molar fraction of free
water rises The linear regression on this plot allows the determination of δ0 = 151 plusmn
004 ppm which corresponds to where the fitted line intersects with the ordinate In
the same figure the plot of δH2O versus the molar fraction of bonded water χTBP middotH2O
is shown for the same set of data Similarly the fitted line intersects with the ordinate
at 351 plusmn 004 ppm which corresponds to the value of δ1
In Figure 218 the observed chemical shift δH2O is plotted versus the total water
21 Interaction of Tributyl Phosphate with Water 126
00
05
10
15
20
25
30
35
000 005 010 015 020 025 030 035 040
δ H2O
(pp
m)
[H20]0org (molL)
Figure 218 Chemical shift observed (black points) and calculated (thin line) of waterin CDCl3 and in TBP versus total water concentration in the organic phase
concentration in the organic phase [H2O]0org The shift δH2O increases rapidly until
the total water concentration in the organic reaches 013 molmiddotLminus1 At higher water
concentration the increase slows down and plateaus to an asymptotic value below 36
ppm The dependency of δH2O on [H2O]0org can be obtained using equations (223)
(224) and (221) which are combined to give the following
δH2O =δ0[H2O] + δ1([H2O]0org minus [H2O]org)
[H2O]0org (226)
where δ0 and δ1 are the constants previously determined and [H2O]org = 007 plusmn 002
molmiddotLminus1as demonstrated in the paragraph describing the chemical equilibrium later
in this section (page 128) The plot of the calculated values of δH2O versus [H2O]0org
as given by equation (226) is shown in Figure 218
Chloroform Chemical Shift There is some weak hydrogen bonds between TBP
and CDCl3 and for the same reasons as the ones explained previously the chemical
shift between pure chloroform and chloroform mixed with TBP varies slightly de-
21 Interaction of Tributyl Phosphate with Water 127
70
72
74
76
78
80
00 05 10 15 20
δ CH
Cl 3 (
ppm
)
[TBP] (molL-1)
Figure 219 Chemical shift observed of CHCl3 in TBP and in CDCl3 versus the TBPconcentration in the organic phase
pending on the TBP concentration66 The dependency of the chloroform chemical
shift δCHCl3 on the TBP concentration was studied using the same set of spectra as
previously A plot of these results is represented in Figure 219 The chemical shift
is shown to increase slowly when the TBP concentration in CDCl3 increases
From this same set of results the chemical shift of pure chloroform δ2 and the
one of chloroform dissolved in TBP with 11 ratio δ3 can be found using the relation
δCHCl3 = δ2χCHCl3 + δ3χCHCl3middotTBP (227)
which is derived from equation (212) The δ2 value was calculated at 727 plusmn 003
ppm as expected because it corresponds to the chemical shift of CHCl3 in CHCl3
On the other hand δ3 is equal to 920 plusmn 003 ppm This is an obvious but important
result Indeed one can set the CHCl3 chemical shift at its right value depending on
TBP concentrations in CDCl3 and use it as a chemical shift reference without having
to use any additives like TetraMethylSilane (TMS)
21 Interaction of Tributyl Phosphate with Water 128
000
005
010
015
020
025
030
035
040
00 02 04 06 08 10 12 14 16 18
[H2O
]0 org
(mol
L)
[TBP]0org (molL)
Figure 220 Total water ([H2O]0org) versus total TBP ([TBP]0org) in the organic phase
Chemical Equilibrium The plot of total water concentration [H2O]0org versus
the total TBP concentration [TBP]0org is represented in Figure 220 The total water
concentration is shown to increase as the total TBP concentration increases This was
expected because TBP forms a strong hydrogen bond with water therefore increasing
the total water solubility in the organic phase when the TBP concentration increases
The free water concentration in CDCl3 [H2O]org can be determined using equation
(222) According to this equation the linear regression of the plot of [H2O]org versus
the total TBP concentration intersects with the ordinate at the value of the free
water concentration [H2O]org = 007 plusmn 002 molmiddotLminus1 This result is consistent with
the value of the solubility of water in CHCl3 found in the previous study of the crown
ether-water interaction in CDCl3 detailed in section 121 page 75 and section 133
page 94
The molar fraction of TBP complexed to water in CDCl3 k can also be obtained
from equation (222) It corresponds to the slope of the linear regression of [H2O]0org
21 Interaction of Tributyl Phosphate with Water 129
versus the total TBP concentration (Figure 220) In this study k was found equal
to 015 plusmn 001 The remaining water which amounts to 85 of the total is released
in the form of fine droplets when the water-saturated TBP solution is dissolved in
CDCl3 The amount of micro-droplets of water formed because of the antisolvent
effect can be calculated from the value of k knowing that the water solubility in
pure CDCl3 [H2O]org is 007 plusmn 002 molmiddotLminus1 For this calculation equations (27)
to (211) described in section 211 on page 115 are needed If 05mL of the water
saturated TBP is mixed with chloroform in a 10 mL volumetric viol the volume of
micro-droplets will be 14 plusmn 1 microL
Last the equilibrium constant (K) can be deduced from the value of k by using
equation (218) Its value is K = 27 plusmn 02 Lmiddotmolminus1
Conclusion
This section describes the analysis of the water-TBP equilibrium in supercritical
CO2 using the FT-IR spectroscopy This equilibrium was also analyzed in chloroform
using the NMR spectroscopy The two analytical methods complement each other to
give a complete picture of the equilibrium Significant results include obtaining the
molar fraction of water bonded to TBP k and the equilibrium constants in the oil
phase In CDCl3 k was found equal to 015 plusmn 001 which is lower than the lowest
value obtained in supercritical CO2 (ie 018 plusmn 001 at 70 C and 20 MPa) This
result shows that there is more water bonded to TBP in the supercritical fluid at the
conditions of my experiments In pure CDCl3 the amount of free water [H2O]org
is 007 plusmn 002 molmiddotLminus1and the standardized amount of micro-droplets was found
equal to 14 plusmn 1 microL The amount of micro-droplets formed is at least 3 microL lower in
CO2 considering the experimental conditions used
NMR also gave information on the chemical shift of water and chloroform in the
TBP-water-CDCl3 system They can both be determined theoretically knowing the
TBP concentration
21 Interaction of Tributyl Phosphate with Water 130
The analysis of the experiments discussed in this section is not complete with-
out consideration of adding nitric acid which is essential to the supercritical fluid
extraction of uranium This part will be presented in the next section
22 Interactions with Nitric Acid Analyzed by Nu-
clear Magnetic Resonance
Introduction
The study of TBPmiddot(HNO3)xmiddot(H2O)y adducts comprise an essential step to the under-
standing of the supercritical fluid extraction of uranium Therefore I will describe
first in this section various TBP-water-nitric acid adducts using the Nuclear Magnetic
Resonance (NMR) as a spectroscopic tool
An interesting observation was made when these adducts are mixed with an or-
ganic solvent some micro-droplets of nitric acid immediately appear in the oil due to
the so-called antisolvent effect Throughout this work I came to believe that the acid-
ity and quantity of these micro-droplets enhance the extraction of uranium To have a
better understanding of the formation of these micro-droplets I will describe later in
this section the interactions between TBPmiddot(HNO3)xmiddot(H2O)y adducts and chloroform
Chloroform was selected as a solvent because of its physical properties which are
comparable to supercritical CO2 and because of its non-interference with the NMR
data collection
221 Experimental Work
The experimental work for this section is similar to the one in the study of the TBP-
water interaction by NMR section 212 page 118
TBP (98 purity) was purchased from Avocado Research Chemicals Ltd (ordered
through Alpha Aesar Co) and used with no further purification and chloroform
was used in the deuterated form (999 atom D) and was purchased from Aldrich
Chemical Company Nitric acid (694 (ww) ) was obtained from Fisher Chemical
(New Jersey) and was diluted to 155 molmiddotLminus1 with deionized water
The TBPmiddot(HNO3)xmiddot(H2O)y complexes were prepared by mixing TBP with a 155
molmiddotLminus1 solution of nitric acid in a glass tube with a stopper Different volume ratio
of nitric acid and TBP (from 110 to 61 nitric acid to TBP volume ratio) were
22 Interactions with Nitric Acid Analyzed by NMR 132
prepared Thereafter the mixture was manually shaken vigorously for 4 minutes
followed by centrifuging for an hour The organic phase was then extracted with a
pipette and analyzed When the remaining organic phase is mixed with a solvent like
CDCl3 some water droplets appear In order to quantify this phenomenon a study
of the interaction between TBP and water in CDCl3 was carried out using different
dilutions of TBP in CDCl3 These solutions were mixed with an equal volume of
nitric acid (155 molmiddotLminus1) shaken for 3 hours and centrifuged for another hour The
remaining organic phase was taken for analysis Longer mixing and centrifuging times
were tried out with no significant change in the data
4
5
6
7
8
9
10
0 2 4 6 8 10 12 14 16 18
δ HN
O3 (
ppm
)
[HNO3]ini (molL)
Figure 221 Chemical shift of nitric acid observed from the droplets (H) and fromnitric acid solutions in water (N) and calculated (dashed line) using equation (229)versus total nitric acid concentration
The concentration of H2O in the organic phase was measured by Karl-Fischer
titration (Aquacounter AQ-7 Hiranuma Japan) The concentration of HNO3 in the
organic phase was measured with an automatic titrator (COM-450 Hiranum Japan)
with 01 molmiddotLminus1 NaOH solution after adding large excess amount of deionized water
The concentration of HNO3 in the water droplets was determined by comparison of the
22 Interactions with Nitric Acid Analyzed by NMR 133
chemical shift of different concentrations of nitric acid in water as shown on Figure
(221) and confirmed by titration methods Proton NMR (PNMR) measurements
were carried out using a 500 MHz Bruker DX500 spectrometer The pulse interval
was set to 5 sec (acquisition time 3 sec relaxation delay 2 sec) and 32 scans were taken
Chemical shifts were calibrated by using an insert filled with benzene-d6 (purchased
from Aldrich Chemical Company) as an external standard Benzene-d6 chemical
shift was settled to 715 ppm A typical PNMR spectrum of TBPmiddot(HNO3)xmiddot(H2O)y
dissolved in CDCl3 can be seen in Figures 222 In this spectrum the four groups of
peaks between 1 and 5 ppm belong to the butyl ether groups of the TBP molecule
as describe in detail in section 212 page 121 The peak at 1180 ppm belong to the
nitric acid and the water These two compounds are bonded in different ways to the
TBP and because of the fast equilibrium in between them only one peak shows as
an average of all
00 20 40 60 80 100 120
ppm
Figure 222 A typical proton NMR spectrum of TBPmiddot(HNO3)xmiddot(H2O)y with abenzene-d6 insert The sample was prepared by mixing 10 mL of 155M HNO3 with40 mL of 98 TBP
Finally the nonlinear regression and curve fitting analysis were performed using
22 Interactions with Nitric Acid Analyzed by NMR 134
the NRLEG ( ccopy Phillip H Sherrod) program
222 Results and Discussion
In this part I will describe first the trivial relationship between the chemical shift
of nitric acid in water and its concentration This result allow the determination of
the acid concentration in the micro-droplets formed when TBP complexes are mixed
with a solvent Second I will describe the TBPmiddot(HNO3)xmiddot(H2O)y complex without
solvent In these adducts the values of x and y represent the number of nitric acid and
water molecules per TBP molecule respectively Last I will describe the interaction
between TBP water and nitric acid in chloroform
Chemical Shift of HNO3 in Water
Before studying a more complex system equation (212) on page 120 was used to
determine the chemical shift of the HNO3H2O peak in water depending on nitric
acid concentration For this system
δobs = δ4χHNO3 + δ5χH2O (228)
where δ4 is the chemical shift for pure H3O+ ion and δ5 is the chemical shift for pure
water The water concentration in water was taken at 556 molmiddotLminus1 Equation (228)
can also be written as
δobs = δ4χHNO3 + δ5(1minus χHNO3) = (δ4 minus δ5)χHNO3 + δ5 (229)
where
χHNO3 =[H3O
+]
[H3O+] + 556
middot (230)
According to equation (229) the plot of the linear relationship between δobs and
the nitric acid molecular fraction gives directly the values of δ5 = 476 plusmn 003 ppm
and δ4 = 246 plusmn 02 ppm Figure 221 shows the plot of the chemical shift of nitric
acid in water and the calculated fit using equation (229) versus the total nitric acid
concentration Combining equations (229) and (230) with the calculated values of
22 Interactions with Nitric Acid Analyzed by NMR 135
δ4 and δ5 the acid concentration can be expressed in terms of the observed chemical
shift δobs using the following equation
[H3O+] = 556times 476minus δobs
δobs minus 246middot (231)
This equation can be used to calculate concentration of the acid droplets resulting of
the antisolvent effect with the simple knowledge of their chemical shift
TBPmiddot((HNO3)xmiddot((H2O)y System without Solvent
The values of x and y in the TBPmiddot(HNO3)xmiddot(H2O)y adduct represent the number of
nitric acid and water molecules per TBP molecule respectively The value of x is
calculated by dividing the concentration of nitric acid in the organic phase by the
concentration of TBP In the same way the value of y is calculated by dividing the
water concentration by the TBP concentration
Different concentrations of HNO3 or water in TBP influence the dissolution of
uranium oxides29 For this reason it is important to determine the exact composition
of the TBP complex Figure 223 shows the combined chemical shift of H2O and HNO3
versus the number of molecules of nitric acid per molecule of TBP x The chemical
shift increases rapidly from 89 to 126 ppm when the nitric acid to water mole ratio
increases When this ratio reaches unity the chemical shift reaches its maximum and
starts to decrease slowly to 120 ppm which corresponds to a ratio of 24 molecules
of nitric acid for each molecule of water
Table 24 summarizes the different experiments performed and gives the corre-
sponding values of the nitric acid and water ratio in TBP These values were obtained
using NMR spectra in both organic and aqueous phases in addition to titration meth-
ods
The number of molecules of HNO3 per molecule of TBP x versus the initial
volume ratio of HNO3 (at 155 molL in water) to TBP is shown in Figure 224 When
the initial volume ratio is under unity the value of x increases rapidly as the volume
ratio increases The curve is shown to level at a maximum of 24 corresponding to
22 Interactions with Nitric Acid Analyzed by NMR 136
7
8
9
10
11
12
13
14
15
00 05 10 15 20 25
δ HN
O3
and
H2O
(pp
m)
x = [HNO3]org [TBP]org
Figure 223 Chemical shift observed of nitric acid and water in TBP versus the moleratio of nitric acid on TBP in the organic phase
a concentration of 62 molmiddotLminus1in nitric acid This concentration correspond to the
maximum solubility of HNO3 in TBP These results indicate that TBP as a Lewis
base can carry acids in an organic phase This property can be used to perform
chemical reactions with acids in sub- or supercritical CO2 because acids are generally
not very soluble in CO2
From the same set of data the partition coefficient of HNO3 between the aque-
ous phase and the TBP phase (DHNO3) can be found by plotting [HNO3]aq versus
[HNO3]org according to the following equation
DHNO3 =[HNO3]aq[HNO3]org
middot (232)
The linear regression analysis performed on the data of the nitric acid concentrations
in the aqueous and in the organic phase gives DHNO3 = 24plusmn 08 This result implies
that there is nearly 24 times more nitric acid in the aqueous phase than in the organic
phase when the equilibrium is achieved for an initial concentration of 155 molmiddotLminus1 in
nitric acid
22 Interactions with Nitric Acid Analyzed by NMR 137
Table 24 Composition of TBPmiddot(HNO3)xmiddot(H2O)y complexes
Vol Vol x = y = Molecular ratio forHNO3 TBP [HNO3][TBP]org [H2O][TBP]org TBPHNO3H2O
0 5 0 106 1 0 1105 5 042 083 1 04 081 10 042 074 1 04 071 6 071 073 1 07 071 5 081 042 1 08 041 45 088 046 1 09 051 4 097 041 1 10 041 3 113 036 1 11 041 2 138 040 1 14 041 1 180 044 1 18 042 1 213 054 1 21 053 1 229 048 1 23 056 1 237 053 1 24 07
Initial volume (mL) used for complex preparation with TBP at 98 and HNO3 at155 molmiddotLminus1
Figure 225 shows the mole ratio of HNO3H2O xy in the TBP phase at equi-
librium versus the initial volume ratio of HNO3 to TBP First the xy ratio increases
rapidly when the amount of nitric acid in the organic phase increases then it flattens
out under 5 In the condition of my experiment the mole ratio of nitric acid to water
can not exceed 5 in the TBP phase This maximum ratio is reached rapidly when the
volume ratio of HNO3TBP exceeds unity
When the TBPmiddot(HNO3)xmiddot(H2O)y complex is diluted in an organic solvent the
excess water and nitric acid precipitate out of the organic phase as micro-droplets
due to the antisolvent effect The acidity of these micro-droplets is important because
it is related to the efficiency of extraction of uranium as an example I will therefore
describe next the properties of the TBP complex when it is mixed with chloroform
22 Interactions with Nitric Acid Analyzed by NMR 138
0
05
1
15
2
25
0 1 2 3 4 5 6 7
x =
[HN
O3]
org
[TB
P] o
rg
initial volume ratio of HNO3 (155 molL in water) on TBP
Figure 224 Number of moles of HNO3 in the TBP phase at equilibrium (or x) versusthe initial volume ratio of HNO3 (at 155 molmiddotLminus1 in water) on TBP
0
1
2
3
4
5
6
0 1 2 3 4 5 6 7
xy
= [H
NO
3]or
g[H
2O] o
rg
initial volume ratio of HNO3 (155 molL in water) on TBP
Figure 225 Mole ratio of HNO3H2O in the TBP phase at equilibrium (or xy)versus the initial volume ratio of HNO3 (at 155 molmiddotLminus1 in water) on TBP
22 Interactions with Nitric Acid Analyzed by NMR 139
00 20 40 60 80 100 120
ppm
Figure 226 Proton NMR spectrum of TBPmiddot(HNO3)xmiddot(H2O)y in CDCl3 The complexwas prepared by mixing 4 mL of TBP and 1 mL of 155 molmiddotLminus1 HNO3 volume ratioof TBPmiddot(HNO3)xmiddot(H2O)y to CDCl3 = 11
00 20 40 60 80 100 120
ppm
Figure 227 Proton NMR spectrum of TBPmiddot(HNO3)xmiddot(H2O)y in CDCl3 The com-plex was prepared by mixing 2 mL of TBP and 2 mL of 155 molmiddotLminus1 HNO3 volumeratio of TBPmiddot(HNO3)xmiddot(H2O)y to CDCl3 = 11
22 Interactions with Nitric Acid Analyzed by NMR 140
TBPmiddot(HNO3)xmiddot(H2O)y System in a Solvent
Figures 226 and 227 are two proton NMR spectra of TBPmiddot(HNO3)xmiddot(H2O)y in CDCl3
The first one shown in Figure 226 was recorded after mixing the 11004 complex
at equal volume with CDCl3 The complex (11004) was formed by adding 4 mL of
TBP to 1 mL of nitric acid following the experimental procedure explained in detail in
section 221 (page 131) The second spectrum shown in Figure 227 was made after
mixing the 11804 complex at equal volume with CDCl3 Using the same procedure
as previously the 11804 complex was formed by adding 2 mL of TBP to 2 mL of
nitric acid
In both spectra the peaks of the butyl ether groups belonging to the TBP molecule
are shown between 0 and 5 ppm The singlet peak of nitric acid and water in the
organic phase is the average resonance of bonded to TBP water free water and nitric
acid This peak is observed at 1248 ppm as shown in Figure 226 In Figure 227
the same peak is observed at 1208 ppm This result demonstrates that the chemical
shift of nitric acid and water is shifted upfield when the total concentration in nitric
acid increases in the organic phase
In both spectra two other singlet peaks appear at 648 ppm in Figure 226 and
at 812 ppm in Figure 227 These peaks are due to the micro-droplets of nitric acid
in water that are formed when the TBP complex is mixed with chloroform The
concentration in acid of these droplets can be determined using equation (231) For
the 11004 complex the concentration [HNO3]aq = 52 molmiddotLminus1 whereas for the
11804 complex the concentration [HNO3]aq = 113 molmiddotLminus1 These results show
that the concentration of the nitric acid in the droplets increases when the ratio of
nitric acid to water increases in the TBP complex
Another experiment was performed to study the micro-droplet formation phe-
nomenon in more details For this experiment solutions of TBP at different concen-
trations in chloroform where mixed at equal volume with nitric acid (155 molmiddotLminus1)
NMR spectra of the remaining organic phase were taken and the pH of the aqueous
22 Interactions with Nitric Acid Analyzed by NMR 141
phase was determined using titration methods
80
85
90
95
100
105
110
115
120
00 05 10 15 20 25
δ HN
O3
and
H2O
(pp
m)
[HNO3]org + [H2O]org
Figure 228 Chemical shift of the nitric acid and the water versus total water andnitric acid concentration in the organic phase
In Figure 228 the chemical shift of the nitric acid and the water is plotted versus
the total water and nitric acid concentration in CDCl3 The chemical shift is shown
to increase rapidly until the total concentration reaches 05 molmiddotLminus1 When the
total concentration in acid and water exceeds 05 molmiddotLminus1 the chemical shift increase
flattens out and approaches a plateau at 115 ppm
The plot of the concentration of nitric acid in the aqueous phase [HNO3]aq ver-
sus initial TBP concentration in the organic phase [TBP]ini is shown in Figure 229
The overall trend is for the nitric acid concentration in water to decrease as [TBP]ini
increases However this trend is not monotonic as three stages can be recognized
First [HNO3]aq decrease fast until [TBPini reaches approximately 05 molmiddotLminus1 Sec-
ond the nitric acid concentration in the water stays constant (or increases slightly)
as the TBP concentration increases up to sim1 molmiddotLminus1 Last the [HNO3]aq starts to
decrease again for TBP concentrations higher than unity
The total water and nitric acid concentration in the organic phase is shown to
22 Interactions with Nitric Acid Analyzed by NMR 142
90
95
100
105
110
00 05 10 15 20
[HN
O3]
aq (
mol
L-1
)
[TBP]ini (molL-1)
Figure 229 Concentration of nitric acid in the aqueous phase versus initial TBPconcentration in the organic phase
00
05
10
15
20
25
00 05 10 15 20
[HN
O3]
org+
[H2O
] org
(m
olL
-1)
[TBP]ini (molL-1)
Figure 230 Total water and nitric acid concentration in CDCl3 versus initial TBPconcentration
22 Interactions with Nitric Acid Analyzed by NMR 143
increase linearly with the initial concentration of TBP according to the plot in Figure
230 This kind of linear plot was obtained before where the two values were not linear
An example of it has been given in section 211 page 113 where the dependence of
[D2O] on the equilibrium constant K is plotted In this example the data range was
too narrow to see the curvature predicted by the theoretical equations Therefore I
can not be sure of the linearity of the plot in Figure 230
In the absence of TBP the concentration of water and nitric acid in the organic
phase is the one of free water and nitric acid This free concentration corresponds
to the solubility limit of nitric acid and water in chloroform This value is given
by the y-axis intercept of the plot of the total water and nitric acid in the organic
phase versus the initial concentration of TBP If the relationship in between this two
variables is properly represented as linear the regression of the data shown in Figure
230 gives [HNO3]free + [H2O]free = 001plusmn 008 molmiddotLminus1
Conclusion
In this section the different TBPmiddot(HNO3)xmiddot(H2O)y complexes were first studied with-
out solvent Their composition was determined depending on the initial volume ratio
of TBP and nitric acid at 155 molmiddotLminus1 in water Later the complexes were studied
in chloroform as solvent The formation of micro-droplets of acid due to the antisol-
vent effect was demonstrated using NMR when the TBP complexes were mixed with
chloroform The utility of these complexes will be shown by means of spectroscopy in
the next section (section 23 page 144) for which TBP-water-nitric acid complexes
were used to extract uranium in supercritical CO2
23 Practical Application Uranium Extraction
from Solid Matrices
Introduction
This section describes a practical extension of the present experimental and theoretical
achievements The objectives of this applied research cover not only demonstrating
but also optimizing uranium extraction from ash using supercritical CO2 The differ-
ent uranium-containing ash types that were used originated from the incineration of
byproducts generated in the course of nuclear fuel pellet manufacturing at AREVA
(Framatome-ANP) facilities in Richland and Lynchburg USA My work to develop
and optimize the extraction process was successful to prove the feasibility of a pilot
plant in Richland which is currently under construction
The TBP-nitric acid-water complexes described in detail in the previous sections
were used to oxidize the uranium and as chelating agent The apparatus I constructed
and the different conditions tested to optimize the extraction process will be described
in detail along with the gamma spectroscopy used to quantify the extraction efficiency
The gamma spectroscopy was the main spectroscopic tool used for the experiments
described in this section Gamma rays come from the radiation of nucleus when they
transit from a high energy state to a lower one
A gamma spectrometer is generally composed of a scintillation counter probe
connected to a computer The scintillation probe has a phosphor (generally a sodium
iodide crystal for gamma detection) that emits a flash of light when struck by a
radiation The emitted light is directed to a photo-cathode that produce electrons by
photoelectric effect The electronic signal is then amplified and send to a computer
for analysis The resulting spectrum gives the number of count ie the number of
radiations that hits the probe window versus the energy of the transition that is
responsible for the radiation The energy and magnitude of peaks provide the means
for identifying the presence of certain isotopes and and a measure of their quantity
23 Practical Application Uranium Extraction from Solid Matrices 145
Numerous experiments have been done to inquire whether Supercritical Fluid Ex-
traction (SFE) of uranium with CO2 using a PUREX-like process is possible27ndash3067
However published research reported no significant progress beyond simple theoreti-
cal treatment or discussion of idealized conditions Some experiments were reported
but these were performed with lab-synthesized matrices containing uranium6869
It appears that unpublished work in Japan points to more progress in this area as
suggested by a pilot project under construction utilizing the so-called Super-DIREX
process This project appears to deal with similar issues as treated in this thesis
research however there are no detailed results available in the open literature that
can be used as a starting point
The next section is devoted to demonstrating that it is possible to recover uranium
from real matrices including incineration ash generated as byproduct of nuclear fuel
manufacturing
231 Experimental Work
Chemicals
Tributyl phosphate (97 pure) was purchased from Sigma-Aldrich Chemical Co and
used without further purification Utra pure water was obtained using the Milli-Q
water purification system from millipore Company Nitric acid (63-64 ww) was
purchased from VWR international and was diluted to 155 molmiddotLminus1 with ultra pure
water Carbon dioxide (purity ge9999 Coleman grade) was obtained from Polar
cryogenics AREVA provided 3 different matrices from where the uranium was to
be extracted The composition of those matrices is shown in table 25 L and R are
inceniration ashes from the Lynchburg and Richland sites and Y is a yellow residu
from classical purex extraction For the titration Sodium hydroxide was purchased
from Fisher chemicals and was diluted with ultra pure water to 01 molmiddotLminus1 or lower
Potassium oxalate was purchased from Fisher chemical and was dissolved in water up
to saturation and neutralized to a pH 7 with nitric acid Phenolphthalein was added
23 Practical Application Uranium Extraction from Solid Matrices 146
Table 25 Composition of the different matrices used for extraction determined bymass spectroscopy
Name Symbol L(mgg) R(mgg) Y(mgg)
Antimony Sb 1630 988 609Barium Ba 825 1020 913Calcium Ca 10500 9500 5900Chromium Cr 1790 2690 130Copper Cu 2380 9920 461Gadolinium Gd 89 154 115Iron Fe 86100 103000 132000Lead Pb 665 2180 109Manganese Mn 1040 768 886Molybdenum Mo 687 1090 10500Nickel Ni 5120 1550 748Phosphorous P 17900 32800 14100Tin Sn 1560 1050 769Titanium Ti 73200 44600 223000Uranium U 55700 126000 563000Zinc Zn 9810 31100 350Zirconium Zr 6370 5630 38400
Enrichment 235U 369 327 294
to the potassium oxalate solution to be used as a titration indicator
Experimental Setup
The TBPmiddot(HNO3)xmiddot(H2O)y complexes were prepared by mixing TBP with a 155
molmiddotLminus1 solution of nitric acid in a glass tube with a stopper Different volume ratios
of TBP to nitric acid were prepared according to table 24 on page 137 Thereafter
the mixture was manually shaken vigorously for 5 minutes followed by centrifuging
for an hour The organic phase was then extracted with a pipette and stored
The experimental setup is shown in Figure (231) It consists of a syringe pump
(ISCO model 260D) that pressurizes regulates and delivers CO2 to the system The
entire setup is rated up to 30 MPa The mixing cell (MC) is a 3 mL cylinder with
an entry and an exit for the fluid at each end The two high pressure extraction cells
23 Practical Application Uranium Extraction from Solid Matrices 147
Figure 231 UO2 extraction experimental setup
23 Practical Application Uranium Extraction from Solid Matrices 148
(EC1 and EC2) were especially designed for these experiments They are composed
of a filter that is shaped like a beaker and fits inside the cells The flow goes into the
cell from the top through the filter and goes out under the filter on the lower side of
the cell The internal volume of each extraction cell is 9 mL The stripping cell (SC)
has a 15 mL internal volume The fluid goes in from the top The outputs are at
the top or at the bottom of the cell to retrieve the CO2 phase or the water phase
respectively All cells are insulated and heated by a hot plate Thermocouples were
used to monitor the temperature with a tolerance of plusmn 1 C For practical reasons
the thermocouples were installed inside the cell for EC1 or between the cell and the
insulation for EC2 and SC A magnetic stirrer was used to mechanically stir the
solutions in SC Several valves were used to control the flow at the entrance and exits
of each cell
Before the first extraction 05 to 3 mL of the TBPHNO3 solution was injected
into the mixing cell and 02 to 2 g of ashes were introduced in each filter before placing
them in the extraction cells The stripping cell was filled with 2 to 5 mL of water
The system and all the valves were then closed and the pump was turned on The
heaters were turned on for each cell The mixing cell was then pressurized and the
TBPHNO3 complex was left with CO2 to be dissolved for sim30 min or until the other
cells reached an equilibrium temperature The valve between the mixing cell and the
first extraction cell was then open The system was left for a static extraction for 1
hour or more After the static extraction period the valve between EC1 and EC2
was slightly open to allow a dynamic extraction from EC1 to EC2 The flowrate was
set at 5 mLmin or lower After EC2 was filled the same protocol as the one used
for EC1 was followed
After the extraction was finished the organic phase was directed into SC by
opening slightly the valve between them When SC become full the magnet stirrer
was turned one and the two phases were mixed for at least one hour The valve
between EC2 and SC was then closed and the water phase was extracted from the
23 Practical Application Uranium Extraction from Solid Matrices 149
lower part and the TBP phase was extracted along with CO2 from the upper part
of the stripping cell The remaining ash and both solutions were then analyzed
To improve the stripping efficiency known amount of uranium nitrate and nitric
acid were dissolved in water and extracted with TBP in CO2 under various conditions
Most experiments were done at 20 MPa and 50 C with a TBP to water volume ratio
of 119 The water and the TBP solutions were thereafter analyzed with gamma
spectroscopy and the nitric acid content was determined by titration
Some stripping experiments were performed at ambient pressure (without CO2)
were also experimented The organic phase was composed of TBP with a concentra-
tion of 535 gmiddotLminus1 of uranium and 5 molmiddotLminus1 of nitric acid For these experiments
the organic phase was stripped with an equal volume of warm water (50 C) The
two phases were then separated The aqueous phase was analyzed and the remaining
organic phase was stripped again with an equal volume of warm water This process
was repeated several times
Analysis
The analysis of the samples was performed using different techniques The content
in uranium was determine using the gamma spectroscopy and important results were
confirmed using Inductively Coupled Plasma Mass Spectroscopy (ICP-MS) The ICP-
MS analysis was performed by an external lab facility which was arranged by AREVA
The pH of the different solutions was measured using titration methods
Gamma Spectroscopy The gamma spectrometer used (Canberra Industries) was
composed of a scintillation counter (NaI phosphor) connected to a computer running
the Genie 2000 software which manages data collection and performed spectral anal-
ysis The gamma probe was protected from the outside radiations with a cylindrical
lead shield with a lead cover A specially designed plastic tray was placed over the
gamma probe The tray restrained the sample glass tube to be sure it is in the exact
same position relative to the probe for all measurements
23 Practical Application Uranium Extraction from Solid Matrices 150
Before the acquisition the sample glass tubes were filled with 05 mL of the liquid
sample or 05 g of solid sample and placed over the probe The lead cover was put over
the sample and the probe to shield them The gamma radiations were counted for
2000 seconds The gamma spectrum (count versus energy) was then plotted After
each spectrum acquisition the sample was rotated Five spectral measurements were
taken and averaged out
Typical gamma spectra are shown in Figure 232 for the background radiation
and for the UO2+2 ion radiations in an aqueous solution and in a TBP solution The
background spectrum is flat demonstrating that the sample is well shielded For both
uranyl solutions four major peaks can be seen at 633 926 1438 and 1857 keV
The peaks at 633 and 926 keV correspond to the energy of radiation emitted by
thorium-234 The peaks at 1438 and 1857 keV correspond to the gamma radiations
emitted by uranium-235 Thorium-234 comes from the alpha decay of uranium-238
In appendix B the disintegrations of 235U and 238U are detailed in two tables
000
10000
20000
30000
40000
50000
50 100 150 200
coun
t
Energy (keV)
aqueousTBP
Figure 232 Gamma spectra of the background and of uranyl ion enriched at 31in 235U and at 87 gmiddotLminus1 of uranium in water and of the UO2+
2 ion (29 235U) at 24gmiddotLminus1 in TBP
23 Practical Application Uranium Extraction from Solid Matrices 151
The gamma energies were calibrated using a solution at high concentration of
uranium nitrate in water For each energy (peak position) the number of counts
is proportional to the concentration of the isotope that emits the gamma radiation
at that energy The ratio between the number of counts and the concentration was
calculated by using standard solutions in TBP and water or by using a standard
amount of ash before extraction For a better accuracy the area of the peak was
used to determine the concentrations Figure 233 shows the calibration curves for
the uranyl ion in TBP and water For both calibration and measurements only the
235U peak at 1857 keV was used because it has the highest abundance (53) The
other 235U peak at 1438 keV is to small and if chosen (abundance of 10) the area
measurements would have been less accurate The thorium peaks are overlapping
with peaks from other decay isotopes and can therefore not be used for analysis The
dectection limit with maintained accuracy of this experimental setup was 003 gmiddotLminus1
of 235U which corresponds to 15 gUmiddotLminus1 or to 750 microg of total uranium
0
5000
10000
15000
20000
25000
0 05 1 15 2 25 3
Pea
k ar
ea
[235-U] (gL)
Figure 233 Calibration curves for UO2+2 ion in water (H 31 235U) and in TBP
(N 29 in 235U)
23 Practical Application Uranium Extraction from Solid Matrices 152
pH Analysis Uranyl nitrate (also called uranium nitrate UO2(NO3)2) can react
with hydroxide ions to form uranyl hydroxide according to the following chemical
equation
UO2(NO3)2 + 2NaOH rarr UO2(OH)2 + 2NaNO3 (233)
To avoid the formation of uranyl hydroxide 5 mL of a potassium oxalate solution at
pH 7 was added to 02 mL of the aqueous solutions prior to titration The potassium
oxalate is added in excess to react with the uranium nitrate and therefore it makes it
impossible for the uranium nitrate to react with sodium hydroxide This procedure
allows the determination of the free acid concentration The pH indicator used was
phenolphthaleine and it was dissolved in the potassium oxalate solution before its
neutralization The solutions were thereafter titrated with sodium hydroxide at 01
molmiddotLminus1 or lower depending on the acid concentration
To titrate the organic phase the acid was first stripped out from the organic
phase using a large quantity of water This water was thereafter titrated with the
same protocol as the one used to directly titrate the aqueous phase with the exception
that the sodium hydroxide concentration was lower
232 Extraction of UO2 from Different Matrices
During the extraction the uranium(IV) dioxide (UO2) is oxidized into uranium(IV)
nitrate with the help of nitric acid which is the oxidizing agent This oxidation
follows the chemical reaction
3 UO2 + 8 HNO3 rarr 3 UO2(NO3)2 + 2 NO + 4 H2O (234)
When TBP is used one uranium nitrate bonds to two TBP molecules according to
this chemical equation
UO2(NO3)2 + 2 TBP + 2 H2O rarr UO2(NO3)2middot2TBPmiddot2H2O (235)
The supercritical fluid extraction of uranium for any TBPmiddot(HNO3)xmiddot(H2O)y com-
plexes can be described using two equations Equations (236) and (237) When the
23 Practical Application Uranium Extraction from Solid Matrices 153
molecular ratio of nitric acid to TBP x is greater than or equal to 43 and the
molecular ratio of water to TBP y is greater than or equal to 13 the extraction
follows the chemical reaction of equation (236)
UO2 + 2 TBPmiddot(HNO3)xmiddot(H2O)y rarr
UO2(NO3)2middot2TBPmiddot2H2O +2
3NO +
6y minus 2
3H2O +
6xminus 8
3HNO3 (236)
Independently of the value of x equation 237 describes in a general way the
extraction of uranium
3 UO2 + (6 + z) TBPmiddot(HNO3)xmiddot(H2O)y rarr
3 UO2(NO3)2 middot 2TBPmiddot2H2O + 2 NO + (6yminus 2 + z) H2O + (6xminus 8 + z) HNO3 (237)
where z is equal of greater than 6xminus 8
In the following part I will first describe the different parameters that can influence
the extraction efficiency and then I will summarize the optimized parameters obtained
for the system studied
Extraction Efficiency Improvement
Different parameters were adjusted to obtain the best extraction efficiency with an
acceptable protocol Such protocol needed to be conservative regarding safety and
should be cost and energy efficient
The gamma spectroscopy was used to determine the yield of the extraction by
analyzing the matrices before and after extraction These results were confirmed
by the analyze of the amount of uranium extracted in the TBP phase using gamma
spectroscopy Mass Spectroscopy was also used to confirm the gamma data In Figure
234 the gamma spectrum of the three types of matrices used for uranium extraction
are shown
The different parameters that were adjusted are the TBP complex composition
the temperature and pressure the TBPmatrix ratio the static extraction time and
the flowrate and the number of successive extractions
23 Practical Application Uranium Extraction from Solid Matrices 154
000
50000
100000
150000
200000
250000
300000
50 100 150 200
coun
t
Energy (keV)
ash Lash Yash R
Figure 234 gamma spectra of the background and of the three kind of matrices (RL and Y) used for extraction
TBP Complex Composition Different TBP complexes can be prepared by mix-
ing TBP with nitric acid at different volume ratios as detailed in section 222 page
135 The ideal composition is the one that has a sufficient amount of nitric acid
to oxidize uranium dioxide into uranium nitrate (UO2(NO3)2) at a reasonable rate
The quantity of TBP should also be enough to carry the uranium nitrate into the
CO2 phase
Theoretically TBPmiddot(HNO3)18middot(H2O)04 is the best composition Indeed it has the
highest nitric acid to water molecular ratio with a sufficient amount of TBP according
to Table 24 on page 137 Furthermore Wai et al29 have shown that this complex
is the most efficient to dissolve UO2 For these reasons the TBPmiddot(HNO3)18middot(H2O)04
complex was chosen for the extraction of uranium
Several other complexes were briefly tried out The one with a lower nitric acid
to water molecular ratio lowered the amount of uranium extracted from the ash
which is not acceptable On the other hand the one with higher nitric acid to TBP
23 Practical Application Uranium Extraction from Solid Matrices 155
molecular ratio did not improve the extraction efficiency significantly and would make
the stripping of the uranium from TBP into water more difficult
Temperature and Pressure Higher temperatures generally improve the rate of
any reaction but in supercritical CO2 it also lower the density of the supercritical
fluid At lower density CO2 is less able to dissolve species such as the TBP-water-
nitric acid or the TBP-uranium nitrate complexes To counteract the effect of the
higher temperature on the density the pressure can be increased Unfortunately for
safety reasons the pressure needed to be kept at a reasonable level (ie under 40
MPa)
It is known that the dissolution of UO2 in supercritical CO2 depends on the density
of the fluid Samsonov et al28 have shown that the best condition for the dissolution
of UO2 is 65 C and 250 atm which correspond to a density of 7656 gLminus1 This
was therefore the starting condition that I used Higher pressures and temperatures
(up to 125 C and 40 MPa) were tried out without a significant improvement in the
extraction On the other hand by lowering the pressure and temperature to 20 MPa
and 60 C for a density of 7237 gLminus1 the recovery yield was unchanged Further
lowering in the temperature and pressure were tried out but the efficiency was greatly
affected Therefore a temperature and pressure of 60 C and 20 MPa were selected
for the extraction as optimum values
TBPMatrix Ratio For a good extraction efficiency an excess of nitric acid
and therefore an excess of TBP-water-nitric acid complex is needed On the other
hand a large excess will lower the concentration of uranium nitrate and increase
the concentration of nitric acid Both of these consequences decrease the stripping
efficiency The best yield was obtained with 2 mL of TBPmiddot(HNO3)18middot(H2O)04 per
gram of ash
23 Practical Application Uranium Extraction from Solid Matrices 156
Static Extraction Time and Flowrate The static extraction time allows the
reaction between nitric acid and UO2 to be completed No change in the extraction
efficiency was observed after one hour of static extraction therefore the extraction
time was set to one hour
After the static extraction is finished the dynamic extraction is initiated and the
fluid goes first to the second extraction cell and then goes to the stripping cell The
flowrate of the dynamic extraction had to be adjusted to be as fast as possible without
compromising the extraction High flowrates result in depressurizing CO2 and thus
reducing its density and consequently reducing its ability to is to dissolve the uranium
nitrate-TBP complex that needs to be extracted No changes were observed in the
amount of uranium recovered when the flowrate was kept under 05 mL per minute
Number of Extractions After the optimization of the other parameters (ie
temperature pressure complex composition static extraction time flowrate and
TBPmatrix ratio) the number of successive extractions did not improve the extrac-
tion efficiency any further I believe that the remaining uranium is strongly bonded
to the matrix and is not removable with supercritical fluid extraction process used in
these experiments
Nevertheless two extraction vessels were used in series (Figure 231) to improve
the concentration of uranium in the TBP phase and therefore enhance the stripping
of uranium into water
Optimal Parameters for the Extraction
The optimized parameters used are shown in Table 26 Table 27 summarized the
optimum recovery efficiencies which I obtained for the three types of matrices used
in the experiments
The efficiency of supercritical fluid extraction is well beyond the one of the tra-
ditional Purex process For this application the supercritical fluid extraction has
another advantage over the Purex process the ashes are dry after extraction and the
23 Practical Application Uranium Extraction from Solid Matrices 157
Table 26 Optimal parameters for the supercritical CO2 extraction
Parameters unit Optimal Values
Pressure MPa 200Temperature C 60Density gmiddotLminus1 7237TBPmiddotNO3)xmiddot(H2O)y complex molecular ratio 11804TBP complexmatrix ratio mLg 21Static extraction time hour 1flowrate mLmin le 05Number of extractions 1
Table 27 Optimum uranium recovery efficiencies
Matrix extracted U before U after optimized
R 85 104 16 yesL 90 62 06 yesY 25 35 26 no
extra water and nitric acid do not need to be evaporated
233 Stripping of the Uranium from TBP Media to Water
After the extraction the cell had to be slowly depressurized inside a sample glass
tube in which the CO2 deposits the TBPmiddotUO2middot(NO3)2 complex with excess of nitric
acid and TBP It is important to recover the uranium from the TBP solution into
water because it will allow the recycling of the TBP and an easy reprocessing of
the enriched UO2 This is called stripping and it was carried out with water at
atmospheric pressure or with CO2 and water continuously with the extraction as
shown on Figure 231
After the stripping gamma analysis of the water and TBP phases were carried
out to determine the efficiency of the stripping In Figure 235 an example of the
spectrum of the TBP stripped solution and the aqueous solution is shown
23 Practical Application Uranium Extraction from Solid Matrices 158
000
20000
40000
60000
80000
100000
50 100 150 200
coun
t
Energy (keV)
aqueousTBP
Figure 235 gamma spectra of the background and of the uranyl ion (29 U) in theTBP stripped solution at and in the aqueous solution
Stripping at Atmospheric Pressure
In this section the efficiency of the stripping with water at atmospheric pressure was
evaluated The conditions were optimized to maximize the stripping efficiency ie
the concentration in the organic phase was high in uranium and low in acid and the
water temperature was elevated to 50 C Figure 236 is shows the results of this
experiment The total mass of uranium stripped is plotted versus the total amount
of water used A total of 15 plusmn 1 of uranium was stripped from the TBP phase with
a 51 volume ratio of the aqueous phase to the organic phase The total uranium
concentration in the organic phase was 14 plusmn 1 gmiddotLminus1
Stripping under Pressure Continuous with the Extraction
Some experiments were performed to improve the stripping efficiency of uranium
from the TBP phase to the aqueous phase Standard solutions of uranium nitrate
and nitric acid in water were extracted with TBP and CO2 The remaining phases
23 Practical Application Uranium Extraction from Solid Matrices 159
000
002
004
006
008
010
0 1 2 3 4 5 6
Tot
al m
ass
strip
ped
(g)
Volume used (mL)
Figure 236 Total mass of uranium stripped versus total volume of water used Theline is a guide for the eyes and does not have any theoretical or analytical value
were titrated and analyzed with gamma spectroscopy
Figure 237 shows the partition of the nitric acid between the two phases The
initial amount of acid or uranium in the aqueous phase does not influence the acid
partition The partition coefficient D is obtained from equation (238) and Figure
237
D = [HNO3]aq[HNO3]org (238)
D was found equal to 14 plusmn 04 when the extraction occurred at 50 C and 20 MPa
and with a volume ratio of 119 between the organic and the aqueous phases This
result implies that 60 of the acid is in the aqueous phase whereas 40 goes in the
organic phase
In Figure 238 the partition of uranium between the organic and the aqueous
phases is shown for three initial nitric acid concentrations (16 33 and 7 molmiddotLminus1)
with the same conditions as above It is shown that the continuous stripping of
uranium into the aqueous phase is less efficient when the initial amount of nitric acid
23 Practical Application Uranium Extraction from Solid Matrices 160
00
05
10
15
20
25
30
35
40
0 1 2 3 4 5 6
[HN
O3]
org
(mol
L)
[HNO3]aq (molL)
Figure 237 Partition of HNO3 between the organic and the aqueous phases at 50C 20 MPa and with a TBPwater volume ratio of 119
is greater
Table 28 provides detailed results of the stripping experiments It shows the ef-
ficiency of the uranium stripping at 50C 20 MPa and with a 119 TBP to water
volume ratio As shown in Figure 238 an increase in the initial acidic concentration
lowers the stripping efficiency On the other hand at higher concentrations of nitric
acid the initial uranium concentration greatly influence the efficiency Indeed the
percentage of uranium in the aqueous phase drops from 39 to 5 when the initial
uranium concentration decreases from 219 to 58 gmiddotL This phenomenum is not ob-
served at lower acidic concentration where the efficiency is the same regardless of the
initial uranium concentration and considering the experimental errors
The preceding data were all collected at the same conditions ie 50 C 20 MPa
and a volume ratio of 119 of the organic to the aqueous phase Next I will show
the changes when other conditions were used In Figure 239 the percentage loss of
extraction efficiency is plotted versus the initial nitric acid concentration The loss of
23 Practical Application Uranium Extraction from Solid Matrices 161
Table 28 Results of the stripping experiments at 50C 20 MPa and with a 119TBP to water volume ratioa
[U]ini [HNO3]ini stripping [U]org [U]aq [HNO3]aq [HNO3]org
(gmiddotLminus1) (molmiddotLminus1) efficiency () (gmiddotLminus1) (gmiddotLminus1) (molmiddotLminus1) (molmiddotLminus1)
219 83 39 133 86 50 63162 67 31 112 50 48 36108 71 18 88 19 54 3259 74 5 56 3 59 28
174 48 31 120 54 37 21110 47 28 79 31 33 2734 43 23 26 8 24 35
182 33 47 97 85 24 18130 33 40 77 52 23 2091 33 31 63 28 21 23
187 27 35 121 66 19 1765 28 32 44 21 19 18
205 19 56 90 115 13 11147 15 53 69 78 10 11112 19 49 58 54 13 12106 17 57 46 60 14 0675 18 54 35 41 13 11
205 12 62 79 126 10 05205 12 61 81 124 10 04103 07 91 9 94 06 01
a Typical statistic errors are less than 5 for the uranium concentrations andare less than 10 for the nitric acid concentrations and the stripping efficiency
23 Practical Application Uranium Extraction from Solid Matrices 162
0
20
40
60
80
100
120
140
160
0 20 40 60 80 100 120
[UO
2]or
g (g
L)
[UO2]aq (gL)
[HNO3]ini = 70 molL[HNO3]ini = 33 molL[HNO3]ini = 16 molL
Figure 238 Partition of uranium between the organic and the aqueous phases fordifferent initial nitric acid concentrations The experiment was performed at 50 C20 MPa and with a TBPwater volume ratio of 119 Lines are guides for the eyesand do not have any theoretical or analytical value
efficiency is the most important (up to 68) when the volume of the aqueous phase
is reduced The decrease in the stripping temperature to 24 C has a lesser impact
on the efficiency (le 32) However a general tendency is observed independently
of the condition changed At high acidic concentration the loss of efficiency is more
important than at low nitric acid concentration An increase in the efficiency is even
shown at 24 C for initial concentrations in nitric acid below 2 molmiddotLminus1
Conclusion
During this research work the extraction of uranium from ash and other matrices
has been proven possible with a very good yield The stripping stage performed
continuously with the extraction has also been shown to be feasible Continuous
stripping was shown to be more efficient than the separate process at atmospheric
pressure Supercritical fluid extraction allows the recovery of dry processed ashes
23 Practical Application Uranium Extraction from Solid Matrices 163
-10
0
10
20
30
40
50
60
70
80
0 1 2 3 4 5 6 7
Lost
of e
ffici
ency
(
)
[HNO3]ini (molL)
vol ratio 1124 oC
Figure 239 Lost of efficiency when the volume ratio is 11 between the two phases(H) and when the temperature is 24 C (N)
with a low radioactive content These two advantages are very important because
the ashes can be disposed of as low-level waste without further cleaning or processing
Nevertheless there is still room for further improvement before using this process
in a large-scale plant which is outside the scope of this work For example the
extraction efficiency could be potentially enhanced with the use of an ultra-sonic
bath Other suggestions to improve the stripping efficiency include the use of pulse
columns electrolysis and osmosis
Conclusion 164
Conclusion
This chapter was dedicated to the study of the supercritical fluid extraction of ura-
nium from different matrices such as incineration ash coming from the byproducts of
nuclear fuel production For this project I used a mixture of the TriButyl Phosphate
(TPB) as a complexing agent and nitric acid as an oxidizing agent As part of
this research the interaction TBP and water was studied in supercritical CO2 and in
chloroform using the Fourier Transform Infra-Red (FT-IR) and the Nuclear Magnetic
Resonance (NMR) spectroscopies It was found that TBP and water make a onendash
tondashone complex when mixed with an excess of water When this complex is mixed
with another solvent such as chloroform or supercritical CO2 some microdroplets of
water appear in the oil due to the antisolvent effect The amount of these droplets
was calculated for a sim119 volume ratio of TBP complex to solvent When chloroform
was chosen as a solvent 14 plusmn 1microL of microdroplets of water were formed In sub-
and supercritical CO2 the amount of microdroplets varies between none to sim11 microL
when the temperature decreases from 70 to 25 C at a constant pressure of 200 bar
This amount decreases from sim7 to sim1 microL when the pressure increases from 200 to
400 bar at 40 C Chloroform is therefore comparable to CO2 at low temperature and
pressure regarding the amount of microdroplets formed
Next the composition of different TBPndashwaterndashnitric acid complexes was deter-
mined without a solvent using the NMR spectroscopy In the condition of my ex-
periments the maximum number of nitric acid molecules per water molecule in the
TBPmiddot(HNO3)xmiddot(H2O)y adducts does not exceed five Thereafter I studied the forma-
tion of microdroplets when these TBP adducts are mixed with a solvent (chloroform)
The acidic concentration in the droplets depends on the composition of the TBPndash
waterndashnitric acid complex The amount of nitric acid in the microdroplets increases
greatly when the molecular ratio of nitric acid to water increases
To bring the topic of this chapter to closure the feasibility of extracting UO2
Conclusion 165
from different matrices was demonstrated Some of these matrices are incineration
ash coming from the byproducts of the nuclear fuel pellet fabrication The conditions
of the extraction ie temperature pressure TBPndashwaterndashnitric acid complex used
extraction time flow-rate etc were optimized At least 85 of the enriched uranium
was recovered from the ash at these optimized conditions After the extraction
CO2 can be released in the air and the extracted uranium is recovered as a TBP
complex with an excess of TBP and nitric acid Uranium can not be recycled in the
fuel fabrication proces in this form It needs to be stripped into an aqueous phase
The simple stripping at atmospheric pressure with warm water is not efficient enough
This stripping would need a great amount of water that would have to be evaporated
A better way of stripping the uranium out of the organic phase is to do it continuously
with the extraction The efficiency of this stripping method was optimized using
standard solutions A smaler amount of water was needed for the continuous stripping
compared to the normal stripping at atmospheric pressure Based on this research
work a pilot plant is now operational at the AREVA (Framatome-ANP) facility in
Richland Washington
Some improvements are suggested for the experimental setup to make the extrac-
tion and the stripping more efficient For example the extraction cells can be put in
an ultra-sonic bath This technique might enhance the extraction efficiency by liber-
ating the uranium strongly bonded to the matrix On the other hand the stripping
can also be enhanced by using a pulse column or replaced for electrolysis which could
be used to precipitate out UO2 Osmosis can be also a good alternative where the
process has been already optimized on large scale for desalting sea water
General Conclusions
This research work was devoted to the understanding of the supercritical fluid ex-
traction of cesium and uranium These two elements were especially chosen because
of their abundance in various types of nuclear waste and because of their importance
in the reprocessing and recycling of such waste Original contributions were made
to the understanding of the phenomena and interactions involved which further the
advance of the extraction chemistry and technology
In the following paragraphs I will give a synopsis of the different parts of my work
and mention the findings and contributions from each part
Supercritical fluid extraction of metal ions requires the use of a chelating agent
Crown ethers have been chosen as ligand in the extraction of cesium where often
water plays a important role Therefore the interaction between crown ethers and
water was first described in chapter 1 This interaction was studied in sub- and
supercritical CO2 using FT-IR The differentiation between three waterndashcrown ether
configurations (ie the bridge the single and the sandwich forms) was made with the
help of this analytical technique The sandwich configuration in the organic phase
between two crown ethers and a water molecule was first discovered through this
work The equilibrium parameters (ie the equilibrium constant the molar fraction
of crown ether bonded to water and the amount of free water) were determined for the
bridge and single configurations at different pressures and temperatures The value
of these parameters were also determined for the global study that lumps together
the equilibria of the bridge and the single configuration in one equilibrium This last
set of results was compared with the one in organic solvent found using NMR as a
General Conclusions 168
method of analysis
The study of the waterndashcrown ether interaction in organic solvents shows that the
interaction depends strongly on the crown ether used and on the nature of solvents
The main factor of this dependence is the polarity of the solvent As the polarity
increases the molar fraction (k) of crown ether complexed with water increases from
61 to 97 for 18-crown-6 These values can be compared to the ones in supercritical
fluids where k varied from 33 to 54 as the temperature decreases at constant
pressure (sim20 MPa) These results show that at least 46 of the water is free in
CO2 where less than 39 is free in CDCl3 and CCl4 mixtures
The role of water in the cesium extraction equilibrium was discussed at the closure
of Chapter 1 The cesium extraction was described using four equilibrium reactions
The calculation of the equilibrium constants leads to three conclusions
1 The sandwich configuration between two crown ethers and one cesium picrate
is not possible if water is part of it
2 The one-to-one complex of the cesium picrate with the crown ether is preferred
with water than without water
3 The ldquosandwichrdquo configuration is preferred to the one-to-one complex when water
is involved
It was also observed that the amount of water in oil decreases with the increase
of the cesium picrate concentration It seems that the water is competing with crown
ether to be carried out of the water phase The efficiency of the extraction might be
enhanced in a ldquowater-freerdquo extraction
The second chapter of this thesis work is focused on the supercritical fluid ex-
traction of uranium TBP-nitric acid-water complexes were used as chelating agent
When TBP-water or TBP-nitric acid-water complexes are mixed with a solvent char-
acterized with a low dielectric constant some micro-droplets appear due to the anti-
solvent effect Therefore the first part of the chapter was devoted to the understand-
General Conclusions 169
ing of the TBP-water and the TBP-nitric acid-water interactions in various solvents
FT-IR technique was successfully used to describe the TBP-water complex in sub-
and supercritical CO2 The equilibrium constant and the molar fraction of water
complexed to TBP in CO2 as function of temperature and pressure were determined
Most importantly the FT-IR technique was used to predict the amount of water
droplets produced by the antisolvent effect when the TBP-water complex is mixed
with CO2 These results where compared with the measurement obtained in chloro-
form using NMR as an analytical tool These two analytical methods complement
each other to give a complete picture of the equilibrium The analysis of the molar
fraction of TBP bonded to water shows that there is more water bonded to TBP in
the supercritical fluid Consequently the amount of free water is larger in the organic
phase when CDCl3 is chosen as a solvent In pure CDCl3 the standardized amount
of micro-droplets was found equal to 14 plusmn 1 microL This is 3 microL more than the highest
volume obtain in CO2 where the pressure and temperature were at the lowest setting
studied (ie 20 MPa and 25 C)
A further understanding of the interactions was acquired when the TBP-water
equilibrium was studied with the addition of nitric acid which is essential to the
supercritical fluid extraction of uranium Different TBP(HNO3)x(H2O)y complexes
were studied without solvent to determine their composition depending on the initial
volume ratio of TBP and nitric acid The formation of micro-droplets of acid due to
the antisolvent effect was demonstrated using NMR when the TBP complexes were
mixed with chloroform It was found that the pH of these micro-droplets decreases
when the nitric acid to water molecular ratio increases in the TBP complex
Finally a practical application for the TBP-nitric acid-water adducts was demon-
strated when they were used to extract uranium from nuclear fuel manufacturing
incineration ash and other solid matrices into supercritical CO2 The extraction of
uranium has been proven possible with a very good yield The stripping stage per-
formed continuously with the extraction has also been shown to be feasible and more
General Conclusions 170
efficient than the separate process at atmospheric pressure The uranium extraction
process developed and optimized through this work has been received well in the
nuclear industry where a pilot plant applying this new process has been recently
commissioned at the AREVA Framatome-ANP fuel manufacturing facility in Rich-
land USA
To sum up this research work has successfully demonstrated that supercritical
fluid extraction could be used to recover uranium and cesium These and other ele-
ments can be extracted from high level radioactive waste on a large scale Gradually
and in a controlled manner each element could be removed from the main waste al-
lowing a specific waste management solution for each element In particular extracted
plutonium and uranium could be reused as fuel for power-plants Other isotopes could
be used for research or medical purposes whereas low level waste could be easily for-
gotten underground Even if no practical use were found for certain isotopes their
recycling andor storage would be much easier when separated from the bulk The
remaining high level waste could be processed as traditionally envisioned ie using
short term storage long term storage and neutron transmutation that is of course
when such technology matures eventually It would be necessary to monitor the wa-
ter and hydrogen level in such plant Indeed due to radiolysis effects potentially
explosive hydrogen gas is generated from water in these materials
For future consideration and extension of my work I suggest that other important
elements that were not included in this experimental work such as plutonium neptu-
nium and americium should be also studied If shown to be successful the benefits
of a supercritical fluid extraction plant would be greatly expanded
Appendix A
Mass Yield of the Fission Element
172
Table A1 Mass (g) and radioactivity (Ci) of elements (150 days after discharge froma PWR) per ton (Mg) of uranium (freshly loaded in the reactor) for all elements
Element Symbol Atomic number Mass (gMg) Radioactivity (CiMg)
Uranium U 92 954E+05 405E+00Neptunium Np 93 749E+02 181E+01Plutonium Pu 94 903E+03 108E+05Americium Am 95 140E+02 188E+02Curium Cm 96 470E+01 189E+04
Selenium Se 34 487E+01 396E-01Bromine Br 35 138E+01 000E+00Krypton Kr 36 360E+02 110E+04Rubidium Rb 37 323E+02 190E+02Strontium Sr 38 868E+02 174E+05Yttrium Y 39 453E+02 238E+05Zirconium Zr 40 342E+03 277E+05Niobium Nb 41 116E+01 521E+05Molybdenum Mo 42 309E+03 000E+00Technetium Tc 43 752E+02 143E+01Ruthenium Ru 44 190E+03 499E+05Rhodium Rh 45 319E+02 499E+05Palladium Pd 46 849E+02 000E+00Silver Ag 47 421E+01 275E+03Cadmium Cd 48 475E+01 595E+01Indium In 49 109E+00 357E-01Tin Sn 50 328E+01 385E+04Antimony Sb 51 136E+01 796E+03Tellurium Te 52 485E+02 134E+04Iodine I 53 212E+02 222E+00Xenon Xe 54 487E+03 312E+00Cesium Cs 55 240E+03 321E+05Barium Ba 56 120E+03 100E+05Lanthanum La 57 114E+03 492E+02Cerium Ce 58 247E+03 827E+05Praseodymium Pr 59 109E+03 771E+05Neodymium Nd 60 351E+03 947E+01Promethium Pm 61 110E+02 100E+05Samarium Sm 62 696E+02 125E+03Europium Eu 63 126E+02 135E+04Gadolinium Gd 64 629E+01 232E+01Terbium Tb 65 125E+00 302E+02Dysprosium Dy 66 628E-01 000E+00
Appendix B
Decay Series
174
Table B1 Main decay energies for 238-Uranium
Isotope AtomicMass
Half-life DecayMode
DecayEnergy(MeV)
GammaEnergy(keV)
GammaRayIntensity()
23892U 2380508 446x109 y α 4955 007
23490Th 2340436 2410 d βminus1 0270 6329 38
9235 279278 2711280 024
234m91 Pa 117 min 999 βminus1 229 76641 21
013 IT 100100 6523491Pa 2340433 670 h βminus1 2199 1312 20
5695 1188324 12
23492U 2340409 245x105 y α 4856 5323 12
23090Th 2300331 754x104 y α 4771
22688Ra 2260254 1600 y α 4870 1861 330
22286Rn 2220176 382 d α 5590 510 007
21884Po 311 min α 6114
21482Pb 2139998 268 min βminus1 1032 24192 75
29509 19235187 3778582 11
21483Bi 2139987 199 min βminus1 327 60931 461
76835 49112027 15123810 596176449 159
21484Po 2139952 164 microsec α 7833
21082Pb 2099842 223 y βminus1 063
21083Bi 2094841 501 d βminus1 116
21084Po 2099828 1384 d α 5407 80313 0001
20682Pb 2059744 stable
y = year(s) d = day(s) h = hour(s) min = minute(s) s = second(s) α = alpha particle emission βminus1 = negative beta emission IT Isomeric transition uncertainties le 04
175
Table B2 Main decay energies for 235-Uranium
Isotope AtomicMass
Half-life DecayMode
DecayEnergy(MeV)
GammaEnergy(keV)
GammaRayIntensity()
23592U 2350439 704x108 y α 46793 10917 15
14378 10516338 4718574 5320213 1520533 47
23190Th 2310363 252 d βminus1 0389 2564 15
84203 6623191Pa 2310359 327x104 y α 5148 27396 93
30007 2422789Ac 2270278 216 y 986 βminus1 0041
14 α 514822790Th 2270277 1872 d α 6146 5014 85
23597 11225624 67
22387Fr 2230197 218 min βminus1 1147 5014 33
7972 8922388Ra 2230185 1143 d α 5979 15418 56
26939 1421986Rn 2190095 396 sec α 6946 27113 99
40170 6621584Po 2149994 178 msec α 7526
21182Pb 2109887 361 min βminus1 1379 40486 38
42700 178306 38
21183Bi 2109873 214 min 03 βminus1 0584 3501 128
997 α21184Po 2109866 052 sec α 7594 5695
89723 05220782Tl 2069774 477 min βminus1 1427 89723 024
20782Pb 2069759 stable
y = year(s) d = day(s) h = hour(s) min = minute(s) s = second(s) α = alpha particle emission βminus1 = negative beta emission IT Isomeric transition uncertainties le 01
Appendix C
Acronyms
ATW Accelerator Transmutation of Waste
DOE Department Of Energy
FID Free Induction Decay
FT-IR Fourrier Transform Infra Red
HLW High level Waste
IASR Industrial Accident Safety Rate
ICP-MS Inductively Coupled Plasma Mass Spectroscopy
ILW Intermediate level Waste
INSC International Nuclear Safety Center
LLW Low level Waste
LMFBR Liquid Metal Fast Breeder Reactors
MCT Mercury-Cadmium-Telluride
MRI Magnetic Resonance Imaging
MS Mass Spectroscopy
NIST National Institute of standards and Technology
NMR Nuclear Magnetic Resonance
NRC Nuclear Regulatory Commission
PNMR Proton Nuclear Magnetic Resonance
PUREX Plutonium Uranium Recovery by Extraction
178
PWR Pressurized Water Reactors
RF Radio Frequency
SFC Supercritical Fluid Chromatography
SF-CO2 Supercritical Fluid Extraction using CO2
SFE Supercritical Fluid Extraction
SNF Spent Nuclear Fuel
TBP Tri-nButyl Phosphate
TMS TetraMethylSilane
UV Ultra Violet
Appendix D
Curriculum Vitae
Address
France 41grandrsquorue68280 ANDOLSHEIM
USA 106 Edgewood DriveRichland WA 99352
phone +1 509 628 3030
e-mail Anne Farawilahotmailcom
Academic History
1994 - 1998 Louis Pasteur University Strasbourg (France)- Diploma of general undergraduate studies (DEUG) of chemistry- Bachelor (Licence) of chemistry and physics
The American equivalence of this diploma is a bachelor degree with an academicmajor in chemistry and an academic minor in physics and mathematics
1998 - 2000 Louis Pasteur University Strasbourg (France)- Maıtrise of chemistry and physics- Diploma of thorough studies (DEA) of chemistry and physics
The American equivalence of this diploma is a master degree with an academicmajor in chemistry and an academic minor in physics
180
2000 - 2005 Louis Pasteur University Strasbourg (France)and University of Idaho Moscow (Idaho USA)- PhD of physical chemistry June 2005 (thesis herein presented)
Master Publications and Conference Presentations
1 Fluorescence spectroscopy of U(VI) in the presence of perchlorate ions Rusten-holtz A Billard I Duplatre G Lutzenkirchen K Semon L RadiochimActa 2001 89 83ndash89
2 Fluorescence of UO2+2 in a non-complexing medium HClO4NaClO4 up to 10
M Billard I Rustenholtz A Semon L Lutzenkirchen K Chem Phys2001 270 345ndash354
3 Anne Rustenholtz Isabelle Billard Fluorescence spectroscopy of U(VI) in thepresence of perchlorate ions Poster presented in the 7emes Journees Nationalesde Radiochimie et de Chimie Nucleaire Saint Remy les Chevreuses FranceSeptembre 27ndash29 2000
PhD Publications and Conference Presentations
1 Characterization of a Tri-n-butyl Phosphate-Nitric Acid Complex a CO2 -Soluble Extractant for Dissolution of Uranium Dioxide Enokida Y TomiokaO Lee S-C Rustenholtz A Wai C M Ind Eng Chem Res 200342(21) 5037ndash5041
2 Partition Coefficients and Equilibrium Constants of Crown Ethers between Wa-ter and Organic Solvents Determined by Proton Nuclear Magnetic ResonanceCheng H-W Rustenholtz A Porter R A Ye X R Wai C M J ChemEng Data 2004 49(3) 594ndash598
3 An FT-IR Study of Crown Ether-Water Complexation in Supercritical CO2Rustenholtz A Fulton J L Wai C M J Phys Chem A 2003 107(50)11239ndash11244
4 A F Rustenholtz An FT-IR Study of crown ether complexation with waterin liquid and supercritical CO2 Poster presented in the 225th ACS Nationalmeeting New Orleans March 23ndash27 2003
Appendix E
Abstract
Supercritical Fluid Extraction Spectroscopic Study of Inter-actions Comparison to Solvent Extraction
Supercritical fluid carbon dioxide (SF-CO2) was chosen to study Supercritical Fluid
Extraction (SFE) of cesium and uranium At first crown ethers were considered
as chelating agents for the SFE of cesium The role of water and its interaction
with crown ethers were especially studied using Fourier-Transform Infra-Red (FT-
IR) spectroscopy in SF-CO2 A sandwich configuration between two crown ethers
and a water molecule was observed in the SF-CO2 phase for the first time The equi-
librium between the single and the bridge configurations was defined The enthalpy of
the hydrogen bond formation was also calculated These results were then compared
to the one in different mixtures of chloroform and carbon tetrachloride using Nuclear
Magnetic Resonance (NMR) To conclude this first part and in order to understand
the whole picture of the recovery of cesium I studied the role of water in the equi-
librium between the cesium and the dicyclohexano18-crown-6
In a second part the supercritical fluid extraction of uranium was studied in SF-CO2
For this purpose different complexes of TriButyl Phosphate (TBP) nitric acid and
water were used as chelating and oxidizing agents I first used FT-IR to study the
TBP-water interaction in SF-CO2 These results were then compared to the one
obtained with NMR in chloroform NMR spectroscopy was also used to understand
the TBP-nitric acid-water interaction first alone and then in chloroform To conclude
182
my research work I succeeded to improve the efficiency of uranium extraction and
stripping into water for a pilot-plant where enriched uranium is extracted from incin-
erated waste coming from nuclear fuel fabrication TBP-nitric acid complexes were
used in SF-CO2 for the extraction of uranium from ash
Keywords Reprocessing ndash Nuclear waste ndash NMR ndash FT-IR ndash Extraction ndash SFE ndash
Supercritical fluids ndash Solvents ndash Water ndash Uranium ndash Cesium ndash Crown ethers ndash Carbon
dioxide ndash CO2 ndash TBP ndash TriButyl Phosphate ndash Nitric acid ndash Antisolvent effect ndash Uranyl
ndash Hydrogen bond
Appendix F
An FT-IR Study of CrownEther-Water Complexation inSupercritical CO2
[signalement bibliographique ajouteacute par ULP ndash SCD ndash Service des thegraveses eacutelectroniques]
Anne Rustenholtz John L Fulton and Chien M Wai
An FT-IR study of crown ether-water complexation in supercritical CO2
J Chem Phys A 107 11239-11244 (2003)
Pages 11239-11244
La publication preacutesenteacutee ici dans la thegravese est soumise agrave des droits deacutetenus par un eacutediteur
commercial
Pour les utilisateurs ULP il est possible de consulter cette publication sur le site de
leacutediteur
httppubsacsorgcgi-binarticlecgijpcafh2003107i50pdfjp035798ypdf
Il est eacutegalement possible de consulter la thegravese sous sa forme papier ou den faire une
demande via le service de precirct entre bibliothegraveques (PEB) aupregraves du Service Commun
de Documentation de lULP pebsciencesscd-ulpu-strasbgfr
Appendix G
Partition Coefficients andEquilibrium Constants of CrownEthers between Water and OrganicSolvents Determined by ProtonNuclear Magnetic Resonance
[signalement bibliographique ajouteacute par ULP ndash SCD ndash Service des thegraveses eacutelectroniques]
Han-Wen Cheng Anne Rustenholtz Richard A Porter Xiang R Ye and Chien M
Wai
Partition coefficients and equilibrium constants of crown ethers between water
and organic solvents determined by proton nuclear magnetic resonance
J Chem Eng Data 49 594-598 (2004)
Pages 594-598
La publication preacutesenteacutee ici dans la thegravese est soumise agrave des droits deacutetenus par un eacutediteur
commercial
Pour les utilisateurs ULP il est possible de consulter cette publication sur le site de
leacutediteur
httppubsacsorgcgi-binarticlecgijceaax200449i03pdfje034195cpdf
Il est eacutegalement possible de consulter la thegravese sous sa forme papier ou den faire une
demande via le service de precirct entre bibliothegraveques (PEB) aupregraves du Service Commun
de Documentation de lULP pebsciencesscd-ulpu-strasbgfr
Appendix H
Characterization of a Tri-n-butylPhosphate-Nitric Acid Complex aCO2-Soluble Extractant forDissolution of Uranium Dioxide
[signalement bibliographique ajouteacute par ULP ndash SCD ndash Service des thegraveses eacutelectroniques]
Youichi Enokida Osamu Tomioka Su-Chen Lee Anne Rustenholtz and Chien M
Wai
Characterization of a tri-n-butyl phosphate-nitric acid complex a CO2-soluble
extractant for dissolution of uranium dioxide
Ind Eng Chem Res 42 5037-5041 (2003)
Pages 5037-5041
La publication preacutesenteacutee ici dans la thegravese est soumise agrave des droits deacutetenus par un eacutediteur
commercial
Pour les utilisateurs ULP il est possible de consulter cette publication sur le site de
leacutediteur
httppubsacsorgcgi-binarticlecgiiecred200342i21pdfie030010jpdf
Il est eacutegalement possible de consulter la thegravese sous sa forme papier ou den faire une
demande via le service de precirct entre bibliothegraveques (PEB) aupregraves du Service Commun
de Documentation de lULP pebsciencesscd-ulpu-strasbgfr
REFERENCES 203
References
1 ldquohttpwwwinscanlgovpwrmapsmapworld mapphprdquo
2 ldquohttpsci2knetchernobylradiationhtmlrdquo
3 Benedict M Pigford T H Levi H W Nuclear Chemical Engineering 2nd
ed McGraw-Hill New York 1981 p 388
4 Roberts J D Nuclear Magnetic Resonance McGraw-Hill 1959 p 14
5 ldquohttpwwwsigmaaldrichcomrdquo
6 Wiebe R Chem Rev 1941 29 475ndash481
7 Charastil J J Phys Chem 1982 86 3016
8 Benedict M Pigford T H Levi H W Nuclear Chemical Engineering 2nd
ed McGraw-Hill New York 1981 p 565
9 ldquohttpwwwocrwmdoegovrdquo
10 Benedict M Pigford T H Levi H W Nuclear Chemical Engineering 2nd
ed McGraw-Hill New York 1981 p 458ndash459
11 Sailor W C Beard C A Venneri F Davidson J W Progress in Nuclear
Energy 1994 July 7
12 ldquohttpwwwpnlgovatwrdquo
13 Benedict M Pigford T H Levi H W Nuclear Chemical Engineering 2nd
ed McGraw-Hill New York 1981 p 467
14 Smart N G Carleson T Kast T Clifford A A Burford M D Wai C M
Talanta 1997 44 137
15 Lin Y Smart N G Wai C M Trends Anal Chem 1995 14 123
REFERENCES 204
16 Wai C M Lin Y Brauer R D Wang S Beckert W F Talanta 1993
40 1325
17 Laintz K E Wai C M Yonker C R Smith R D Anal Chem 1992 64
2875
18 Dietz M L Horwitz E P Rhoads S Bartsch R A Krzykawski J J
Solvent Extr Ion Exch 1996 14 1ndash12
19 Iwacho T Sadakane A Tei K Bul Chem Soc Japan 1978 51 629
20 Kolthoff I M Can J Chem 1981 59 1548ndash1551
21 Shamsipur M Popov A I J Phys Chem 1987 91 447
22 Kolthoff I M Chantooni M K J Chem Eng Data 1997 42 49
23 Talanova G G Elkarim N S A Jr V S T R E H Hwang H
Bartsch R A Rogers R D J Am Chem Soc 1999 121 11281
24 Mochizuki S Wada N Jr R L S Inomata H Anal Commun 1999 36
51ndash52
25 Wai C M Kulyako Y M Myasoedov B F Mendeleev Commun 1999
180ndash181
26 Meguro Y Sasaki T Yoshida Z Anal Chem 1998 70 774
27 Tomioka O Meguro Y Enokida Y Yoshida Z Yamamoto I J Nucl
Sci Technol 2001 38 1097ndash1102
28 Samsonov M D Wai C M Lee S-C Kulyako Y Smart N G Chem
Commun 2001 1868ndash1869
29 Enokida Y El-Fatah S A Wai C M Ind Eng Chem Res 2002 41
2282ndash2286
REFERENCES 205
30 Carrott M J Waller B E Smart N G Wai C M Chem Commun 1998
373ndash374
31 Carrott M J Wai C M Anal Chem 1998 70 2421ndash2425
32 de Jong F Reinhoudt D N Smit C J Tetrahedron Lett 1976 17 1371ndash
1374
33 Golovkova L P Telyatnik A I Bidzilya V A Theor Exp Chem (Eng
Transl) 1984 20 219ndash222 Teor Eksp Khim 1984 20 231-234
34 Wallen S L Schoenbachler L K Dawson E D Blatchford M A Anal
Chem 2000 72(17) 4230ndash4234
35 Rustenholtz A Fulton J L Wai C M J Phys Chem A 2003 107 11239ndash
11244
36 Bryan S A Willis R R Moyer B A J Phys Chem 1990 94 5230ndash5233
37 Fulton J L Yee G G Smith R D J Am Chem Soc 1991 113 8327
38 Gupta R B Combes J R Johnston K P J Phys Chem 1993 97 707
39 Yamamoto Iwai Y Nakajima T Arai Y J Phys Chem A 1999 103
3525
40 Xu Q Han B Yan H J Phys Chem A 1999 103 5240
41 Izatt R M Pawlak K Bradshaw J S Chem Rev 1991 91 1721ndash2085
42 Dietz M L Bond A H Hay B P Chiarizia R Huber V J Her-
linger A W Chem Commun 1999 13 1177ndash1178
43 Phelps C L Smart N G Wai C M J Chem Educ 1996 12 1163ndash1168
44 Steed J W Junk P J Chem Soc Dalton Trans 1999 13 2141ndash2146
REFERENCES 206
45 Horwitz E P Schulz W W Metal-Ion Separation and Preconcentration A
H Bond and M L Dietz and R D Rogers ACS Symp Ser 716 ed Chap 2
p 20ndash50
46 Yakshin V V Vilkova O M Russ J Inorg Chem (Eng Transl) 1998 43
1629ndash1632 Zh Neorg Khim 1998 43(10) 1753-1755
47 Muzet N Engler E Wipff G J Phys Chem B 1998 102 10772ndash10788
48 Barakat N Burgard M Asfari Z Vicens J Montavon G Duplatre G
Polyhedron 1998 17 3649ndash3656
49 Mei E Dye J L Popov A L J Am Chem Soc 19760 98 1619ndash1620
50 Mei E Popov A L Dye J L J Am Chem Soc 1977 99 6532ndash6536
51 Thury M N Bryan J C Lamare V Dozol J F Asfari Z Vicens J J
Chem Soc Dalton Trans 1997 22 4191ndash4202
52 de Namor A F D Yelarde F J S Casal A R Pugliese A Goitia M T
Montero M Lopez F F J Chem Soc Faraday Trans 1997 93 3955ndash3959
53 Rhangino G Romano S Lehn J M Wipff G J Am Chem Soc 1985
103 7873
54 Vayssiere P Wipff G Phys Chem Chem Phys 2003 5 127
55 Herzberg G Molecular spectra amp molecular structure Infrared and Raman Spec-
tra of polyatomic molecules Van Norstrand Reinhold LTD Company 1945 p
282
56 ldquohttpwebbooknistgovrdquo
57 OShea K E Kirmse K M Fox M A Johnston K P J Phys Chem
1991 95 7863
REFERENCES 207
58 Weast R C Ed Handbook of chemistry and physics CRC press Inc Boca
Raton Florida first student ed 1988 Endash44 and Endash52
59 Jackson K Bowman L E Fulton J L Anal Chem 1995 67(14) 2368ndash2372
60 Penninger J M L Supercritical fluid technology Elsevier Science Amsterdam
1985 p 191
61 Chen M J private communication on NMR experiments done in Argonne Na-
tional Laboratory 2001
62 Woelk K Rathke J W Klinger R J J magn reson A 1994 109 137ndash146
63 Baaden M Schurhammer R Wipff G J Phys Chem B 2002 106 434ndash441
64 Schurhammer R Wipff G New J Chem 2002 26 229ndash233
65 Weast R C Ed Handbook of chemistry and physics CRC press Inc Boca
Raton Florida first student ed 1988 C-428
66 Choi K Tedder D W Spectrochim acta A 1995 51 2301ndash2305
67 Meguro Y Iso S Takeishi H Yoshida Z Radiochim acta 1996 75 185
68 Tomioka O Meguro Y ISO S Yoshida Z Enokida Y Yamamoto I J
Nucl Sci Technol 2001 38 461ndash462
69 Shimada T Ogumo S Ishihara N Kosaka Y Mori Y J Nucl Sci
Technol 2002 3 757ndash760
Extraction en Milieu Supercritique
Etude Spectroscopic des Interactions ndash
Comparaison avec des Solvants Classiques
par
Anne RUSTENHOLTZ FARAWILA1
Sous la direction de
Dr Isabelle BILLARD KLEIN2 et Prof Chien M WAI3
Le dioxyde de carbone supercritique (SF-CO2) a ete choisi afin drsquoetudier lrsquoextraction enmilieu supercritique drsquoions metalliques tels que le cesium et lrsquouranium Un interet parti-culier a ete porte au role de lrsquoeau lors de ces extractions ainsi qursquoa son interaction avecdes agents chelateurs (AC) En premiere partie les ethers couronne ont ete choisis commeAC du cesium et leur interaction avec lrsquoeau a ete etudiee dans le SF-CO2 en utilisant laspectroscopie InfraRouge a Transformee de Fourier (IR-TF) Une configuration sandwichentre deux ethers couronne et une molecule drsquoeau a ete observee dans le SF-CO2 Pour lesconfigurations simple et pontee lrsquoequilibre a ete defini et lrsquoenthalpie de formation de la liai-son hydrogene a ete calculee Ces resultats ont ensuite ete compares a ceux obtenus dansdes melanges de CHCl3 et de CCl4 en utilisant la spectroscopie a Resonance MagnetiqueNucleaire (RMN) Pour conclure cette premiere partie le role de lrsquoeau a ete etudie lorsde lrsquoextraction du picrate de cesium par le DCH18C6 et les constantes drsquoequilibre ont etedetermineesDans une deuxieme partie lrsquoextraction de lrsquouranium a ete etudiee dans le SF-CO2 Descomplexes de Phosphate de TriButyle (TBP) drsquoeau et drsquoacide nitrique ont ete utilisescomme AC et oxydants LrsquoIR-TF a ete utilisee pour etudier lrsquointeraction entre le TBP etlrsquoeau dans le SF-CO2 Ces resultats ont ete compares a ceux trouves dans le CHCl3 enutilisant la RMN Cette meme spectroscopie a ete utilisee pour comprendre les inter-actions entre lrsquoacide nitrique le TBP et lrsquoeau seuls puis dissous dans du CHCl3 Laformation de microgouttelettes drsquoacide et drsquoeau dues a lrsquoeffet anti-solvant a ete observeeet quantifiee Pour conclure ce travail de these jrsquoai reussi a optimiser lrsquoextraction et larecuperation drsquouranium enrichi provenant de cendres drsquoincineration de dechets de fabri-cation de combustible nucleaire Un complexe de TBP drsquoeau et drsquoacide nitrique dissousdans du SF-CO2 a ete utilise a cette finMots clefs Retraitement ndash Dechets nucleaires ndash RMN ndash IR ndash Extraction ndash Fluides su-percritiques ndash CO2 ndash Dioxyde de carbone ndash Solvants ndash Acide nitrique ndash Uranium ndash Cesiumndash Eau ndash Ethers couronne ndash TBP ndash Uranyle ndash Liaison hydrogene ndash Effet anti-solvant
1Anne Farawilahotmailcom2IReS UMR7500 CNRSIN2P3 - ULP Chimie Nucleaire ndash Bat 35 ndash 23 rue de Loess ndash BP 28
ndash 67037 Strasbourg cedex 2 ndash France3University of Idaho ndash Department of Chemistry ndash Moscow ID 83844-2344 ndash USA