Sunz2013 emmanuel jo
27
The development and validation of a “Virtual Diabetes Register” (VDR) for monitoring diabetes prevalence and the quality of diabetes care in New Zealand • Emmanuel Jo1, Paul Drury2, • 1.New Zealand Ministry of Health, 2.Auckland Diabetes Centre and New Zealand Society for the Study of Diabetes
-
date post
19-Oct-2014 -
Category
Documents
-
view
486 -
download
3
description
Transcript of Sunz2013 emmanuel jo
The development and validation of a “Virtual
Diabetes Register” (VDR) for monitoring
diabetes prevalence and the quality of
diabetes care in New Zealand
• Emmanuel Jo1, Paul Drury2,
• 1.New Zealand Ministry of Health,
2.Auckland Diabetes Centre and New Zealand Society for the
Study of Diabetes
What is Diabetes Mellitus (DM)
• DM defines a condition of a person having too
much glucose (sugar) in the blood.
• This is because the pancreas cannot make
enough insulin.
• Simply, the body can not control glucose level
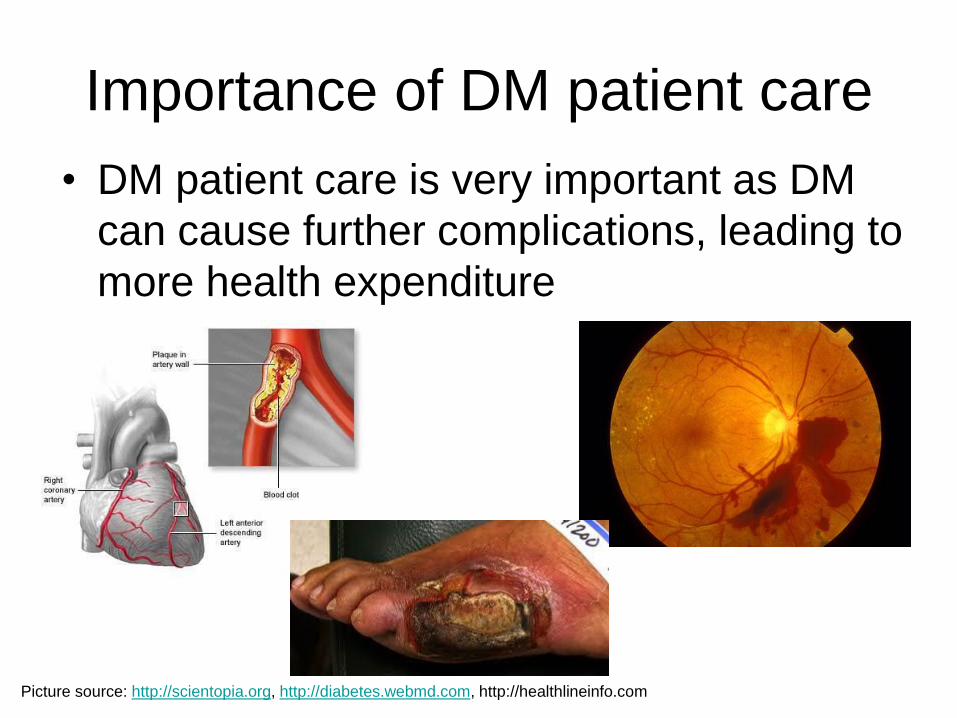
Importance of DM patient care
• DM patient care is very important as DM
can cause further complications, leading to
more health expenditure
Picture source: http://scientopia.org, http://diabetes.webmd.com, http://healthlineinfo.com
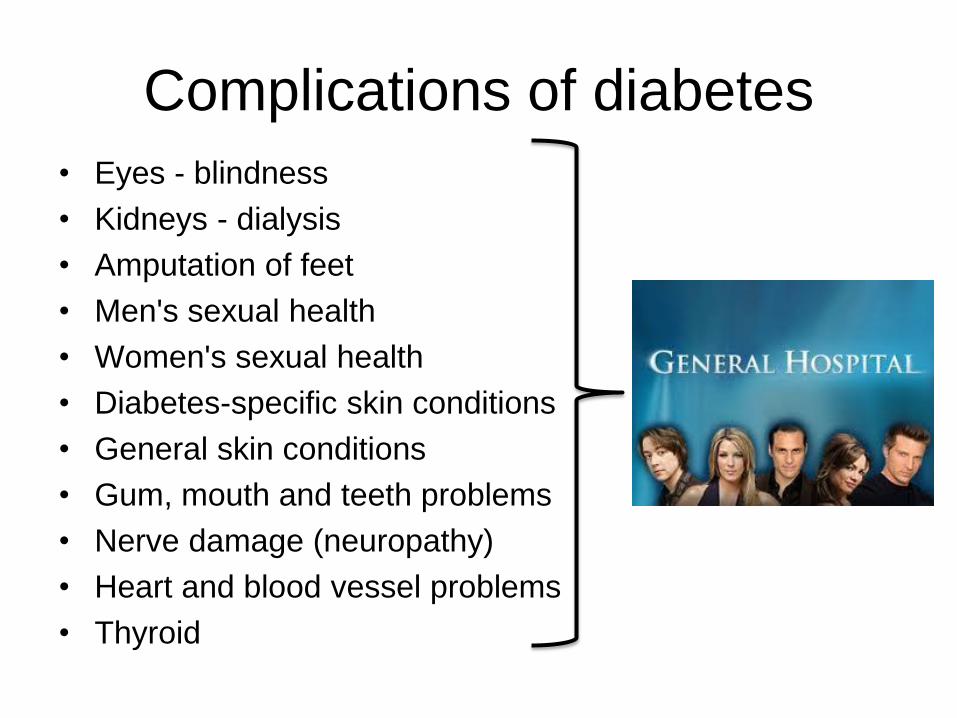
Complications of diabetes
• Eyes - blindness
• Kidneys - dialysis
• Amputation of feet
• Men's sexual health
• Women's sexual health
• Diabetes-specific skin conditions
• General skin conditions
• Gum, mouth and teeth problems
• Nerve damage (neuropathy)
• Heart and blood vessel problems
• Thyroid
What we knew about DM prevalence
prior to 2008/09
• About 100,000~300,000 DM patients in New
Zealand (depends on which survey)
• Maori/Pacific are about 10 years earlier to have
diabetes than others in New Zealand
What MOH does for DM?
• Ministry of Health (MOH) set targets for each
local *District Health Board (DHB).
• The percentage of free annual diabetes checks
is defined to be a measure of access to good
quality care for Diabetes Mellitus (DM) patients.
• It monitors the level of glycosylated hemoglobin
(HbA1c; a measure of diabetes management)
and fasting lipid test (a measure of
Cardiovascular Disease (CVD) risk)
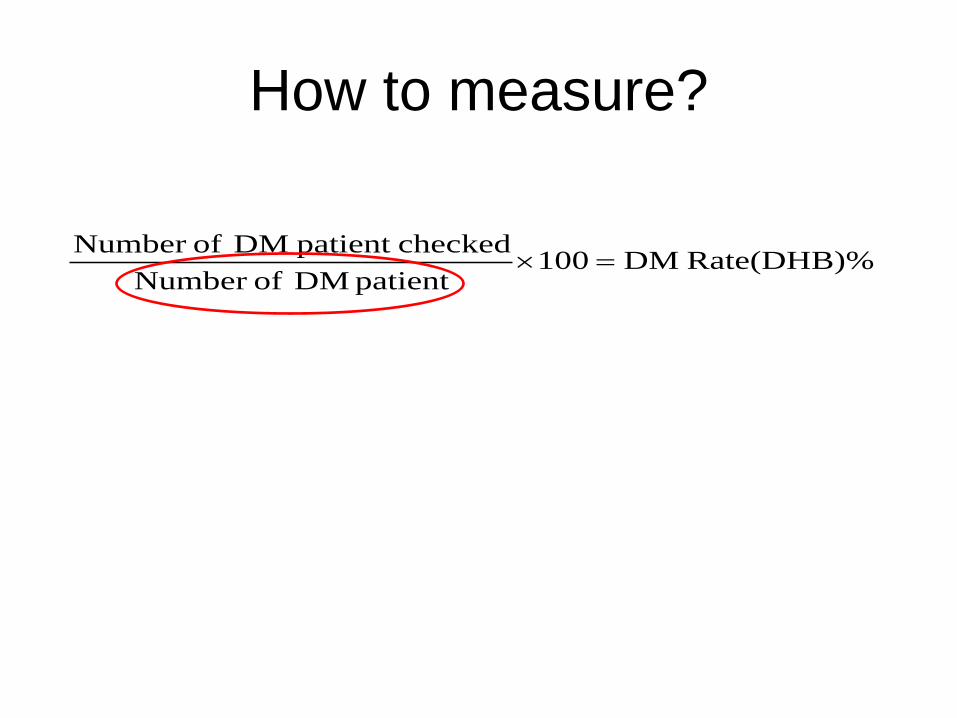
How to measure?
Rate(DHB)% DM100patientDM ofNumber
checkedpatient DM ofNumber

Health Survey
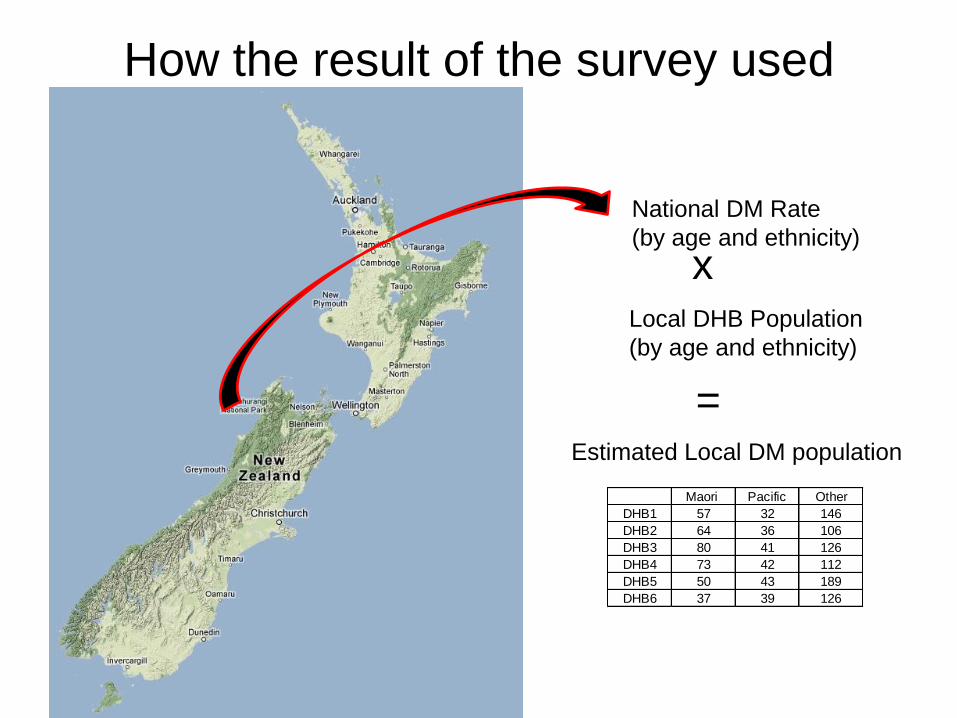
How the result of the survey used
National DM Rate
(by age and ethnicity)
x Local DHB Population
(by age and ethnicity)
Estimated Local DM population
=
Maori Pacific Other
DHB1 57 32 146
DHB2 64 36 106
DHB3 80 41 126
DHB4 73 42 112
DHB5 50 43 189
DHB6 37 39 126
0%
20%
40%
60%
80%
100%
120%
140%
Ge
t C
hec
ke
d a
s a
% o
f e
sti
ma
ted
nu
mb
er
w
ith
kn
ow
n d
iab
ete
s
DHB
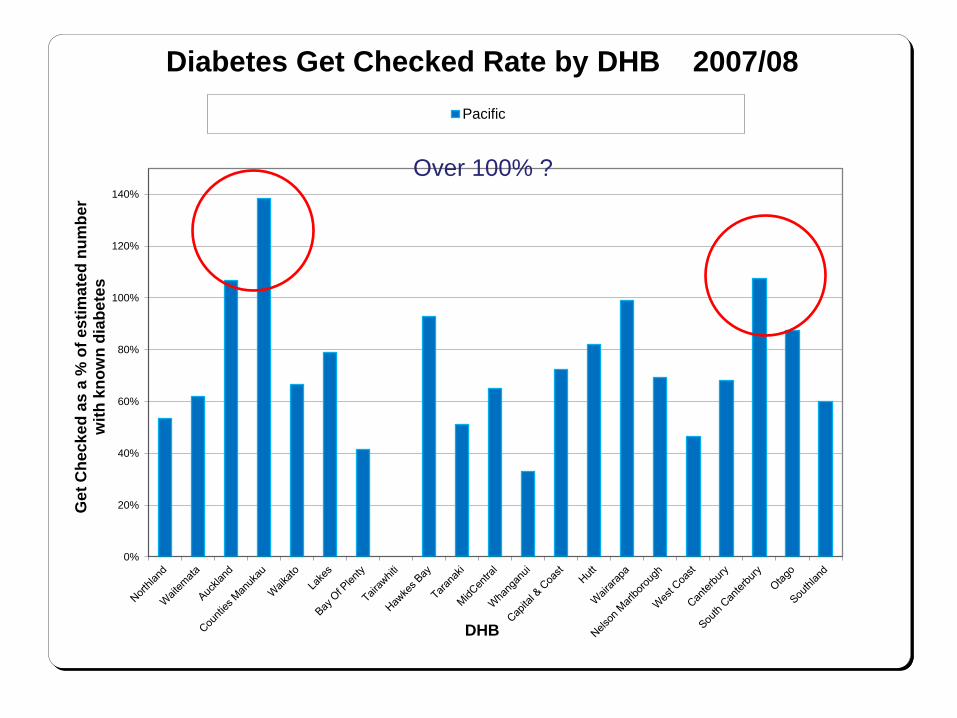
Diabetes Get Checked Rate by DHB 2007/08
Pacific
Over 100% ?
What MOH wanted
• New Zealand wished to establish a
database where individuals can be located
so that it can reveal specific data from the
pool of data set
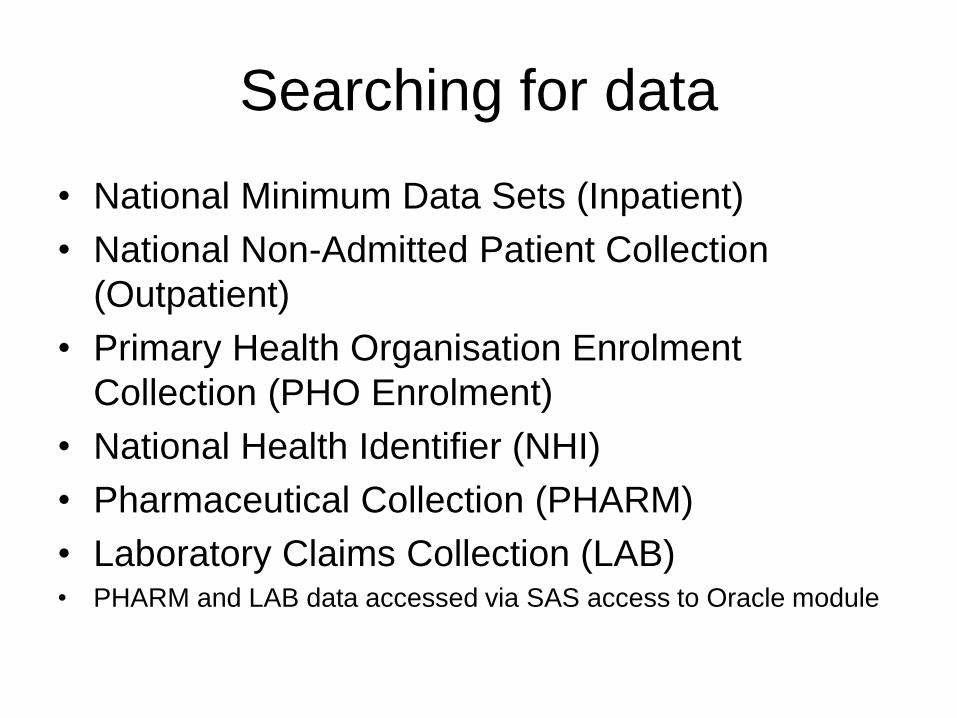
Searching for data
• National Minimum Data Sets (Inpatient)
• National Non-Admitted Patient Collection
(Outpatient)
• Primary Health Organisation Enrolment
Collection (PHO Enrolment)
• National Health Identifier (NHI)
• Pharmaceutical Collection (PHARM)
• Laboratory Claims Collection (LAB) • PHARM and LAB data accessed via SAS access to Oracle module
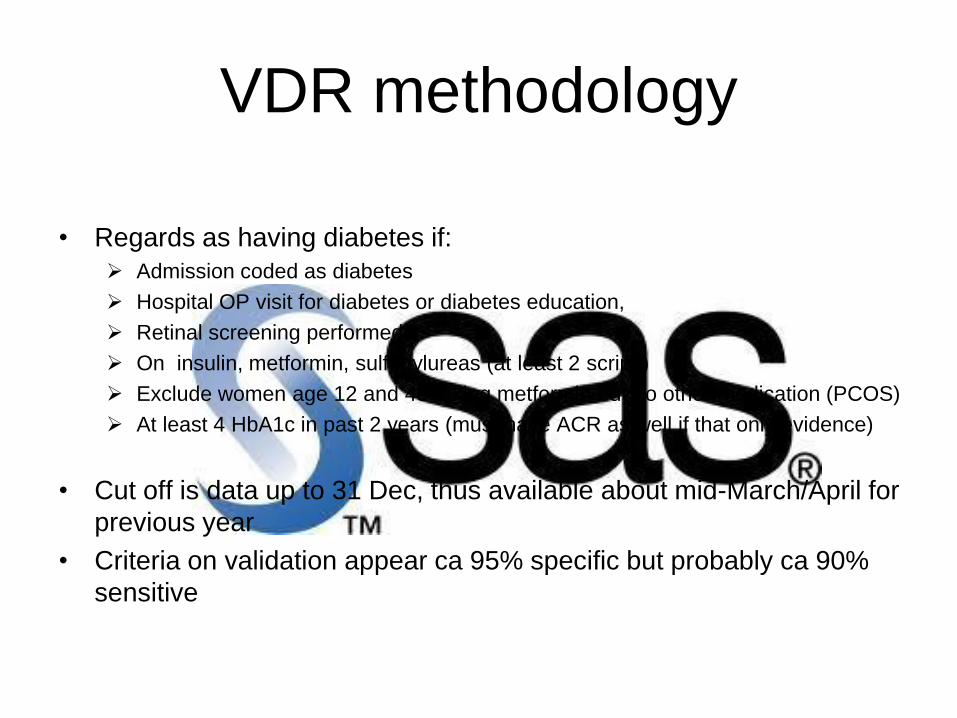
VDR methodology
• Regards as having diabetes if:
Admission coded as diabetes
Hospital OP visit for diabetes or diabetes education,
Retinal screening performed
On insulin, metformin, sulfonylureas (at least 2 scrips)
Exclude women age 12 and 45 taking metformin but no other medication (PCOS)
At least 4 HbA1c in past 2 years (must have ACR as well if that only evidence)
• Cut off is data up to 31 Dec, thus available about mid-March/April for
previous year
• Criteria on validation appear ca 95% specific but probably ca 90%
sensitive
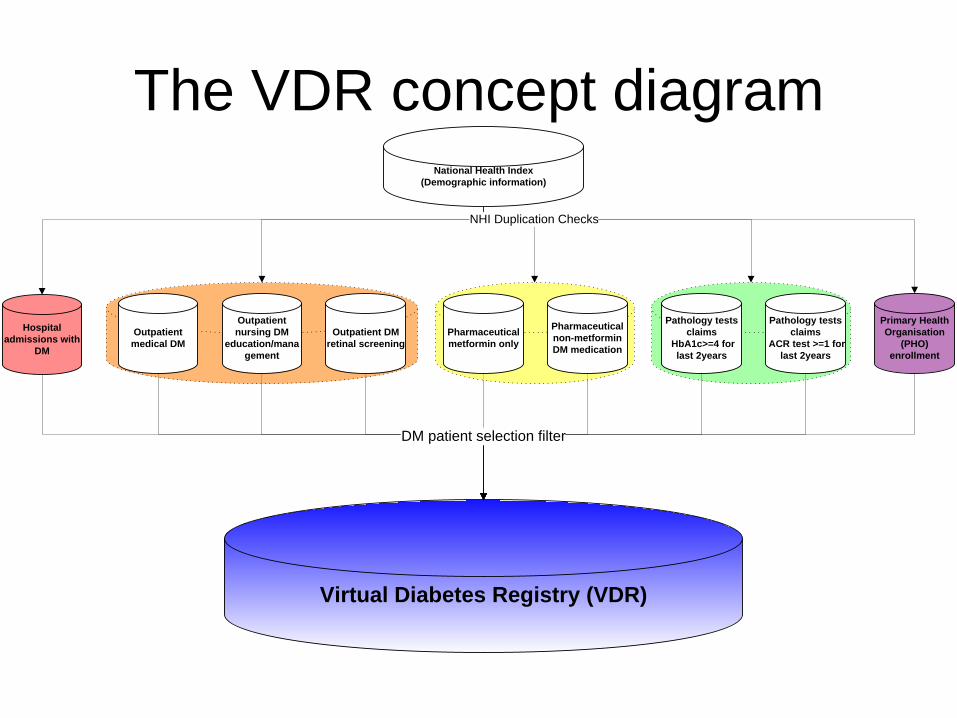
The VDR concept diagram
Hospital
admissions with
DM
National Health Index
(Demographic information)
Primary Health
Organisation
(PHO)
enrollment
Virtual Diabetes Registry (VDR)
NHI Duplication Checks
DM patient selection filter
Outpatient
medical DM
Outpatient
nursing DM
education/mana
gement
Outpatient DM
retinal screening
Pharmaceutical
metformin only
Pharmaceutical
non-metformin
DM medication
Pathology tests
claims
HbA1c>=4 for
last 2years
Pathology tests
claims
ACR test >=1 for
last 2years
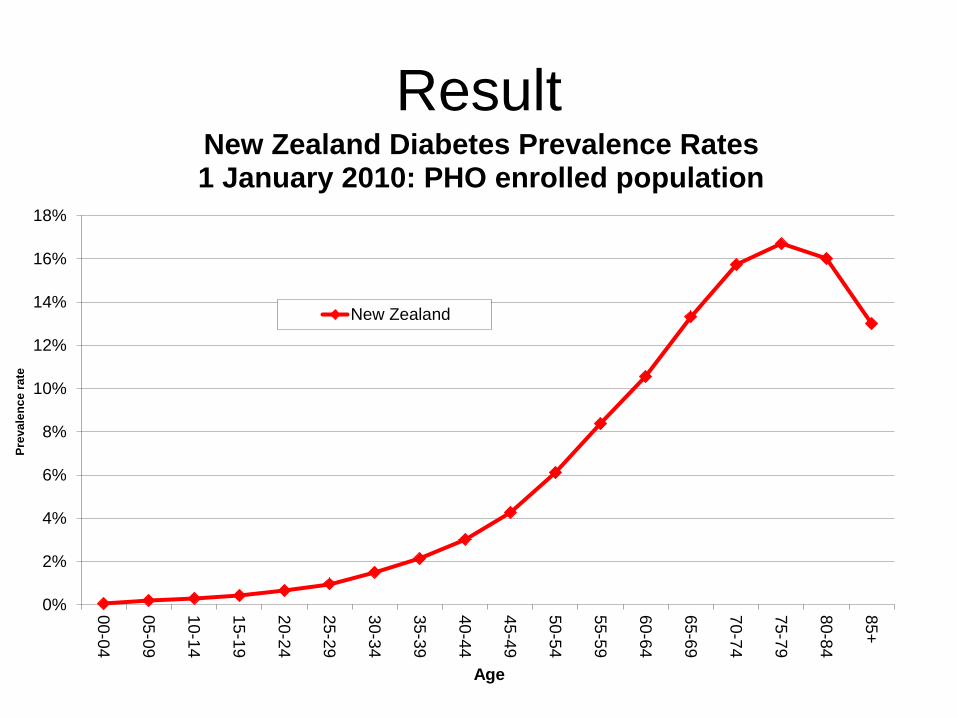
Result
0%
2%
4%
6%
8%
10%
12%
14%
16%
18%
00-0
4
05-0
9
10-1
4
15-1
9
20-2
4
25-2
9
30-3
4
35-3
9
40-4
4
45-4
9
50-5
4
55-5
9
60-6
4
65-6
9
70-7
4
75-7
9
80-8
4
85+
Pre
va
len
ce
ra
te
Age
New Zealand Diabetes Prevalence Rates1 January 2010: PHO enrolled population
New Zealand
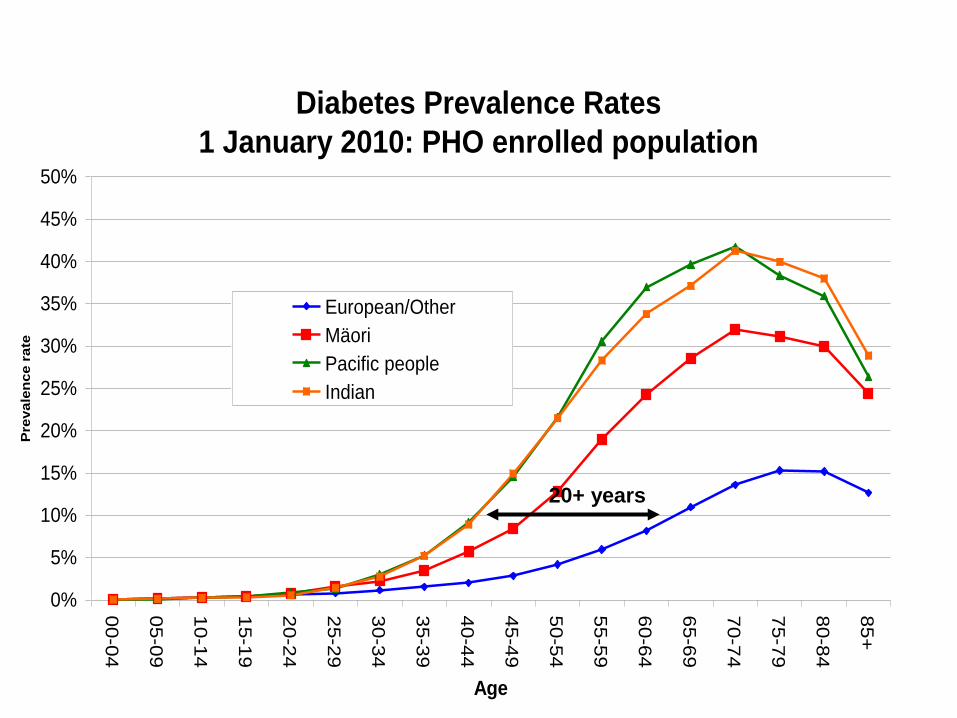
Diabetes Prevalence Rates
1 January 2010: PHO enrolled population
0%
5%
10%
15%
20%
25%
30%
35%
40%
45%
50%
00
-04
05
-09
10
-14
15
-19
20
-24
25
-29
30
-34
35
-39
40
-44
45
-49
50
-54
55
-59
60
-64
65
-69
70
-74
75
-79
80
-84
85+
Age
Pre
vale
nce r
ate
European/Other
Mäori
Pacific people
Indian
20+ years
0%
5%
10%
15%
20%
25%
30%
35%
40%
45%
50%
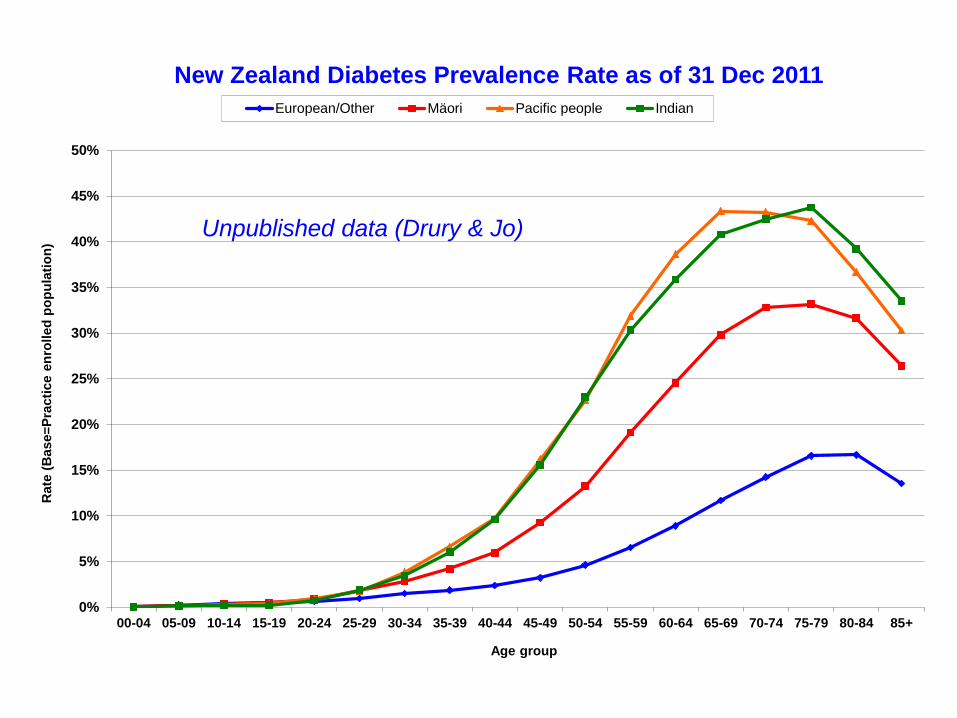
00-04 05-09 10-14 15-19 20-24 25-29 30-34 35-39 40-44 45-49 50-54 55-59 60-64 65-69 70-74 75-79 80-84 85+
Rate
(B
ase=
Pra
cti
ce e
nro
lled
po
pu
lati
on
)
Age group
New Zealand Diabetes Prevalence Rate as of 31 Dec 2011
European/Other Mäori Pacific people Indian
Unpublished data (Drury & Jo)
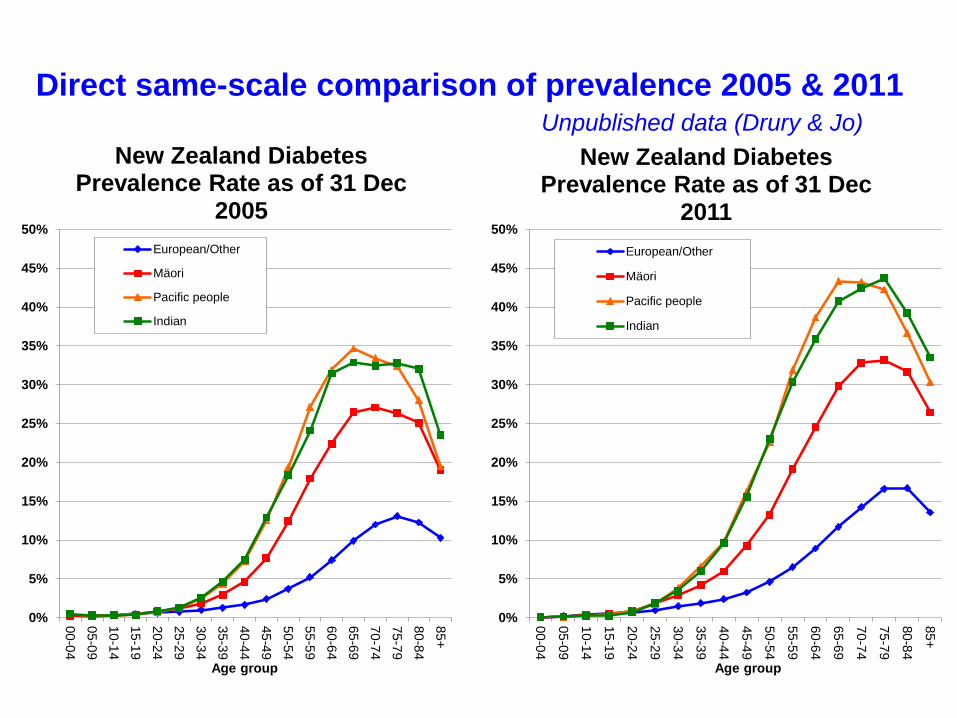
Direct same-scale comparison of prevalence 2005 & 2011
Unpublished data (Drury & Jo)
0%
5%
10%
15%
20%
25%
30%
35%
40%
45%
50%
00
-04
05
-09
10
-14
15
-19
20
-24
25
-29
30
-34
35
-39
40
-44
45
-49
50
-54
55
-59
60
-64
65
-69
70
-74
75
-79
80
-84
85
+
Age group
New Zealand Diabetes Prevalence Rate as of 31 Dec
2005
European/Other
Mäori
Pacific people
Indian
0%
5%
10%
15%
20%
25%
30%
35%
40%
45%
50%
00
-04
05
-09
10
-14
15
-19
20
-24
25
-29
30
-34
35
-39
40
-44
45
-49
50
-54
55
-59
60
-64
65
-69
70
-74
75
-79
80
-84
85
+
Age group
New Zealand Diabetes Prevalence Rate as of 31 Dec
2011
European/Other
Mäori
Pacific people
Indian
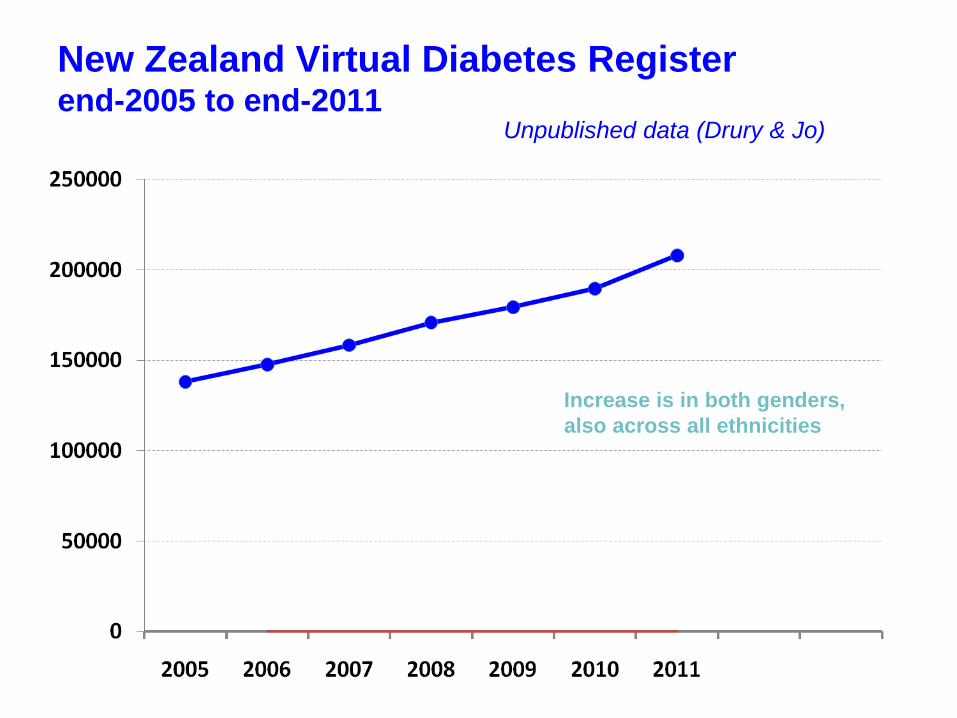
New Zealand Virtual Diabetes Register end-2005 to end-2011
Increase is in both genders,
also across all ethnicities
Unpublished data (Drury & Jo)
0%
1%
2%
3%
4%
5%
6%
7%
8%
No
rthlan
d
Waite
mata
Au
ckland
Co
un
ties
Man
ukau
Waikato
Lakes
Bay o
f Ple
nty
Tairawh
iti
Haw
kes Bay
Taranaki
Mid
Ce
ntral
Wh
angan
ui
Cap
ital and
Co
ast
Hu
tt
Wairarap
a
Ne
lson
Marlb
oro
ugh
West C
oast
Can
terb
ury
Sou
thC
ante
rbu
ry
Sou
thern
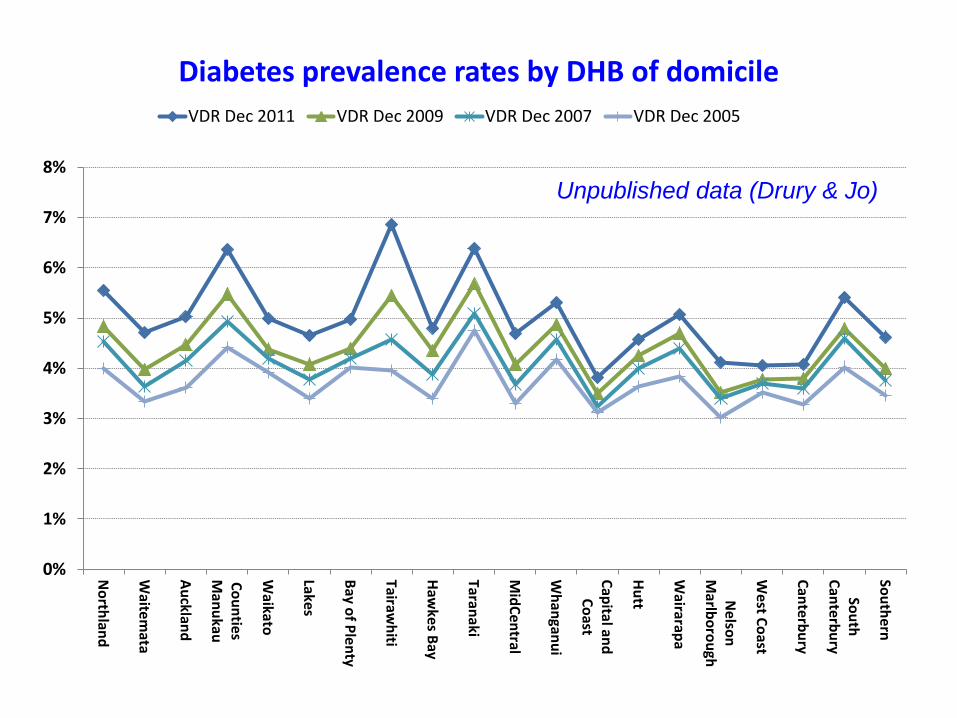
Diabetes prevalence rates by DHB of domicile
VDR Dec 2011 VDR Dec 2009 VDR Dec 2007 VDR Dec 2005
Unpublished data (Drury & Jo)
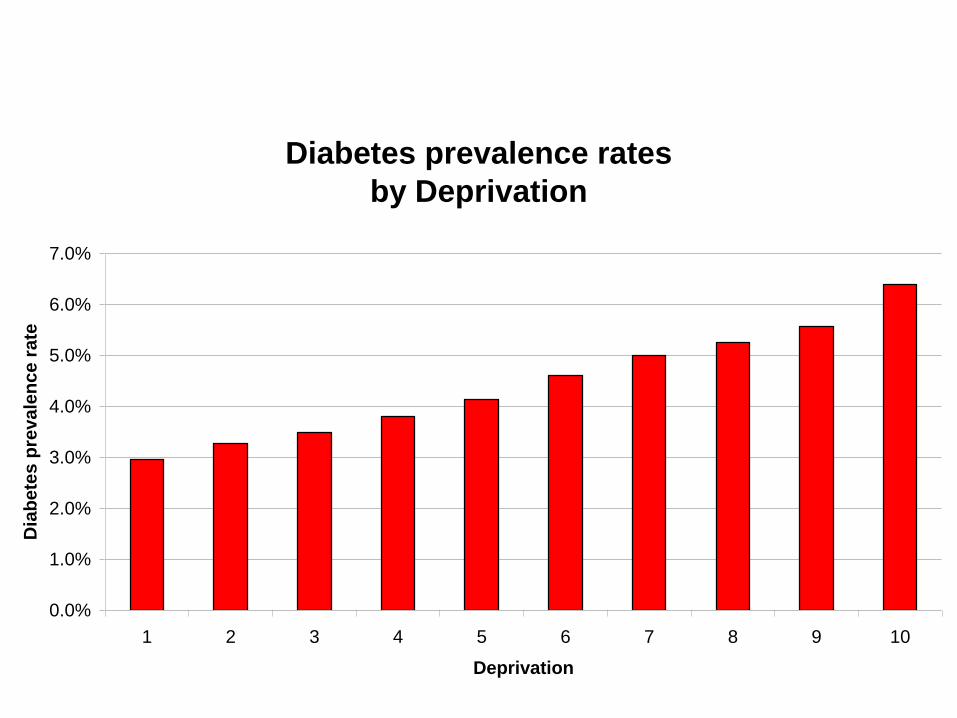
Diabetes prevalence rates
by Deprivation
0.0%
1.0%
2.0%
3.0%
4.0%
5.0%
6.0%
7.0%
1 2 3 4 5 6 7 8 9 10
Deprivation
Dia
bete
s p
revale
nce r
ate
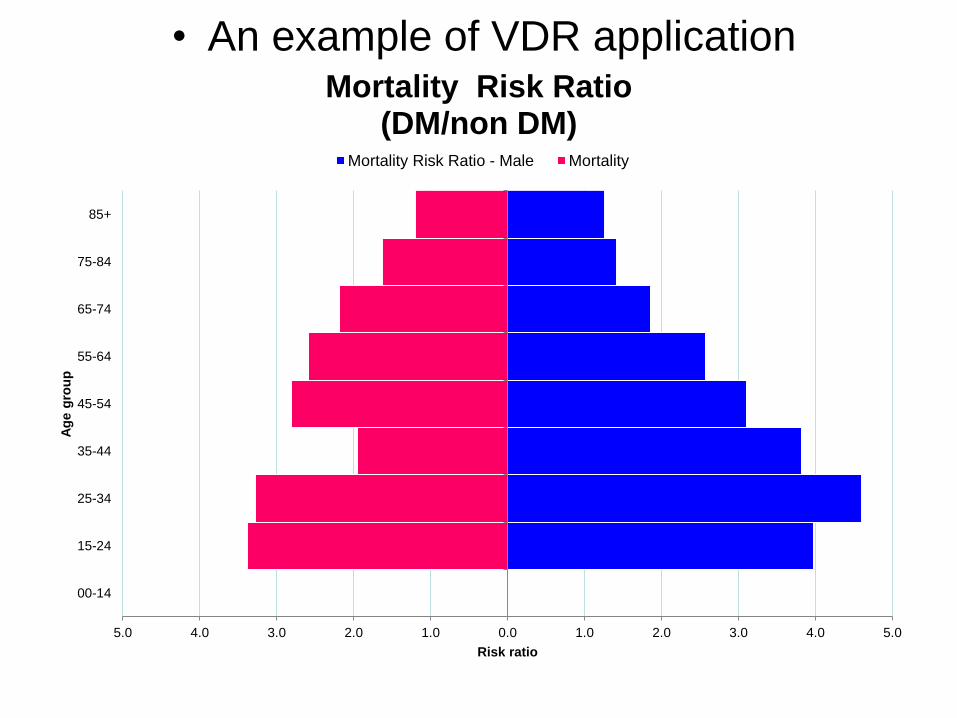
• An example of VDR application
5.0 4.0 3.0 2.0 1.0 0.0 1.0 2.0 3.0 4.0 5.0
00-14
15-24
25-34
35-44
45-54
55-64
65-74
75-84
85+
Risk ratio
Ag
e g
rou
p
Mortality Risk Ratio (DM/non DM)
Mortality Risk Ratio - Male Mortality
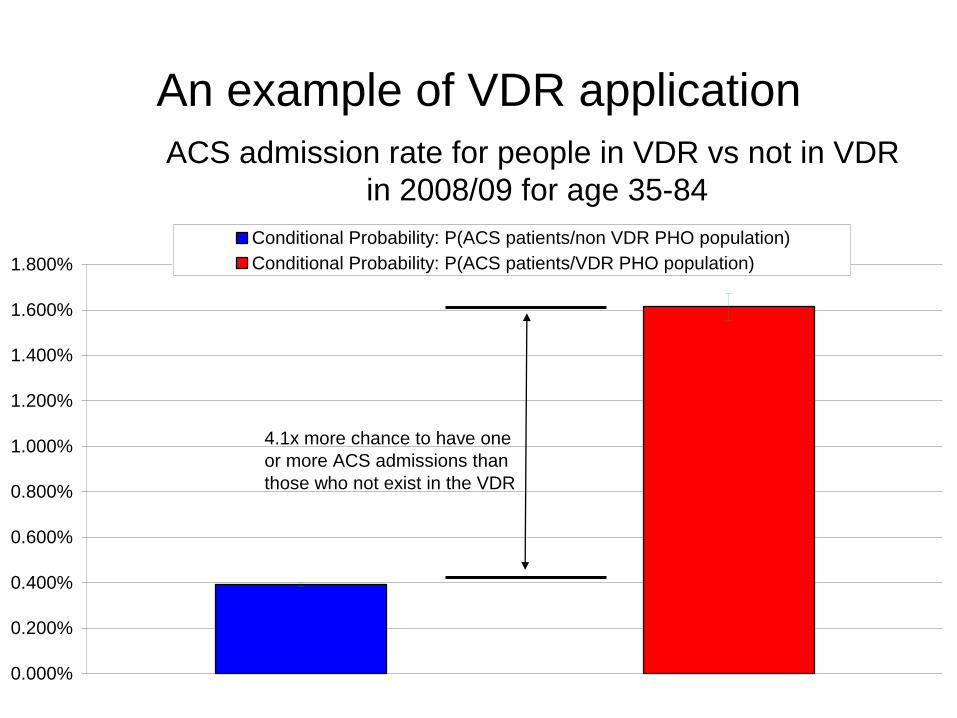
An example of VDR application
ACS admission rate for people in VDR vs not in VDR
in 2008/09 for age 35-84
0.000%
0.200%
0.400%
0.600%
0.800%
1.000%
1.200%
1.400%
1.600%
1.800%
Conditional Probability: P(ACS patients/non VDR PHO population)
Conditional Probability: P(ACS patients/VDR PHO population)
4.1x more chance to have one
or more ACS admissions than
those who not exist in the VDR
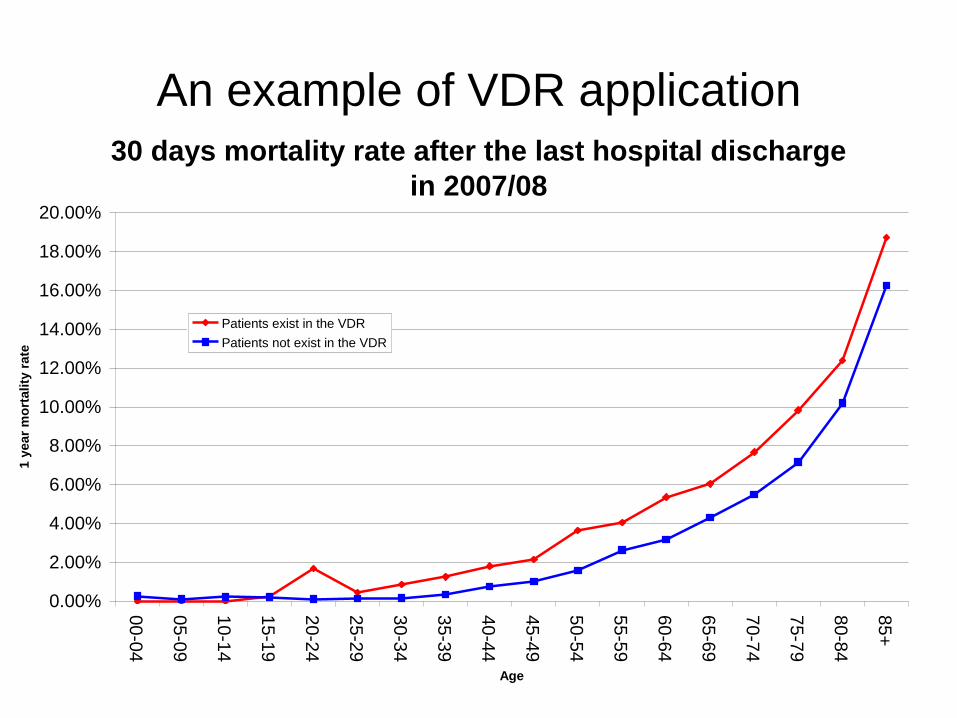
An example of VDR application
30 days mortality rate after the last hospital discharge
in 2007/08
0.00%
2.00%
4.00%
6.00%
8.00%
10.00%
12.00%
14.00%
16.00%
18.00%
20.00%
00-0
4
05-0
9
10-1
4
15-1
9
20-2
4
25-2
9
30-3
4
35-3
9
40-4
4
45-4
9
50-5
4
55-5
9
60-6
4
65-6
9
70-7
4
75-7
9
80-8
4
85+
Age
1 y
ear
mo
rta
lity
ra
te
Patients exist in the VDR
Patients not exist in the VDR
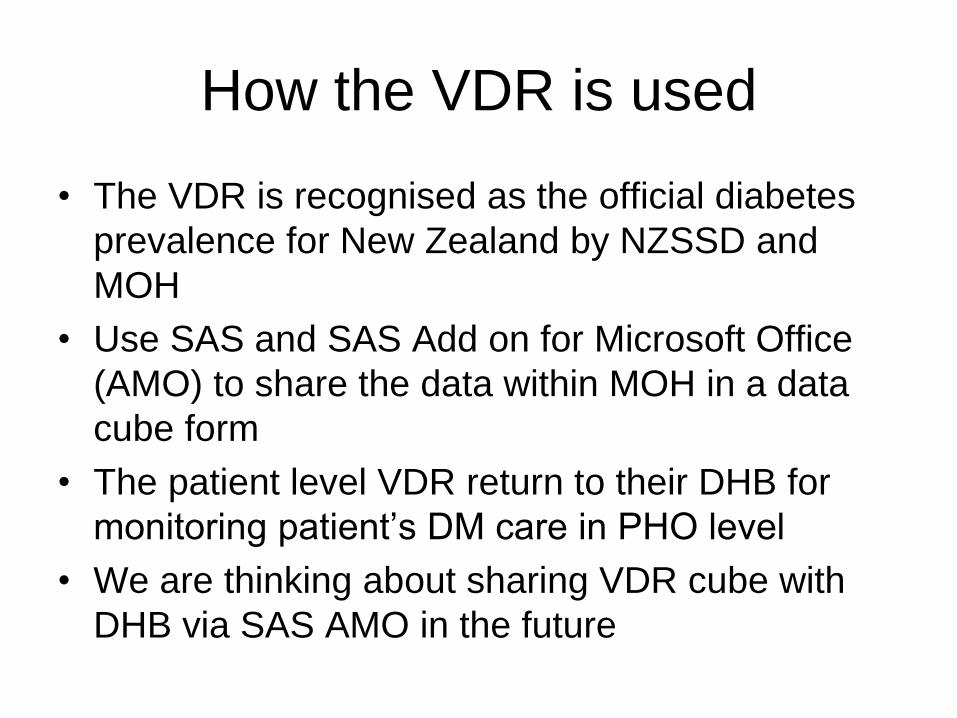
How the VDR is used
• The VDR is recognised as the official diabetes
prevalence for New Zealand by NZSSD and
MOH
• Use SAS and SAS Add on for Microsoft Office
(AMO) to share the data within MOH in a data
cube form
• The patient level VDR return to their DHB for
monitoring patient’s DM care in PHO level
• We are thinking about sharing VDR cube with
DHB via SAS AMO in the future
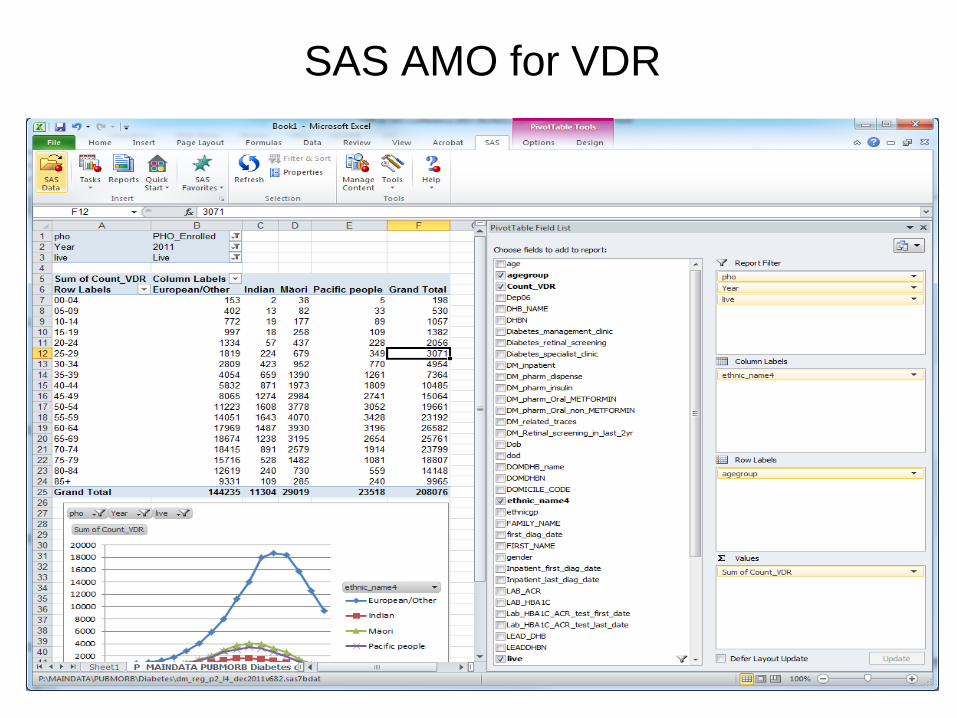
SAS AMO for VDR
Conclusions
• Superior method involves the whole diabetes population in comparison to sampling used in other national surveys
• The central authority monitors and local primary care organizations can monitor
• Very accurate and robust: reveal the true representation
• The VDR is the best option to monitor diabetes prevalence unless the national diabetes registry is established.
• The VDR is invaluable for monitoring national prevalence and supporting clinical quality improvements.
• The VDR is readily applicable to other areas to investigate the correlation between the two or amongst many other factors
• SAS has been the key tool to develop and share the VDR in very effective way