Sunk costs and cartel formation: Theory and …schmitt/JEBOart1.pdfSunk costs and cartel formation:...
24
Sunk costs and cartel formation: Theory and application to the dyestuff industry Nicolas Schmitt a , Rolf Weder b,1,* a Simon Fraser University, Department of Economics, Burnaby, BC, V5A 156, Canada b University of British Columbia, Department of Economics, Vancouver, BC V6T 1Z1, Canada Received 10 June 1996; received in revised form 5 July 1997; accepted 8 August 1997 Abstract We first develop a simple model of entry showing that cartels are more likely to emerge during periods of downturns and in industries with significant sunk costs. Cartel formation is also accompanied by a decline in profits. We then use the framework to investigate the emergence of the Swiss dyestuff export cartel during the inter-war period and find empirical evidence that supports the main predictions of the model. The analysis indicates that sunk costs and entry may be important determinants of cartel formation and are complementary to the traditional cartel stability conditions. # 1998 Elsevier Science B.V. All rights reserved JEL classification: L12; L13; L65; L68 Keywords: Oligopoly; Cartel; Collusion; Protection; Chemical industry 1. Introduction The purpose of this article is to investigate the role of entry and sunk costs for cartel formation. We build a simple model to analyze the timing of cartel formation and apply it to the dyestuff export cartel which was established in Switzerland during the inter-war period. Without relying on arguments about firms’ cheating, the model predicts that cartels are more likely to emerge during downturns and in industries with high irreversible set-up costs. Moreover, profits should decline with cartel formation. We use the model to explain the timing of the emergence of the dyestuff cartel. Journal of Economic Behavior & Organization Vol. 36 (1998) 197–220 * Corresponding author. 1 Also associated with University of Basel, Switzerland 0167-2681/98/$19.00 # 1998 Elsevier Science B.V. All rights reserved PII S0167-2681(98)00062-6
Transcript of Sunk costs and cartel formation: Theory and …schmitt/JEBOart1.pdfSunk costs and cartel formation:...

Sunk costs and cartel formation: Theory and
application to the dyestuff industry
Nicolas Schmitta, Rolf Wederb,1,*
a Simon Fraser University, Department of Economics, Burnaby, BC, V5A 156, Canadab University of British Columbia, Department of Economics, Vancouver, BC V6T 1Z1, Canada
Received 10 June 1996; received in revised form 5 July 1997; accepted 8 August 1997
Abstract
We first develop a simple model of entry showing that cartels are more likely to emerge during
periods of downturns and in industries with significant sunk costs. Cartel formation is also
accompanied by a decline in profits. We then use the framework to investigate the emergence of the
Swiss dyestuff export cartel during the inter-war period and find empirical evidence that supports
the main predictions of the model. The analysis indicates that sunk costs and entry may be
important determinants of cartel formation and are complementary to the traditional cartel stability
conditions. # 1998 Elsevier Science B.V. All rights reserved
JEL classi®cation: L12; L13; L65; L68
Keywords: Oligopoly; Cartel; Collusion; Protection; Chemical industry
1. Introduction
The purpose of this article is to investigate the role of entry and sunk costs for cartel
formation. We build a simple model to analyze the timing of cartel formation and apply it
to the dyestuff export cartel which was established in Switzerland during the inter-war
period. Without relying on arguments about firms' cheating, the model predicts that
cartels are more likely to emerge during downturns and in industries with high
irreversible set-up costs. Moreover, profits should decline with cartel formation. We use
the model to explain the timing of the emergence of the dyestuff cartel.
Journal of Economic Behavior & Organization
Vol. 36 (1998) 197±220
* Corresponding author.1 Also associated with University of Basel, Switzerland
0167-2681/98/$19.00 # 1998 Elsevier Science B.V. All rights reserved
PII S 0 1 6 7 - 2 6 8 1 ( 9 8 ) 0 0 0 6 2 - 6

There is extensive literature on cartel stability which investigates how structural
parameters (like the price elasticity of demand) or shocks (like changes in demand) affect
a cartel member's incentive to cheat (see Stigler, 1964).2 Interesting results have also
been found in the literature on the stability of tacit collusion in infinitely repeated games.
In particular, Green and Porter (1984) show that, with secret price cuts, tacit collusion is
more likely to hold during periods of booms. Rotemberg and Saloner (1986), however,
argue that tacit collusion is more likely to be stable during periods of downturns if prices
are observable and if downturns are expected to be temporary. Haltiwanger and
Harrington (1991) reverse this last result when shocks are permanent, and, generalizing
some of these models, Bagwell and Staiger (1995) are consistent with both results.
Although models of tacit collusion do not require explicit agreements among firms,
they are still useful to analyze cartel behavior as they provide an incentive compatibility
constraint that cartel members should satisfy. They can thus be used to predict when
cartels emerge. For instance, Rotemberg and Saloner's model could be used to claim that
cartels are more likely to emerge during downturns, whereas, with Haltiwanger and
Harrington (1991) or Green and Porter (1984), the opposite is true.
Whether framed in a static (as in the traditional models of cartels) or in a dynamic
approach (as in the tacit collusion approach), all these models rely on collusion instability
due to the possibility that firms deviate from some target. All ignore sunk costs as well as
entry which may arise from collusion (or cartelization) itself. In this paper, we argue that
sunk costs and entry may be as important determinants of cartel formation as stability
conditions. For this reason, we develop a simple cartel model where entry plays a key role
but where all considerations of instability are ignored.
Over the last 15 years, entry and sunk costs have played an increasing role in the theory
of market structure. Today, we have theories predicting when entry matters for
competition (contestability theory), and when entry can be prevented by incumbent firms
(market preemption theory).3 Sunk costs have also become an important element for
investment decisions (Dixit and Pindyck, 1994) and in the choice of corporate governance
structure (Williamson, 1985; Whyte, 1994). However, thus far, entry and sunk costs have
not played a major role in our understanding of cartel formation.
The few articles where sunk costs and entry are used to explain cartels rely on the
theory of the empty core (Sjostrom, 1989; Pirrong, 1992; Telser, 1994). In this approach,
unrestricted entry implies that cartel members earn no pure profits. When demand
fluctuates and production has indivisibilities (due to sunk cost), efficient production with
a stable number of firms can only be achieved with a change in firms' behavior. Cartels,
earning competitive returns in periods of downturns, are then possible. Sjostrom (1989)
and Pirrong (1992) argue that this approach fits well with the case of the ocean shipping
industry. Our approach is different as it does not rely on the theory of the core, and free-
entry equilibria are not characterized by competitive rates of return. Our aim is to
understand cartel formation in oligopolistic industries. Hence, pure profits become
2 Although there exist conditions for a cartel to be stable (see, e.g. d'Aspremont et al., 1983), the broadlyaccepted wisdom is that cartels are inherently unstable. Studies investigating the internal organization of specificcartels include Porter (1983) and an empirical survey of cartel instability can be found in Suslow (1988) andMarquez (1992).
3 See Gilbert (1989) and Shapiro (1989) for surveys of this literature.
198 N. Schmitt, R. Weder / J. of Economic Behavior & Org. 36 (1998) 197±220

possible and indeed it is the willingness to protect the firms' quasi-rents in periods of
downturns which explains why cartels might emerge. As a result, we expect cartels to
earn a lower rate of return than before their formation; a prediction which is different
from other models.
In Section 2, we show that if potential firms face significant setup costs of entry,
cartelization without attracting entry becomes possible whenever the industry faces a decline
in profits due to structural changes. Simply, the incumbents exploit the fact that an entrant's
expected profit is reduced. In Section 3, we apply the model to the Swiss dyestuff cartel. We
argue that the empirical evidence is in line with the main assumptions and predictions of
the model. In particular, the industry was characterized by high sunk costs and a cartel was
formed when the industry anticipated considerable structural change due to rising import
protection in the main export markets. Section 4 concludes the discussion.
2. A model of scope for cartel
We first build a model establishing a relationship between the emergence of cartel and
structural changes. To focus on the role of entry and sunk costs, we ignore the traditional
forces which influence collusion. In particular, we ignore cheating among members as
well as the incentive that some existing firms might want to remain outside a cartel. In
this sense, the model establishes the scope for cartelization.
2.1. Free-entry equilibrium
Since the empirical analysis deals with an export cartel, consider a model where
production takes place in one market and consumption in another one. Suppose there are
n identical firms which export their entire production to a market in which there is no local
production. The (inverse) market demand function in the market of consumption and the
cost function of a representative firm are assumed to be linear given respectively by
p � a� �ÿ bny; (1)
andC � �c� ��y� K: (2)
In Eqs. (1) and (2), y is the quantity sold by the representative firm; c, the marginal cost,
and � and � are shift parameters. In the sequel and without loss of generality, we
normalize (aÿc) to one, and we use a single shift parameter defined as ��ÿ�. An
increase in can thus be interpreted as an exogenous decrease in demand or as an
exogenous increase in costs such as an increase in transport costs or (specific) tariff
between the two markets, or else an increase in input prices.
In Eq. (2), K is a fixed (flow) cost associated with an exogenous setup cost S such that
K�iS, where i is the relevant interest rate.4 The setup cost S is interpreted as total costs
associated with some specific investment, like R&D, advertising, or investment in
4 See Dixit and Pindyck, 1994, p.8 for a characterization of sunk costs, and Sutton (1991) for a discussion ofexogenous and endogenous sunk cost.
N. Schmitt, R. Weder / J. of Economic Behavior & Org. 36 (1998) 197±220 199

specific machinery. Since S is sunk, the profit-maximizing decisions of the existing firms
are not affected by S. However, this investment is avoidable by new firms. As such it
creates an asymmetry between new and existing firms. As argued by Gilbert (1989), the
main feature of sunk cost is to be a barrier to entry creating a rent that is derived from
incumbency.
Suppose n firms determine output as their strategic variable.5 To simplify the analysis,
assume also that entry can only occur in the market of production. We first determine the
free-entry equilibrium or the number of firms which operates in this market without
attracting entry.
To do so, we first calculate the expected profit of a potential firm. In the presence of
setup costs, potential firms should not be allowed to make mistakes by entering when
they cannot cover costs. Accordingly, we require that entry decisions be made on the
basis of the post-entry equilibrium. The entry decision also depends on firms' behavior.
We consider two types of firms' rivalry: Cournot competition and perfect cartel (i.e. the
cartel members act as a single monopoly). In both cases, we assume that a new firm
always plays the same game as the established firms.6 We thus maximize the entrant's
profit function with respect to output, taking as given other firms' behavior and the fact
that n existing competitors are already in the market (and thus the industry would have
n�1 firms). Using Eqs. (1) and (2), the entrant's problem is to find ye which maximizes
�ie�n� 1; � � �1ÿ ÿ bnyÿ bye�ye ÿ K; (3)
where is the shift parameter defined earlier, i�c if firms play a Cournot game and i�m
if they act as a monopoly (perfect cartel).
Since all the firms are identical, ye � y � yi in equilibrium. The equilibrium
production of a new firm conditional on the shift parameter , firm's behavior, and an
industry with n�1 firms is therefore
yi�n� 1; � � 1ÿ b�2� n� �� ; i � c; m (4)
where � is the parameter which captures the degree of rivalry among firms. In Cournot
competition, ��0 and, in a perfect cartel, ��n.7 Clearly, we require that <1.
Substituting Eq. (4) in Eq. (3), the post-entry profit of a new firm is
�ie�n� 1; � � 1� �
b
� �1ÿ
2� n� �� �2
ÿK; i � c; m: (5)
5 The analysis also holds with competition in prices provided that products are imperfect substitutes.6 This is a reasonable assumption even when firms collude. To see this, suppose an entrant plays non-
cooperatively (Cournot) with the cartel. It is well known that an entrant may have no incentive to join a cartelwhen her output is greater than that of a cartel member. Suppose then that the entrant cannot produce more thana cartel member. In this case, the entrant always prefers to be a cartel member and it is in the cartel's best interestto accept her as a member. Hence, entry occurs provided that the newcomer covers costs as a cartel member.
7 See Brander and Spencer (1985) for a similar formulation. The model can easily be generalized to any degreeof collusion between Cournot and full collusion (see Mercenier and Schmitt, 1996). The parameter � is, ofcourse, also known as the conjectural variation parameter. From a game-theoretic point of view, this concept isquestionable (Shapiro, 1989). We note, however, that recent advances in game theory have established a directlink between this parameter and equilibria in dynamic games among firms (Dockner, 1992).
200 N. Schmitt, R. Weder / J. of Economic Behavior & Org. 36 (1998) 197±220

The potential firm decides to stay out of the market whenever �ie�n� 1; � � 0. This
condition determines the minimum number of existing firms �n� which, given the shift
parameter and the firms' behavior, is consistent with the free-entry equilibrium. Thus,
entry is not profitable whenever
n � ni� � � �1ÿ � 1� �bK
� �12
ÿ�2� ��; i � c; m: (6)
Not surprisingly, there is an inverse relationship between K and ni. The maximum number
of firms consistent with a free-entry equilibrium is given by the zero-profit condition of
an existing firm. In this simple model, it is easy to find that nmax � ni � 1. To generate
pure profit in equilibrium, we assume in the sequel that the free-entry equilibrium is
exactly binding �n � ni�.
2.2. The incentive to form a cartel
We now show two results. First, given an initial environment, firms have no incentive
to form a cartel when there is free entry. Hence, if firms can either act as Cournot
competitors or as cartel members, they prefer the Cournot behavior when entry is
endogenous. Second, established firms consistent with the Cournot free-entry equilibrium
may have an incentive to form a cartel when a significant downturn arises.
The first result is shown as follows. Consider an initial environment defined as �0.
Using Eq. (6), the equilibrium number of firms nc and nm, corresponding, respectively, to
a Cournot equilibrium (��0) and to a cartel equilibrium (��n), is then
nc � 1
�bK�12ÿ 2; nm � 1
4bKÿ 1: (7)
We require these market structures to have at least one firm and thus that K � 19b
.
Adapting Eq. (5) to an industry with n firms and using Eq. (7), each of the Cournot
competitors earns
�c�nc; � 0� � 1
b�1� nc�2ÿ K � K
1
�1ÿ �bK�12�2ÿ 1
!; (8)
whereas, in a cartel, each member earns 1/n of the monopoly profit (equal to 14bÿ K in
this model) or,
�m�nm; � 0� � 1
4bnm
ÿ K � K1
1ÿ 4bKÿ 1
� �: (9)
It is easy to verify that �c�nc; � 0� � �m�nm; � 0� if and only if K � 425b
or nc � 12,
which, given our assumptions, is always the case. Thus, given �0, an established firm
always prefers the Cournot free-entry equilibrium to the free-entry equilibrium with
cartel. This is the case because the number of firms in the latter equilibrium is larger than
in the former one, more than compensating the gains from a lower degree of competition.
Entry thus matters to the firms as they face a trade-off between the degree of rivalry and
the equilibrium number of firms.
N. Schmitt, R. Weder / J. of Economic Behavior & Org. 36 (1998) 197±220 201

We now show that, following a downturn, a perfect cartel may become sustainable. To
see this, suppose that the shift parameter rises to some positive level ~ where ~ < 1. In
the context of this model, think, for instance, of an increase in the tariff rate levied by the
country of consumption. Since @�e
@ < 0 (see Eq. (5)), an increase in reduces an entrant's
expected profit. This implies that the free-entry condition, which was exactly binding in
the initial equilibrium, must become slack at ~ . Thus, a firm which was just deterred from
entering the market at �0 must a fortiori be deterred from entering at � ~ . However,
since variable costs are still covered (i.e. ~ < 1), existing firms have no incentive to exit
the industry. We determine now how strong ~ should be to sustain a free-entry perfect
cartel among the nc established firms.
If the firms established in the initial equilibrium �nc� collude perfectly �� � nc�, the
expected profit of a potential firm is, using Eq. (5),
�me �nc � 1; ~ � � �1ÿ ~ �2
4b�1� nc� ÿ K: (10)
A perfect cartel constitutes a free-entry equilibrium provided that �me �nc � 1; ~ � � 0.
Given the initial number of firms �nc�, the free-entry condition defines the minimum
value of the shift parameter min above which a perfect cartel is consistent with no entry.
Substituting nc � ��bK�ÿ12 ÿ 2� into Eq. (10), entry does not occur as long as
~ � min � 1ÿ 2 �bK�12 ÿ bKh i1
2
: (11)
Fig. 1 illustrates min. For any K in the feasible range 0 � K � 19b; 0:057 < min � 1, and
for 1 � ~ � min, there is no entry associated with a perfect cartel among the nc firms. If,
for given K, the shift parameter does not increase sufficiently �~ � min�, perfect
collusion among the nc firms will attract entry. As expected, Fig. 1 shows that an industry
Fig. 1. Sunk costs, structural change and scope for cartelization
202 N. Schmitt, R. Weder / J. of Economic Behavior & Org. 36 (1998) 197±220
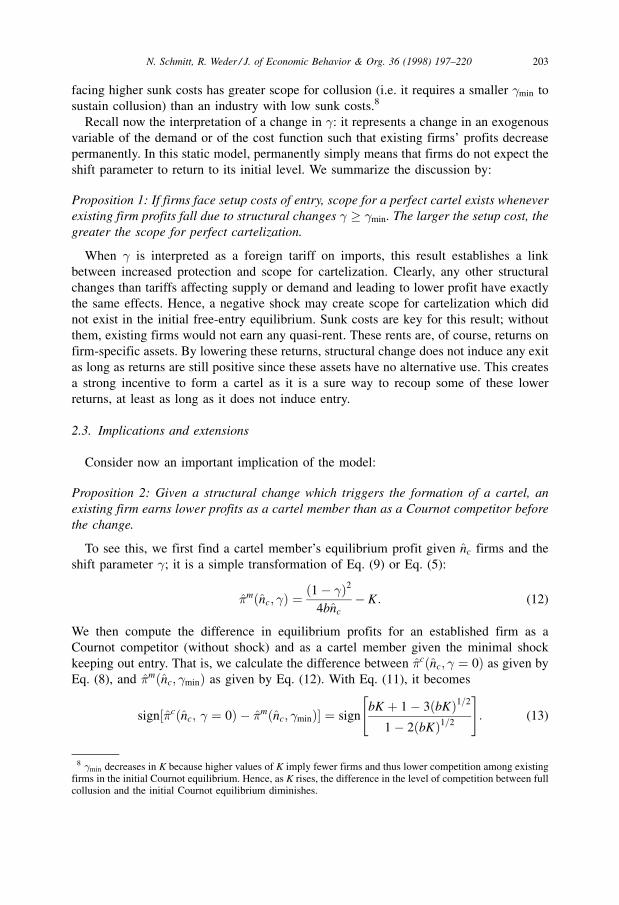
facing higher sunk costs has greater scope for collusion (i.e. it requires a smaller min to
sustain collusion) than an industry with low sunk costs.8
Recall now the interpretation of a change in : it represents a change in an exogenous
variable of the demand or of the cost function such that existing firms' profits decrease
permanently. In this static model, permanently simply means that firms do not expect the
shift parameter to return to its initial level. We summarize the discussion by:
Proposition 1: If firms face setup costs of entry, scope for a perfect cartel exists whenever
existing firm profits fall due to structural changes � min. The larger the setup cost, the
greater the scope for perfect cartelization.
When is interpreted as a foreign tariff on imports, this result establishes a link
between increased protection and scope for cartelization. Clearly, any other structural
changes than tariffs affecting supply or demand and leading to lower profit have exactly
the same effects. Hence, a negative shock may create scope for cartelization which did
not exist in the initial free-entry equilibrium. Sunk costs are key for this result; without
them, existing firms would not earn any quasi-rent. These rents are, of course, returns on
firm-specific assets. By lowering these returns, structural change does not induce any exit
as long as returns are still positive since these assets have no alternative use. This creates
a strong incentive to form a cartel as it is a sure way to recoup some of these lower
returns, at least as long as it does not induce entry.
2.3. Implications and extensions
Consider now an important implication of the model:
Proposition 2: Given a structural change which triggers the formation of a cartel, an
existing firm earns lower profits as a cartel member than as a Cournot competitor before
the change.
To see this, we first find a cartel member's equilibrium profit given nc firms and the
shift parameter ; it is a simple transformation of Eq. (9) or Eq. (5):
�m�nc; � � �1ÿ �2
4bnc
ÿ K: (12)
We then compute the difference in equilibrium profits for an established firm as a
Cournot competitor (without shock) and as a cartel member given the minimal shock
keeping out entry. That is, we calculate the difference between �c�nc; � 0� as given by
Eq. (8), and �m�nc; min� as given by Eq. (12). With Eq. (11), it becomes
sign��c�nc; � 0� ÿ �m�nc; min�� � signbK � 1ÿ 3�bK�1=2
1ÿ 2�bK�1=2
" #: (13)
8 min decreases in K because higher values of K imply fewer firms and thus lower competition among existingfirms in the initial Cournot equilibrium. Hence, as K rises, the difference in the level of competition between fullcollusion and the initial Cournot equilibrium diminishes.
N. Schmitt, R. Weder / J. of Economic Behavior & Org. 36 (1998) 197±220 203

The right hand side of Eq. (13) is unambiguously positive for K � 19b
and thus for
nc � 1 (see Eq. (7)). Since �m�nc; � decreases with , Eq. (13) is positive for all
~ � min. Thus, firms can recoup some, but not all, of their lower returns following
a shock.
Proposition 2 predicts a different outcome than the traditional approaches described in
Section 1. In equilibrium, profits are always zero in the theory of the empty core. Since
collusion arises during booms and the number of firms is held constant, profits rise with
collusion in Green and Porter (1984) and in Haltiwanger and Harrington (1991). The case
is more ambiguous with Rotemberg and Saloner (1986) since their model predicts that
firms cut prices in periods of booms. There is, however, no force in their model which
ensures that collusion and downturns lead to lower profit with respect to periods of booms
without collusion as entry does not play a role.
The model just developed is static; is thus considered as both an unexpected and a
permanent shock. Before proceeding with the dyestuff case, it is useful to discuss briefly
how the timing of cartel formation changes if, instead of a static model, we had adopted a
dynamic one. This introduces two additional considerations: anticipation and persistence
of a shock.
Suppose S >0 is the specific investment to be incurred by firms upon entry, and
that, at any point in time, there are many potential entrants. In a dynamic setting, a
free-entry equilibrium exists if the present value of a newcomer's expected profit
is non-positive. Since the present value can be non-positive whether the shock is
permanent or not (for an appropriate discount rate), the persistence of the shock
does not qualitatively affect our analysis. Suppose now that demand is expected to
shift down at some future date and the shift in demand is just sufficient for existing
firms to form a cartel without attracting entry (i.e. there is a dynamic equivalent
to min). This implies that the scope for cartelization can only arise at the exact
date of the shift in demand. Any attempt to cartelize before this date would
attract entry as the newcomer would benefit from the cartel and high demand.
Thus, when firms anticipate a shock, the scope for cartelization arises before the
date of the structural change only if this change is greater than the dynamic equivalent
of min.
Even though the model is quite specific, the results hold in a more general setting
(see Mercenier and Schmitt, 1996). In particular, the argument does not require
that all fixed costs be sunk. The present formulation makes clear that an empirical
investigation of cartel formation must look for the following evidence: evidence
regarding the structure of the industry, the timing of events and industry profits.
Considerations about sunk costs are, of course, a key element in industry description.
With respect to the timing of events, evidence should be found of a non-cooperative,
free-entry equilibrium before cartelization takes place. We must also show that at the
time of cartel formation, structural changes have increased substantially, affecting
negatively firms' profits. If cartel formation preceded structural change, we should
find unambiguous signals about strong impending shocks observable by firms at the
time of cartel formation. As the model makes a distinct prediction about profits,
we finally have to show that cartel formation is not sufficient to maintain profit at
its pre-cartel level.
204 N. Schmitt, R. Weder / J. of Economic Behavior & Org. 36 (1998) 197±220

3. The Swiss dyestuff cartel
The dyestuff cartel agreement was signed in September 1918 among the three major
Swiss producers, Ciba, Geigy and Sandoz which accounted for approximately 95 percent
of Swiss dyestuff production. The agreement eliminated competition among these firms
with regard to sales and the purchase of inputs. Profits of the three firms were aggregated
and redistributed to each member according to a fixed formula. Patents and technical
know-how became common property of the cartel and increases in equity capital, as well
as building new plants or mergers were subject to approval by all members (see Ciba,
1918b and Haber, 1971, p.307). All these elements of the cartel contract indicate that the
three firms intended to maximize joint profit. Such a contract was legal in Switzerland.
We now want to examine whether the timing of the cartel formation is in line with the
prediction of the model. First, we describe dyestuff manufacturing and provide evidence
that sunk costs were relatively high in this industry. Second, we characterize products,
markets and competition before WWI showing that the Swiss firms had some monopoly
power in their product segments which could be exploited in case of cartelization. Third,
we show that cartel formation is closely associated with a strong structural break, namely,
a significant increase in foreign protection and subsidies. Finally, we provide arguments
for the exact timing of the cartel agreement of 1918 and show that the rates of return were
lower during the years following the cartel formation as compared to the pre-cartel
period.
3.1. Production, R&D and asset specificity
The production of a textile dyestuff required a sequence of complex chemical reactions
(e.g. nitration, reduction, oxidation) in various vessels. Many intermediate products were
used and the dyestuff mixture had to be stirred, heated and cooled down according to an
exact plan. The dyestuff was then either precipitated or salted out, filtered, washed and
dried.9 Dangerous gases generated by the production process had to be collected or
redirected into production. Each step of the production was performed and supervised by
experienced workers and chemists. Minor deviations from the production plan could
cause serious injuries, damages or make production worthless.
Product development was already a key activity in this industry. Beer (1964, p.138)
argues that, by WWI, the dyestuff industry had already put in place a `modern industrial
research laboratory.' The production of dyestuffs required a long-term commitment to
research in the firms' own facilities without any guarantee of positive return (Haber,
1971, p.352; Hohenberg, 1967, p.91). For example, the German BASF's effort to develop
the synthetic Indigo took 18 years of research (Hohenberg, 1967, p.77) and Ciba's
development costs of an improved Indigo around 1908 were Sfr. 0.46 million,
corresponding to about 10 percent of Ciba's total equity value at the time (Jaquet,
1923, p.69).
9 Descriptions of this industry can be found in Haber (1958, 1971), Hohenberg (1967) or Weder (1995).Description of the technology can be found in Martin, 1915, p.27 and Haber, 1958, p.82.
N. Schmitt, R. Weder / J. of Economic Behavior & Org. 36 (1998) 197±220 205

The Swiss dyestuff industry focused on the top segment of vertically differentiated
dyestuffs (see also Section 3.2). This implied that firms, more than others, were forced to
upgrade existing products and abandon less sophisticated ones; each firm produced a few
specialties in which it was technically a world leader (Haber, 1971, p.163; Hohenberg,
1967, pp. 7, 91). To achieve this, the firms even built small dyeing and printing facilities
in order to tailor and test the dyestuffs before they were delivered to particular customers
(Jaquet, 1923, p.9). In many cases, the production of each of these specialties required
specific equipments (e.g. vessels made of a particular material and size) and supervision
by chemists and workers with experience in the production of one particular dyestuff or
class of dyestuffs (Jaquet, 1923, p.103). The introduction of new or technically improved
dyes often called for significant changes in plants and equipments. In fact, firms
employed technical designers and engineers just for this purpose (Wilhelm, 1934, p.34;
Svennilson, 1954, p.162).
One consequence of the above description of the dyestuff industry is that production
was subject to increasing returns to scale. Given the cylinder-shaped vessels and the
necessary supervision of each batch of dyes by highly qualified people, input costs
(material, human capital) were likely to increase less than proportionally with output.
Moreover, firms had to carry considerable R&D activities in order to remain competitive.
Thus, it is not surprising that the average dyestuff producer was relatively large.10
The critical question is, however, whether a significant share of investments was
specific to the firms or to the industry. Several elements in the above description indicate
that this was the case. Dyestuff production required specially designed equipments which
could not be used for producing other chemical products, and sometimes for other types
of dyestuffs. For some of the more sophisticated dyestuffs, vessels had to be plated with
copper. Others required particularly solid vessels because of the pressure arising from
certain chemical reactions. With the continuous invention of new processes and improved
dyes, parts of the equipments had to be replaced. This, in turn, required significant
installation costs as vessels were heavy, had to be bolted or even integrated to the floor
and be connected to various pipes transporting steam, water, chemical products and gases
(note that permanent staff was employed only for this purpose). These productive assets
were clearly industry- and often firm-specific. This means that their value was greater
than their opportunity cost. In addition, their value was enhanced by complementary
capital (Gilbert, 1989) such as R&D, reputation for top of the line products (the dyeing
and printing facilities to test products may be viewed as maintaining this reputation), and
specific human capital essential to production.11 In particular, R&D activities ± which,
according to Sutton (1991, p.7) can ` be thought of as sunk costs'' ± avoided that capital
wore out since, through the invention of new processes, they helped maintain the
specificity of the productive assets through time.
The overall importance of specific assets in this industry is probably best appreciated
by considering the capital structure of the Swiss dyestuff firms. The idea is based on
10 The Swiss chemical industry had three and four times as many employees per production plant as theaverage Swiss industrial plant in 1905 and 1929, respectively (see BFS, 1930, p.36).
11 Dyestuff production has, for a long time, been described as `alchemy' because its success depended heavilyon the experience and knowledge of chemists and lab technicians trained by the firms who monitored theprocesses and who could not be replaced by even detailed recipes.
206 N. Schmitt, R. Weder / J. of Economic Behavior & Org. 36 (1998) 197±220

Williamson (1988) who makes a convincing analogy between the determinants of vertical
integration in production and those of the financial structure of the firm. Debt financing
becomes increasingly costly the more specific assets are, just as vertical market
arrangements become more costly with rising input specificity. As the liquidation value of
specific assets is small, the debt holders' right to redeploy assets in case of
mismanagement is less valuable. Debt holders, knowing this, require compensation.
This makes debt to finance specific assets relatively more expensive than equity
financing. Shleifer and Vishny (1992) extend this analysis to a general equilibrium setting
by including the liquidity of potential buyers of industry-specific assets. Both articles
predict that debt financing is relatively low and equity financing relatively high in those
firms or industries characterized by highly specific assets and, thus, by high sunk costs.
Table 1 provides some indications about this hypothesis. The first column shows the
average debt±equity ratio (i.e. bonds hold by third parties divided by share capital) over 3
years (1923, 1928, 1929). We find that the ratio is 0.40 for the Swiss chemical industry
which is below the average of the Swiss industrial sector (0.58) and more than half as low
as the average for all Swiss industries (0.85). The second column shows the average of
the same ratio over 7 years (1911±1916) for Ciba, one of the four dyestuff producers, and
the average ratio for 130 firms in the Swiss manufacturing sector. With 0.55, Ciba's ratio
is also below the average ratio of the 130 firms (0.67). Both findings support the view that
debt financing was relatively small compared to equity financing in the Swiss dyestuff
industry. They are, thus, compatible with the claim that the industry is characterized by
relatively high sunk costs.
Note, however, that there is some limitation with this reasoning. For instance, the debt±
equity ratio may be distorted by the fact that firms may not be financially constrained. In
such a case, firms may use internal financing like retained earnings rather than equity to
finance their specific investments. As it is difficult to determine whether an industry is
financially constrained or not (see Fazzari et al., 1988), we have calculated the ratio of
debt-to-total capital to take into account this possibility. The third column of Table 1
shows the result. Ciba's ratio (0.18) remains largely below the average ratio for the 130
firms in the Swiss industrial sector (0.30). Finally, we redefined debt by including items
such as the firm's contribution to pension funds and, most importantly, credits implicitly
provided by the suppliers of intermediates and raw materials. The latter arises from
unpaid delivered material and is likely to be high in the dyestuff industry as the firms
carry large inventories of these inputs. Nevertheless, the fourth column of Table 1 shows
Table 1Capital structure of the Swiss dyestuff producers relative to other industries
Firms, industry Debt/equity Debt/equity Debt/total capital `Redefined' debt/equity
(1923, 1928, 1929) (1911±1916) (1911±1916) (1911±1916)
Swiss chemical industry 0.40 na na na
Ciba na 0.55 0.18 0.42
Swiss industrial sector 0.58 na na na
130 firms of industrial sector na 0.67 0.30 0.48
All Swiss industries 0.85 na na na
na � figure not available.
N. Schmitt, R. Weder / J. of Economic Behavior & Org. 36 (1998) 197±220 207

that Ciba's ratio of redefined debt to total capital (0.42) remains below the corresponding
average ratio of the 130 firms of the Swiss manufacturing sector (0.48).
Taken together, the above elements depict an industry characterized by high sunk costs:
entry in this highly specialized industry required industry- and firm-specific capital
which, in case of exit, would be unrecoverable to a large extent.12
3.2. Products, markets and competition before WWI
In 1913, Germany produced approximately 80 percent of the world consumption of
textile dyestuff. Switzerland was the second most important producer and exporting
country with a share of about 10 percent in dyestuff production. Despite this relatively
low market share, Swiss firms had a dominant position in specialized, high-quality
dyestuffs and faced a relatively inelastic demand. To make such an argument, the
products should be differentiated.
One important dimension of differentiation between Swiss and rivals' products was
vertical or quality differentiation. This is reflected by several indicators. First, experts
agree that Swiss dyestuffs were more complex and better products. In particular, they
were characterized by a much higher degree of fastness than that of their competitors.13
Second, this differentiation is reflected in the value of output per employee which was 3.3
times as high in the Swiss firms as in the German firms.14 Third, the differentiation is also
supported by the higher average price of Swiss products as compared to rivals' products:
the unit price of Swiss dyestuff exports was, depending on the time period, as much as
25±35 percent higher than that of German exports.15 This can only be possible if Swiss
products occupied niche markets for which foreign products, particularly German dyes,
were poor substitutes. In turn, this implies that Swiss firms faced a downward sloping
demand curve and thus had some monopoly power in their particular product segments.
Also note that the Swiss firms were extremely dependent on foreign markets exporting
at least 90 percent of their production and also importing a large part of intermediate
products. Before WWI, Germany was the most important export market for finished
Swiss dyes (see Table 2) and an important source country for intermediate and raw
materials. Exports to the major six markets ± Germany, US, UK, Italy, Japan, and France
12 We also investigated ± as suggested by Kessides (1990) and Worthington (1995) ± whether there existed arental market or a second-hand market for machines or equipment since the existence of such a market would goagainst the asset specificity hypothesis. We could not find any evidence of its existence and interviews withrepresentatives of dyestuff producers implied that firms typically have not been renting or buying usedequipment. We also attempted to determine the asset value of a liquidated firm which may provide someindication of the existence of sunk costs. Consider the case of the Basel dyestuff company Petersen & Cie,established in 1862, and sold to the `Chemische Fabrik Schweizerhall' in 1911. A contemporary business reportby the buyer indicates that the ` main advantage of this purchase was the extremely good geographic location ofPetersen & Cie which would provide interesting possibilities to enlarge the production plant of ChemischeFabrik Schweizerhall'' (Chemische Fabrik Schweizerhall, 1915). The land had value, but not the plant. This caseis compatible with a high degree of sunkness in Petersen's assets. Unfortunately, we cannot exclude thepossibility that the physical assets of the firm may simply have depreciated because they were old.
13 That is, the colour did not become mate, pale or dull with time or when exposed to light. See Haber (1971,p.251), Hohenberg (1967, pp.42, 72), Jaquet (1923, p.103) and Svennilson (1954, p.162).
14 This ratio is calculated from Hohenberg (1967, p.42).15 The lower bound is an average of 4 years (1895, 1900, 1905, 1910) reported by Jaquet (1923, p.106); the
upper bound refers to 1913 and is based on Haber (1971, p.163).
208 N. Schmitt, R. Weder / J. of Economic Behavior & Org. 36 (1998) 197±220

Tab
le2
Sw
iss
dy
estu
ffex
po
rts
tom
ajo
rm
ark
ets
Yea
rE
xp
ort
sto
(in
10
00
Sfr
.,1
91
4p
rice
s)P
rofi
tof
Cib
a
(in
1000
Sfr
.,1914
pri
ces)
Ger
man
yU
KU
SF
rance
Japan
Ital
yS
ixm
arket
sO
ther
sT
ota
l
12
34
56
78
910
19
10
6.3
34
3.6
63
4.4
17
1.1
39
1.7
70
1.9
22
19.2
44
7.6
29
26.8
73
1.7
63
19
11
6.1
77
3.3
44
4.5
17
1.1
65
975
a2.2
15
18.3
02
9.2
13
27.5
15
2.1
54
19
12
6.2
39
3.3
75
4.5
41
1.1
11
965
a2.2
31
18.4
62
9.4
44
27.9
06
2.2
52
19
13
5.9
43
3.3
79
4.5
98
923
1.7
23
2.1
80
18.7
46
10.5
26
29.2
73
2.4
33
19
14
4.6
20
6.7
64
6.3
14
1.1
68
1.3
57
2.3
03
22.5
26
9.0
95
31.6
21
2.8
89
19
15
35
61
3.3
49
4.3
96
2.0
20
270
3.4
57
23.8
47
3.2
77
27.1
24
5.9
50
19
16
01
9.4
00
7.5
84
5.2
00
712
4.1
84
37.0
80
6.0
58
43.1
38
5.7
10
19
17
02
2.2
19
9.7
23
11.8
92
1.3
64
4.7
40
49.9
37
7.1
43
57.0
81
9.0
01
19
18
01
6.6
52
5.6
55
12.6
62
1.9
33
4.9
83
41.8
86
6.1
69
48.0
55
6.8
84
19
19
01
6.6
25
6.7
41
13.4
04
2.3
44
6.5
65
45.6
78
15.5
12
61.1
91
4.7
52
19
20
02
8.1
35
7.3
59
21.9
97
2.0
42
4.8
44
64.3
78
29.7
76
94.1
54
1.8
55
19
21
54
5.4
83
5.6
55
6.6
83
1.5
16a
1.7
61
21.1
51
13.1
57
34.3
08
1.0
45
19
22
82
8.0
97
7.7
59
8.6
19
1.7
90
a1.3
08
27.6
54
14.6
31
42.2
85
2.8
02
19
23
14
05
.903
3.6
10
6.7
35
2.3
10
a2.1
85
20.8
84
21.2
15
42.0
99
2.9
59
19
24
42
64
.152
2.2
47
9.1
22
2.1
64
a2.1
08
20.2
20
20.1
08
40.3
28
2.1
59
19
25
1.9
92
3.6
53
4.8
46
6.7
15
1.5
82
a1.8
83
20.6
71
17.1
26
37.7
97
2.8
32
aE
stim
atio
ns.
N. Schmitt, R. Weder / J. of Economic Behavior & Org. 36 (1998) 197±220 209

± represented 64 percent of total Swiss exports of dyes in 1913 (col. 7). Clearly, any
major structural changes affecting exports to these countries must have had strong effects
on the profit of Swiss producers.
Was there competition among the Swiss firms before the cartel formation? Three
elements suggest that the industry can be characterized by a free-entry oligopoly before
WWI. First, there were four firms in the industry in 1908 and this number remained
constant before WWI. Second, Jaquet (1923) argues that profits were becoming very low
around 1910 due to prices pushed down `close to average costs' (p. 62). Third, Ciba's
return on investment (ROI), measured as the ratio of profits after interest and taxes
divided by total assets, sharply decreased from 1896 to 1905, becoming quite stable from
1906 onwards oscillating between 8 and 9 percent from 1906 to 1913 at an inflation rate
of 2 percent (see Fig. 2).16 Thus, a stable period of 7 years, both in terms of the number of
firms and real returns as well as relatively low real rates of return, suggests that the period
from 1908 to 1913 can be regarded as a free-entry equilibrium consistent with non-
cooperative behavior among firms and the oligopolistic structure of the industry.
3.3. Structural changes around the cartel formation
The outbreak of WWI marks the beginning of a major restructuring of the world
dyestuff industry which, in many countries, resulted in replacing international trade by
local production. The negative effect of this structural change on the Swiss dyestuff
exporters was, however, postponed until the end of the war. Increasing foreign protection
overlapped with an increase in foreign demand for Swiss dyestuffs during the war, mainly
caused by the ban imposed by the Allies on imports from Germany. The overall result of
these events was a scarcity of dyestuffs and a much higher profit for Swiss producers of
dyes during the war followed by a sharp drop after WWI.
Fig. 2. Ciba's return on investment (1900±1925).
16 Ciba is the only company for which yearly business reports were available during the war and for which anROI can be calculated.
210 N. Schmitt, R. Weder / J. of Economic Behavior & Org. 36 (1998) 197±220

As can be seen from Table 2, the period until 1917 is characterized by a large increase
in Swiss exports despite the loss of the German market until 1921. The real value of
exports of dyestuff almost doubled during the war from Sfr. 29.3 million in 1913 to Sfr.
57.1 million in 1917. The value of exports to the six traditional markets increased by 166
percent (col. 7). Even though the war also had negative effects on the Swiss exporters,17
the net result was a rise in profits for the Swiss dyestuff producers. The profits of Ciba,
for example, increased by 270 percent from 1913 to 1917 in real terms (see Table 2, col.
10). A similar increase can be observed with respect to the company's ROI which rose
from 9 percent in 1913 to 25 percent in 1917 (see Fig. 2). A revealing fact indicating that
profits rose is the entry of two, albeit small firms during the war.18
There is no evidence that the Swiss firms colluded during WWI. The rise in the value
of exports from 1914 to 1917 is, in part, due to an increase in the quantity of exports.19
Presumably, dyestuff prices also rose with costs of production and with foreign demand
for Swiss dyestuffs. The absence of collusion is also supported by Jaquet who argues that
during the war Swiss firms were overbidding each other for raw materials as well as
undercutting each other's price of finished products. Moreover, the Abteilung fuÈr
Industrielle Kriegswirtschaft (1925, p.175) states that the Swiss dyestuff firms remained
independent even though the Swiss government `repeatedly recommended some
cooperation' during the war.
The post-war period brought drastic structural changes to the world dyestuff industry.
Foreign demand for Swiss dyestuffs decreased sharply in 1921 stabilizing close to its pre-
war level (Table 2).20 This sharp fall in exports in 1921 was due to a dramatic increase in
foreign protection following expansion of production in the former major six dyestuff
importing countries (Table 3). A huge decline in dyestuff imports can be observed in the
UK where total imports fell from 18,900 tons (1913) to 3,600 tons (1924), and in the US
with a drop from 20,000 (1913) to 1,600 tons (1924). Table 3 shows that in five of the six
export markets, import protection through tariffs and quantitative restraints rose
considerably after the war.
Import substitution policies spread quickly among the major consumption markets. In
the UK, the Dyestuff Import Regulation Act became law in 1921, prohibiting imports of
dyes and intermediate products for 10 years except under licence (Haber, 1971, p.243). In
the US, the government introduced the Dye and Chemical Act (1921) which prohibited
imports of dyes except for varieties which were not produced domestically. These
provisions were repealed by the Act of 1922 and replaced by a 60 percent ad valorem
duty (plus 7 cents per pound) on dyestuffs (USTC, 1946, p.38). Tariffs protecting local
dyestuff producers also increased in France, Italy and Japan.
17 Transport costs, prices of raw materials and intermediates as well as production costs rose sharply becauseSwiss firms had to build new facilities to process intermediate products that could no longer be imported fromGermany after 1914; see Jaquet (1923, p.86 and Table 5) and Abteilung fuÈr Industrielle Kriegswirtschaft (1925,p.176).
18 Rohner & Cie. in 1915, and Stickelberger & Cie. in 1916; see Jaquet (1923, p.72) and Haber (1971).19 This can be inferred from the considerable increase in the quantity of Swiss imports of raw materials and
intermediate products for dyestuff production. The quantity of exports is not an accurate measure as dyestuffswere shipped in a much higher degree of concentration during WWI; see Jaquet (1923).
20 Note that the value of exports in 1921 is influenced by the cartel behavior.
N. Schmitt, R. Weder / J. of Economic Behavior & Org. 36 (1998) 197±220 211

In addition, all major dyestuff importing countries began to subsidize their local infant
industry (see Haber, 1971). For instance, the British government created the British
Dyestuff Company in 1918, and, in 1916, the Italian government created the `Industria
Nazionale Colori di Anilina.' In France, the government set up an inter-ministerial
council for dyes in 1916 and a group of industrial enterprises established the `Syndicat
National des MatieÁres Colorantes' in 1916, followed by the creation of the `Cie Nationale
de MatieÁres Colorantes' in 1917. In Japan, a law was passed granting subsidies to firms
producing dyestuffs and owned or controlled by nationals. In 1915, the Tokyo Gas Co.
supplied the first domestically produced aniline dyestuff.
These import substitution policies had strong adverse effects on the profit of Swiss
producers of dyes after WWI. Table 2 (col. 10) tells the story for Ciba. In 1920, Ciba's
profits were 24 percent below their 1913 level, and, in 1921, they decreased even further
since they were, in real terms, only 43 percent of their 1913 level. Observe also that the
average profit for the period 1920±25 was below its level of 1913, even though Ciba was
a member of the Swiss cartel since 1918. The same interpretation is supported by the
evolution of Ciba's ROI which remained below its pre-war level during the first half of
the 1920s (see Fig. 2).21 We conclude that there is no evidence that Swiss firms colluded
during the war, but there are clear indications that import substitution policies adopted in
the traditional export markets created considerable scope for cartelization among Swiss
firms in the post-war period.22
Table 3Import and protection of major dyestuff consuming countries: before and after WWI
Country Import in 1000 tons Tariffs (% � Ad valorem)
1913 1924 1925 Before WWI After WWI
US 20.0 1.6 2.6 20 Import licensing system (1921)
60 plus 7 cents per lb. (1922)
UK 18.9 3.6 2.0 0 Very restrictive import licensing
system (1921)
France 2.1 2.4 1.5 65 103 (1926)a
Japan 5.5 8.0 3.1 14 137 (1926)a
Italy 7.1 2.7 2.2 0 65 (1926)a
Germany na na na 0 Market reopened slowly in 1921
a These years mark end points of a period of increasing tariffs (e.g. a major increase in protection took place inFrance in 1919). na�figure not available.
21 It is also in line with the development of Ciba's and Sandoz' real share values which, on average, remainedbelow their pre-war level during 1920±1925; see Fig. 3.
22 These policies led to large overcapacity in the world dyestuff industry (see Svennilson, 1954, p.162 andHaber, 1971, p.252). Based on the prediction of our model, it is not surprising that, by the mid-1920s, furthercartelization of the dyestuff industry took place, ultimately leading to a cartel arrangement in 1930 controllingworld trade of dyestuffs (Haber, 1971, p.276). Also note that, in 1916, the German firms had formed a cartel, theso-called `Community of Interests' (see Haber, 1971, p.280). This may have helped the Swiss firms to create acartel later on.
212 N. Schmitt, R. Weder / J. of Economic Behavior & Org. 36 (1998) 197±220

3.4. Timing of the cartel
If there was a clear scope for cartelization in the post-war period, especially from 1920,
as compared to the pre-war period, why was the cartel agreement signed in late 1918? We
want to argue that, by 1918, the dyestuff producers had signals telling them that the good
times were over and that important structural changes were about to take place.
The immediate indications were a fall in exports to key markets and, more importantly,
a decrease in profits. Foreign demand decreased for the first time since the outbreak of
the war by 16 percent in real terms. Exports to the US ± the second largest export market
before the war ± plunged by 25 percent. Exports to the UK ± the third largest market
before the war and the largest during the war ± decreased by 6 percent in 1918. As for
profits, Ciba's profits declined by 23 percent in real terms in 1918 (see Table 2, col. 10).
These changes would mean little if they were simply cyclical. But they were not. Dyestuff
producers could expect changes to be structural and more bad news would soon hit the
industry.
The first of these signs was, of course, the end of WWI. The immediate implication for
the Swiss producers would have been that German dyestuff producers would soon re-
enter the world market. As the pre-war production capacity of Germany was large and
apparently had not been reduced by the war, Swiss firms must have expected a
considerable redistribution of market shares (see Haber, 1971, pp.253, 329).
Second, by 1918, signs of import-substitution policies and increasing protection abroad
were clear. In the UK, a committee of the government recommended, in 1917, the
creation of a British Dyestuff company and the introduction of a restrictive import
licensing system.23 The report was published at the beginning of 1918, and during the
same year, the government established the British Dyestuff Corporation. In the United
States, domestic pressures to increase protection grew considerably during the last years
of the war. The Longworth Bill (1915), which would have increased the ad valorem tariff
rate to 45 percent, failed to pass in 1916, but remained in discussion (Haber, 1971, p.187).
Moreover, preparation took place between 1916±1918 to create the Dye Licensing
Commission allowing imports of dyestuffs only if domestic supply did not meet the
demand. This licensing system came into effect in 1921.24
The minutes of the first meeting of the negotiations to establish the cartel indicate that
negotiators had no doubt about these structural changes. The Ciba representative
` pointed to the necessity to establish some close form of cooperation among the Basel
dye factories, in order to successfully meet the competition from the established German
firms as well as from the new producers in all countries (...) which would arise once
normal circumstances return.''25
23 The first advice in the report was to ` (...) coordinate the operations of the principal manufacturers (...).'' Thesecond one that ` (...) the importation of foreign dyes should be prohibited except under licences to be issued byan independent authority, whose duty it would be, while fostering the growth and maintenance of the colourproducing industry, to safeguard the interests of colour users (...).'' (see Haber, 1971, p.241).
24 See Jaquet, 1923, p.79. Note also that, in 1918, France formally denounced all treaties containing the most-favored-nation clause (see Pollard and Holmes, 1972, p.395) and increased tariffs on dyestuffs in 1919.
25 Authors' translation of Ciba (1918a, p.1).
N. Schmitt, R. Weder / J. of Economic Behavior & Org. 36 (1998) 197±220 213

The market also seems to have anticipated negative structural changes as early as 1917.
Fig. 3 shows yearly indices of real share values for Sandoz, Ciba and a Swiss index ±
consisting of 21 companies (including Ciba and Sandoz) ± from 1911 to 1925. It indicates
that the real share values of the two Swiss dyestuff producers began to drop in 1917, after
a big hike at the beginning of the war, and declined both absolutely and relatively to the
Swiss index until 1921. Thus, a fall in the real value of assets and profit of the Swiss
dyestuff producers were already expected in 1917, several months before the cartel
agreement was finalized.
Note that colluding firms must expect a shock strong enough not to attract entry.
The evidence reviewed above suggests that rising protectionism in the six key export
markets (representing 87 percent of Swiss exports in 1917), the expected re-entry of the
German competitors, and the decline in exports to some of the main markets were strong
signals that fed expectations of a major structural shift. The timing of the cartel formation
is thus not inconsistent with information available in 1918. Ex post, this conclusion is
supported by the fact that no entry or attempt of entry took place in 1919 and 1920
despite a temporary booming world demand for dyestuffs and that profits decreased
significantly for four consecutive years from 1918 (see Table 2). We have also shown
that, after the cartel formation, profits, asset returns and real share values were, on
average, below their pre-war level (see Figs. 2 and 3). This is consistent with the
prediction of the model.
4. Conclusions
In this paper, we have shown that entry and sunk costs can be important determinants
of cartel formation. The basic argument is that structural changes leading to a reduction in
expected profits provide scope for cartelization in industries characterized by sunk costs
as they create a barrier to entry. Decrease in demand, rise in foreign protection or increase
in costs are all examples of shocks which may trigger cooperative behavior among
existing firms. Cartel formation is less likely when setup costs are small because
established firms have little scope to change their behavior without attracting entry.
Fig. 3. Index of real share values (Sandoz, Ciba, Swiss average).
214 N. Schmitt, R. Weder / J. of Economic Behavior & Org. 36 (1998) 197±220

The predictions of the model are consistent with the dyestuff case. The formation of the
Swiss dyestuff export cartel can be interpreted as a reaction to increased foreign
protection and import substitution policies. As the industry is characterized by a high
degree of asset specificity, scope for cartelization arose when firms expected a
considerable decline in their profits at the end of WWI. Note that we would expect
industries with low sunk costs to be unsuccessful in establishing a cartel even if they were
faced with a similar structural change. This may have been the reason why the attempt by
the Swiss watch industry to cartelize 10 years later was not successful until the
government intervened and banned entry in 1934.
There are some interesting extensions of the analysis concerning the dyestuff cartel. In
this paper, we have implicitly assumed that existing firms care more about entry in their
market of production than in export markets. This may not be the case as foreign
protection itself can induce entry abroad. An interesting issue is to analyze the role of the
cartel in controlling entry abroad especially as Swiss producers established foreign
subsidiaries after the cartel agreement of 1918.
How does this paper fit in the literature? Existing literature insists either on stability
conditions or, like in the core theory, on entry. In the first literature, the number of firms is
generally fixed and, in the second one, cheating is irrelevant since firms usually earn
competitive returns even when they belong to a cartel. In our approach, firms earn pure
profit despite free entry so that cheating cannot be excluded. Thus, our model explains the
scope for collusion and, as such, it is complementary to other explanations about cartel
stability and cartel formation.
How then to distinguish this explanation from competing ones? We have argued
that the response of firms' profit to cartel formation can do just this. The core theory
applied to the cartel predicts that firms earn a normal rate of return, after as well as
before, cartel formation. If the tacit collusion literature is the relevant one (at least
when applied to the case of the cartel) then models such as Rotemberg and Saloner
(1986) predict that profit may rise or fall with cartel formation. Green and Porter
(1984), and Haltiwanger and Harrington (1991) predict, however, that profit increases
with cartel formation. Given that some empirical studies support Green and Porter's
predictions (Slade, 1990) and, in addition, that Haltiwanger and Harrington's model can
be interpreted as a generalization of Rotemberg and Saloner's model with a persistent
phenomenon, there is a presumption that, in this literature, cartel formation is
accompanied by an increase in firms' profit. Our model can then be distinguished from
them as it predicts the converse: if entry and sunk costs matter, cartel formation is
accompanied by a fall in firms' profit.
The picture which then emerges from the analysis is one where cartel formation
can be explained by both cheating and entry/sunk cost arguments, and where change
in profit following cartel formation may give us indications as to which force plays
the key role. Our analysis is suggestive and requires additional research. The findings,
however, might provide an explanation for Asch and Seneca's (1976) empirical
results. Investigating U.S. manufacturing firms over the period 1958±1967, they
found that collusive behavior is negatively associated with profitability and
some evidence that unsatisfactory profit performance by firms provides an incentive
to collude.
N. Schmitt, R. Weder / J. of Economic Behavior & Org. 36 (1998) 197±220 215

Acknowledgements
We thank Doug Allen, Thomas Gehrig, Dominique Gross, Martin Hellwig, Krishna
Pendakur and Clyde Reed as well as seminar participants at Simon Fraser University,
University of Basel and University of St. Gallen for helpful comments, and W.
Bischofberger, R. Szinnai (Ciba) and E. Berger (Basel Stock Exchange) for making their
archives available to us. We also thank an anonymous referee for insightful comments.
Rolf Weder gratefully acknowledges financial support from the Swiss National Fund for
Scientific Research (grants 8210-030613 and NFP42)
Appendix
This appendix describes the data used in Tables 1, 2, 3 and Figs. 2 and 3.
Table 1
1. Columns 1 and 2 are defined as bonds (`capital des obligations') divided by share
capital (`capital verseÂ'). Column 3 is defined as bonds divided by total capital which is
equal to the value of all assets. Debt in column 4 includes bonds, contributions to
pension funds and mainly credits implicitly granted by suppliers of intermediate
products (`crÂediteurs').
2. Data of rows 1, 3 and 5 are calculated from BFS (1930, p.118). Data of row 2 are
calculated from Ciba's yearly company reports (Ciba, 1911±1917). Data of row 4 are
calculated from BFS (1917, p.112).
Table 2
1. Columns 1 to 9 are adapted from BFS for the years 1911, 1912, and 1922±1925, and
from Jaquet (1923, Tables II and III) for other years. Swiss inflation rates are adapted
from Maddison (1982). The values for Japan ± for years 1911, 1912, and 1921±1925 ±
are estimated based on Japan's share in Swiss exports to Asian countries in 1913 and
1920, respectively.
2. Column 10 is based on yearly company reports of Ciba (1912±1922), deflated
by the inflation rates adapted from Maddison (1982). The values from 1912±1916
are company profits from July 1 of the preceding year to June 31 of the current
year. In order to make the years 1917±1918 comparable, profits of 1917 have
been calculated by (1) adding profits from July 1 (1916) to June 31 (1917) and
from July 1 (1917) to December 31 (1917) and (2) by multiplying this amount by a
factor of 0.66.
Table 3
1. Columns 1±3 are based on Svennilson (1954, p.164).
2. Columns 4 and 5 are collected from Haber (1971, p.238), Jaquet (1923), USTC (1917±
1922), and from Pollard and Holmes (1972, p.395).
216 N. Schmitt, R. Weder / J. of Economic Behavior & Org. 36 (1998) 197±220

Fig. 2
1. The ROI (return on investment) is calculated and plotted based on company reports of
Ciba (1900±1925). ROI is defined as net earnings (after taxes and interest) divided by
total assets, taken from the balance sheet. Profits of 1917 have been calculated based
on two company reports as the reporting period has been changed in 1917. See the
description above with respect to Table 2, col. 10.
Fig. 3
1. The real share values of Ciba and Sandoz are calculated from nominal share values at
the end of each year ± except in 1914 where the stock exchange was closed from July
to December ± from `Kursblatt der Basler Boerse' (found in the archive of the Basel
Stock Exchange), deflated by the inflation rates adapted from Maddison (1982).
2. The Swiss index of real share values is composed of 21 Swiss companies and is
adapted from BFS (1911±1925), deflated by inflation rates from Maddison (1982).
References
Abteilung fuÈr Industrielle Kriegswirtschaft, 1925. Uebersicht uÈber TaÈtigkeit und Entwicklung der schweizerischen
Chemischen Industrie vor und waÈhrend des Weltkrieges, 1915±1919 Verlag Gottfr. Iseli, Bern.
Asch, Peter, Seneca, J.J., 1976. Is collusion profitable?. The Review of Economics and Statistics 58(1), 1±12.
d'Aspremont, Claude, Jacquemin, Alexis, Gabszewicz, Jean Jaskold, Weymark, John, 1983. On the stability of
collusive price leadership. Canadian Journal of Economics 14, 17±25.
Bagwell, Kyle, Staiger, Robert, 1995. Collusion over the Business Cycle, NBER WP 5056, March.
Beer, John J., 1964, Coal tar dye manufacture and the origins of the modern industrial research laboratory. In:
Hughes, Thomas P., (Ed), The Development of Western Technology Since 1500, MacMillan, New York,
129±138.
BFS, 1911. Statistisches Jahrbuch der Schweiz (yearly reports) 1906±1936, BirkhaÈuser Verlag, Basel.
BFS, 1912. Statistisches Jahrbuch der Schweiz (yearly reports) 1906±1936, BirkhaÈuser Verlag, Basel.
BFS, 1913. Statistisches Jahrbuch der Schweiz (yearly reports) 1906±1936, BirkhaÈuser Verlag, Basel.
BFS, 1914. Statistisches Jahrbuch der Schweiz (yearly reports) 1906±1936, BirkhaÈuser Verlag, Basel.
BFS, 1915. Statistisches Jahrbuch der Schweiz (yearly reports) 1906±1936, BirkhaÈuser Verlag, Basel.
BFS, 1916. Statistisches Jahrbuch der Schweiz (yearly reports) 1906±1936, BirkhaÈuser Verlag, Basel.
BFS, 1917. Statistisches Jahrbuch der Schweiz (yearly reports) 1906±1936, BirkhaÈuser Verlag, Basel.
BFS, 1918. Statistisches Jahrbuch der Schweiz (yearly reports) 1906±1936, BirkhaÈuser Verlag, Basel.
BFS, 1919. Statistisches Jahrbuch der Schweiz (yearly reports) 1906±1936, BirkhaÈuser Verlag, Basel.
BFS, 1920. Statistisches Jahrbuch der Schweiz (yearly reports) 1906±1936, BirkhaÈuser Verlag, Basel.
BFS, 1921. Statistisches Jahrbuch der Schweiz (yearly reports) 1906±1936, BirkhaÈuser Verlag, Basel.
BFS, 1922. Statistisches Jahrbuch der Schweiz (yearly reports) 1906±1936, BirkhaÈuser Verlag, Basel.
BFS, 1923. Statistisches Jahrbuch der Schweiz (yearly reports) 1906±1936, BirkhaÈuser Verlag, Basel.
BFS, 1924. Statistisches Jahrbuch der Schweiz (yearly reports) 1906±1936, BirkhaÈuser Verlag, Basel.
BFS, 1925. Statistisches Jahrbuch der Schweiz (yearly reports) 1906±1936, BirkhaÈuser Verlag, Basel.
BFS, 1930. Statistisches Jahrbuch der Schweiz (yearly reports) 1906±1936, BirkhaÈuser Verlag, Basel.
Brander, James A., Spencer, Barbara, 1985. Tacit collusion, free entry and welfare. The Journal of Industrial
Economics 33(3), 277±294.
Chemische Fabrik Schweizerhall, 1915. Chemische Fabrik Schweizerhall in Basel. Zum 25 jaehrigen Bestehen,
Basel.
Ciba, 1900. Gesellshaft fuÈr Chemische Industrie (yearly reports) 1885±1925, Rechnungsabschluss, Buchdruckerei
G. Krebs, Basel.
N. Schmitt, R. Weder / J. of Economic Behavior & Org. 36 (1998) 197±220 217

Ciba, 1901. Gesellshaft fuÈr Chemische Industrie (yearly reports) 1885±1925, Rechnungsabschluss, Buchdruckerei
G. Krebs, Basel.
Ciba, 1902. Gesellshaft fuÈr Chemische Industrie (yearly reports) 1885±1925, Rechnungsabschluss, Buchdruckerei
G. Krebs, Basel.
Ciba, 1903. Gesellshaft fuÈr Chemische Industrie (yearly reports) 1885±1925, Rechnungsabschluss, Buchdruckerei
G. Krebs, Basel.
Ciba, 1904. Gesellshaft fuÈr Chemische Industrie (yearly reports) 1885±1925, Rechnungsabschluss, Buchdruckerei
G. Krebs, Basel.
Ciba, 1905. Gesellshaft fuÈr Chemische Industrie (yearly reports) 1885±1925, Rechnungsabschluss, Buchdruckerei
G. Krebs, Basel.
Ciba, 1906. Gesellshaft fuÈr Chemische Industrie (yearly reports) 1885±1925, Rechnungsabschluss, Buchdruckerei
G. Krebs, Basel.
Ciba, 1907. Gesellshaft fuÈr Chemische Industrie (yearly reports) 1885±1925, Rechnungsabschluss, Buchdruckerei
G. Krebs, Basel.
Ciba, 1908. Gesellshaft fuÈr Chemische Industrie (yearly reports) 1885±1925, Rechnungsabschluss, Buchdruckerei
G. Krebs, Basel.
Ciba, 1909. Gesellshaft fuÈr Chemische Industrie (yearly reports) 1885±1925, Rechnungsabschluss, Buchdruckerei
G. Krebs, Basel.
Ciba, 1910. Gesellshaft fuÈr Chemische Industrie (yearly reports) 1885±1925, Rechnungsabschluss, Buchdruckerei
G. Krebs, Basel.
Ciba, 1911. Gesellshaft fuÈr Chemische Industrie (yearly reports) 1885±1925, Rechnungsabschluss, Buchdruckerei
G. Krebs, Basel.
Ciba, 1912. Gesellshaft fuÈr Chemische Industrie (yearly reports) 1885±1925, Rechnungsabschluss, Buchdruckerei
G. Krebs, Basel.
Ciba, 1913. Gesellshaft fuÈr Chemische Industrie (yearly reports) 1885±1925, Rechnungsabschluss, Buchdruckerei
G. Krebs, Basel.
Ciba, 1914. Gesellshaft fuÈr Chemische Industrie (yearly reports) 1885±1925, Rechnungsabschluss, Buchdruckerei
G. Krebs, Basel.
Ciba, 1915. Gesellshaft fuÈr Chemische Industrie (yearly reports) 1885±1925, Rechnungsabschluss, Buchdruckerei
G. Krebs, Basel.
Ciba, 1916. Gesellshaft fuÈr Chemische Industrie (yearly reports) 1885±1925, Rechnungsabschluss, Buchdruckerei
G. Krebs, Basel.
Ciba, 1917. Gesellshaft fuÈr Chemische Industrie (yearly reports) 1885±1925, Rechnungsabschluss, Buchdruckerei
G. Krebs, Basel.
Ciba, 1918a. Protokoll der ersten Sitzung betreffend I.G., 8 January 1918, Ciba Firmenarchiv, Basel.
Ciba, 1918b. Vertrag betreffend Interessengemeinschaft 7 September 1918, Ciba Firmenarchiv, Basel.
Ciba, 1919. Gesellshaft fuÈr Chemische Industrie (yearly reports) 1885±1925, Rechnungsabschluss, Buchdruckerei
G. Krebs, Basel.
Ciba, 1920. Gesellshaft fuÈr Chemische Industrie (yearly reports) 1885±1925, Rechnungsabschluss, Buchdruckerei
G. Krebs, Basel.
Ciba, 1921. Gesellshaft fuÈr Chemische Industrie (yearly reports) 1885±1925, Rechnungsabschluss, Buchdruckerei
G. Krebs, Basel.
Ciba, 1922. Gesellshaft fuÈr Chemische Industrie (yearly reports) 1885±1925, Rechnungsabschluss, Buchdruckerei
G. Krebs, Basel.
Ciba, 1923. Gesellshaft fuÈr Chemische Industrie (yearly reports) 1885±1925, Rechnungsabschluss, Buchdruckerei
G. Krebs, Basel.
Ciba, 1924. Gesellshaft fuÈr Chemische Industrie (yearly reports) 1885±1925, Rechnungsabschluss, Buchdruckerei
G. Krebs, Basel.
Ciba, 1925. Gesellshaft fuÈr Chemische Industrie (yearly reports) 1885±1925, Rechnungsabschluss, Buchdruckerei
G. Krebs, Basel.
Dixit, Avinash K., Pindyck, Robert S., 1994. Investment under Uncertainty, Princeton University Press,
Princeton, NJ .
Dockner, Engelbert J., 1992. A dynamic theory of conjectural variations. The Journal of Industrial Economics
40(4), 377±395.
218 N. Schmitt, R. Weder / J. of Economic Behavior & Org. 36 (1998) 197±220

Fazzari, Steven M., Hubbard, R.Glenn, Petersen, Bruce C., 1988. Financing constraints and corporate
investment. Brookings Papers on Economic Activity 1, 141±195.
Gilbert, Richard J. 1989. Mobility barriers and the value of incumbency. In: Schmalensee, R., Willig, R., (Eds.),
Handbook of Industrial Organization, vol. I, North-Holland, Amsterdam.
Green, Edward J., Porter, Robert H., 1984. Non-cooperative collusion under imperfect price information.
Econometrica 52, 87±100.
Haber, L.F., 1958. The Chemical Industry During the Nineteenth Century. Clarendon Press, Oxford.
Haber, L.F., 1971. The Chemical Industry 1900±1930. International Growth and Technological Change.
Clarendon Press, Oxford.
Haltiwanger, John, Harrington, Joseph E., 1991. The impact of cyclical demand movements on collusive
behavior. RAND Journal of Economics 22(1), 89±106.
Hohenberg, P.M., 1967. Chemicals in Western Europe: 1850±1914. An Economic Study of Technical Change.
Rand McNally, Chicago.
Jaquet, Nicolas, 1923. Die Entwicklung und volkswirtschaftliche Bedeutung der Schweizerischen Teerfarbe-
nindustrie. Helbing & Lichtenhahn, Basel.
Kessides, Ioannis N., 1990. Market concentration, contestability, and sunk costs. The Review of Economics and
Statistics 72(4), 614±622.
Maddison, Angus, 1982. Phases of Capitalist Development. Oxford University Press, New York.
Marquez, Jaime, 1992. Life Expectancy of International Cartels: An Empirical Analysis, International Finance
Discussion Papers, No. 439, December, Board of Governors of the Federal Reserve System.
Martin, Geoffrey, (Ed), 1915. Dyestuffs & Coal-Tar Products. Their Chemistry, Manufacture and Application.
Crosby Lockwood, London.
Mercenier, Jean, Schmitt, Nicolas, 1996. On sunk cost and trade liberalization in applied general equilibrium.
International Economic Review 37(3), 553±571.
Pirrong, Stephen C., 1992. An application of core theory to the analysis of ocean shipping markets. Journal of
Law and Economics 35, 89±131.
Pollard, Sidney, Holmes, Colin, 1972. The End of the Old Europe. 1914±1936. St. Martin Press, New York.
Porter, Robert H., 1983. A study in cartel stability: The joint executive committee, 1880±1886. Bell Journal of
Economics and Management 14, 301±314.
Rotemberg, Julio, Saloner, Garth, 1986. A supergame-theoretic model of business cycles and price wars during
booms. American Economic Review 76, 390±407.
Shapiro, Carl, 1989. Theories of oligopoly behaviour. In: Schmalensee, R., Willig, R., (Eds.), Handbook of
Industrial Organization, vol. I, North-Holland, Amsterdam.
Sjostrom, William, 1989. Collusion in ocean shipping: A test of monopoly and empty core models. Journal of
Political Economy 97, 1160±1179.
Slade, Margaret E., 1990. Strategic pricing models and interpretation of price-war data. European Economic
Review 34, 524±537.
Shleifer, Andrei, Vishny, Robert W., 1992. Liquidation values and debt capacity: A market equilibrium
approach. The Journal of Finance 47, 1343±1366.
Stigler, George J., 1964. A theory of oligopoly. Journal of Political Economy 72, 44±61.
Suslow, ValeÂrie Y., 1988. Stability in international cartels: An empirical survey, Hoover Institution Working
Paper, No. e-88-7.
Sutton, John, 1991. Sunk Costs and Market Structure. MIT Press, Cambridge, MA .
Svennilson, Ingvar, 1954. Growth and Stagnation in the European Economy. United Nations Economic
Commission for Europe, Geneva.
Telser, Lester G., 1994. The usefulness of core theory in economics. Journal of Economic Perspectives 8(2),
151±164.
United States Tariff Commission, 1946. Dyes. Prepared in Response to Requests from the Committee on Finance of
the United States Senate and the Committee on Ways and Means of the House of Representatives, War Changes
in Industry Series, Report No. 19, Government Printing Office, Washington, DC.
United States Tariff Commission, 1917±1922, Annual Report. Government Printing Office, Washington,
DC.
Weder, Rolf, 1995. The Swiss dyestuff industry. In: Enright, Michael J., Weder, Rolf, (Eds.), Studies in Swiss
Competitive Advantage, Peter Lang, Bern, pp. 25±60.
N. Schmitt, R. Weder / J. of Economic Behavior & Org. 36 (1998) 197±220 219

Whyte, Glen, 1994. The role of asset specificity in the vertical integration decision. Journal of Economic
Behavior and Organization 23, 287±302.
Wilhelm, Arthur, 1934. Gesellschaft fuer Chemische Industrie in Basel, Wolfensberger, Zuerich.
Williamson, Oliver E., 1985, The Economic Institutions of Capitalism: Firms, Markets, Relational Contracting.
The Free Press, New York.
Williamson, Oliver E., 1988. Corporate finance and corporate governance. Journal of Finance 43, 567±592.
Worthington, Paula R., 1995. Investment, cash flow, and sunk cost. Journal of Industrial Economics 43, 49±61.
220 N. Schmitt, R. Weder / J. of Economic Behavior & Org. 36 (1998) 197±220