
Summer Student Report - CERN Document Server
6
Garfield++ simulations related to the ALICE TPC Summer Student Report Kim Baraka June 17 - August 10 2013
Transcript of Summer Student Report - CERN Document Server

Garfield++ simulations related to the ALICE TPC
Summer Student Report
Kim Baraka
June 17 - August 10 2013

I - Introduction
About Garfield++: Garfield++ is a software generally used for the simulation of micropattern gaseous detectors. It is the C++ version of the well-established Garfield software, written in FORTRAN. Garfield++ is yet not fully developed for applications like wire chambers and still needs some further testing and improvement.
Objective: Since Garfield++ is a working but yet not fully accomplished toolkit, the work to be performed had a double objective: First: To validate and test some of the existing functions in the core of Garfield++; also to
modify and add functionality when need arises. Second: to simulate in Garfield++ (and other software interfaced to it) all parts needed
to validate the behavior of the ALICE TPC, with a focus on the Multi-Wire Proportional Chambers (MWPC). The four main parts of the simulation include:
I. Primary ionization (using the interface with the HEED software) II. Electron drift properties (using the interface with the Magboltz software)
III. Amplification and Ion drift IV. Signal creation
Once all parts are functional, it is easy to integrate them to get a simulation of the whole chain from the primary ionization of the gas to the full signal induced on the electronics. The code is put on the Garfield++ webpage as an example for future reference.
II - Summary of the work done
A. Contributions to the code of Garfield++
While testing the existing functions in Garfield++, some stability issues popped out and had to be fixed. These include modifications in the classes for the drift lines calculation (ending of the drift line), the interpolation function for the transport parameters of electrons, as well as the integration of the diffusion coefficient along the drift path. On the other hand, part of the features present in Garfield (FORTRAN) was missing in the C++ version, and was needed for the required simulation related to the ALICE TPC. This included writing the function to integrate the gain along the drift line of electrons for instance, enabling the plotting of both the geometry and the drift lines on the same canvas, developing the tools needed to retrieve the signal on an electrode... Some other features were newly added, like the new plotting tool for the transport parameters of electrons, which enables the plotting of a parameter not only as a function of electrical field, but also function of magnetic field intensity or angle.
B. Simulations related to the ALICE TPC
In the first two parts of the simulation work (Primary Ionization and Electron Drift), results were reproduced in Garfield++ for the current gas of the ALICE TPC (Ne/CO2 (90/10)) or with N2 added (Ne/CO2/N2 (90/10/5)) and Ar/CO2 (88/12), which is the candidate for the new upgrade of the TPC gas.

1. Primary ionization
The HEED interface was used to simulate the number of clusters, number of total electrons and energy deposition for the three gases mentioned above. Plots were generated as a function of momentum, and the Minimum Ionizing Particle (MIP) results were extracted. The figures for the MIP are compared to the results from the FORTRAN version of Garfield in Table 1 below.
Table 1: Comparative table for primary electrons (Np) and total electrons (NT) for a MIP
Gas
NP
(Garf++)
[cm-1
]
NP
(Garf)
[cm-1
]
NT
(Mean)
(Garf++)
[cm-1
]
NT
(Mean)
(Garf)
[cm-1
]
NT
(MPV)
(Garf++)
[cm-1
]
Ne-CO2 (90/10) 12.92 13.3 34.11 36.8 19.4
Ne-CO2-N2 (90/10/5) 13.37 14.0 34.82 36.1 19.5
Ar-CO2 (88-12) 26.42 26.4 72.19 74.8 40.1
2. Electron drift properties
Electron drift parameters such as drift velocity (three components) and diffusion coefficients were simulated using the interface with Magboltz, which generates gas tables. These tables were then used later on for simulating the actual gas detectors. Figure 1 below demonstrates the new plotting tool by showing the three components of drift velocity for electrons, as a function of electric field and angle between magnetic and electric field.
Figure 1: Drift Velocity components as a function of Electric field (left) and magnetic field Angle (right) for Ne-CO2-N2 (90/10/5) with B = 0.5 T

At 400 V/cm (the drift field value of the ALICE TPC), the drift velocity was found to be 2.52 [cm/us] for Ne-CO2 (90/10) (2.73 in Garfield), and 3.26 [cm/us] for Ar-CO2 (88/12) (3.31 in Garfield). The differences are most probably due to the updated version of Magboltz. Table 2 below summarizes the results for the diffusion coefficients (longitudinal and transverse):
Table 2: Comparative table for longitudinal (DL) and transverse (DT) diffusion coefficients
Gas Ne-CO2 (90/10) Ne-CO2-N2 (90/10/5) Ar-CO2 (90/10)
DL (Garf++) [cm1/2] 0.0228 0.0218 0.0259
DL (Garf) [cm1/2] 0.0231 0.0221 0.0262
DT (Garf++) cm1/2] 0.0207 0.0198 0.0219
DT (Garf) [cm1/2] 0.0208 0.0209 0.0221
As shown above, all results are in agreement with the results from Garfield, within
acceptable error range.
3. ALICE TPC ROC geometries
The geometry of the MWPC in the Readout Chambers (ROC) of the ALICE TPC can be easily implemented using thin wires/planes configurations, available from within Garfield++. Hence, no additional external program is needed for drift line calculations. However, if we wish to look at the signal induced by an avalanche say on a cathode pad, then we would need to compute the weighting field using an external program like neBem (to be discussed later in this report).
a. Electron drift lines
Electron drift lines were studied for both Outer ROC (OROC) and the smaller Inner ROC (IROC), radially closer to the beam. Also, ExB effects were simulated and observed to be in the order of 200 microns.
Figure 2: Geometry and drift lines for electrons starting above the gating grid in an OROC

b. Ion drift lines
Unlike the simulation of GEMs for instance, the classes used for the simulation of the
MWPCs do not track individual electrons during an avalanche. This is not needed since we
can introduce the ions "by hand" and gain speed in the program execution. To simulate a
single avalanche, a Gaussian distribution in angle φ around the wire is used, with a standard
deviation tuned such that 30% of the ions drift to the pad plane on average. The gain is set
by hand to be around 10,000 for a single electron avalanche. This happens around σ = 1.4.
c. Induced Signals and Shaping
Both raw and convoluted signal were looked at. Figure 4 below shows the current signal from the detector, convoluted with the amplifier delta response, which yields a voltage pulse. The delta response is:
, where τ is the peaking time and is set to 160 ns.
Figure 3: Ion drift lines in closed gate mode; generated using Garfield++ (left) and reference in Garfield (right)
Figure 4: Signal induced on the pad plane for a 10,000 ions avalanche
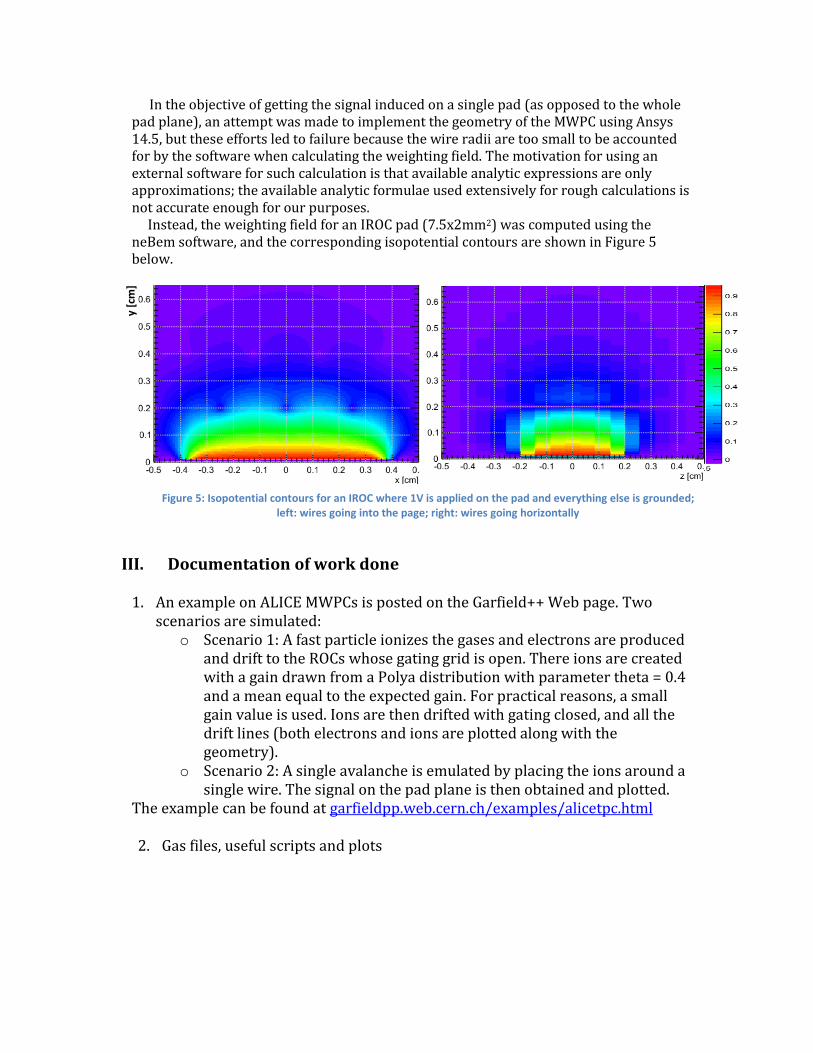
In the objective of getting the signal induced on a single pad (as opposed to the whole pad plane), an attempt was made to implement the geometry of the MWPC using Ansys 14.5, but these efforts led to failure because the wire radii are too small to be accounted for by the software when calculating the weighting field. The motivation for using an external software for such calculation is that available analytic expressions are only approximations; the available analytic formulae used extensively for rough calculations is not accurate enough for our purposes. Instead, the weighting field for an IROC pad (7.5x2mm2) was computed using the neBem software, and the corresponding isopotential contours are shown in Figure 5 below.
III. Documentation of work done
1. An example on ALICE MWPCs is posted on the Garfield++ Web page. Two
scenarios are simulated: o Scenario 1: A fast particle ionizes the gases and electrons are produced
and drift to the ROCs whose gating grid is open. There ions are created with a gain drawn from a Polya distribution with parameter theta = 0.4 and a mean equal to the expected gain. For practical reasons, a small gain value is used. Ions are then drifted with gating closed, and all the drift lines (both electrons and ions are plotted along with the geometry).
o Scenario 2: A single avalanche is emulated by placing the ions around a single wire. The signal on the pad plane is then obtained and plotted.
The example can be found at garfieldpp.web.cern.ch/examples/alicetpc.html 2. Gas files, useful scripts and plots
Figure 5: Isopotential contours for an IROC where 1V is applied on the pad and everything else is grounded; left: wires going into the page; right: wires going horizontally
y [c
m]


