Cost/benefit Analysis of Stormwater Pond Alternative Management Controls Demonstration Project

Summer Electronic Benefit
Transfer for Children
(SEBTC)
Demonstration: Summary
Report
Contract #: AG-3198-C-11-0002
May 2016
Submitted to:
U.S. Department of Agriculture
Food and Nutrition Service
Office of Research and Analysis
3101 Park Center Drive
Room 1043
Alexandria, VA 22302
Project Officer:
Chan Chanhatasilpa, PhD
Prepared by:
Abt Associates Inc.
55 Wheeler Street
Cambridge, MA 02138
In Partnership with:
Mathematica Policy Research
Maximus
Ann M. Collins,a Ronette Briefel,
b Jacob Alex Klerman,
a Anne Wolf,
a Gretchen Rowe,
b Chris Logan,
a
Ayesha Envera Syeda Fatima
a Anne Gordon,
b Julia Lyskawa,
b and
Syeda Fatima
a
aAbt Associates
bMathematica Policy Research
T

USDA is an Equal Opportunity Provider

Acknowledgements Page i
Acknowledgements
This report builds on the four years of the evaluation, which was a very large endeavor that involved many individuals who made important contributions. Most importantly, the evaluation would not have been possible without the help of the 8 State and 2 Indian Tribal Organization grantees, their State and local partners, and the participating School Food Authorities. Each year, they took the time to share their experiences and respond to our requests for information during a period of intense activity. We also appreciate the time of the families selected for the evaluation study that responded to the baseline and summer surveys.
We also wish to gratefully acknowledge the assistance provided by the Department of Agriculture, Food and Nutrition Service. We would like to recognize the help of Chanchalat Chanhatasilpa, Melissa Abelev, Hoke Wilson, Ted Macaluso, Jay Hirschman, Sangeetha Malaiyandi, Whitney Peters, as well as Dawn Bartolomeo, Julie Brewer, Anne Fiala, Vanessa Head, Heather Hopwood, Marisa Kirk-Epstein, and Angela Kline Ronald Maynard, Tina Namian, Michelle Stewart, and Linda Washington. Mark Nord of the Economic Research Service, USDA, provided expert advice on food security measures. In addition, we thank Fran Thompson, of the National Cancer Institute (NCI) of the National Institutes of Health for her expertise and technical consultation on analyzing the food consumption survey data using the NCI algorithms for analysis.
The authors thank the wide range of evaluation team members who helped make the evaluation a success. First, we extend our thanks to authors of prior reports, upon which this report builds. These include Stephen Bell, who serves as co-principal investigator for the evaluation, Jeanne Bellotti, Charlotte Cabili, Ayesha Enver, Meena Fernandes, Marina Komarovksy, Steven M. McLaughlin, Cheryl Owens, and Carrie Wolfson.
We would also like to acknowledge the team that served as liaisons to the grantees and helped compile information for the report. They include Carissa Climaco, Esa Eslami, Sarah Forrestal, Jacey Greece, Gabrielle Green, Whitney Hein, Juliette Henke, Jessica Jacobson, Ruby Jennings, Robin Koralek, Marjorie Levin, Nora Paxton, Liz Potamites, Anne St. George, Michaela Vine, and Claire Smither Wulsin. Jeanne Bellotti led the implementation study in 2011 and through April 2012. Throughout the evaluation, Cheryl Owens and Peter Relich conducted interviews with the EBT processors.
A number of individuals assisted with the design and random assignment for the SEBTC evaluation study. Data liaisons coordinated data requests and data transfers with the grantees, working to assist with any data questions and ensure that data were collected and transferred securely and on a tight time schedule. The data liaison team, led by Edward Bein in 2012, included RJ de la Cruz, Eric Friedman, Bulbul Kaul, Mike McLaughlin, and Vinh Tran, who also provided information on random assignment data files and process for the grantee profiles. In 2011, Saty Patrabansh oversaw the creation of the lists of households who consented to take

Acknowlegements Page ii
part in the demonstration, conducted random assignment and contributed to early implementation activities.
Marianne Beauregard helped to ensure that all of the major evaluation tasks were on schedule throughout the four years of the evaluation. In 2011 and 2012, Mike Battaglia developed the sample weights with the assistance of with the assistance of David Izrael. In 2013, Charles DiSogra and Stas Kolenikov developed the sample weights, with the assistance of David Izrael and in consultation with David Judkins. Edward Bein and Randall Juras assisted on major aspects of the impact analysis in 2012 and 2013 and contributed to the technical appendices in 2012.
We thank the data collection team leaders, including Rhoda Cohen, Andy Weiss, Faith Lewis, Betsy Santos, Jason DiBartolo, Dan Duplantier, Damian Emmerich, Loring Funaki, Diane Grill, Felicia Hurwitz, Shelly Jacobs, Beverly Kelly, Dan Loew, Marjorie McNaul, Mary Mack, Brianna Roche, Margie Rosa, Jesse Rude, Evelyn Schlinski, Anne Self, Ae Sengmavong, Phyllis Shank, Lucy Tindall, April Villone, Bob Vojinovic, and Jeremy Wells, and the team of telephone interviewers and field staff at Mathematica and Abt SRBI.
We acknowledge the data programming and analysis efforts of Nancy McGarry, Meena Fernandez, Kimberly Ferzcom, Lillian Fezler, Peter Honnef, Bulbul Kaul, Marina Komarovsky, and Michael McLaughlin in the preparation of data tables for prior reports. We also recognize the efforts of Scott Baumgartner Mary Kay Crepinsek, Elizabeth Condon, Brittany English, Eric Lundquist, Denise Mercury, Brendan Kirwan, and Katie Niland in the preparation of nutrition-related analytic variables for prior reports.
Chris Hamilton and Philip Gleason provided insightful technical review of this and previous reports. Stephen Bell also carefully reviewed the report.

Contents Page iii
Contents
EXECUTIVE SUMMARY .................................................................................................. XI
E.1 Introduction ......................................................................................... xi
E.2 Evaluation Overview ............................................................................ xii
E.3 Major Findings ................................................................................... xiii
E.3.1 SEBTC Implementation ......................................................... xiii E.3.2 Cost of SEBTC as a Demonstration with an Evaluation
Component.......................................................................... xiv E.3.3 SEBTC Benefit Use ................................................................ xiv E.3.4. Households in the Study ....................................................... xv E.3.5 SEBTC Impacts on Children’s Food Security ........................... xv E.3.6 SEBTC Impacts on Children’s Nutrition ............................... xviii E.3.7 Impacts on Food Expenditures ............................................. xxi E.3.8 Impacts on Other Outcomes ............................................... xxii
E.4 Conclusions ...................................................................................... xxii
CHAPTER 1 OVERVIEW................................................................................................ 1
1.1 Introduction .......................................................................................... 1
1.2 Policy Context: Summer Food Insecurity among Children ...................... 2
1.3 The SEBTC Demonstration ..................................................................... 4
1.3.1 Household Eligibility and SEBTC Benefits ................................. 4 1.3.2 Overview of Program Models................................................... 5 1.3.3 SEBTC Grantees ...................................................................... 5
1.4 Evaluation Design ................................................................................. 8
1.4.1 SEBTC Evaluation Objectives ................................................... 8 1.4.2 SEBTC Conceptual Model ........................................................ 9 1.4.3 Previous Literature on Impacts of Benefits Similar to
SEBTC on Household Food Expenditures and Food
Security ................................................................................ 11 1.4.4 Research Design ................................................................... 11 1.4.4 Reports ................................................................................. 14
1.5 Outline of the Balance of the Report .................................................... 15
CHAPTER 2 IMPLEMENTATION OF SUMMER EBT FOR CHILDREN ................................ 17
2.1 Description of SEBTC Grantees and Sites ............................................. 17
2.1.1 Grantee and Organizational Structures .................................. 18 2.1.2 Demonstration Areas ............................................................ 19 2.1.3 Demonstration Models ............................................................ 21

Contents Page iv
2.2 Providing SEBTC Benefits ..................................................................... 22
2.2.1 Identifying Eligible Children and Households ........................ 22 2.2.2 Obtaining Household Consent .............................................. 22 2.2.3 Randomly Assigning and Notifying Households of
the SEBTC Benefit ................................................................. 23 2.2.4 Issuing Benefits .................................................................... 24 2.2.5 Providing Participant Support During the Benefit
Period ................................................................................... 25 2.2.6 Benefit Expiration ................................................................. 25 2.2.7 Implementation Successes and Challenges............................ 25
2.3 SEBTC Costs ........................................................................................ 26
2.3.1 Overview of SEBTC Demonstration Costs, 2011 and
2012 .................................................................................... 26 2.3.2 Average Administrative Cost per Child and per
Household ............................................................................ 27
CHAPTER 3 SEBTC BENEFIT USE ................................................................................ 31
3.1 Households’ Use of SEBTC Benefits ..................................................... 31
3.1.1 Patterns of Benefit Use Among the $60 Group ...................... 32 3.1.2 Patterns of Benefit Use Among the $30 Benefit
Group ................................................................................... 34
3.2 Difference in Benefit Use by Program Model ........................................ 35
3.3 Redemption of Foods Under the SEBTC-WIC Model .............................. 36
3.4 Differences in Benefit Use by Household Type ..................................... 37
CHAPTER 4 SEBTC IMPACTS ..................................................................................... 39
4.1 Implementing Random Assignment, Data Collection and Analysis ....... 39
4.2 Characteristics of Participating Households ......................................... 41
4.3 Impacts on Food Security .................................................................... 43
4.3.1 Impact of the $60 SEBTC Monthly Benefit on Food
Security Compared to No Benefit .......................................... 43 4.3.2 Impact Differences: $30 Benefit Versus $60 Benefit .............. 47 4.3.3 Impacts of $30 Benefit Compared To No Benefit ................... 48
4.4 SEBTC Impacts on Children’s Nutrition ................................................ 49
4.4.1 Impact of $60 SEBTC Monthly Benefit Compared to
No Benefit ............................................................................. 50 4.4.2 Differences in Nutrition Impacts by Benefit Amount .............. 55
4.5 Impacts on Food Expenditures ............................................................ 56
4.6 Impacts on Other Outcomes ............................................................... 57

Contents Page v
CHAPTER 5 SUMMARY AND CONCLUSIONS ............................................................... 59
5.1 Feasibility of SEBTC Implementation .................................................... 59
5.2 SEBTC Costs ........................................................................................ 60
5.3 SEBTC Benefit Use ............................................................................... 61
5.4 SEBTC Impacts on Children and Households........................................ 62
5.5 Conclusion .......................................................................................... 64
REFERENCES ............................................................................................................. 67
APPENDIX 1 SEBTC FOOD PACKAGE IN SITES IMPLEMENTING THE WIC MODEL ........... 71
Standard SEBTC WIC Food Packages ............................................................ 72
APPENDIX 2 CHARACTERISTICS OF SEBTC SITES ........................................................ 75
SEBTC Demonstration Site Characteristics ................................................... 76
SEBTC Costs by Site .................................................................................... 77
APPENDIX 3 SEBTC BENEFIT USE: FINDINGS BY COHORT AND REGRESSION ANALYSIS
DESCRIPTION METHODS AND RESULTS ................................................... 79
Overview .................................................................................................... 80
EBT Data Processing and Checks of Household-level Analysis Files .............. 80
Pooling Results across Cohorts ................................................................... 82
Benefit Exhaustion Thresholds in WIC-Model Sites ....................................... 82
Descriptive SEBTC Findings by Cohort ......................................................... 84
Differences in EBT Use Patterns between SNAP-Model and WIC-Model Sites,
Among $30 Benefit Households .......................................................... 89
Data and Methods ............................................................................ 90 Regression Results ........................................................................... 91
APPENDIX 4 SUMMARY OF IMPACT DATA AND METHODS .......................................... 95
Overview .................................................................................................... 96
Random Assignment and Data Collection.................................................... 96
Random Assignment ........................................................................ 96 Data Collection ................................................................................. 96 Response Rates ................................................................................ 97
SEBTC Impact Analysis Sample .................................................................... 98
Impact Analysis Methods ............................................................................ 99
Summary of Findings ................................................................................ 100

Contents Page vi
Household and Respondent Characteristics .................................... 100 Descriptive Statistics for Covariates Used in Impact Analysis
Models ............................................................................... 102 SEBTC Impacts on Food Security ..................................................... 112 SEBTC Impacts Children’s Nutrition ................................................ 112 SEBTC Impacts on Other Outcomes ................................................ 112

Contents Page vii
Table of Figures
Exhibit E.1 Food Security Measurement ............................................................... xi
Exhibit E.2 $60 Benefit Reduced Prevalence of VLFS-C and FI-C ......................... xvi
Exhibit E.3 Impact on Very Low and Food Insecurity Among Children: $30
Benefit Versus $60 Benefit .............................................................. xvii
Exhibit E.4 Impact on Prevalence of Food Security: $30 Benefit versus $0
Benefit .......................................................................................... xviii
Exhibit E.5 Estimated Impact of $60 Monthly Benefit Versus $0 Monthly
Benefit on Nutrition Outcomes ......................................................... xx
Exhibit E.6 Impact of a $60 Benefit (vs. no benefit) on Food Expenditure ......... xxi
Exhibit 1.1 Food Security Measurement ................................................................ 2
Exhibit 1.2 Prevalence of Food Insecurity among U.S. Households with
Children and Income under 185% of the Federal Poverty Limit ............ 3
Exhibit 1.3 Overview of the SEBTC Demonstration by Year ................................... 7
Exhibit 1.4 SEBTC Evaluation Objectives and Research ......................................... 8
Exhibit 1.5 Logic Model for the SEBTC Evaluation ............................................... 10
Exhibit 1.6 Flow of Activities in 2012 of FNS, Grantees, and Evaluation Team,
Post Grant 2011 and 2012 Award ..................................................... 13
Exhibit 1.7 Reports on Summer EBT for Children Evaluation ............................... 15
Exhibit 2.1 SEBTC Grantees and Implementation Models and Sites by Year ......... 18
Exhibit 2.2 SEBTC Demonstration Sites ............................................................... 20
Exhibit 2.3 Total SEBTC Administrative and Benefit Costs, 2011 and 2012 ......... 27
Exhibit 2.4 Average Summer Cost Per Child Issued Benefits, 2012: All Sites,
WIC Sites and SNAP Sites .................................................................. 28
Exhibit 2.5 Average Summer Cost Per Household Issued Benefits in 2012: All
Sites, WIC and SNAP Sites, 2012 ....................................................... 29
Exhibit 3.1 Summary of SEBTC Benefit Use Patterns, All Cohorts, $60 Benefit
Amount (2011-2014) ........................................................................ 33
Exhibit 3.2 Summary of SEBTC Benefit Use Patterns, All Cohorts, $30 Benefit
Amount (2013-2014) ........................................................................ 34
Exhibit 3.3 SEBTC Participation, Redemption, and Benefit Exhaustion Rates
for SNAP and WIC-Model Sites, All Cohorts, $60 Benefit Amount
(2011-2014) ..................................................................................... 35
Exhibit 3.4 Redemption Rates for WIC Food Categories (ordered by average),
All Cohorts, $60 Benefit Amounta
(2011-2014 ) ................................ 37

Contents Page viii
Exhibit 4.1 SEBTC Household Income as a Percent of the Federal Poverty Line
at Baseline (i.e., Before the End of the School Year) ........................... 41
Exhibit 4.2 Household Participation in Nutrition Programs At Baseline, (i.e.,
Before the End of the School Year) .................................................... 42
Exhibit 4.3 Comparison of SEBTC Sample and National Estimates of
Household Food Insecurity among Households with Children and
Incomes at or Below 185% of the Federal Poverty Level ..................... 43
Exhibit 4.4 $60 Benefit Reduced Prevalence of VLFS-C and FI-C ......................... 44
Exhibit 4.5 Estimated Impact of $60 versus $0 SEBTC Benefit on Food
Insecurity among Children, Adults, and Households ......................... 44
Exhibit 4.6 SEBTC Subgroups for the Impact Analysis ......................................... 45
Exhibit 4.7 Estimated Impact of $60 versus $0 SEBTC Benefit on Very Low
Food Security among Children, by Subgroup (when Significant) ........ 46
Exhibit 4.8 Spring-to-Summer Change in Prevalence of Very Low Food
Security and Food Insecurity among Children for $60 and $0
Benefit Groups, 2011 and 2012 ........................................................ 47
Exhibit 4.9 Impact on Very Low and Food Insecurity Among Children: $30
Benefit Versus $60 Benefit ................................................................ 48
Exhibit 4.10 Impact on Prevalence of Food Security: $30 Benefit versus $0
Benefit ............................................................................................. 49
Exhibit 4.11 Estimated Impact of $60 Monthly Benefit Versus $0 Monthly
Benefit on Nutrition Outcomes ......................................................... 51
Exhibit 4.12 Impact of $60 Versus $0 Monthly Benefit on Children’s Daily
Fruit and Vegetable Consumption (excluding fried potatoes) ............ 52
Exhibit 4.13 Impact of $60 Versus $0 Monthly Benefit on Children’s Daily
Whole Grains Consumption .............................................................. 53
Exhibit 4.14 Impact of $60 Versus $0 Monthly Benefit on Children’s Daily
Dairy Consumption .......................................................................... 54
Exhibit 4.15 Impact of $60 Versus $0 Monthly Benefit on Children’s Daily
Consumption of Added Sugars from Sugar-Sweetened Beverages ..... 55
Exhibit 4.16 Impact of a $60 Versus $0 Benefit on Food Expenditures ................ 56
Exhibit 1.A SEBTC Food Package in Sites Implementing the WIC Model ............... 73
Exhibit 2.A Characteristics of SEBTC Demonstration Sites ................................... 76
Exhibit 2.B Average Total Cost Per Child and Household .................................... 77
Exhibit 3.A Minimum Remaining Food Quantities in SEBTC-WIC Accounts for
Benefit Exhaustion Analysis, 2012 Evaluation ................................... 83
Exhibit 3.B Minimum Remaining Food Quantities in SEBTC-WIC Accounts for
Benefit Exhaustion Analysis, 2013 Evaluation ................................... 84
Exhibit 3.C Participation of Households and Children in SEBTC, by Cohort,
$60 Benefit Amount (2011-2014) ..................................................... 85

Contents Page ix
Exhibit 3.D Participation of Households and Children in SEBTC, by Cohort,
$30 Benefit Amount (2013-2014) ..................................................... 85
Exhibit 3.E SEBTC Benefit Redemption, by Cohort, $60 Benefit Amount
(2011-2014) ..................................................................................... 86
Exhibit 3.F SEBTC Benefit Redemption, by Cohort, $30 Benefit Amount
(2013-2014) ..................................................................................... 86
Exhibit 3.G Rates of Redemption for WIC Food Categories, by Cohort
(ordered by average for all cohorts), $60 Benefit Amount (2011-
2014) ............................................................................................... 87
Exhibit 3.H Rates of Redemption for WIC Food Categories, by Cohort
(ordered by average for all cohorts), $30 Benefit Amount (2013-
2014) ............................................................................................... 87
Exhibit 3.I Percent of Households Exhausting Benefits in one or more
summer months, by Cohort, $60 Benefit Amount (2011-2014) ......... 88
Exhibit 3.J Percent of Households Exhausting Benefits in one or more
summer months, by Cohort, $30 Benefit Amount (2013-2014) ......... 88
Exhibit 3.K SEBTC Participation, Redemption, and Benefit Exhaustion Rates for
SNAP and WIC-Model Sites, All Cohorts, $30 Benefit Amount
(2013-2014) ..................................................................................... 89
Exhibit 3.L SEBTC Benefit Use Outcome Variables............................................... 89
Exhibit 3.M Parameter Estimates for the Three Models with Site Indicators .......... 91
Exhibit 3.N Parameter Estimates for the Three Models with WIC model and
Passive Consent Indicators ............................................................... 93
Exhibit 4.A Response Rates, All Sites and by Site, Spring and Summer 2011,
2012, and 2013 ............................................................................... 97
Exhibit 4.B Sample Size, by Year for the Pooled Data .......................................... 99
Exhibit 4.C SEBTC Household Characteristics at Baseline .................................. 101
Exhibit 4.D Race/Ethnicity and Education Levels of SEBTC Respondents ............ 102
Exhibit 4.E Prevalence during the School Year of Severe and General Food
Insecurity among Children, Adults, and Households, by Benefit
Status and for All Households, Spring 2011, 2012, and 2013 ......... 103
Exhibit 4.F Household Characteristics Used as Covariates, by Benefit Status
and for All Households, Spring, 2011, 2012, and 2013 .................. 105
Exhibit 4.G Respondent Characteristics Used as Covariates, by Benefit Status
and for All Households, Spring 2011, 2012, and 2013 ................... 108
Exhibit 4.H Participation in Nutrition Assistance Programs during the School
Year, by Benefit Status and for All Households, Spring 2011,
2012, and 2013 ............................................................................. 110
Exhibit 4.I Estimated Impact of SEBTC on Food Security among Children,
Adults, and Households in Summer ................................................ 113

Contents Page x
Exhibit 4.J Estimated Impact of SEBTC on Very Low Food Security among
Children in Summer, by Subgroup .................................................. 114
Exhibit 4.K Estimated Impact of SEBTC on Food Insecurity among Children in
Summer, by Subgroup .................................................................... 116
Exhibit 4.L Estimated Impact of SEBTC on Children’s Food Consumption in
Summer ......................................................................................... 118
Exhibit 4.M Estimated Impact of SEBTC on Children’s Food Consumption in
Summer, by WIC/SNAP Program Model ........................................... 119
Exhibit 4.N Estimated Impact of SEBTC on Children’s Food Consumption in
Summer, by Poverty Status ............................................................. 121
Exhibit 4.O Estimated Impact of SEBTC on Children’s Food Consumption in
Summer, by School District Locale .................................................. 123
Exhibit 4.P Estimated Impact of SEBTC on Food Expenditures in Summer ......... 125
Exhibit 4.Q Estimated Impact of SEBTC on Food Expenditures in Summer, by
WIC/SNAP Program Model .............................................................. 125
Exhibit 4.R Estimated Impact of SEBTC on Participation in Nutrition
Assistance Programs in Summer ..................................................... 126

Executive Summary Page xi
Executive Summary
E.1 Introduction
To address children’s nutritional needs in the summer, when school is out of session, the Summer Food Service Program (SFSP) and other USDA summer programs provide free meals and snacks to children who receive the National School Lunch Program (NSLP) or the School Breakfast Program (SBP) during the school year. However, FNS’s summer meals programs reach far fewer children than those who normally receive the school-year programs, with only 15 percent of children who receive NSLP and/or SBP receiving summer meals (Gordon & Briefel, 2003; Food Research and Action Center, 2014). Many communities provide other types of food assistance and child-centered programs during the summer months to meet the nutritional needs of low-income children, but locations and resources are limited, leaving gaps in access to food during the summer for low-income children resulting in very low food security among children (VLFS-C or food insecurity among children (FI-C) (See Exhibit E.1 about the measurement of food security).
Exhibit E.1 Food Security Measurement
Household Food Security was measured with an 18-item survey module developed by USDA to assess and monitor food security in large-scale population studies. The household measure assesses the food security of any children in the household, any adults in the household, or any member (child or adult) in the household.
Very low food security (VLFS): the food intake of household members is reduced and their normal eating
patterns are disrupted because the household lacks money and other resources for food.
Low food security (LFS): Household members experience reduced quality, variety, or desirability of diet. Little or no indication of reduced food intake.
Food insecurity (FI): Household members experience either VLFS or LFS.
Annual national measures of food security are based on a 12-month reference period. This evaluation uses a 30-day reference period to assess current status relative to the recent intervention.
Therefore, as part of its efforts to end child hunger, the Food and Nutrition Service (FNS) of the U.S. Department of Agriculture (USDA) studied alternative additional approaches to providing food assistance to children in the summer months. The 2010 Agriculture Appropriations Act (P.L. 111-80) authorized and provided funding for USDA to implement and rigorously evaluate the Summer Food for Children Demonstrations. The specific goals of the demonstrations were, in the summer months, to (1) “reduce or eliminate food insecurity and hunger of children”, and (2) “improve the nutritional status of children.” The P.L. 111-80 also included funds for a rigorous evaluation of the various demonstrations.
The Summer Electronic Benefit Transfer for Children (SEBTC) was the largest of the demonstrations implemented. Under an FNS contract, Abt Associates, Mathematica Policy

Executive Summary Page xii
Research, and Maximus studied how the SEBTC demonstration program unfolded over time (2011-2014) and conducted a random assignment evaluation of its impact on very low food security among children (VLFS-C) , other levels of food insecurity, children’s nutrition, and other outcomes including nutrition program participation and household food expenditures.
The SEBTC benefit was provided to randomly selected households with children who were, in the prior school year, in pre-kindergarten through 12th grade and certified for free or reduced-price (FRP) school meals in the school food authorities (SFAs) that participated in the demonstration. All households with at least one child certified for FRP in a participating SFA and who gave consent had an opportunity to receive the SEBTC benefit should they be randomly selected. To deliver SEBTC benefits, grantees chose to use either their EBT benefit systems that delivered the Supplemental Nutrition Assistance Program (SNAP) or through their electronic benefit transfer (EBT) systems for the Special Supplemental Nutrition Program for Women, Infants, and Children (WIC), (but not both). Benefits were loaded onto new or existing EBT cards. SEBTC then followed the general program rules of either the SNAP or WIC, depending which was selected by the grantee.
In the summers of 2011 and 2012, for households that were randomly selected, the value of SEBTC was $60 per eligible child per month; other households received no SEBTC benefit. In 2013, there were two benefit levels; households were randomly selected to receive either a $60 monthly benefit per eligible child benefit or a $30 monthly benefit per child per month benefit. In sites that participated in the evaluation in the summer of 2014, households that remained eligible received the benefit level—$60 or $30—they had received in the summer of 2013.
E.2 Evaluation Overview
The SEBTC evaluation had six major research objectives:
1. To assess the feasibility of implementing SNAP and WIC models of SEBTC benefit delivery 2. To examine the implementation of SEBTC, including approaches used, and the challenges
and lessons learned during the demonstrations 3. To determine and document the total and component costs of implementing and operating
the demonstrations; and to determine the overall costs and facilitate comparisons of different operational models
4. To describe receipt and use of the SEBTC benefits 5. To describe households that took part in the demonstration and examine the impact of a
$60 per child monthly SEBTC benefit on children and their families’ food security (especially VLFS-C), food expenditures, and children’s nutrition
6. To determine the differential impact of a $60 per child monthly SEBTC benefit amount and a $30 monthly benefit amount on the study’s main outcomes (i.e., food security, food expenditures, and children’s nutrition)

Executive Summary Page xiii
Objectives 5 and 6 relate to the study’s principal purpose: to determine whether SEBTC alleviates children’s food insecurity and improves their nutrition using rigorous research methods. For the impact analysis, the evaluation used a random assignment design to provide credible and rigorous estimates of the impact of the demonstrations. When executed correctly, random assignment assures that those assigned to differing treatment conditions vary only by the functional equivalent of a coin toss. Hence, any difference in subsequent outcomes, if more than chance, must be due to the causal effect of the benefit; the households do not systematically differ in their program eligibility or personal characteristics in ways that might themselves influence subsequent outcomes.
To supplement the impact analysis, the evaluation includes a detailed implementation study in 2011, 2012, and 2014 (but not 2013), which assessed the operational feasibility of the demonstration and identified the challenges encountered. A cost analysis conducted in 2011 and 2012 (but not 2013 or 2014) provides information on the total and component costs of implementing and operating the demonstration. Finally, in all four years, an EBT analysis used data on all households who received benefits, including those that were not part of the implementation analysis to compute rates of use of the benefit.
E.3 Major Findings
E.3.1 SEBTC Implementation
For grantees, the implementation of SEBTC required rolling out a new benefit, new partnerships among State and local agencies, the adaptation of existing administrative systems and technologies, and a short implementation time frame. Consequently, grantees found some aspects of SEBTC challenging to implement. One common challenge was addressing the quality of school-district data and, in some cases, in matching information from school and other administrative systems. Other challenges entailed the relatively short time frame for grantees to implement SEBTC.
To obtain household consent in the demonstration and evaluation, grantees could choose either an active consent process (i.e., requiring guardians to return consent materials if they desired to be part of the demonstration) or a passive consent process (i.e., requiring guardians to return a pre-addressed letter if they desired to be excluded). Several grantees in active consent sites had difficulty getting enough guardians to read and return consent forms to meet numbers needed for the demonstration and evaluation. The active consent process is analogous to having households apply for SEBTC, should it be a pilot or an ongoing program.
Despite these implementation challenges, in most sites, the vast majority of consenting households received SEBTC within days of when the school year ended. Given this success and additional information about SEBTC participation and redemption rates presented below, the evaluation team concluded that abroad implementation of SEBTC was feasible.

Executive Summary Page xiv
E.3.2 Cost of SEBTC as a Demonstration with an Evaluation Component
As noted, the evaluation collected cost information in 2011 and 2012, but not 2013 or 2014. In 2011, SEBTC served approximately 12,500 children. The total cost of the 2011 demonstration was $3.6 million, including $1.9 million in administrative costs and $1.6 million in benefits. In 2012, when SEBTC expanded to approximately 67,000 children, the total cost was $13.2 million, including $4.0 million in administrative costs and $9.3 million in benefits.
In 2012, the SEBTC was implemented in the largest number of sites and served the largest number of children and families compared to the other years. In that year, administrative cost of SEBTC averaged $60 per child and the benefit cost averaged $141. Thus, administrative costs were 30 percent of the total cost. Administrative costs for SEBTC in its early demonstration years were higher than for most ongoing nutrition assistance programs.
For several reasons, it would be expected that the SEBTC demonstration’s average administrative costs would much higher than for ongoing nutrition assistance programs. First, grantees experienced additional administrative costs because of their participation in the evaluation; these costs could not be isolated. Second, many administrative costs per child would decline with larger-scale implementation in which more children are served. Third, recurring annual administrative costs of identifying and enrolling eligible children and households might decline over time as SEBTC becomes better known and as enrollment is routinized (and perhaps streamlined). However, administrative costs for SEBTC may remain a relatively large share of total costs because application and account set-up costs are spread over only three months, instead of the longer duration of most food assistance programs (e.g., certification for FRP meals is valid for the entire school year).
E.3.3 SEBTC Benefit Use
Across all years, of all households issued SEBTC benefits, 89 percent participated in SEBTC (i.e., redeemed some or all of their benefits for the summer). Since benefits were issued and redeemed at the household level, this is the primary participation rate measure for SEBTC. Taking into account all households issued benefits whether or not the household used them, the mean percentage of benefits redeemed was more than three-quarters (76 percent).
These overall participation and redemption rates mask considerable differences in benefit use between households in sites that implemented SEBTC using the EBT systems for SNAP and those that used the EBT systems for WIC. Rates of participation and redemption were considerably higher in the SNAP-model sites than the WIC-model sites. Specifically, households issued benefits in the WIC-model sites had an average participation rate more than 12 percentage points lower (83 percent) than those in the SNAP-model sites (95 percent). The gap in redemption rates (unconditional on participation) was even larger: the average household issued benefits in the WIC-model sites redeemed only 61 percent, while in the SNAP-model sites average redemption was 93 percent.

Executive Summary Page xv
Households that received $30 per eligible child in SEBTC benefits in 2013 and 2014 had similar participation and benefit exhaustion rates to $60 benefit households. In contrast, the $30 group redeemed benefits at a lower rate. However, analyses of the 2013 data (when households in a given site were randomized to $60 or $30 and therefore analysis could be used to adjust for site-level and personal characteristics) suggest that there was a difference between 1 and 2 percent between the $30 and $60 groups in participation and redemption rates and a 7 percent difference in benefit exhaustion, with the $30 group more likely to exhaust their benefits.
E.3.4. Households in the Study
Given the rules for participation in the demonstration, it would be expected that households in SEBTC would be relatively more disadvantaged compared to the general population of households with school-age children. In fact, 71 percent of households in the evaluation had monthly incomes below FPL, a higher rate of participation in other nutrition assistance programs and experienced more food insecurity than the average U.S. household with children.
In the spring, prior to the issuance of SEBTC, the evaluation sample reported, more severe food insecurity than the comparable national population. Compared to the nation’s households eligible for SEBTC—that qualified if their incomes were under 185 percent of the federal poverty level (FPL)—the national prevalence of VLFS-C is 2.2 percent in 2012. In contrast, the prevalence of VLFS-C in SEBTC households between 2011 and 2014 was more than three times as high—8.0 percent.
E.3.5 SEBTC Impacts on Children’s Food Security
Impact of the $60 SEBTC Monthly Benefit on Food Security Compared to No Benefit
Measured impacts of a $60 SEBTC benefit compared to no benefit were substantively large and statistically significant (Exhibit E.2). SEBTC decreased the prevalence of the most severe food insecurity among children by one-third. Without SEBTC, 9.1 percent of households experienced VLFS-C; in contrast, with a $60 per child per month SEBTC benefit, 6.1 percent of households experienced VLFS-C.
SEBTC also reduced the prevalence of food insecurity among children (FI-C) by nearly a fifth. Without SEBTC, 43.0 percent of households had food insecure children; with a $60 per child monthly benefit, only 34.7 percent of households had FI-C. This is a reduction of 8.3 percentage points.

Executive Summary Page xvi
Exhibit E.2 $60 Benefit Reduced Prevalence of VLFS-C and FI-C
1 Source: From regression model estimated on pooled SEBTC Summer Survey data from 2011, 2012, and 2013 (n=48,431). Households were randomized to either $60 or no benefit in 2011 and 2012. *.05 < p < .10, **.01 < p < .05, ***p <. 01
Impact Differences: $60 Benefit Versus $30 Benefit
When comparing the impact of a $60 monthly per child benefit with the impact of a $30 benefit on VLFS-C and FI-C, the results were mixed. Comparing the $60 monthly benefit with the $30 benefit, the size of the reduction was not statistically significant at the p <. 05 level, which is the standard by which we define significance in the evaluation. The difference was significant at the p< 0.10 level (Exhibit E.3). In contrast, the $60 benefit compared to the $30 benefit conclusively reduced FI-C and the other four measures of food security, applying to adults or to anyone in the household that were used in the study. For these other measures, the impact of a $60 benefit relative to a $30 benefit was about half the impact of a $60 benefit relative to no benefit.
1 All impacts described in the body of this report are statistically significant at the p<0.05 level unless otherwise
noted.
9.1%
43.0%
6.1%
34.7%
0%
10%
20%
30%
40%
50%
VLFS-C FI-C
Pre
vale
nce
Rat
e
SEBTC Benefit Amount $0 $60
-3.0***
-8.3***

Executive Summary Page xvii
Exhibit E.3 Impact on Very Low and Food Insecurity Among Children: $30 Benefit Versus $60 Benefit
Source: From regression model estimated on pooled SEBTC Summer Survey data from 2011, 2012, and 2013 (n=48,431). Households were randomized to either $60 or $30 in 2013.
Note: Difference in very low food security among children (VLFS-C) is -0.6 percentage points (p.p.), standard error (SE) = 0.3, p= 0.076. Difference in low food security among children (FI-C) is -3.6 p.p., SE = 0.64, p < 0.001.
*.05 < p < .10, **.01 < p < .05, ***p <. 01
Impacts of $30 Benefit Compared To No Benefit
The evaluation also estimated the impact of a $30 benefit compared to no benefit quasi-experimentally by subtracting the estimated impact of $60 versus $30 (estimated from randomization to $60 or $30 in 2013) from the estimated impact of $60 versus no benefit (estimated from randomization to $60 or no benefit in 2011 and 2013). The estimated impact of a $30 benefit versus a$0 benefit was 0.6 percentage points for VLFS-C, while the estimate of $30 versus $0 benefit was 4.7 percentage points for FI-C (Exhibit E.4). Additional analysis shows the effect of larger benefits to be approximately linear for all food security outcomes except VLFS-C. For this most severe form of household food insecurity, the impact of SEBTC is non-linear and decreased as the benefit grew.
6.7%
38.3%
6.1%
34.7%
0%
10%
20%
30%
40%
50%
VLFS-C FI-C
Pre
vale
nce
Rat
e
SEBTC Benefit Amount $30 $60
-0.6*
-3.6***

Executive Summary Page xviii
Exhibit E.4 Impact on Prevalence of Food Security: $30 Benefit versus $0 Benefit
Source: From regression model estimated on pooled SEBTC Summer Survey data from 2011, 2012, and 2013 (n=48,431). Households were randomized to either $60 or no benefit in 2011 and 2012. In 2013, households were randomized to $30 or $60 benefit groups.
Note: Difference in standard error (SE) for very low food security among children (VLFS-C) = 0.48, p < 0.001. SE for food insecurity among children (FI-C) SE = 0.91, p < 0.001.
*.05 < p < .10, **.01 < p < .05, ***p <. 01
E.3.6 SEBTC Impacts on Children’s Nutrition
In addition to considering SEBTC’s impact on VLFS-C and FI-C, the study also estimated the impact of SEBTC on children’s nutrition, defined for the purposes of the evaluation as dietary quality based on reported food consumption.
Impact of $60 SEBTC Monthly Benefit Compared to No Benefit
Across all sites in the evaluation, SEBTC improved dietary quality for most of the nutrition outcomes measured by the study (Exhibit E.5).2 For instance, SEBTC increased children’s mean
2 The SEBTC survey questions measured eight dietary indicators of children’s food consumption during the 30 days
before the survey for one target child per household: fruits and vegetables (total and excluding fried potatoes); whole grains; dairy products; added sugars (total, from sugar-sweetened beverages, and excluding cereals); and whether the child usually drank nonfat or low-fat milk. Measures are based on USDA’s recommended daily intake for food groups (USDA, 2015).

Executive Summary Page xix
fruit and vegetable consumption by one-third of a cup (0.36 cup equivalents) per day (Exhibit E.5).3
For most nutrition outcomes, there was a statistically significant increase in both the SNAP-model and WIC-model sites, but, unlike the food security outcomes where there was also a statistically significant difference in impacts between the models. The impact on children’s nutrition in the WIC-model sites was twice that in the SNAP-model sites. For instance, for fruit and vegetable consumption, there was a difference of 0.5 cup equivalents between the $60 group and the $0 group in the WIC-model sites compared to 0.2 cup equivalents in the SNAP-model sites.
3 This impact is similar to the one-third cup estimated impact of the Fresh Fruit and Vegetable Program
intervention, which delivers fresh fruits and vegetables as free snacks during school hours in elementary schools with at least 50 percent of students eligible for FRP school meals (Bartlett et al., 2013; USDA, 2014).

Executive Summary Page xx
Exhibit E.5 Estimated Impact of $60 Monthly Benefit Versus $0 Monthly Benefit on Nutrition Outcomes
Outcome Sample
Size
$60 Benefit Group
Consumption
$0 Benefit Group
Consumption
Impact ($60/$0
Difference) SE p-value
Fruits and vegetables (cup equivalents per day)
a
42,774 3.3 2.9 0.4 *** 0.03 < 0.001
Fruits and vegetables, without fried potatoes (cup equivalents per day)
a
42,818 3.2 2.8 0.4 *** 0.03 < 0.001
Whole grains (ounce equivalents per day)
b
43,165 2.2 1.7 0.5 *** 0.05 < 0.001
Dairy (cup equivalents per day)
c
43,302 2.5 2.3 0.2 *** 0.03 < 0.001
Usually drank nonfat or low-fat milk (%)
d
42,406 13.2 13.7 -0.5 0.71 0.442
Added sugars (teaspoons per day)
e
42,494 18 18.2 -0.2 0.17 0.313
Added sugars excluding cereals (teaspoons per day)
e
42,800 16.6 17.1 -0.5 *** 0.15 0.002
Sugar-sweetened beverages (teaspoons per day)
e
43,357 7.6 8.2 -0.6 *** 0.16 < 0.001
Source: From regression model estimated on pooled SEBTC Summer Survey data from 2012 and 2013. Households were randomized to either $60 or no benefit in 2011 and 2012. In 2013, households were randomized to $30 or $60 benefit groups.
Note: Numbers may not add due to rounding. a Daily amounts of fruits and vegetables and dairy are measured in cup equivalents and in ounce equivalents for whole grains,
as defined by the 2010 Dietary Guidelines for Americans. For fruits and vegetables, 1 cup equivalent is defined as 1 cup raw or cooked fruit or vegetables, vegetable juice, or fruit juice; 2 cups leafy green vegetables; or 1/2 cup dried fruit. b
One ounce equivalent of whole grains is 1 one-ounce slice of bread; 1 ounce uncooked pasta or rice; 1/2 cup cooked rice; pasta; or cereal; 1 6-inch diameter tortilla; 1 5-inch diameter pancake; or 1 ounce ready-to-eat cereal. c One cup equivalent of dairy is 1 cup milk, fortified soy beverage, or yogurt; 1½ ounces natural cheese; or 2 ounces of
processed cheese. The dairy items included in the survey also included cheese in mixed dishes and pizza and ice cream. d
Respondents who reported that their child consumed more than one type of milk were included if any of the milk types reported were nonfat or low-fat. Those reporting only whole milk and/or 2% milk were not considered to usually consume nonfat or low-fat milk. e
Teaspoons of added sugars are derived from reported frequencies of consuming sugar-sweetened beverages (soda, fruit-flavored drinks, and sugar or honey added to coffee or tea); cookies/cakes/pies; doughnuts; ice cream; candy; and cereals.
*.05 < p < .10, **.01 < p < .05, ***p <. 01.
Differences in Nutrition Impacts by Benefit Amount
Relative to a $30 SEBTC monthly benefit, a $60 monthly benefit led to favorable changes in several of the measured dietary indicators of children’s nutrition, but the changes were smaller than those seen in comparing the $60 benefit to no benefit. Relative to a $30 SEBTC monthly benefit, children in households receiving the $60 SEBTC monthly benefit ate slightly more fruits and vegetables (0.2 cup equivalents more than the $30 group) and whole grains (0.13 ounce equivalents more than the $30 group). Relative to a $30 SEBTC monthly benefit, a $60 benefit had no statistically significant impact on total daily added sugars from all foods and beverages or from sugar-sweetened beverages alone, or on dairy foods or usually drinking nonfat or low-fat milk (compared to usually drinking higher fat milks).

Executive Summary Page xxi
Finally, using a quasi-experimental methodology, the evaluation considered whether a $30 SEBTC benefit improved nutrition outcomes relative to no benefit. This analysis suggests that, relative to no benefit, a $30 benefit increased consumption of fruits and vegetables, whole grains, and dairy items and lowered intake of sugar-sweetened beverages and consumption of added sugars excluding cereal (p<0.05), but there is no evidence of lowering added sugars including cereal (p=0.23).
E.3.7 Impacts on Food Expenditures
SEBTC increased total household food expenditures (i.e., combined expenditures using SNAP benefits, SEBTC benefits, and out-of-pocket funds). Previous research suggests that households will respond to receiving food assistance, in part, by reducing their out-of-pocket (i.e., cash) expenditures on food, instead using the same cash for other household expenditures (e.g., clothing, housing, entertainment). In fact, consistent with previous research, the average household in the $60 benefit group received $92 in SEBTC benefits over the course of the summer and spent an additional $53 dollars on food (Exhibit E.6). This amount equates to 58 cents of additional food expenditure for every dollar of SEBTC benefits received.
Exhibit E.6 Impact of a $60 Benefit (vs. no benefit) on Food Expenditure
Source: From regression model estimated on pooled SEBTC Summer Survey data from 2011, 2012, and 2013 (n=45,641). Households were randomized to either $60 or no benefit in 2011 and 2012.
Note: Difference in monthly household expenditures (out-of-pocket plus SNAP) is -$40, standard error (SE) = 4.02, p < 0.001. Difference in total food expenditures including SEBTC is $53, SE = 4.09, p < 0.001. Numbers may not sum due to rounding.
*.05 < p < .10, **.01 < p < .05, ***p <. 01
Similar patterns were observed for a $60 benefit versus a $30 benefit. For every additional dollar of SEBTC benefit, food expenditure increased by 59 cents.
$579 $539
$92
$0
$100
$200
$300
$400
$500
$600
$700
$0 $60
Exp
en
dit
ure
SEBTC Benefit Amount
SNAP+Out-of-Pocket SEBTC
$631 $579
$53***

Executive Summary Page xxii
E.3.8 Impacts on Other Outcomes
The study also considered whether SEBTC had an impact on SNAP or on WIC participation, and on children’s participation in the Summer Food Service Program (SFSP). There is some evidence that SEBTC lowered use of SFSP and other child nutrition programs, but the impacts were small. Children in households receiving SEBTC were slightly less likely to participate in SFSP (6.6 percent for the $60 benefit versus 7.3 percent for the no-benefit group.)
There was no strong evidence that SEBTC affected participation in other food assistance programs. The SEBTC benefit had no impact on households’ SNAP participation during the summer. There was some evidence of higher participation in WIC, but this may be spurious or linked to survey respondents receiving the SEBTC-WIC benefits and reporting it as the standard WIC.
E.4 Conclusions
With the SEBTC demonstration the 2010 Agricultural Appropriations Act funded one of the largest demonstration and evaluation of a publicly funded initiative to reduce childhood hunger ever conducted. The evaluation used the most rigorous method for estimating impacts—random assignment. More than 100,000 households were randomized over three summers.
For almost all objectives, the evaluation’s findings are conclusive. The demonstration showed that SEBTC can feasibly be implemented, using either the SNAP or WIC model, at a large scale, in a range of communities, and with a variety of implementation approaches. SEBTC analysis showed that nearly all households that were provided with SEBTC benefits used them, and that the households that used SEBTC benefits at least once used the vast majority of the benefits issued to them. Of highest policy relevance, the impact evaluation shows that receiving SEBTC benefits improves children’s food security and nutrition. For most outcomes, impacts are substantially larger for the larger benefit ($60 versus $30); and for nutritional outcomes, impacts are substantially larger for the WIC-model than for the SNAP-model. Finally, the evaluation provided less conclusive findings about the potential costs of an SEBTC as an ongoing program because of the relatively small number of sites, the limited cost data collection of just two years, and other factors such as the use of SNAP or WIC EBT systems to deliver benefits.

Chapter 1 Page 1
Chapter 1
Overview
1.1 Introduction
To address children’s nutritional needs in the summer, when school is out of session, the Summer Food Service Program (SFSP) and other USDA summer programs provide free meals and snacks to children who are eligible to receive the National School Lunch Program (NSLP) or the School Breakfast Program (SBP) during the school year (FNS, 2015a; FNS 2015b).4 FNS’s summer meals programs5 reach far fewer children than those who normally receive the school-year programs, with only 15 percent of children who receive NSLP and/or SBP receiving summer meals (Gordon & Briefel, 2003; Food Research and Action Center, 2015a). Many communities provide other types of food assistance and child-centered programs during the summer months to meet the nutritional needs of low-income children, but locations and resources are limited, leaving gaps in access to food during the summer for low-income children.
Therefore, as part of its efforts to end child hunger, the Food and Nutrition Service (FNS) of the U.S. Department of Agriculture (USDA) studied alternative additional approaches to providing food assistance to children in the summer months. The 2010 Agriculture Appropriations Act (P.L. 111-80) authorized and provided funding for USDA to implement and rigorously evaluate the Summer Food for Children Demonstrations. The specific goals of the demonstrations were, in the summer months, to (1) “reduce or eliminate food insecurity and hunger of children”, and (2) “improve the nutritional status of children.” The P.L. 111-80 also included funds for a rigorous evaluation of the various demonstrations.
The Summer Electronic Benefit Transfer for Children (SEBTC) was one of the demonstrations implemented (FNS, 2014d). Under an FNS contract, Abt Associates, Mathematica Policy Research, and Maximus studied how the SEBTC demonstration program unfolded over time and conducted a random assignment evaluation of its impact on SEBTC participants.
The SEBTC demonstration took place during the summers of 2011 through 2014. For each of the first three study years, the evaluation team prepared a detailed report describing SEBTC
4 The NSLP and SBP provide subsidized meals to children in school. Children from low-income families obtain these
meals free or at a reduced price (FRP). Children living in households with incomes below 130 percent of the federal poverty level are eligible to receive meals for free; those with incomes of 130–185 percent of the poverty level are eligible for reduced-price meals (FNS, 2014a, 2014b). 5 These include SFSP and NLSP and SBP served during summer school, and “Seamless Summer”. The latter is a
school-based SFSP site that uses SBP/NSLP claiming procedures and is reimbursed at SBP/NSLP rates. Summer school students can be fed under regular SBP/NSLP.

Chapter 1 Page 2
implementation and impacts (Collins et al., 2012; Collins et al., 2013, & Collins et al., 2014). This report summarizes the study’s major findings across the years. When appropriate, this summary report refers readers to previously published reports for more detailed findings as well as additional methodological detail. This chapter provides a brief overview of the policy context, followed by a description of the demonstration models and the multi-component evaluation design.
1.2 Policy Context: Summer Food Insecurity among Children
In 2013, the national prevalence of food insecurity among households with children and with incomes at or below 185 percent of poverty was approximately 40 percent (Coleman-Jensen et al., 2014). The same study found that nationwide, among households with incomes below the poverty line, the prevalence of food insecurity among children was approximately 25 percent and VLFS-C, the most severe form of food insecurity (See Exhibit 1.1 for definition of VLFS) was 2.7 percent (Coleman-Jensen et al., 2014). Over the period of the demonstration, 2011-2014, the national average of the prevalence of food insecurity and of VLFS-C among households with children was essentially unchanged, but prevalence rates varied widely across States and local areas (Exhibit 1.2).
Exhibit 1.1 Food Security Measurement
Household Food Security was measured with an 18-item survey module developed by USDA to assess and monitor food security in large-scale population studies. The household measure assesses the food security of any children in the household, any adults in the household, or any member (child or adult) in the household.
Very low food security (VLFS): the food intake of household members is reduced and their normal eating
patterns are disrupted because the household lacks money and other resources for food.
Low food security (LFS): Household members experience reduced quality, variety, or desirability of diet. Little or no indication of reduced food intake.
Food insecurity (FI): Household members experience either VLFS or LFS.
Annual national measures of food security are based on a 12-month reference period. This evaluation uses a 30-day reference period to assess current status relative to the recent intervention.

Chapter 1 Page 3
Exhibit 1.2 Prevalence of Food Insecurity among U.S. Households with Children and Income under 185% of the Federal Poverty Limit
Note: VLFS-C = Very Low Food Security among Children; FI-C= Food Insecurity among Children; FI-H = Food Insecurity among households.
Source: 2010, 2011, 2012, and 2013 Current Population Survey data, 12-month reference period (Coleman-Jensen et al., 2011, 2012, 2013, and 2014).
*.05 < p < .10, **.01 < p < .05, ***p <. 01
Low-income children rely on school meal programs as a consistent source of food assistance during the school year, but many lack access to such programs in the summer. This lack of access raises the concern that many children’s food insecurity might increase in the summer, but research on seasonal differences in food security among households with children is limited. One of the few analyses available, using national data from the 1995 through 2001 Current Population Survey (CPS), when food security data were collected at various times during the year, suggests that food insecurity among children increases in the summer in States that provide fewer SFSP meals and summer school lunches (Nord and Romig, 2006).6
The objective of the USDA’s summer meals programs is to reduce the risk that children in low-income households miss meals during the summer when they have little or no access to the NSLP and SBP. More specifically, SFSP provides free, nutritious meals and snacks to help children under age 18 get the nutrition they need to grow, learn, and play throughout the
6 Nord and Romig (2006) conjecture that the seasonal differences in food security may be related to the reduction
in school meals that were not offset by households’ participation in SFSP. A parallel analysis conducted for this study found evidence that the prevalence of very low food security among children in the SEBTC demonstration sites was higher in the summer than during the school year (9.9%) compared with the spring (8.6%), (p < 0.001) (Collins et al., 2012).
0%
10%
20%
30%
40%
50%
2010 2011 2012 2013
Pe
rce
nt VLFS-C
FI-C
FI-H

Chapter 1 Page 4
summer months, when they are not attending school (FNS, 2015; Food Research and Action Center, 2015b). Many of these programs not only provide food assistance for children but also provide summer programs and activities that foster physical activity and social interaction—important factors in child development.
However, logistical and practical considerations still present barriers to SFSP serving more children who receive NSLP or SBP during the school year. These considerations include lack of transportation to sites, lack of publicity about the program, limited days and hours of site operation, lack of program activities, and parents’ concerns about neighborhood safety (Gordon and Briefel, 2003). Also, most SFSP sites do not operate for the entire school summer recess (i.e., they operate for fewer than eight weeks), leaving low-income children without access to the program for several weeks before the next year’s school session begins.
1.3 The SEBTC Demonstration
In response to concern about summer food insecurity among low-income children, Congress provided $85 million to USDA in 2010 to improve access to food for low-income children in the summer months, when school is not in regular session (P.L. 111-80). FNS planned and implemented the SEBTC demonstration to deliver benefits electronically during the summer to households with eligible children.
In addition to testing the impact of SEBTC, FNS also funded evaluations of other demonstrations designed to strengthen SFSP. These included (1) home delivery of summer meals to children in rural areas, (2) providing food backpacks to children to cover days when SFSP sites are not operating, (3) providing grants to SFSP providers to enhance activities at sites and (4) increasing financial incentives to encourage operation for more than eight weeks.7
1.3.1 Household Eligibility and SEBTC Benefits
The SEBTC benefit was provided to households with children who were, in the prior school year, in pre-kindergarten through 12th grade and certified for free or reduced-price (FRP) school meals in the school food authorities (SFAs) that participated in the demonstration.8 All households with at least one child certified for FRP in a participating SFA and who gave consent were included in the demonstration.
In the summers of 2011 and 2012, for households that were randomly selected, a value of $60 per eligible child per month was provided on an EBT card when schools were not in session (prorated for partial summer months).9 In 2013, FNS added a third demonstration year and
7 More information on these evaluations and projects can be found on the FNS website at
http://www.fns.usda.gov/ops/summer-food-children-demonstrations. 8 SFAs are responsible for providing school meals and can consist of one or more schools or districts.
9 The value of SEBTC in WIC-model sites approximated $60 as actual prices for the items in the specific SEBTC food
package varied by site.

Chapter 1 Page 5
consenting households were randomly selected to receive either the $60 monthly benefit per eligible child or a $30 monthly benefit per child. These two benefit levels—$60 and $30—were also offered in the summer of 2014 to households in participating sites that had received benefits in the summer of 2013.
1.3.2 Overview of Program Models
FNS gave SEBTC grants to 10 States and Indian Tribal Organizations (ITOs). These grantees were given the choice to implement the demonstration either through their EBT systems for the Supplemental Nutrition Assistance Program (SNAP) or through their EBT systems for the Special Supplemental Nutrition Program for Women, Infants, and Children (WIC), but not both. Five grantees selected the SNAP model and the other five the WIC model.
Benefits for SEBTC followed the general program rules of either the SNAP or WIC, depending upon the model selected by the grantee. Consequently, in the sites using the SNAP EBT systems to deliver SEBTC, participants could redeem benefits for SNAP-eligible foods at any SNAP-authorized retailer in the nation.10
In contrast, as in the main WIC program, in the sites using the WIC EBT system to deliver SEBTC, participants could redeem benefits only for a limited set of foods and only at WIC-authorized retailers.11 The SEBTC WIC package was specified by FNS based on existing WIC food packages for preschool children, but adjusted to accommodate the nutritional needs of the older (i.e., school age) children participating in SEBTC. For both the $60 and $30 packages, grantees implementing the WIC approach also worked with FNS to customize the package to meet the tastes of the local population and so that the foods and amounts in the package would fit within the expected cost considering local food costs and availability of items in the SEBTC WIC package (e.g., some sites substituted whole grain tortillas for whole wheat bread). (See Appendix 1 for the specific quantities and costs of foods in the $60 and $30 SEBTC WIC packages.)
1.3.3 SEBTC Grantees
Exhibit 1.3 summarizes key features of the SEBTC demonstration from 2011 to 2014. In 2011, FNS selected five grantees (Connecticut, Michigan, Missouri, Oregon, and Texas) and asked each of them to implement an SEBTC demonstration in a single site. The objective of the 2011 study year was to ensure that implementation of SEBTC was feasible, i.e., grantees could
10
SNAP can be used to purchase any food for home consumption but cannot be used for alcohol, tobacco, hot foods, or foods intended to be eaten in the store. 11
Many fewer retailers participate in the standard WIC program than in the SNAP program (less than 50,000 versus more than 250,000; USDA WIC, 2012; FNS SNAP, 2013)
SEBTC-WIC Food Package
$60 package: Reduced-fat milk, 100 percent juice, cheese, cereal, eggs, whole wheat bread, beans, peanut butter, canned fish, $16 voucher for fresh fruits and vegetables
$30 package: Reduced-fat milk, cereal, eggs, whole wheat bread, beans, peanut butter, $8 voucher for fresh fruits and vegetables

Chapter 1 Page 6
successfully implement SEBTC by using existing EBT systems to deliver benefits to households with eligible school-age children over the summer months. In 2011, benefits were successfully issued to a total of 12,500 children (2,500 per site) in households that were randomly selected among those that gave consent to be part of the demonstration.
In 2012, FNS scaled up the demonstration and SEBTC was implemented by 10 grantees in 14 sites. All of the first set of grantees continued to implement SEBTC in the original sites, and all but one of these grantees (Texas) also implemented SEBTC in a second site. In addition, there were five new grantees (Cherokee Nation, Chickasaw Nation, Delaware, Nevada, and Washington) which each implemented SEBTC in one site. Overall, in summer 2012, grantees provided benefits to 67,000 children (approximately 4,800 per site), again in households that were randomly selected.
In late 2012, FNS selected four of the 2012 grantees (Chickasaw Nation, Delaware, Michigan, and Oregon) to participate in the 2013 evaluation with new cohorts of eligible households. Together, these four grantees implemented the 2013 SEBTC evaluation in six sites. In these sites, each household that gave consent was randomly selected to receive either $60 or $30 in benefits per summer month for each eligible school-age child. In addition, FNS instructed all 10 grantees to provide SEBTC benefits in 2013 to all of the households that received them in 2012 and that still included eligible children.12
In 2014, FNS funded a smaller, scaled-back demonstration. Three grantees (Cherokee Nation, Michigan, and Oregon) implemented SEBTC, each in one site. In those three sites, households who had received SEBTC in previous years and were still eligible received the same level of benefits in summer 2014 that they had received in summer 2013.13
12
In addition to the evaluation subsample, FNS instructed grantees to provide benefits to all households in the 2012 sites in which children remained eligible for SEBTC. These households are only included in the analysis of SEBTC usage in Chapter 3. As was the case in the other sites, households that received the SEBTC benefit in either 2011 or 2012 (or both years) were excluded from this impact analysis. Households assigned to the control group in either year and consented could be included in the impact evaluation. Households in the 2012 sites that received benefits in 2012 and 2013 are included in the analysis of SEBTC usage in Chapter 3 as the “2013 non-evaluation” cohort. 13
As in 2013, these households were only included in the EBT analysis and were not part of the impact evaluation.

Chapter 1 Page 7
Exhibit 1.3 Overview of the SEBTC Demonstration by Year
Study Design Characteristic
Number of grantees and sites in the evaluation SEBTC model
Number of children and households issued SEBTC benefits
Number of households in the evaluation subsample Types of Analysis
Year 1: $60 vs. $0 (2011)
5 grantees (5 sites) Connecticut, Michigan, Missouri, Oregon, and Texas
3 SNAP model 2 WIC model
Approximately 12,500 children in about 7,000 households
Approximately 9,700 households
Implementation SEBTC usage Impact Cost
Year 2: $60 vs. $0 (2012)
10 grantees (14 sites) Cherokee Nation, Chickasaw Nation, Connecticut, Delaware, Michigan, Missouri, Nevada, Oregon, Texas and Washington
8 SNAP model 6 WIC model
Approximately 67,000 children in about 37,000 households
Approximately 42,000 households
Implementation SEBTC usage Impact Cost
Year 3: $60 vs. $30 (2013)
4 grantees (6 sites) Chickasaw Nation, Delaware State, Michigan, and Oregon
2 SNAP model 4 WIC model
Approximately 100,000 children in about 51,000 households
a
Approximately 23,000 households
SEBTC usage Impact
Year 4: $60 or $30 (2014)
3 grantees (3 sites) Cherokee Nation, Oregon, and Michigan
1 SNAP model 2 WIC model
Approximately 20,000 children in 10,300 households
Approximately 10,300 households
Implementation SEBTC usage
Source: Collins et al., 2012, Collins et al., 2013, and Collins et al., 2014 and unpublished information for 2014. a
In 2013, grantees also provided benefits to all households in all of the sites who received SEBTC benefits in 2012 and still remained eligible. These households did not participate in the SEBTC evaluation, which are included in the total.

Chapter 1 Page 8
1.4 Evaluation Design
In authorizing the Summer Food for Children Demonstrations, Congress directed USDA to conduct a rigorous independent evaluation. The evaluation design for the SEBTC demonstration included three components: an impact study, an implementation study, and a cost study. As described below, not all years of the evaluation included all of the evaluation components. Below, we describe the evaluation objectives, the research questions, the overall study design, and data sources used for this report. The chapter ends with a list of previous publications.
1.4.1 SEBTC Evaluation Objectives
The SEBTC evaluation initially had five objectives, with a sixth added in 2013. Exhibit 1.4 shows the research objectives and the research questions guiding the evaluation. This report is intended to provide a high-level summary of key findings; therefore findings from some research questions found in previous reports are not included in this Summary Report (see Exhibit 1.7 for the list of the evaluation’s prior publications).
Exhibit 1.4 SEBTC Evaluation Objectives and Research
Research Ojectives and Related Research Questions
Objectives 1 and 2: To assess the feasibility of implementing SNAP and WIC models of SEBTC benefit delivery; and To examine the implementation of SEBTC, including approaches used, and the challenges and lessons learned during the demonstrations
Related Research Questions What was the process of SEBTC program implementation? What is the feasibility of the SEBTC SNAP and WIC models?
Objective 3: To determine and document the total and component costs of implementing and operating the demonstrations; and to determine the overall costs and facilitate comparisons of different operational models
Related Research Questionsa
What were the total costs of SEBTC, including both administrative and benefit costs? What percentage of costs were administrative, overall, by demonstration approach (WIC vs. SNAP), and by site?
What were the total administrative costs of SEBTC, overall, by demonstration approach, and by site? How were costs distributed across the pre-implementation period (before benefits were available) and the summer benefit period and after?
What proportions of administrative costs were incurred by State agencies (grantees and State partners), SFAs, and community partners? What costs were incurred by contractors, including EBT processors?
What types of administrative costs were funded through the SEBTC grants and what types involved in-kind or matching resources from States, non-profit partners, or other parties?
What was the average and range of costs per school-aged child and per household, overall, by demonstration approach, and by site? How did average costs per child and household vary by approach, by active versus passive consent procedures, and by site?
How did administrative costs in the full implementation year compare with costs in the POC year, both for the original POC sites and overall?

Chapter 1 Page 9
Research Ojectives and Related Research Questions
Objective 4: To describe receipt and use of the SEBTC benefits
Related Research Questions What were the rates of SEBTC participation, redemption and benefit exhaustion? How did they differ by
SEBTC model used and by other site characteristics? How did they differ by household characteristics?
Objective 5: To describe households that took part in the demonstration and examine the impact of a $60 per child monthly SEBTC benefit on children and their families’ food security (especially VLFS-C), food expenditures, and children’s nutrition
Related Research Questions: What are the characteristics of households that consented to be part of the SEBTC demonstrations? What is the impact of SEBTC on very low food security among children (VLFS-C)? How does this vary by
demonstration model, SNAP participation, poverty status, number of children in the household, presence of an adolescent in the household, and race/ethnicity?
How does the SEBTC affect the change in the level of food security between the school year and summer? What is the impact of SEBTC on the nutritional status of children? Does this vary by demonstration model,
SNAP participation, and household poverty status? How did participation in SEBTC affect household food expenditures? How did participation in SEBTC affect household and children’s participation in other nutrition assistance
programs, including SNAP, WIC, and SFSP? How did participation in SEBTC affect where children ate meals during the summer?
Objective 6: To determine the differential impact of a $60 per child monthly SEBTC benefit amount and a $30 monthly benefit amount on the study’s main outcomes (i.e., food security, food expenditures, and children’s nutrition
Related Research Questions:b
What is the differential impact of a $60 SEBTC benefit compared to a $30 benefit on very low food security among children (VLFS-C) and other food security outcomes? How does this differential impact vary by demonstration model, SNAP participation, poverty status, baseline food security, number of children in the household, presence of an adolescent in the household, and race/ethnicity?
Using a non-experimental approach, what is the impact of a $30 SEBTC benefit compared to no benefit on VLFS-C and on food insecurity among children (FI-C)? Is it half the impact of a $60 SEBTC benefit?
What is the differential impact of a $60 SEBTC benefit compared to a $30 benefit on total household food expenditures?
What is the differential impact of a $60 SEBTC benefit compared to a $30 benefit on the nutritional status of children? How does the differential impact vary by demonstration model and household poverty status?
Using a non-experimental approach, what is the impact of a $30 SEBTC benefit compared to no benefit on the nutritional status of children?
What is the differential impact of a $60 SEBTC benefit compared to a $30 benefit on the participation of households and children in other nutrition assistance programs, including SNAP, WIC, and SFSP?
aThe current report provides summary findings on average administrative costs per child and per household overall and by
SEBTC model (i.e., SNAP or WIC). Additional detail is reported in Collins et al., 2012 and Collins et al., 2013. bThe current report provides findings on the impact $60 versus $30 benefit on food security and on children’s nutrition.
Additional finding can be found in Collins et al., 2014.
Objectives 5 and 6 relate to the study’s principle purpose: to determine whether SEBTC alleviates children’s food insecurity and improves their nutrition using rigorous research methods.
1.4.2 SEBTC Conceptual Model
Children’s food security and nutrition status are outcomes associated with a complex set of inter-relationships among household resources to obtain adequate and safe foods for all household members, and the policies, nutrition assistance programs, and institutions (e.g.,

Chapter 1 Page 10
schools, child care facilities) in the community where the family lives and eats (Finney Rutten et al., 2010; Gundersen and Ziliak, 2014).
Exhibit 1.5 illustrates the conceptual model that guided the evaluation. The model describes how children’s food security and nutritional status are related to nutrition policies and programs, community institutions, and household characteristics, and how the impact of the SEBTC may be determined by these factors.14 In particular, the theory of action of SEBTC is as follows: SEBTC provides a benefit to eligible households, which first affects household behaviors. Households may use the benefit to alter one or more of the following: their food budget, their grocery shopping practices, and their eating practices at home or away from home. These household changes may affect the amounts and types of foods purchased by the household and therefore available to children living in the household. Children also consume meals at school or summer sites and other locations outside the home. Ultimately, the availability of food affects children’s food security and nutritional status. The goal of the SEBTC is to provide nutrition assistance so that low-income households can spend more on food, reduce food insecurity among children and improve diet quality and nutritional status.
Exhibit 1.5 Logic Model for the SEBTC Evaluation
14
See Yaktine and Caswell (2013) for a similar, but not identical, conceptual model.

Chapter 1 Page 11
1.4.3 Previous Literature on Impacts of Benefits Similar to SEBTC on Household Food Expenditures and Food Security
Evidence from existing literature regarding the impact of nutrition assistance on food security and other outcomes is limited. Comparisons of outcomes with and without nutrition assistance reveal the causal effect of assistance only when the analysis succeeds in holding all other factors equal. Of particular concern is the possibility that some households participate in food assistance programs and other eligible households do not for reasons that in and of themselves lead to different food security outcomes. For example, it may be that households with better resource management skills do well at both applying successfully for nutrition assistance and stretching their budgets to avoid missed meals, while those with weaker management skills do neither. If so, the former households will be more food secure than the latter even if the nutrition assistance itself conveys no impact.
Faced with this evaluation challenge, the existing literature has used a range of creative approaches to attempt to estimate the causal impact of food assistance. Some studies compare outcomes immediately before and after coming onto a food assistance program (Nord and Golla, 2009, for SNAP; Mabli and Worthington, 2014, also for SNAP; Herman et al, 2004 for WIC; Gundersen, Kreeider, and Pepper, 2012, for National School Lunch Program). Other studies compare outcomes across households in states and years with more or less generous SNAP programs exploit small variation in state-specific SNAP eligibility rules (Ratcliffe, McKernan and Zhang, 2011) or SNAP error procedures (Mykzeri and Mills, 2010). Finally, some of these studies compare outcomes before, during, and after the national increase in the SNAP benefit during the late-2000s (Nord and Prelll, 2011; Nord, 2013).
In general, these quasi-experimental studies find that nutrition assistance improves food security. However, the estimates are uniformly imprecise, mostly due to relatively small changes in amounts of nutrition assistance received and/or the relatively small samples used in the evaluations. Furthermore, as acknowledged by the researchers, the extent to which the comparisons succeed in addressing the inherent confounders is unknown.
1.4.4 Research Design
The current evaluation used a random assignment design to provide credible and rigorous estimates of the impact of the demonstrations. As emphasized in the previous section emphasized, the core challenge in estimating causal impact is to hold all else equal. Doing so is difficult in an ongoing nutrition assistance program in which there is a statutory right to the benefits. Since SEBTC was a demonstration, there was no such statutory right, which allowed the SEBTC evaluation to randomly assign households to alternative treatment conditions ($60 monthly per child or no benefit in 2011 and 2012; $60 monthly per child or $30 monthly per child in 2013). When executed correctly, random assignment assures that all else is held equal; those assigned to differing treatment conditions vary only by the functional equivalent of a coin toss. Hence, any difference in subsequent outcomes, if more than chance, can be attributed to the causal effect of the benefit; the households do not systematically differ in their program

Chapter 1 Page 12
eligibility or personal characteristics in ways that might themselves influence subsequent outcomes.
To accomplish this design, the evaluation team randomly assigned households in participating sites in 2011, 2012, and 2013.15 Exhibit 1.6 depicts the flow of activities to implement random assignment in 2011 through 2013. First, FNS established eligibility rules and policy, and then participating SFAs identified eligible children, grouped them into households, and obtained consent to take part in the demonstration and evaluation. Households that had one or more children certified for FRP meals and consented were randomly assigned either to a benefit group that received the SEBTC benefit or to a non-benefit group that did not in 2011 and 2012, or to one of the two benefit groups with different levels of benefits in 2013. In each demonstration site, grantees notified families selected to receive benefits and began the process of loading benefits onto and distributing EBT cards.
After households were randomly assigned, the evaluation team selected a random subsample of households for the evaluation’s household surveys in sites in which more households consented than were needed for the surveys. The evaluation team surveyed these selected households before the end of the school year and again during the summer. The surveys gathered data from eligible households and children on household food security and food expenditures, children’s food consumption and eating behaviors as measures of diet quality and nutrition status, and other outcome measures.
Rigorous estimates of the impacts of SEBTC were made by comparing the values of outcomes among the two treatment groups (in 2011 and 2012—$60 versus $0 and in 2013 $60 versus $30). Randomization guarantees that the comparisons are unbiased estimates of the impact of the program in the sites where it was implemented. As is common with this type of research design, SEBTC involved random assignment within purposively selected sites. Findings cannot be extrapolated to the nation as a whole since the selected sites are not necessarily representative of the country. However, because the program was implemented in a broad set of communities, it is reasonable to conclude that estimates from participating sites will provide insights about likely impacts if there is a broader program roll-out.
15
Grantees and total sample sizes are found in Exhibit 1.1. Participating sites are in Exhibit 2.2.

Chapter 1 Page 13
Exhibit 1.6 Flow of Activities in 2012 of FNS, Grantees, and Evaluation Team, Post Grant 2011 and 2012 Award
SEBTC = Summer Electronic Benefit Transfer (EBT) for Children aIn 2013, there was no non-benefit group but instead households were randomly assigned to one of two benefit groups with a
$30 or $60 per child monthly benefit amount.
bNot all grantees notified the non-benefit group.
To supplement the impact analysis, the evaluation includes a detailed implementation study in 2011, 2012, and 2014. Successful implementation of the demonstrations required the involvement and cooperation of a number of State and local agencies and contractors in each demonstration site. The implementation study assessed the operational feasibility of the demonstration and identified the challenges encountered. The evaluation team collected a variety of data from organizations involved in the demonstration. These include information

Chapter 1 Page 14
gathered during the team’s technical assistance to grantees to implement the demonstration and the evaluation design, stakeholder interviews during in-depth site visits, telephone interviews toward the end of implementation, and administrative reports and documents. The evaluation also includes a detailed analysis of SEBTC transaction data. This analysis describes patterns of household receipt and use of the summer benefits. In each summer benefit period, EBT processors transmitted administrative records to the evaluation team on benefit acceptance, usage, and other information on the full sample of households assigned to the benefit group, including those not participating in the surveys.
Finally, a cost analysis conducted in 2011 and 2012 provides information on the total and component costs of implementing and operating the demonstration. This analysis used quarterly and annual administrative cost reports to identify expenditures of grant funds by the grantee and its partners for personnel and other resources used to implement and operate the demonstrations. Each grantee provided a quarterly financial report showing SEBTC amounts obligated and redeemed—for the reporting month and cumulatively for the year. To the extent feasible, information on non-grant costs of implementing the evaluation was collected in the implementation study and incorporated into the cost analysis.
1.4.4 Reports
Seven previous reports have been published on SEBTC. Exhibit 1.7 provides information about the seven reports, including the time periods and the topics covered.

Chapter 1 Page 15
Exhibit 1.7 Reports on Summer EBT for Children Evaluation
Publication Topics Covered
(Belotti et al., 2011) Summer Electronic Benefits Transfer for Children: Early Experiences Through June 2011 of the Proof-of-Concept Year
SEBTC implementation
(Briefel et al., 2011) Congressional Status Report: Summer Electronic Benefits Transfer for Children Demonstrations
SEBTC implementation First EBT issuance cycle (summer 2011) SEBTC household characteristics
(Collins et al., 2012) Summer Electronic Benefits Transfer for Children (SEBTC) Demonstration: Evaluation Findings for the Proof of Concept Year
SEBTC implementation Full summer 2011 EBT issuance SEBTC household characteristics Impacts SEBTC costs
(Briefel et al., 2012) Summer Electronic Benefits Transfer for Children (SEBTC) Demonstration: 2012 Congressional Status Report
SEBTC implementation First EBT issuance cycle (summer 2012) SEBTC household characteristics
(Collins et al., 2013) Summer Electronic Benefits Transfer for Children (SEBTC) Demonstration: Evaluation Findings for the Full Implementation Year
SEBTC implementation Full summer 2012 EBT issuance SEBTC household characteristics Impacts SEBTC costs
(Briefel et al., unpublished) Summer Electronic Benefits Transfer for Children (SEBTC) Demonstration: 2013 Congressional Status Report
SEBTC implementation First EBT issuance cycle (summer 2013) SEBTC household characteristics
(Collins et al., 2014) Summer Electronic Benefits Transfer for Children (SEBTC) Demonstration: Findings for the Third Implementation Year
Full summer EBT issuance SEBTC household characteristics Impacts
1.5 Outline of the Balance of the Report
The remaining content of the report is as follows. Chapter 2 describes the ways in which grantees implemented SEBTC and costs incurred. Chapter 3 uses EBT data to describe patterns of use of the SEBTC benefits, including households’ participation in the program, amounts of SEBTC redeemed and SEBTC benefit exhaustion. Chapter 4 describes SEBTC’s impact on very low food security among children (VLFS-C), this study’s principal outcome, as well as on other food security outcomes, children’s nutrition, food expenditures, and participation in nutrition assistance programs. Chapter 5 provides a summary and conclusions.


Chapter 2 Page 17
Chapter 2
Implementation of Summer EBT for
Children
This chapter addresses the evaluation’s first three objectives: (1) To assess the feasibility of implementing the SNAP and WIC models of SEBTC benefit delivery, (2) To examine the implementation of SEBTC, including approaches used, and the challenges and lessons learned during the demonstration, and (3) To determine and document the total and component costs of implementing and operating the demonstration.
FNS encouraged grantees to develop approaches to implementing the SEBTC demonstration to reflect different local and State circumstances. In addition to the choice of whether to implement SEBTC through either the WIC or SNAP EBT systems, FNS also gave grantees flexibility regarding choices of lead organizations and partners, which administrative processes to use, and where to implement SEBTC. Grantees’ decisions in these areas afforded the evaluation an opportunity to assess the implementation of SEBTC under a variety of conditions.
The implementation study concluded that despite some implementation difficulties, both anticipated and unanticipated, SEBTC can be implemented successfully in a wide variety of communities and by a range of configurations of lead organizations and partners.
This chapter begins by summarizing the characteristics of the 16 demonstration sites and follows with a general overview of how SEBTC was implemented. The chapter concludes with an overview of costs associated with implementing SEBTC. The chapter does not provide detail about the evaluation process.
2.1 Description of SEBTC Grantees and Sites
Across the four years of the SEBTC demonstrations, 10 grantees (eight States and two Indian Tribal Organizations/ITOs) received funding to implement SEBTC in a total of 16 sites. Eleven of the 16 sites were included in the evaluation in more than one of the evaluation’s four years (Exhibit 2.1).

Chapter 2 Page 18
Exhibit 2.1 SEBTC Grantees and Implementation Models and Sites by Year
Grantee/Site (Implementation Model)
Year of Participation in the Evaluation
2011 2012
2013a 2014
Cherokee Nation (WIC) X X
Chickasaw Nation (WIC) X X
Connecticut: Windham, Tolland, and New London Counties
b (SNAP)
X X
Connecticut: Hartford, Litchfield and New Haven Counties (SNAP)
X
Delawareb
(SNAP) X X
Michigan: Detroit (WIC) X X
Michigan: Grand Rapids/Kentwoodb (WIC) X X X
Michigan: Mid-Michigan (WIC) X X
Missouri: Kansas City (SNAP) X X
Missouri: St. Louis (SNAP) X
Nevada (WIC) X
Oregon: Linn, Jefferson, and Deschutes Counties
b (SNAP)
X X
Oregon: Marion County (SNAP) X
Oregon: Portland (SNAP) X X
Texas (WIC) X X
Washington (SNAP) X aAll households in all sites who received SEBTC benefits in 2011 or 2012 and remained eligible for SEBTC in the subsequent
summer received them in that year. These sites and households were excluded from the impact analysis conducted for this report although the EBT data were used for the summary report analysis. bSeveral sites expanded to new areas in subsequent years of participation in the evaluation. Connecticut and Oregon expanded
between 2011 and 2012, and Grand Rapids and Delaware expanded between 2012 and 2013.
2.1.1 Grantee and Organizational Structures
When awarding the SEBTC grants, FNS gave grantees the flexibility to choose the agency or agencies to lead the effort. Grantees also could define the roles of other State and local partners and identify the local demonstration areas. Eight of the 10 grantees chose as the lead for SEBTC the agency that administered SNAP or WIC. Michigan and Texas made different decisions. Michigan selected the State education agency, which administers NSLP and SFSP, to serve as its SEBTC lead. Texas determined that it would have co-leads for SEBTC—the WIC agency and the agency administering the NSLP and SFSP programs. (See Appendix 2 for a complete listing of grantee agencies and their formal State-level partners.)
For all grantees, planning and implementing the SEBTC program was a large undertaking, requiring the involvement of additional State and local partners. 16 Each grantee worked with its respective State education agency on the demonstration, but the level of effort of these partner agencies varied considerably. Some education agencies worked intensively with participating school food authorities (SFAs) while others simply advised the lead agency on
16
For examples of site-specific details about program implementation and evaluation implementation challenges, see Collins et al., 2013, Chapter 2.

Chapter 2 Page 19
program design and administration. For instance, in Washington and Connecticut, the State education agency was largely responsible for obtaining the consent of eligible households to participate in SEBTC. In contrast, the Oregon Department of Education served primarily in a consulting role, occasionally providing guidance on working with SFAs.
2.1.2 Demonstration Areas
As part of the SEBTC application process, grantees proposed to FNS a specific implementation site or sites for SEBTC. When selecting sites, grantees tended to choose areas with (1) a perceived high level of need based on their formal and informal assessment of percentages of children eligible for FRP meals, availability of SFSP, or both; (2) SFAs that appeared capable of helping to implement the demonstration; and (3) an eligible population of the appropriate size, given the number of children targeted to receive SEBTC benefits, which varied by evaluation year, as discussed in Chapter 1. (See Exhibit 2.2 for a map of the sites.)
The SEBTC sites varied widely in the number of eligible children, their geographic size, their population density, and the number of participating SFAs (Appendix 2). The 16 SEBTC sites included five urban areas, five predominantly rural areas, and six sites that were more of a mixt between rural, urban and/or suburban areas. (See Appendix 2 for additional site level details.) The size of the local population in the demonstration area in individual sites ranged from just under 50,000 in the Cherokee Nation to more than 800,000 in a mostly urban area in Texas.

Chapter 2 Page 20
Exhibit 2.2 SEBTC Demonstration Sites
Cherokee Nation
Chickasaw Nation

Chapter 2 Page 21
Sites also varied widely in the number of participating SFAs, from just one in three sites to more than 40 in one site.17 As SEBTC was intended for children receiving FRP meals, grantees generally focused their demonstrations on SFAs with relatively large proportions of children eligible for FRP meals. In the majority of SFAs included in the demonstration, over 40 percent of children were eligible for FRP meals.
Using the Common Core of Data (CCD) for the most recent school year available, 2011 (National Center for Education Statistics, 2014), the evaluation team compared participating SFA populations in SEBTC sites to national estimates. On two dimensions, a higher proportion of children in the SEBTC evaluation sites were disadvantaged than in the nation as a whole (i.e., comparing all children in the sites to all children in the nation, not just children in participating households). Nationally, 17 percent of children lived in families with incomes below the federal poverty line; in the SEBTC sites taken together, the corresponding figure was moderately higher, 21 percent. Nationally, 48 percent of children received free or reduced-price school lunch; the corresponding figure SEBTC sites taken together was 57 percent.
Compared to the nation as a whole, a higher percentage of school-age children in SEBTC sites were from minority (defined as black and Hispanic) groups (52 percent in SEBTC sites versus 47 percent nationally) and a higher percentage were black (22 percent in the SEBTC sites versus 16 percent nationally). Across all sites implementing SEBTC, the share of school children with Hispanic origins was similar to the national average (24 percent versus 23 percent). The SEBTC sites were more urban than the nation (48 percent versus 31 percent), and less suburban (34 percent versus 49 percent). 18 The degree to which participating sites were rural was similar to the national average (18 percent versus 20 percent).
2.1.3 Demonstration Models
As described in Chapter 1, grantees could administer SEBTC through their SNAP or WIC EBT systems. Five grantees offered benefits using SNAP EBT systems and the other five grantees elected to use WIC EBT systems to administer SEBTC benefits. In addition, grantees had the option of making benefits available through existing SNAP EBT cards or issuing separate SEBTC cards to households.19 For WIC, each household received one SEBTC food package per eligible school-aged child per summer month. In SNAP sites, households received a monthly benefit for
17
Four of the 11 sites that participated in the SEBTC evaluation for more than one year expanded in the number of SFAs included in a subsequent year to increase the number of eligible children. This expansion was to ensure that, even after filling the comparison group, there would be enough children to receive the number of SEBTC benefits planned for that year. 18
The CCD uses four major types of locales: city, suburban, town and rural and categorizes each school district accordingly. For the analysis in this report, the study combines suburban and town into a single category. To further categorize the SEBTC sites, which sometimes included SFAs in different categories, the evaluation weighted districts by the number of students in the district. This approach was also used to compute the national comparison estimates. 19
For a description of the difference in SEBTC benefit usage according to whether SEBTC benefits were issued on separate cards or on existing EBT cards see Collins et al., 2013.

Chapter 2 Page 22
each eligible child to be used for SNAP-eligible foods. (See Appendix 2 for specific grantee and site-level information.)
2.2 Providing SEBTC Benefits
To operate the demonstration, grantees or their partners needed to identify children eligible to participate, conduct outreach to those children’s parents and guardians, and obtain guardian consent to be included in the demonstration. In all but two sites (Delaware and Nevada) these first steps were completed by the SFA, which then sent lists of consenting households to the grantee, which then undertook the next steps in the implementation process. Each grantee notified households selected by the evaluation team to receive SEBTC benefits and issued and distributed SEBTC benefits on new or existing EBT cards. This section describes these processes.
2.2.1 Identifying Eligible Children and Households
The success of the SEBTC demonstration and its evaluation depended on the ability of grantees and their partners to develop accurate lists of all eligible children (i.e., all those certified for FRP meals) in the demonstration area, group them into households, and ensure that contact information for these households was up to date. Typically, using criteria stipulated by the provisions of the grant, the SFAs in each site used their data systems to identify children eligible for SEBTC, and the quality of school-level data varied greatly. 20 While most SFA data systems had numeric child identifiers (IDs), they often did not include household IDs. In these cases, staff had to use other data to group children into unique households (e.g., last name and street address). Generally, before sending out consent materials, SFAs were able to group children appropriately into unique households and could therefore distribute one letter per household, even when there were multiple eligible children in the household. However, each demonstration year, one or two sites were not able to do so and thus sent letters with every eligible child which sometimes resulted in multiple consent forms being returned for a single household.
2.2.2 Obtaining Household Consent
As described in Chapter 1, grantees were required to obtain consent from each household, both for taking part in the demonstration and for releasing contact information to the evaluator.21 Across all years, six grantees (representing 11 sites) chose an active consent process by which households returned a signed form that indicated they wanted to be take part in the demonstration and evaluation. In these sites, households that did not return the form were excluded from the SEBTC demonstration. Four grantees (representing five sites) chose a passive consent process by which households were automatically included in the
20
In some sites the grantee or partner agency developed the list of eligible children using statewide data systems. For more details see Collins et al., 2013. 21
All consent materials described the SEBTC demonstration and told guardians that if they agreed to take part, they might be randomly selected to receive SEBTC benefits and that they agreed to have their contact information released to the evaluator, whether or not they were selected to receive SEBTC benefits.

Chapter 2 Page 23
demonstration unless they returned a form saying that they did not want to be included.22 The active consent process is similar to applying for the SEBTC benefit, and passive consent is similar to receiving it automatically without applying for it. (See Appendix 2 for the names of specific grantees and sites that used each consent process.)
As would be expected, rates of consent were higher in passive consent sites, ranging from 90 to 97 percent, with few families actively opting out of the demonstration. Because the consent process did not provide the opportunity to verify household composition and contact information, grantees using passive consent sometimes faced challenges when it came to accurately setting up SEBTC accounts and sending out SEBTC cards to current mailing addresses.
By contrast, the active consent process ensured that families deliberately chose to receive the SEBTC benefit. In the process, guardians updated contact information and verified their household composition, making data more accurate. However, to be included in the demonstration, households had to receive and understand the consent materials, and believe that the likelihood of receiving SEBTC was high enough that it was worth their time to fill out and return the materials. Consent rates in active consent sites were much lower—ranging from 23 to 57 percent. Grantees using the active consent process typically expected more households to seek out the benefits than actually did, and several sites using the active consent process were unable to recruit the targeted number of consenting households. Whether using an active or passive consent process, most grantees underestimated the time and labor the consent process took.
2.2.3 Randomly Assigning and Notifying Households of the SEBTC Benefit
After grantees obtained consent from eligible households, files were shared with the evaluation team, which then conducted random assignment.23 In 2011 and 2012, when households were assigned either the $60 SEBTC benefit or no benefit, the chance that a household would receive an SEBTC benefit ranged from 7 to 64 percent, depending upon the number of households in the area who consented to be placed in the random assignment lottery. In 2013, when households were assigned either the $60 or $30 benefit, households had an equal chance of receiving either benefit amount.24 After random assignment was complete, grantees notified households of their benefit status.25 Those selected to receive SEBTC benefits were provided
22
See Appendix 2 for information about the consent process selected by the sites. 23
The grantee and the evaluation team often found that files required several cycles of cleaning to identify and deal with duplicate entries, inaccurate addresses, and missing information. 24
The exception was one site (Delaware) where more households consented to be in the demonstration than the number for which benefits were available. In Delaware, 40% of households were randomly assigned to receive the $60 benefit, 40% were randomly assigned to receive the $30 benefit, and 20% were randomly assigned to receive no benefit and excluded from the evaluation. 25
In some years, in some sites, grantees did not inform households that were not selected to receive benefits. These households were potentially contacted as part of the control group for the evaluation subsample that was asked to respond to a survey and were potentially eligible for SEBTC in subsequent years.

Chapter 2 Page 24
information on next steps, such as if SEBTC cards would be mailed and when the benefit period would begin. Typically, grantees notified households by mail.26
2.2.4 Issuing Benefits
After the consent and notification processes were complete, grantees created SEBTC accounts for each household. These SEBTC accounts were used to manage cases, authorize SEBTC benefits, and send data on benefit issuance to EBT processors each month. Grantees managed accounts in one of two ways: with their existing SNAP or WIC eligibility and benefit system, or with an SEBTC-only stand-alone eligibility system. The two grantees that loaded benefits onto existing cards could only use their existing SNAP systems.
Four of the five grantees implementing the SNAP model (including the two that loaded benefits on existing SNAP cards) used their existing benefit administration systems. As a first step in setting up SEBTC accounts, these five grantees had to identify SEBTC households already in their systems so that a new household account was not mistakenly created. This often time-consuming process involved searching by a household or personal identifier if available, or more commonly using the parent and/or children’s name, date of birth, and address. Some grantees had to search for all or nearly all of the households manually. These grantees also had to develop systems to distinguish SEBTC accounts from SNAP accounts.
The other six grantees created separate but parallel systems for administering SEBTC benefits, side-stepping the effort needed by grantees to use existing systems and avoiding inadvertently setting up duplicative household accounts although resulting in additional development costs.
Grantees varied in the extent to which their process for card issuance and training required action by guardians. Six grantees sent selected households their EBT cards by mail without further follow-up; the other four grantees asked guardians for additional information or required them to attend a training session that described the SEBTC program and its operation to pick up their cards. Four of the five grantees using the WIC model offered training to households after they were selected to receive the benefit. In two of the sites, the training was mandatory; in the other two sites, the training was voluntary. Two of these sites distributed EBT cards at the training and one of them followed up by mailing EBT cards to households that did not attend the training. These trainings included an overview of SEBTC, information about the foods that could be purchased, and nutrition education. The trainings also provided grantees with an opportunity to update contact information and collect additional household information as needed.
26
In 2012 and 2013, all households that received a benefit in the previous year were automatically eligible to receive SEBTC, provided that they were still income eligible, residing in the demonstration area, and had at least one child attending a SEBTC participating school. In the three sites participating in 2014, these same criteria were used to determine benefit eligibility. Many of these returning households were excluded from being selected for the evaluation subsample. For information about which ones were excluded, see Collins et al., 2013, Appendix 4.A and Collins et al., 2014, Appendix 4A.

Chapter 2 Page 25
Over the course of the four years of implementation, half of the grantees were able to consistently provide all household with benefits on time. The other half of the sites had some difficulties doing so, but in most cases delays were only for several days or few a relatively small subset of households for three of these five grantees. However, for one grantee, approximately one-third of households did not receive cards prior to the beginning of the summer and for another, 15 percent did not.27 Delays were the result of the unexpected time it took to complete the eligibility determination and consent process, system errors in setting up the cases in the database, and poor data quality causing mail to be sent to incorrect addresses.
2.2.5 Providing Participant Support During the Benefit Period
After households received their EBT cards and were issued benefits, grantees provided support to families as families attempted to use their cards. All grantees used new or existing help-lines to respond to questions. In addition, half the grantees provided other supports to families, including SEBTC-specific websites, a Facebook page where the grantee posted program updates and healthy recipes, and Hunger Helpline numbers to assist households with finding SFSP sites.
All grantees received calls from parents and guardians with questions about SEBTC, although only four tracked the number and reason for calls. While most grantees estimated that they received hundreds of calls, the estimate was always a small percentage of the number of households issued benefits, and calls mostly occurred in the first year that a grantee implemented SEBTC. The most common inquiries related to personal identification numbers (PINs) and EBT card activation, family composition updates, allowable food items for purchase in WIC-model sites, and timing of card receipt. The number of calls grantees received dropped dramatically by the middle of the summer, with most of these later callers reporting a change in address or household composition.
2.2.6 Benefit Expiration
The treatment of unspent benefits varied between the SNAP and WIC systems and was consistent with the general rules in those two programs. In SNAP-model sites, unspent SEBTC benefits rolled over to the next month, expiring before the start of each school year (i.e., at the end of the benefit period). In contrast, in WIC-model sites, benefits expired at the end of each benefit month.
2.2.7 Implementation Successes and Challenges
As with the implementation of any demonstration rolling out a new benefit, requiring new partnerships, adaptation of existing administrative systems and technologies, and a short implementation time frame, grantees found some aspects of SEBTC challenging to implement. One common challenge related to addressing the quality of school-district data. For sites issuing SEBTC benefits using existing EBT systems, a related challenge was matching household information between school and SNAP administrative systems. Other challenges, especially in
27
For in-depth grantee-level detail, see Briefel et al., 2012, Appendix 2A.

Chapter 2 Page 26
sites where households had to give active consent, entailed getting enough guardians to read and return consent forms. Grantees found that all of these challenges were more intense because the grant award cycle meant they had only at best a few months to implement SEBTC each year.
Even with these challenges, in most sites, the vast majority of consenting households received SEBTC within days of when the school year ended. These facts, with additional information about SEBTC participation and redemption rates presented in Chapter 3, led the evaluation team to conclude that implementation of the SEBTC demonstration was successful and, therefore, broader implementation of SEBTC is feasible.
2.3 SEBTC Costs
Assessment of the feasibility of the SEBTC demonstrations requires consideration of the costs to taxpayers of administering the SEBTC demonstrations and of the benefits redeemed. To this end, the evaluation collected and analyzed data on administrative costs incurred by the federal government, State grantees, local SFAs, and nonprofit partners in 2011 and 2012. The evaluation did not collect costs in 2013 or 2014, which limits information available to assess how administrative costs would change in an established program. The discussion in this section therefore focuses on the first two years of SEBTC demonstrations. The analysis of EBT transaction data in those years provided data on the costs of benefits redeemed by participants (see Chapter 3). An overview of the cost data collection approach is included in Chapter 1.
2.3.1 Overview of SEBTC Demonstration Costs, 2011 and 2012
In 2011, SEBTC served approximately 12,500 children. The total cost of the 2011 demonstration was $3.55 million, including $1.91 million in administrative costs of grantees and subcontractors and $1.64 million in benefits (Exhibit 2.5).28 In 2012, when SEBTC expanded to approximately 67,000 children, the total cost was $13.23 million, including $3.98 million in administrative costs and $9.26 million in benefits.
Administrative costs included both one-time and recurring costs. A major one-time cost was the modifications to grantees’ EBT systems (and sometimes the benefit eligibility systems that fed into them) so that grantees could issue SEBTC benefits on time and in correct amounts with appropriate tracking (see Section 2.2.4 above).29 Most systems modifications were made, and one-time costs were incurred, in the first year of implementation. Other costs that most grantees incurred only in their first year included developing websites or printed materials about the program, and setting up helplines maintained by EBT contractors or State agencies.
28
The cost includes what the grantees incurred with regard to participating in the evaluation but not the costs of the evaluator. 29
See Collins et al., 2013 for further additional detail about necessary systems modifications.

Chapter 2 Page 27
Recurring administrative costs included the consent and enrollment process before the start of each summer (i.e., obtaining lists of eligible children, grouping them into households, and obtaining consent). During the summer, grantees had costs for EBT processing and for helplines for responding to participant questions or problems. Another recurring cost was outreach to households when their cards were returned due to bad addresses or when they did not use their cards. Benefit costs recurred in each month benefits were redeemed.
The share of total costs represented by administrative costs fell from 54 percent in 2011 to 30 percent in 2012 (Exhibit 2.3). By 2012, 5 of the 10 grantees had already spent much of what they needed to spend on one-time costs, particularly for the EBT system modifications. In addition, as discussed in Chapter 1, in some of the five original sites, the 2012 demonstrations served many more households than in the previous year. The five new grantees and the new sites operated by existing grantees incurred one-time costs in 2012, but, because the total number of households issued benefits was much larger in that year, these grantees were able to spread the costs over larger numbers of households than those served in 2011. In contrast, benefit costs rose in proportion to the increase in participants from 2011 to 2012, and therefore became a much greater percentage of the total.
Exhibit 2.3 Total SEBTC Administrative and Benefit Costs, 2011 and 2012
Administrative
Costs ($) Costs of Benefits
Redeemed ($) Total Costs ($) Administrative % of
Total
2011 $1,911,817 $1,634,656 $3,546,473 54%
2012 $3,975,724 $9,256,484 $13,232,208 30% Sources: Administrative cost data from grantees and partners, 2011 and 2012. EBT issuance and redemption data provided by grantees.
An administrative cost share of 30 percent is higher than in most ongoing nutrition assistance programs (Isaacs, 2008), but such programs are well-established and national in scale. In addition, the 2012 costs include one-time start-up costs for the new grantees. If SEBTC were an ongoing program, recurring administrative costs for outreach or answering questions might decline over time as SEBTC became better known. However, for grantees who implemented SEBTC in 2011, there was no evidence of a reduced effort in the consent process in 2012.
2.3.2 Average Administrative Cost per Child and per Household
In considering the potential costs of implementing SEBTC in other sites, the average costs per child and per household issued benefits are useful measures. The former is of interest because children are the target population, while the latter is relevant because SEBTC benefits are distributed at the household level, and impacts are measured primarily at the household level. In 2012, the average administrative cost of SEBTC was $60 per child or $112 per household (based on counts of children and households issued benefits, whether the benefits were

Chapter 2 Page 28
redeemed or not). The total cost (including both benefit and administrative costs) was, on average, $201 per child or $376 per household (See Exhibits 2.4 and 2.5).30
As a group, the sites using the WIC model had higher administrative costs per child and per household (Exhibit 2.4 and Exhibit 2.5). Administrative costs per child were about 7 percent higher in WIC-model sites than in SNAP-model sites. However, benefit costs per child were 22 percent lower in WIC-model sites than in SNAP-model sites, largely because of differences in benefit redemption, as is discussed in detail in Chapter 3. As a result, administrative costs were 34 percent of total costs in WIC-model sites, but only 27 percent in SNAP-model sites. While this difference might be interpreted as indicating that the SNAP model is more efficient, many other factors may be at work, including differences between general administrative approaches of grantees using the two models that were unrelated to the models chosen. Total costs per child issued benefits were higher in SNAP-model sites than in WIC-model sites ($214 versus $184). The pattern for the costs per household was similar.
Exhibit 2.4 Average Summer Cost Per Child Issued Benefits, 2012: All Sites, WIC Sites and SNAP Sites
Sources: Administrative cost data from grantees and partners, 2012. EBT issuance and redemption data provided by grantees.
30
The benefit costs per child and per household reported here for 2012 were computed by dividing the total benefits redeemed by the numbers of children and households issued benefits. Chapter 3 reports the amounts redeemed by the average household, per household and per child, for all cohorts combined.
60 62 58
141 122 156
0
50
100
150
200
250
All Children WIC SNAP
$ c
ost
pe
r ch
ild
Administrative cost per child Benefit cost per child
201
184
214

Chapter 2 Page 29
Exhibit 2.5 Average Summer Cost Per Household Issued Benefits in 2012: All Sites, WIC and SNAP Sites, 2012
Sources: Administrative cost data from grantees and partners, 2012. EBT issuance and redemption data provided by grantees.
While it is not possible to extrapolate what the costs would be if SEBTC were an ongoing program from two years of cost data, it would be expected that administrative costs would decline over time. Recurring annual costs of identifying and enrolling eligible children and households could go down as SEBTC became better known and as enrollment routinized (and potentially streamlined).
112 115 110
264 220
297
0
50
100
150
200
250
300
350
400
450
All Households WIC SNAP
$ p
er
ho
use
ho
ld
Administrative cost per household Benefit cost per household
376 335
407


Chapter 3 Page 31
Chapter 3
SEBTC Benefit Use
This chapter addresses the evaluation’s fourth objective, which is to describe the receipt and use of SEBTC benefits. The analysis uses five cohorts of SEBTC transaction data representing the households in the 2011, 2012, 2013, and 2014 evaluations, as well as households that were issued benefits in 2013 but not included in the impact evaluation for that year (referred to as 2013 non-evaluation households).31 The team obtained the transaction data from each State’s EBT system, which authorizes and tracks use of SEBTC benefits by participating households. More information about data and methods can be found in Appendix 3.
The chapter begins with a brief description of the key measures of benefit use for the $60 benefit group: household participation in SEBTC (i.e., percentage of households that redeemed any benefits during the summer), the benefit redemption rate (i.e., percentage of benefits issued that were redeemed), and the benefit exhaustion rate (i.e., percentage of households that redeemed all benefits issued), followed by similar summary information for the $30 benefit group. After presenting the overall results, the chapter examines differences, among the $60 group, in benefit use between the SNAP and WIC models, redemption of foods in the WIC model, and the household characteristics that were related to benefit use (the latter based on analyses combining the EBT and household survey data). Appendix 3 presents evidence on the variation in benefit use across the five cohorts and provides supporting details about the relationship of household characteristics to benefit use.32
Overall, the SEBTC evaluation found high rates in the level of SEBTC participation and percentage of benefits redeemed. It found substantially lower rates of SEBTC benefit exhaustion. The WIC model had substantially lower rates for all measures than did the SNAP model.
3.1 Households’ Use of SEBTC Benefits
This section describes aggregate patterns of SEBTC benefit use, first among households that received the $60 monthly per child benefit and then among households that received the $30 benefit. Households received the $60 benefit in all years of the implementation, whereas the
31
The 2013 non-evaluation households were those that were issued benefits as part of the 2012 evaluation group and consented to receive benefits again in 2013. The benefit use patterns among this cohort were analyzed for this report but were not included in the 2013 evaluation report, which focused on households that had not previously received benefits. This report also provides the first presentation of benefit use in the 2014 demonstrations. 32
Exhibits presenting analyses on the difference in benefit use by SEBTC model and WIC food redemptions among the $30 group are in Appendix 3.

Chapter 3 Page 32
$30 benefit was distributed only in 2013 and 2014. Therefore, the analysis of patterns of benefit use among $60 households pools benefit use outcomes for all five cohorts of SEBTC recipients, whereas the analysis of $30 benefit uses outcomes for two cohorts. 33
Across all five cohorts, a total of 89,376 households with 162,239 children were issued $60 per month per eligible child in SEBTC benefits, as shown in Exhibit 3.1. In addition, a total of 15,540 households received $30 per month per eligible child in SEBTC benefits in 2013 or 2014.34
3.1.1 Patterns of Benefit Use Among the $60 Group
Of all households issued the $60 monthly per child benefit, 89 percent participated (i.e., redeemed some or all of their benefits for the summer). Since benefits were issued and redeemed at the household level, this is the primary participation rate measure for SEBTC. Among households issued benefits, evidence suggests that some non-participating households did not receive their SEBTC cards or their PINs, while others had access to benefits but never used them. The participating households included 91 percent of children who were issued benefits. The fact that the percentage of children participating was slightly greater than the percentage of households participating indicates that households with more eligible children participated in SEBTC.
The overall participation rates and other summary measures mask considerable differences in benefit use between households in SNAP-model and WIC-model sites. Rates of participation, redemption, and benefit exhaustion were higher in the SNAP-model sites than the WIC-model sites. These differences are discussed in Section 3.2. In addition, the 2011 and 2012 evaluations showed that households participating in SNAP had higher SEBTC participation and redemption rates than non-SNAP households in SNAP-model sites.35
33
Comparisons of benefit use in sites with multiple years of data do not indicate any consistent pattern of change over time within sites. Therefore, this chapter focuses on the overall averages across all cohorts. 34
These figures count households and children once for each year they were issued benefits so are not unduplicated counts. 35
The reasons for these differences are discussed in Collins et al., 2013 and Collins et al., 2014. For instance, in 2012 the participation rate among SNAP households in these sites was 11 percentage points higher than non-SNAP households. Similarly, the redemption rate among SNAP households was 12 percentage points higher than non-SNAP households. Similar differences in participation and redemption rates were observed between SNAP and non-SNAP households in 2011.

Chapter 3 Page 33
The percentage of SEBTC benefits redeemed represents the extent to which households used the benefit issued to them. Across all cohorts of households issued SEBTC (including those who used no benefits), the average household redeemed 76 percent of benefits issued. Among participating households (i.e., those that redeemed any benefits), the average household redeemed 86 percent of benefits (Exhibit 3.1).
Exhibit 3.1 Summary of SEBTC Benefit Use Patterns, All Cohorts, $60 Benefit Amount (2011-2014)
Number issued benefits
Households 89,376 Children 162,239
Percent participating (i.e., redeeming benefits)
Households issued benefits 89.1% Children issued benefits 90.9%
Mean percentage of dollars redeemed
All households issued benefits 76.2%
Participating households (i.e., redeeming benefits at least once) 85.7%
Mean dollars redeemed
Per household issued benefits $247
Per child issued benefits $133
Percent of households exhausting benefits at least once 44.5% Source: SEBTC benefit use data analyses for the 2011, 2012 and 2013 evaluation (2013E) reports; 2013 EBT data from non-evaluation households (2013NE) and 2014 EBT data (n=89,376). 2013E and 2014 results exclude households receiving $30 per month per eligible child.
As described in Chapters 1 and 2, the randomly selected households received SEBTC for the time period that a child was out of school, getting the full benefit for each full summer month and a prorated amount for partial months. Therefore, the total value issued per eligible child for the summer depended on the length of the summer period, which could vary substantially. In 2012, for instance, the summer period ranged from 81 days to 102 days, depending on the school district. Across all cohorts, the average amount issued per eligible child among those receiving the $60 monthly per child benefit amount was $176 for the summer, and the average amount redeemed per child issued benefits was $133.36 For this group, the average amount redeemed per household issued benefits over the course of the summer was $247 (including those with no redemptions).
Another way to characterize benefit redemption patterns is by how often households exhaust all of their SEBTC benefits in a given month (i.e., they redeem the full benefit for the month) and thus receive the full “dose” of the program. From the perspective of program
36
The mean dollars redeemed per child and per household as reported here differ in two ways from the benefit costs per child and per household reported for 2012 in Exhibit 2.4 and 2.5. First, the figures reported in Exhibit 3.1 are means for all five cohorts of households issued SEBTC. Second, Exhibit 3.1 provides the means of the dollars redeemed per child and per household over all households. These figures differ by definition from the figures reported in Exhibit 2.4 and 2.5, which were computed by dividing the total benefits redeemed by the numbers of children and households issued benefits.

Chapter 3 Page 34
implementation, benefit exhaustion represents success: the household can and does use the full benefit. Across all cohorts, approximately half (45 percent) of households exhausted their SEBTC benefits in at least one month. A much smaller percent (28 percent) exhausted all SEBTC benefits for the entire summer.
3.1.2 Patterns of Benefit Use Among the $30 Benefit Group
Of all households and children issued the $30 monthly SEBTC benefit amount, 90 percent participated, similar to the participation rate among the $60 cohorts (Exhibit 3.2). On average across all cohorts receiving the $30 amount, households redeemed 72 percent of their benefits over the summer. Among participating households, the average redemption rate was 81 percent. These redemption rates are roughly four percentage points lower than those among households that received the $60 per child benefit.37
Exhibit 3.2 Summary of SEBTC Benefit Use Patterns, All Cohorts, $30 Benefit Amount (2013-2014)
Number issued benefits
Households 15,540 Children 29,642
Percent participating (i.e., redeeming benefits)
Households issued benefits 89.5% Children issued benefits 90.4%
Mean percentage of dollars redeemed
All households issued benefits 71.9%
Participating households (i.e., redeeming benefits at least once) 81.4%
Mean dollars redeemed
Per household issued benefits $124
Per child issued benefits $63
Percent of households exhausting benefits at least once 45.6% Source: SEBTC benefit use data analyses of 2013 and 2014 EBT data.
Across the cohorts receiving the $30 monthly benefit, the average amount issued per eligible child was $88 for the summer, and the average amount redeemed per child issued benefits was $63 (not shown). The benefit exhaustion rate was approximately 46 percent across all two $30 benefit cohorts, which was only one percentage point higher than households in the $60 benefit cohorts.
Exhibit 3.2 provides descriptive analysis of EBT data pooled for 2013 and 2014. To better understand the difference in usage patterns of the $30 benefit level compared to $60 level, it is useful to consider the results in 2013, when the evaluation randomized households to a $60 or
37
Taken together, the $30 benefit cohorts included a greater proportion of participants in the WIC model than the $60 benefit cohorts. As discussed below, the WIC model had lower redemption rates than the SNAP model. These factors likely explain the difference in redemption rates between the $30 and $60 cohorts, and the difference is probably not due to the benefit level.

Chapter 3 Page 35
a $30 benefit. Because households were randomized within sites, the 2013 analysis could adjust for site-level and personal characteristics. That analysis showed a 1 to 2 percentage point difference between the two groups in rates of SEBTC participation and redemption and a 7 percentage point difference in benefit exhaustion, with the $30 group exhausting more of their benefits than the $60 group (Collins et al., 2014).
3.2 Difference in Benefit Use by Program Model
Across all $60 benefit cohorts, 49 percent of the households were in sites using the SEBTC SNAP model; the rest were in sites using the SEBTC WIC model. Rates of SEBTC participation, redemption, and benefit exhaustion were lower in WIC-model sites than in SNAP-model sites (Exhibit 3.3), and therefore the rates in the WIC-model sites brought down the overall averages. This might indicate either that households found it more difficult to redeem WIC benefits (perhaps due to lack of participating food retailers or approved foods) or that they chose not to purchase some of the specified foods.38
Exhibit 3.3 SEBTC Participation, Redemption, and Benefit Exhaustion Rates for SNAP and WIC-Model Sites, All Cohorts, $60 Benefit Amount (2011-2014)
Households Issued
Benefits Children in Households
Issued Benefits Percent of Dollars
Redeemed
Exhausted Benefits in
One or More
Months
Site Type Number
Percent Participating (Redeeming
Benefits) Number
Percent Participating (Redeeming
Benefits) All
Households Participating Households
% Households
SNAP Sites 44,177 95.3% 80,844 96.1% 92.8% 97.6% 80.1%
WIC Sites 45,199 83.1% 81,395 85.7% 61.1% 73.2% 12.1%
All Sites 89,376 89.1% 162,239 90.9% 76.2% 85.7% 44.5% Source: SEBTC benefit use data analyses for 2011, 2012 and 2013 evaluation (2013E) reports; 2013 EBT data from non-evaluation households (2013NE) and 2014 EBT data. 2013E and 2014 results exclude households getting $30 per month per eligible child. Differences between SNAP-model and WIC-model households among the $30 cohorts are presented in Appendix Exhibit 3.K.
Specifically, households issued benefits in the WIC-model sites had a more than 12 percentage points lower average participation rate (83 percent) than those in the SNAP-model sites (95 percent). The gap in redemption rates (unconditional on participation) was even larger: the
38
For this study, benefit exhaustion in the WIC model was defined as purchasing enough food in every category that the balance remaining was less than the minimum quantity that could be purchased. For the fruit and vegetable benefit, households were not considered to have exhausted their benefit unless their fruit and vegetable balance was $0. It is possible that some households were constrained from exhausting their benefits for fruits and vegetables (as defined for this study) because they did not have cash to pay the difference between their remaining fruit and vegetable benefit and the least expensive fruit/vegetable item they were willing to purchase.

Chapter 3 Page 36
average household issued benefits in the WIC-model sites redeemed only 61 percent, while in the SNAP-model sites average redemption was 93 percent.
Several factors may have reduced SEBTC use in WIC-model sites. First, fewer stores are authorized to accept WIC than SNAP, so redeeming benefits may have required more travel. Second, redeeming benefits with the WIC model is more complicated because participants must choose from a narrower set of eligible foods. Participants also had to keep track of balances for each food category rather than a single balance in dollars for all eligible foods as was the case with SNAP model sites. Also, some households may not have wanted certain foods eligible for purchase with the WIC model. Finally, as described earlier, unused SEBTC benefits expired at the end of each month in WIC-model sites, while in SNAP-model sites, unused SEBTC benefits did not expire until the end of the summer.
In addition, the 2011 and 2012 evaluation reports include evidence that implementation factors in specific sites may have contributed to the overall lower average redemption rates for households in sites using the WIC model. In particular, sites where participants had to pick up EBT cards (rather than receive them by mail) had lower rates of household participation. Also, in some sites using the WIC model, the overall rate of redemption was affected by limited availability of whole-grain foods eligible for purchase with SEBTC.
In the SNAP-model sites, 80 percent of households issued benefits exhausted their benefits in at least one month, while only 12 percent did so in the WIC-model sites (Exhibit 3.3). This difference likely reflects some or all of the factors that may have influenced redemption rates, especially the fact that WIC only authorizes specific foods, while SNAP has few restrictions on eligible foods.
Differences in participation and benefit redemption between sites using the SNAP model and those using the WIC model remained even after controlling for known household characteristics, as discussed in Section 3.4. The same methods also confirmed that households in SNAP-model sites were much more likely to exhaust their benefits and did so much faster than households in WIC-model sites.
3.3 Redemption of Foods Under the SEBTC-WIC Model
For the WIC model, there is an additional question: To what extent were the food package components accepted among eligible households, as evidenced by redemptions of each category of foods making up the package?39 As discussed in Chapter 1, households were authorized to redeem specified quantities of WIC-approved foods in eight categories and up to a specified dollar value of qualifying fruits and vegetables. The percentage of benefits redeemed varied substantially by food category. For each food category, the redemption rate is
39
The redemption rates in Exhibit 3.3 were computed as the total benefits redeemed divided by the total benefits issued (by category and overall) and therefore differ slightly from the mean of the percentage redeemed by individual households.

Chapter 3 Page 37
an indication of the relative acceptance among households of the WIC-approved foods in the category (although redemption rates for some foods may have been affected by limited supply in local stores). For SEBTC WIC-model households that received the $60 per eligible child benefit package, juice, eggs, and cheese were the most popular food categories (with more than 75 percent of benefits redeemed overall), whereas canned fish, beans and peanut butter, and grain products were the least popular food categories (with less than 65 percent redeemed overall) (Exhibit 3.4). The redemption rates for milk, cereal, and fruits and vegetables were in the middle of the range, close to the average of 67 percent for all foods.
Exhibit 3.4 Redemption Rates for WIC Food Categories (ordered by average), All Cohorts, $60 Benefit Amounta (2011-2014 )
Food Category All Cohorts
Juice (64 oz. bottle or equivalent) 75.9%
Cheese 75.7%
Eggs 75.3%
Milk (skim, 1/2%, 1%, 2%) 72.3%
Fruits and vegetables 71.7%
Cereal 68.3%
Fish (canned tuna or salmon) 62.6%
Dry or canned beans & peanut butter 58.5%
Grain products (bread, tortillas, rice, & oatmeal) 56.8%
All Foods Combined 67.3% Source: SEBTC benefit use data analyses for 2011, 2012 and 2013 evaluation (2013E) reports; 2013 EBT data from non-evaluation households (2013NE) and 2014 EBT data (n=45,199). 2013E and 2014 results exclude households getting $30 per month per eligible child.
aThe redemption rates by food category for the $30 benefit cohorts are presented in Appendix 3.
3.4 Differences in Benefit Use by Household Type
Analyses of the 2012 EBT data explored how patterns of benefit use are related to the socioeconomic characteristics of eligible households. Specifically, the evaluation team combined the SEBTC benefit use data with baseline household survey data from the evaluation subsample that received SEBTC and used multivariate regression analysis to explore relationships of household characteristics to participation, redemption, and benefit exhaustion rates, controlling for site effects. (In that year, all treatment group households received the $60 monthly benefit. See Appendix 3 for details, including methods, the complete list of variables including those without significant relationships to benefit use, and regression estimates of the magnitude of the relationships discussed below.) The analysis helps identify the types of households that are likely to have higher or lower levels of benefit use than the average household. The analysis is not causal and differences in benefit use may reflect differences in need or access, but groups with lower benefit use may require more outreach or assistance to make the most use of SEBTC should the demonstration become an ongoing program.

Chapter 3 Page 38
Several factors were independently associated with higher rates of benefit use. Households with low food security before SEBTC was issued had higher participation, redemption, and benefit exhaustion rates than previously food secure households. Participation, redemption, and benefit exhaustion rates also were higher among households that received SNAP prior to when SEBTC was issued than in other households. In addition, households with more children had higher participation and benefit exhaustion rates. When households had more days in the summer to redeem their benefits, they had higher redemption and exhaustion rates. After controlling for food security, SNAP and WIC participation, and other known characteristics prior to when SEBTC was issued, households with higher incomes as a percentage of the poverty level redeemed more of their benefits.
Several household demographic characteristics were associated with differences in benefit use. The groups with lower benefit use that may have had more difficulty accessing SEBTC, less need, or a combination of these two underlying conditions. Participation and benefit exhaustion rates were lower for households with a single male caretaker compared to households with two adults. Households with a single male or female caretaker had lower redemption rates compared to households with two adults. Furthermore, Hispanic households had lower participation and benefit exhaustion rates relative to white non-Hispanic households. When the head of household was employed before getting SEBTC, participation and redemption rates were lower compared to households with an unemployed head. Benefit exhaustion was less frequent among households with children that received free or reduced-price breakfast during the school year. The relationship of race to benefit use was mixed: black households participated more often, but they exhausted benefits less often relative to white non-Hispanic households.
Based on the observed relationships of household characteristics to benefit use, it appears that rates of participation, redemption, and benefit exhaustion will vary across States and sites even if SEBTC is implemented in the same way in all locations. The analysis also suggests that there may be barriers to SEBTC use among households that tended to under-utilize benefits, and that agencies implementing SEBTC may want to consider how to address these barriers. Furthermore, both the descriptive results and additional multivariate analysis controlling for cross-site differences in household characteristics indicate that the choice of WIC versus SNAP model appears to influence benefit use.
Household Characteristics Linked To Higher Benefit Use:
Having low food security Receiving SNAP benefits Having more children Having longer to redeem them
Household Characteristics Linked To Lower Benefit Use:
Having a single head of household Having a Hispanic head of
household Having an employed head of
household Children receiving free or reduced-
price breakfast in school

Chapter 4 Page 39
Chapter 4
SEBTC Impacts
This chapter presents the study’s principal findings on the impacts of SEBTC. It addresses the evaluation’s Objectives 5 and 6: To describe households that took part in the demonstration and examine the impact of SEBTC benefits on children and their families’ food security, food expenditures, and children’s nutrition; and to compare the differential impact of a $60 monthly per eligible child SEBTC benefit versus a $30 per eligible child amount.
Most of the findings reported in this chapter rely on the random assignment design (described in Chapter 1 and in more detail in Appendix 4). The chapter begins with a brief discussion of the degree to which the design was implemented with fidelity and a general description of the analytic approach. It continues with a profile of the households that participated in SEBTC during the demonstration’s first three years (2011–2013) when household survey data were collected. Subsequent sections describe the demonstration’s impacts on food security, nutrition, food expenditure, and other outcomes.
The evaluation found that, compared to no benefit, the $60 per child monthly benefit significantly and substantially reduced VLFS-C and FI-C and improved key indicators of children’s nutrition. For VLFS-C, the evaluation did not find clear evidenced that a $60 benefit results in an improvement relative to a $30 benefit. In contrast, for FI-C, a $60 benefit is clearly better than a $30 benefit and the impact is approximately twice as large. In terms of children’s nutrition, relative to a $30 SEBTC monthly benefit, a $60 monthly benefit led to favorable changes in several of the measures of dietary quality, but the changes were smaller than those seen in comparing the $60 benefit to no benefit. The evaluation also found that SEBTC increased food expenditures. Details about these and other impacts are found in Sections 4.3 through 4.5.
4.1 Implementing Random Assignment, Data Collection and Analysis
Random assignment assures that those assigned to different treatment conditions—$60 versus no benefit in 2011 and 2012 or $60 versus $30 in 2013—are otherwise identical (except for chance differences that statistical tests take into account when examining results). Therefore, the difference in average outcomes between those assigned to different treatment gives an accurate—i.e., unbiased estimate of the causal impact when random assignment is properly implemented. Observation of field operations and comparisons of baseline characteristics

Chapter 4 Page 40
support the belief that the randomly-assigned groups used in the evaluation are equivalent.40 Thus, the study provides unbiased estimates of the impact of being assigned to different treatment conditions in the sites in which random assignment was implemented.
As described in Chapter 1, key outcome data were collected in summer household surveys. Overall response rates in summer 2012 were 73 percent; in 2013 the summer response rate was 88 percent. Response rates were similar across treatment condition (a four percentage point difference in 2012 and virtually no difference in 2013) (see Appendix 4, Exhibit 4A for details).41 In addition, all analyses used weights that adjusted for the sampling approach and for the differences in survey response rates associated with measured differences in household characteristics.42 Finally, crossover (i.e., households receiving benefits other than what was intended based on their randomization status) was minimal—well under 0.1%; hence, households were analyzed according to their random assignment status even when crossover occurred (i.e., an intention-to-treat analysis was conducted).
Appendix 4 provides additional detail on the study methodology, including the analytic methods used to estimate impacts and more in-depth information about the results reported in this chapter. The principal analysis relies on linear regression models that pool data from 2011, 2012, and 2013.43 Unless otherwise noted, findings reported in this chapter are based on this pooled analysis file. The regression models include covariates—additional right hand-side explanatory variables—to improve the statistical precision of the impact estimates, weights to adjust for survey non-response, and robust standard errors to adjust for heteroscedasticity. Unless otherwise noted, all impact estimates discussed in the text are significant at the 5 percent level or better.
Estimates of the impact of the $30 per eligible child benefit relative to no benefit require stronger assumptions than the conventional random assignment analysis because in no year did the demonstration randomly assign households between a $30 per child benefit and no benefit. The evaluation can use the random assignment estimates from 2011 to 2013 to construct plausible quasi-experimental estimates of the impact of a $30 per child benefit relative to no benefit. Specifically, the estimates of $30 versus no benefit subtract from the
40
See Appendix 4, Exhibits 4.E–4.H for baseline means of food security; household characteristics (e.g., household size, household composition, number of children; household income); respondent characteristics (i.e., race/ethnicity, education level); and participation in nutrition assistance programs (e.g., SNAP, WIC, NSLP, SBP) in each year stratified by treatment condition. For further discussions of the implementation of random assignment in each year and baseline equivalence testing see Collins et al., 2012 (Appendix 4A, Exhibits 4A.1 and 4A.2), Collins et al., 2013 (Appendix 4A, Exhibits 4A.2 and 4A.3); and Collins et al., 2014 (Appendix 4A). 41
In 2011, the summer response rate was 66 percent. 42
In 2011 and 2012, survey field operations used a two-phase sampling strategy (see Collins et al., 2012, Appendix 4B and Collins et al., 2013, Appendix 4B for details). The reported response rates adjust for that two-phase sampling strategy using American Association for Public Opinion Research (AAPOR) guidelines. 43
For binary outcomes a linear probability model is estimated.

Chapter 4 Page 41
regression-adjusted impact of a $60 benefit versus no benefit the regression-adjusted impact of a $60 benefit versus a $30 benefit.
4.2 Characteristics of Participating Households
A household was eligible to participate in SEBTC if (1) it had a child certified to receive free or reduced-price school meals and (2) at the time of certification, the household’s income was at or below 185 percent of the federal poverty level (FPL).45 It would therefore be expected that households receiving SEBTC would be relatively disadvantaged compared to the general population of households with school-age children. In fact, 71.2 percent of households in the evaluation had monthly incomes below FPL (Exhibit 4.1).46
In addition to receiving free or reduced-price school meals, individual households had a high rate of participation in other nutrition assistance programs and experienced more food insecurity than the average U.S. household with children.47 More information on these points is presented below.
44
Analytic samples include the full sample of summer respondents without missing outcome data (e.g., there are 48,431 households in the analytic sample used to estimate impacts on food security outcomes). However, not all summer survey respondents completed a spring survey; therefore household characteristics are reported for a smaller sample, as indicated for each exhibit. 45
The exhibit shows 3.8% of the sample as having income greater than 185% of FPL. There are at least three possible explanations for this anomaly. First, households can begin to receive free or reduced-price school lunch if their income drops below 185% of poverty at any time during the school year. It is possible that incomes increased between that date and the survey. Second, there may have been errors in handling the original NSLP application (e.g., inadvertent or deliberate understatement of income or an error in approving correctly stated income). Third, survey income data are known to have a moderate amount of response error. 46
In comparison, 18.4 percent of households with children reported being under the poverty level nationally in 2012 (Census Bureau, http://www.census.gov/hhes/www/poverty/data/historical/hstpov4.xls). 47
See Kreider et al. (2012) for a broader discussion of food security among children.
Exhibit 4.1 SEBTC Household Income as a Percent of the Federal Poverty Line at Baseline (i.e., Before the End of the School Year)
Source: SEBTC Spring Survey data from 2011, 2012, and 2013 (n= 41,377). Estimates are based on the full sample of summer respondents who had completed a spring survey.
44
71.2%
14.3%
10.8% 3.8%
≤100% of FPL 101-130% of FPL
131-185% of FPL >185% of FPL

Chapter 4 Page 42
Nearly three-quarters of households (73.9 percent) reported participating in at least one federal nutrition assistance program at baseline, before SEBTC benefits were offered (Exhibit 4.2.).48 Households most commonly reported receiving SNAP benefits (64.2 percent).
As was discussed in Chapter 1, the primary outcome for the SEBTC Demonstrations was very low food security among children (VLFS-C) as measured by USDA’s food security survey battery. To consider less severe food insecurity, analyses also examine food insecurity among children (FI-C). The same two measures for adults (VLFS-A and FI-A) are also examined, as are those for any member of the household (VLFS-HH and FI-HH). This results in a total of six food security impact findings.
The evaluation sample reported, prior to the issuance of SEBTC, more severe food insecurity than the comparable national population (Exhibit 4.3). The income eligibility cut-off for FRP meals –and hence for SEBTC—is 185 percent of the federal poverty level (FPL). The prevalence of VLFS-C in a nationally representative sample of households with children in this income range is 2.6 percent. In contrast, the prevalence of VLFS-C in SEBTC households was more than three times as high (8.0 percent) and the prevalence of FI-C was more than twice as high compared to the Coleman-Jensen et al. estimate (43.9 percent versus 16.2 percent). Finally, FI-H was also higher (58.3 percent versus 34.7 percent).
48
Because SEBTC potentially has an impact on households’ participation in federal nutrition programs, information from the spring surveys is used to describe nutrition program participation. By using the SNAP and WIC participation rates in the spring, when all households are certified for the FRP meals and no households are receiving SEBTC, the estimate does not include any potential impacts of SEBTC on SNAP or WIC participation.
Exhibit 4.2 Household Participation in Nutrition Programs At Baseline, (i.e., Before the End of the School Year)
Source: SEBTC Spring Survey data from 2011, 2012, and 2013 (n= 41,793). Estimates are based on the full sample of summer respondents who had completed a spring baseline survey.
73.9% 64.2%
21.9% 17.6%
0%
20%
40%
60%
80%
100%
AnyNutritionProgram
SNAP WIC Food Pantry

Chapter 4 Page 43
Exhibit 4.3 Comparison of SEBTC Sample and National Estimates of Household Food Insecurity among Households with Children and Incomes at or Below 185% of the Federal Poverty Level
Source: Estimates from pooled SEBTC Spring Survey data for 2011–2013 (n= 41,759) and Tabulations from Current Population Survey, December 2012 (ERS, 2013).
Note: Respondents reported food security in the spring survey. Estimates are based on the full sample of summer respondents who had completed a spring survey.
In terms of other household characteristics, the largest group of respondents to the household survey identified themselves as non-Hispanic white (41.3 percent), with the next largest group being Hispanic (27.3 percent), and then non-Hispanic black (22.6 percent). In addition, approximately one-quarter of respondents did not complete high school, approximately one-third completed high school (or GED), approximately one-third had some college, and less than 10 percent had at least a four-year degree. For other demographic information about participating families, see Appendix 4.
4.3 Impacts on Food Security
4.3.1 Impact of the $60 SEBTC Monthly Benefit on Food Security Compared to No Benefit
Measured impacts of a $60 SEBTC benefit compared to no benefit were substantively large and statistically significant (Exhibits 4.4 and 4.5). SEBTC decreased the prevalence of the most severe food insecurity among children by one-third. Without SEBTC, 9.1 percent of households experienced VLFS-C; in contrast, with a $60 per child per month SEBTC benefit, 6.1 percent of households experienced VLFS-C.
8.0%
43.9%
58.3%
2.6%
16.2%
28.4%
0.0%
10.0%
20.0%
30.0%
40.0%
50.0%
60.0%
70.0%
VLFS-C FI-C FI-HH
Pre
vale
nce
Rat
e
SEBTC Sample National Prevalence Rate

Chapter 4 Page 44
Exhibit 4.4 $60 Benefit Reduced Prevalence of VLFS-C and FI-C
Source: From regression model estimated on pooled SEBTC Summer Survey data from 2011, 2012, and 2013 (n=48,431). Households were randomized to either $60 or no benefit in 2011 and 2012.
*.05 < p < .10, **.01 < p < .05, ***p <. 01
Exhibit 4.5 Estimated Impact of $60 versus $0 SEBTC Benefit on Food Insecurity among Children, Adults, and Households
Outcome Sample
Size
$60 Benefit Group
Prevalence
$0 Benefit Group
Prevalence
Impact ($60/$0
Difference) SE p-value
Very low food security—children
48,431 6.1% 9.1% -3.0*** 0.34 < 0.001
Food insecurity—children 48,431 34.7% 43.0% -8.3*** 0.64 < 0.001
Very low food security—adults
48,431 17.7% 25.9% -8.2*** 0.54 < 0.001
Food insecurity—adults 48,431 41.0% 50.3% -9.3*** 0.67 < 0.001
Very low food security—household
48,428 18.9% 27.5% -8.6*** 0.55 < 0.001
Food insecurity—household
48,431 46.8% 55.6% -8.8*** 0.67 < 0.001
Source: From regression model estimated on pooled SEBTC Summer Survey data from 2011, 2012, and 2013. Households were randomized to either $60 or no benefit in 2011 and 2012.
Note: Numbers may not add due to rounding.
*.05 < p < .10, **.01 < p < .05, ***p <. 01.
SEBTC also reduced the prevalence of food insecurity among children (FI-C) by nearly a fifth. Without SEBTC, 43.0 percent of households had food insecure children; with a $60 per child
9.1%
43.0%
6.1%
34.7%
0%
10%
20%
30%
40%
50%
VLFS-C FI-C
Pre
vale
nce
Rat
e
SEBTC Benefit Amount $0 $60
-3.0***
-8.3***

Chapter 4 Page 45
monthly benefit, only 34.7 percent of households had FI-C. This is a reduction of 8.3 percentage points.
In addition to improving food security among children in the household, the $60 monthly per child SEBTC benefit also improved food security for adults and for households as a whole (Exhibit 4.5). Relative to no benefit, SEBTC cut very low food security among adults (VLFS-A) by approximately one-third and food insecurity among adults (FI-A) by one-fifth. Very low food security for households (VLFS-HH) and food insecurity among households (FI-JH) were cut by similar proportions. These results suggest that as the child benefit increased the total household resources available for the purchase of food, some of the increased resources were used to increase the food intake of adults.
The evaluation estimated impacts on VLFS-C and FI-C for key subgroups based on selected household and site characteristics (see the Exhibit 4.6 for the full list of subgroups), and found two significant subgroup differences.49 First, impacts on VLFS-C were more than four times as large for households whose children were food insecure in the spring, compared to households with food secure children in the spring (Exhibit 4.7). Specifically, for households classified as FI-C in the spring, the child benefit reduced VLFS-C in the summer 6.2 percentage points. In contrast, for households that were not FI-C in the spring, the child benefit reduced VLFS-C in the summer 1.3 percentage points. Second, impacts were more than twice as large for households with an adolescent aged 13 through 20 years (4.9 p.p. for households with an adolescent versus 2.0 p.p. for households without an adolescent). There were no other statistically significant subgroup differences for the subgroups tested. (See Appendix 4, Exhibit 4.J for the complete results of the subgroup analysis.) These results align with findings in Chapter 3 that a households that redeemed a higher percentage of SEBTC when food insecure at baseline and when the age of its oldest child increased.50
49
We discuss all subgroup analyses for which a statistical test rejects equality of impacts across the subgroups; e.g., the impact for Group A is not equal to the impact for Group B. These analyses were not corrected for multiple comparisons and a large number of subgroups were considered, so some statistically significant differences would be expected simply by chance. 50
Specifically, the chapter discusses all subgroup analyses for which a statistical test rejects equality of impacts across the subgroups; e.g., the impact for Group A is not equal to the impact for Group B. These analyses were not corrected for multiple comparisons and a large number of subgroups were considered, so some statistically significant differences would be expected simply by chance.
Exhibit 4.6 SEBTC Subgroups for the Impact Analysis
WIC or SNAP model for SEBTC Active/passive consent process Baseline food security Household poverty status Baseline SNAP participation Number of children in household Adolescent present in household (aged 13-20 years) Respondent race/ethnicity School district locale (rural/urban/town)

Chapter 4 Page 46
Exhibit 4.7 Estimated Impact of $60 versus $0 SEBTC Benefit on Very Low Food Security among Children, by Subgroup (when Significant)
Prevalence of Very Low Food Security Among
Children (VLFS-C) Sample
Size
$60 Benefit Group
Prevalence
$0 Benefit Group
Prevalence
Estimated Impact ($60/$0
Difference) SE p-value
Baseline Food Insecurity among Children (FI-C)
Not FI-C at baseline 23,245 1.1 2.4 -1.3 *** 0.30 <0.001
FI-C at baseline 18,504 12.2 18.4 -6.2 *** 0.75 <0.001
Difference 41,749 11.1 16.0 -4.9 *** 0.77 <0.001
Presence of an Adolescent in Householda
No adolescent in Household 19,945 4.5 6.5 -2.0 *** 0.43 <.001
Adolescent in Household 21,279 7.4 12.3 -4.9 *** 0.55 <.001
Difference 41,224 3.0 5.9 -2.9 *** 0.67 <.001 Source: From regression model estimated on pooled SEBTC Summer Survey data from 2011, 2012, and 2013. Households were randomized to either $60 or no benefit in 2011 and 2012. Estimates were computed on the panel data (i.e., households with both spring and summer survey data).
Note: Numbers may not add due to rounding. a Aged 13 through 20 years.
See Appendix 4 for results of non-significant subgroup analyses for VLFS-C.
*.05 < p < .10, **.01 < p < .05, ***p <. 01.
Similar patterns were observed for impacts on FI-C. Impacts were larger for households that were FI-C in the spring and for households with adolescents. In addition, impacts on FI-C were larger for households that were receiving SNAP in the spring than for households that were not receiving SNAP in the spring and for households with three or more children compared to households with fewer than three children (See Appendix 4, Exhibit 4.K.).
The study also examined how impacts varied with site and district level characteristics. In terms of detecting variation in site-level characteristics, it is important to note, however, that the number of sites is relatively small, so the study’s ability to detect such differences is limited. Differences (or lack thereof) in impacts by site-level characteristics could have been caused by factors other than the specific characteristic itself. That being said, the study found no evidence that the impact of SEBTC on VLFS-C or FI-C varied according to whether the site used the SNAP model versus the WIC model despite the difference in rates of SEBTC redemption between models (93 percent for SNAP versus 61 percent for WIC).
There was also no evidence that the impact varied by whether grantees used active or passive consent. At the school district level, the study estimated impact variations by locale (urban, suburban, or rural community) and again found no evidence of differences in impacts.
Finally, pooling 2011 and 2012 data, the evaluation compared rates of VLFS-C and FI-C in the spring (i.e., when school was in session) to those in the summer between the $60 group and the no-benefit group (Exhibit 4.8). For the $0 benefit group VLFS-C increased between spring and summer, from 8.3 percent to 9.5 percent. In contrast, VLFS-C in the $60 group decreased between spring and summer, from 8.4 percent to 6.0 percent. FI-C in the control group remained relatively constant in the $0 group with a prevalence rate of 44.9 percent in the
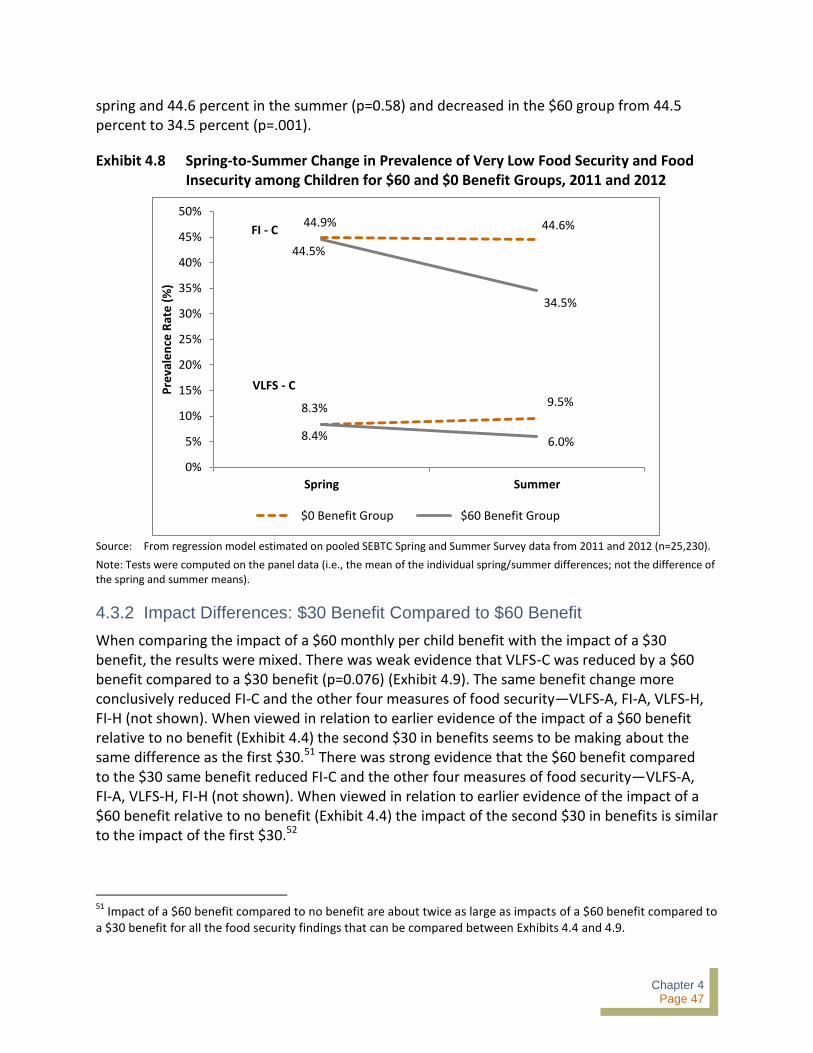
Chapter 4 Page 47
spring and 44.6 percent in the summer (p=0.58) and decreased in the $60 group from 44.5 percent to 34.5 percent (p=.001).
Exhibit 4.8 Spring-to-Summer Change in Prevalence of Very Low Food Security and Food Insecurity among Children for $60 and $0 Benefit Groups, 2011 and 2012
Source: From regression model estimated on pooled SEBTC Spring and Summer Survey data from 2011 and 2012 (n=25,230).
Note: Tests were computed on the panel data (i.e., the mean of the individual spring/summer differences; not the difference of the spring and summer means).
4.3.2 Impact Differences: $30 Benefit Compared to $60 Benefit
When comparing the impact of a $60 monthly per child benefit with the impact of a $30 benefit, the results were mixed. There was weak evidence that VLFS-C was reduced by a $60 benefit compared to a $30 benefit (p=0.076) (Exhibit 4.9). The same benefit change more conclusively reduced FI-C and the other four measures of food security—VLFS-A, FI-A, VLFS-H, FI-H (not shown). When viewed in relation to earlier evidence of the impact of a $60 benefit relative to no benefit (Exhibit 4.4) the second $30 in benefits seems to be making about the same difference as the first $30.51 There was strong evidence that the $60 benefit compared to the $30 same benefit reduced FI-C and the other four measures of food security—VLFS-A, FI-A, VLFS-H, FI-H (not shown). When viewed in relation to earlier evidence of the impact of a $60 benefit relative to no benefit (Exhibit 4.4) the impact of the second $30 in benefits is similar to the impact of the first $30.52
51
Impact of a $60 benefit compared to no benefit are about twice as large as impacts of a $60 benefit compared to a $30 benefit for all the food security findings that can be compared between Exhibits 4.4 and 4.9.
8.3% 9.5%
8.4% 6.0%
44.9% 44.6%
44.5%
34.5%
0%
5%
10%
15%
20%
25%
30%
35%
40%
45%
50%
Spring Summer
Pre
vale
nce
Rat
e (
%)
$0 Benefit Group $60 Benefit Group
VLFS - C
FI - C

Chapter 4 Page 48
Exhibit 4.9 Impact on Very Low and Food Insecurity Among Children: $30 Benefit Versus $60 Benefit
Source: From regression model estimated on pooled SEBTC Summer Survey data from 2011, 2012, and 2013 (n=48,431). Households were randomized to either $60 or $30 in 2013.
Note: Difference in very low food security among children (VLFS-C) is -0.6 percentage points (p.p.), standard error (SE) = 0.3, p= 0.076. Difference in low food security among children (FI-C) is -3.6 p.p., SE = 0.64, p < 0.001.
*.05 < p < .10, **.01 < p < .05, ***p <. 01
4.3.3 Impacts of $30 Benefit Compared to No Benefit
For most food security outcomes, the impact of a $30 benefit (versus no benefit) is approximately half the impact of a $60 benefit (versus no benefit). 53 The exception is VLFS-C. For VLFS-C, the study found that the estimated impact of a $60 benefit was only slightly larger than the estimated impact of a $30 benefit (3.0 percentage points rather than 2.4 percentage
52
Impact of a $60 benefit compared to no benefit are about twice as large as impacts of a $60 benefit compared to a $30 benefit for all the food security findings that can be compared between Exhibits 4.4 and 4.9. 53
The evaluation estimated the impact of a $30 benefit compared to no benefit quasi-experimentally by subtracting the estimated impact of $60 vs. $30 (based on a comparison between households randomized to $60 or $30 in 2013) from the estimated impact of $60 vs. no benefit (based on a comparison between households randomized to $60 or no benefit in 2011 and 2012).
The impact of $60 vs. no benefit can be viewed as the sum of the impact of $60 vs. $30 and $30 vs. no benefit. Exhibit 4.10 illustrates how the analysis uses this insight to estimate the impact of $30 vs. no benefit. From 2011 and 2012 data, the evaluation estimates the impact of $60 vs. $0 on VLFS-C is 3.0 p.p. This estimate is represented by far left bar. Next, from 2013 data, the evaluation estimates the impact of $60 vs. $30, which is shown at the top of that bar. The difference between the two estimates is shown by second bar to the left and can be interpreted as the impact of $30 vs. no benefit. The estimate for FI-C is depicted in the same way.
6.7%
38.3%
6.1%
34.7%
0%
10%
20%
30%
40%
50%
VLFS-C FI-C
Pre
vale
nce
Rat
e
SEBTC Benefit Amount $30 $60
-0.6*
-3.6***

Chapter 4 Page 49
points) (Exhibit 4.10). 54 For FI-C, the impact of a $60 benefit was 8.3 percentage points, while the impact of a $30 benefit was 4.7 percentage points for a difference of 3.6 percentage points.
Exhibit 4.10 Impact on Prevalence of Food Security: $30 Benefit Compared to $0 Benefit
Source: From regression model estimated on pooled SEBTC Summer Survey data from 2011, 2012, and 2013 (n=48,431).
Note: Difference in Standard error (SE) for very low food security among children (VLFS-C) = 0.48, p < 0.001. SE for low food security among children (FI-C) SE = 0.91, p < 0.001.
*.05 < p < .10, **.01 < p < .05, ***p <. 01
4.4 SEBTC Impacts on Children’s Nutrition
In addition to considering SEBTC’s impact on the primary outcome, VLFS-C, and other food security outcomes, the study also estimated the impact of SEBTC on children’s nutrition,
54
A formal statistical test rejects the hypothesis that the impact of the $30 benefit on VLFS-C is half the impact of the $60 benefit. In fact, the test that the impact of a $60 benefit on VLFS-C is clearly larger than the $30 benefit is only borderline significant (pp=0.076).
Chapter 4 Page 50
defined as dietary quality based on reported food consumption for the purposes of the evaluation.55 56
4.4.1 Impact of $60 SEBTC Monthly Benefit Compared to No Benefit
Across all sites in the evaluation, (i.e., SNAP and WIC sites combined), SEBTC improved dietary quality for most of the nutrition outcomes measured by the study (Exhibit 4.11).57 For instance, SEBTC increased children’s mean fruit and vegetable consumption by one-third of a cup (0.36 cup equivalents) (Exhibit 4.12).This impact, roughly equivalent to a third of a cup of raw fruit or two-thirds of a cup of salad greens, for example, is similar to the estimated impact of the Fresh Fruit and Vegetable Program intervention in elementary schools, which increased children’s daily consumption of fruits and vegetables by one-third of a cup (Bartlett et al., 2013).58
While there was a statistically significant increase in both the SNAP-model and WIC-model sites, but, unlike the food security outcomes, there was also a statistically significant difference in impacts between the models (see Appendix 4, Exhibit 4.M for detailed results). The impact on children’s nutrition in the WIC-model sites was twice that in the SNAP-model sites (0.5 cup equivalents compared to 0.2 cup equivalents.
55
A survey module designed to assess children’s dietary quality relative to the 2010 Dietary Guidelines for Americans was shown to be feasible in the first year of SEBTC (i.e., 2011) and was administered in 2012 and 2013. The study used the food frequency questions developed by the National Cancer Institute (NCI) for the 2009–-2010 National Health and Nutrition Examination Survey (NHANES) Multifactor Diet Screener and their scoring algorithms (NCI, 2012; http://riskfactor.cancer.gov/studies/nhanes/dietscreen/scoring.html. 56
Unlike most of the other analysis in this chapter, the analyses in this section only use data from 2012 and 2013. The battery of nutrition questions was somewhat different in 2011, and five of the eight outcome measures could not be constructed (whole grains, dairy, total added sugars, added sugars without cereal, sugar-sweetened beverages) because all of the questions needed were not asked in 2011. 57
The SEBTC survey questions measured eight dietary indicators of children’s food consumption during the 30 days before the survey for one target child per household: fruits and vegetables (total and excluding fried potatoes); whole grains; dairy products; added sugars (total, from sugar-sweetened beverages, and excluding cereals); and whether the child usually drank nonfat or low-fat milk. Measures are based on USDA’s recommended daily intake for food groups (USDA, 2015). 58
The Fresh Fruit and Vegetable Program (FFVP) delivers fresh fruits and vegetables as free snacks during school hours in elementary schools with at least 50 percent of students eligible for FRP school meals (USDA, 2014).

Chapter 4 Page 51
Exhibit 4.11 Estimated Impact of $60 Monthly Benefit Compared to $0 Monthly Benefit on Nutrition Outcomes
Outcome Sample
Size
$60 Benefit Group
Consumption
$0 Benefit Group
Consumption
Impact ($60/$0
Difference) SE p-value
Fruits and vegetables (cup equivalents per day)
a
42,774 3.3 2.9 0.4 *** 0.03 < 0.001
Fruits and vegetables, without fried potatoes (cup equivalents per day)a
42,818 3.2 2.8 0.4 *** 0.03 < 0.001
Whole grains (ounce equivalents per day)
b
43,165 2.2 1.7 0.5 *** 0.05 < 0.001
Dairy (cup equivalents per day)
c
43,302 2.5 2.3 0.2 *** 0.03 < 0.001
Usually drank nonfat or low-fat milk (%)
d
42,406 13.2 13.7 -0.5 0.71 0.442
Added sugars (teaspoons per day)
e
42,494 18 18.2 -0.2 0.17 0.313
Added sugars excluding cereals (teaspoons per day)
e
42,800 16.6 17.1 -0.5 *** 0.15 0.002
Sugar-sweetened beverages (teaspoons per day)
e
43,357 7.6 8.2 -0.6 *** 0.16 < 0.001
Source: From regression model estimated on pooled SEBTC Summer Survey from 2012 and 2013. Households were randomized to either $60 or no benefit in 2011 and 2012. In 2013, households were randomized to $30 or $60 benefit groups.
Note: Numbers may not add due to rounding. a Daily amounts of fruits and vegetables and dairy are measured in cup equivalents and in ounce equivalents for whole grains,
as defined by the 2010 Dietary Guidelines for Americans. For fruits and vegetables, 1 cup equivalent is defined as 1 cup raw or cooked fruit or vegetables, vegetable juice, or fruit juice; 2 cups leafy green vegetables; or 1/2 cup dried fruit.
b One ounce
equivalent of whole grains is 1 one-ounce slice of bread; 1 ounce uncooked pasta or rice; 1/2 cup cooked rice; pasta; or cereal; 1 6-inch diameter tortilla; 1 5-inch diameter pancake; or 1 ounce ready-to-eat cereal. c One cup equivalent of dairy is 1 cup milk, fortified soy beverage, or yogurt; 1½ ounces natural cheese; or 2 ounces of
processed cheese. d
Respondents who reported that their child consumed more than one type of milk were included if any of the milk types reported were nonfat or low-fat. Those reporting only whole milk and/or 2% milk were not considered to usually consume nonfat or low-fat milk. e
Teaspoons of added sugars are derived from reported frequencies of consuming sugar-sweetened beverages (soda, fruit-flavored drinks, and sugar or honey added to coffee or tea); cookies/cakes/pies; doughnuts; ice cream; candy; and cereals.
*.05 < p < .10, **.01 < p < .05, ***p <. 01.

Chapter 4 Page 52
Exhibit 4.12 Impact of $60 Compared to $0 Monthly Benefit on Children’s Daily Fruit and Vegetable Consumption (excluding fried potatoes)
Source: From regression model estimated on pooled SEBTC Summer Survey from 2012 and 2013 (n=42,818). Households were randomized to either $60 or no benefit in 2012.
*.05 < p < .10, **.01 < p < .05, ***p <. 01
Children receiving the $60 SEBTC per child monthly benefit consumed 2.2 ounce equivalents of whole grains per day, which is approximately 30 percent more than what was consumed by those not receiving any SEBTC benefit across all sites (Exhibit 4.13). This improvement, roughly equivalent to one-half slice of whole wheat bread or one-fourth of a cup of cooked brown rice, makes a substantial contribution towards daily recommendations (USDA, Center for Food Policy and Promotion, 2013). Again, there was a statistically significant increase in both the SNAP and WIC sites, but the impact in the WIC-model sites was four times the impact in the SNAP-model sites (0.9 ounce equivalents compared to 0.2 ounce equivalents; p<0.001).
2.8 2.8 2.7
3.1 3.0 3.2
0
1
2
3
4
5
All Sites SNAP Model Sites WIC Model Sites
Cu
p-E
qu
ival
en
ts
$0 benefit $60 benefit
0.36*** 0.25*** 0.52***

Chapter 4 Page 53
Exhibit 4.13 Impact of $60 Compared to $0 Monthly Benefit on Children’s Daily Whole Grains Consumption
Source: From regression model estimated on pooled SEBTC Summer Survey data from 2012 and 2013 (n=43,165). Households were randomized to either $60 or no benefit in 2012.
Note: For all sites, Standard error (SE) = 0.05, p < 0.001. For SNAP model sites, SE = 0.06, p < 0.001. For WIC model sites, difference = 0.91, SE = 0.10, p <0.001. The WIC-SNAP difference in impact=0.70, SE=0.11, p<0.001. Numbers may not sum due to rounding.
*.05 < p < .10, **.01 < p < .05, ***p <. 01
Children receiving the $60 per month benefit consumed about 10 percent more cup equivalents of dairy products per day than those not receiving the benefit (Exhibit 4.14)59. Again, there was a statistically significant increase in both the SNAP and WIC sites, but the increase was more than three times as large in the WIC sites (0.38 cup equivalents versus 0.11 cup equivalents; and the difference in impacts was statistically significant). Even though the SEBTC WIC food package includes only low-fat or nonfat milk, there was no significant difference in impact between the SNAP and WIC models in the proportion of children who usually drank low-fat or nonfat milk (see Appendix 4, Exhibit 4.M). Only 14 to 15 percent of children usually drank nonfat or low-fat milk despite recommendations that children consume nonfat or low-fat milk.
59
The dairy items included in the survey instrument are: milk, cheese (including cheese in mixed dishes and pizza), yogurt, and ice cream.
1.7 1.7 1.6
2.2 1.9
2.5
0
1
2
3
4
All Sites SNAP Model Sites WIC Model Sites
Ou
nce
Eq
uiv
len
ts
$0 benefit $60 benefit
0.5*** 0.2***
0.9***

Chapter 4 Page 54
Exhibit 4.14 Impact of $60 Compared to $0 Monthly Benefit on Children’s Daily Dairy Consumption
Source: From regression model estimated on pooled SEBTC Summer Survey from 2012 and 2013 (n=43,302). Households were randomized to either $60 or no benefit in 2012.
Note: For all sites, difference = 0.22, SE = 0.03, p < 0.001. For SNAP model sites, difference = 0.11, SE = 0.03, p < 0.001. For WIC model sites, difference = 0.38, SE = 0.05, p <0.001. The WIC-SNAP difference in impact=0.28, SE=0.06, p<0.001. Numbers may not sum due to rounding.
*.05 < p < .10, **.01 < p < .05, ***p <. 01
The $60 monthly SEBTC intervention had no impact on total daily consumption of added sugars from all foods and beverages (Appendix Exhibit 4.G)—a main contributor to empty calories in Americans’ diets.60 This is a positive finding considering that the greater financial resources for households that received from the SEBTC benefits could have increased children’s consumption of food high in added sugars or empty calories, and it did not. Receipt of the benefit lowered added sugar consumption from sugar-sweetened beverages by about 7 percent (Exhibit 4.15). Although this finding represents an improvement, it implies only a small difference in overall diet; SEBTC children consumed two-thirds of a teaspoon or approximately 10 calories less added sugar per day than the no-benefit group. Unlike other outcomes, there was no statistically significant impact in the SNAP sites. There was, a however, a statistically significant impact in the WIC sites and the difference in the two impacts is statistically significant.
60
Children in both the no benefit and the $60 benefit group consumed an average of 18 teaspoons (270 calories) from added sugars per day.
2.3 2.2 2.3 2.5
2.4
2.6
0
1
2
3
4
All Sites SNAP Model Sites WIC Model Sites
Cu
p E
qu
ival
en
ts
$0 benefit $60 benefit
0.22*** 0.11*** 0.38***

Chapter 4 Page 55
Exhibit 4.15 Impact of $60 Compared to $0 Monthly Benefit on Children’s Daily Consumption of Added Sugars from Sugar-Sweetened Beverages
Source: From regression model estimated on pooled SEBTC Summer Survey from 2012 and 2013 (n=43,357). Households were randomized to either $60 or no benefit in 2012.
Note: For all sites, Standard error (SE) = 0.16, p < 0.001. For SNAP model sites, SE = 0.20, p = 0.536. For WIC model sites, SE = 0.28, p <0.001. The WIC-SNAP difference in impact= -1.16, SE=0.34, p<0.001. Numbers may not sum due to rounding.
*.05 < p < .10, **.01 < p < .05, ***p <. 01
4.4.2 Differences in Nutrition Impacts by Benefit Amount
Relative to a $30 SEBTC monthly benefit, a $60 monthly benefit led to favorable changes in several of the measured dietary indicators of children’s nutrition, but the changes were smaller than those seen in comparing the $60 benefit to no benefit. Relative to a $30 SEBTC monthly benefit, children in households receiving the $60 SEBTC monthly benefit ate slightly more fruits and vegetables (0.2 cup equivalents more than the $30 group) and whole grains (0.13 ounce equivalents more than the $30 group). Relative to a $30 SEBTC monthly benefit, a $60 benefit had no statistically significant impact on total daily added sugars from all foods and beverages or from sugar-sweetened beverages alone, or on dairy foods or usually drinking nonfat- or low-fat milk (compared to higher fat milks).
Finally, using a quasi-experimental methodology, the evaluation considered whether a $30 SEBTC benefit improved nutrition outcomes relative to no benefit (Appendix 4).61 This analysis suggests that, relative to no benefit, a $30 benefit increased consumption of fruits and vegetables, whole grains, and dairy and lowered intake of sugar-sweetened beverages and
61
The analysis also tested whether the first $30 per child (from $0 to $30) differed from the second $30 (from $30 to $60). See Appendix 4 for details.
8.2 7.6
8.9
7.6 7.5 7.7
0
1
2
3
4
5
6
7
8
9
10
All Sites SNAP Model Sites WIC Model Sites
Teas
po
on
s
$0 benefit $60 benefit
-0.6*** -0.1
-1.10***

Chapter 4 Page 56
consumption of added sugars excluding cereal (p<0.05), but there is no evidence of lowering added sugars including cereal (p=0.23).
4.5 Impacts on Food Expenditures
SEBTC increased total household food expenditures (i.e., combined expenditures using SNAP benefits, SEBTC benefits, and out-of-pocket funds). Previous research (Southworth, 1945; Fox et al., 2004) suggests that households will respond to receiving food assistance, in part, by reducing their out-of-pocket (i.e., cash) expenditures on food, instead using the same cash for other household expenditures (e.g., clothing, housing, entertainment). If true, the increase in total food expenditure (food assistance plus cash) due to SEBTC can be expected to be less than the additional food assistance received. The average household in the $60 benefit group received 92 dollars of SEBTC over the course of the summer and spent $53 dollars on food (Exhibit 4.16). Consistent with this literature, comparing a $60 benefit to no benefit, total monthly household food expenditures increased 58 cents for every dollar of SEBTC benefits received.62
Exhibit 4.16 Impact of a $60 Compared to $0 Benefit on Food Expenditures
Source: From regression model estimated on pooled SEBTC Summer Survey data from 2012 and 2013 (n=45,641). Households were randomized to either $60 or no benefit in 2012.
Note: Difference in monthly household expenditures (out-of-pocket plus SNAP) is -$40, standard error (SE) = 4.02, p < 0.001. Difference in total food expenditures including SEBTC is $53, SE = 4.09, p < 0.001. Numbers may not sum due to rounding.
*.05 < p < .10, **.01 < p < .05, ***p <. 01
62
This estimate is much higher than the earlier literature for SNAP (see Fox, Hamilton, and Lin, 2004), but similar to a more recent estimate based on the ARRA SNAP benefit increase (Beatty and Tuttle, 2014).
$579 $539
$92
$0
$100
$200
$300
$400
$500
$600
$700
$0 $60
Exp
en
dit
ure
SEBTC Benefit Amount
SNAP+Out-of-Pocket SEBTC
$631 $579
$53***

Chapter 4 Page 57
Similar patterns were observed for a $60 benefit versus a $30 benefit. For every additional dollar of SEBTC benefit, food expenditure increased by 59 cents.
4.6 Impacts on Other Outcomes
The study also considered whether SEBTC had an impact on SNAP or on WIC participation, and on children’s participation in the Summer Food Service Program (SFSP). There is some evidence that SEBTC lowers use of SFSP and other child nutrition programs, but the impacts are small. Children in households receiving SEBTC were slightly less likely to participate in SFSP (6.6 percent for the $60 benefit versus 7.3 percent for the no-benefit group; p < .05). Similarly, relative to children receiving no benefit, children in households receiving a $60 SEBTC benefit were slightly less likely to receive any form of free lunch on a weekday during the summer, including a meal at a friend’s or relative’s home (19.3 percent versus 17.9 percent; p < .001).
There was no strong evidence that SEBTC affected participation in other food assistance programs. The SEBTC benefit had no impact on households’ SNAP participation during the summer. There was some evidence of more participation in WIC, but this may be spurious.63
63
From their answers to questions about WIC participation on the summer household survey, some respondents appear to have confused receiving benefits from the WIC SEBTC model with receiving benefits from the regular WIC program. See Collins et al., 2013 for a more detailed explanation.


Chapter 5 Page 59
Chapter 5
Summary and Conclusions
During the summer when school is not in session, many fewer children receive nutritional assistance from USDA summer meal programs than from the National School Lunch Program and the School Breakfast Program during the school year. The 2010 Agriculture Appropriations Act provided FNS with authority and funding to demonstrate and rigorously evaluate approaches for reducing or preventing food insecurity and hunger among children in the summer months. The Summer EBT for Children (SEBTC) demonstration, the largest intervention funded by the 2010 Act, delivered an SEBTC benefit of $60 or $30 per eligible child per month through WIC or SNAP EBT systems to randomly selected households with eligible children (i.e., households with children eligible for free or reduced-price (FRP) school meals).
The results of the SEBTC demonstration are clear. The program is feasible and the impacts on food security and children’s nutrition are positive and substantial.
This chapter briefly summarizes and discusses the evaluation’s major findings.
5.1 Feasibility of SEBTC Implementation
Across the four years of the demonstration, the 10 SEBTC grantees (eight States and two Indian Tribal Organizations) implemented SEBTC in a broad range of communities, from highly rural to highly urban. The grantees were given a great deal of flexibility in implementing the demonstration, including (1) which State agency would be the lead and who its major partners would be, (2) whether the grantee would implement SEBTC using the WIC or SNAP model, (3) whether to build new administrative systems or rely on current ones, (4) how to obtain consent from households to participate in the demonstration and evaluation (including whether to use an active or passive process) and (5) what role local school food authorities (SFAs) would have in the consent process. As a result, the grantees implemented SEBTC in a variety of ways. For many of the grantees, the SEBTC demonstration was the first time they had undertaken many of these activities, including forging new partnerships with other State and local agencies, recruiting households, setting up systems to load and deliver SEBTC benefits, and getting EBT cards to households before the school year ended.
Across the four years of the evaluation (2011-2104), grantees demonstrated that SEBTC can be implemented successfully using both the SNAP and WIC EBT systems to deliver benefits. Grantees showed that it was possible to deliver summer benefits using different implementation approaches and across a range of different communities and populations, including large urban school districts and large groups of small rural districts. The performance of grantees makes it clear that if SEBTC were an ongoing program, it could be feasibly implemented in several different ways and in different types of communities.

Chapter 5 Page 60
Although the grantees had a good success rate at getting SEBTC to households before the summer period started, many encountered implementation challenges, as often happens during the early years of a new program. For SEBTC, most of these challenges involved the processes by which eligible children and households were identified and households consented to be part of the demonstration and evaluation. Also, in some sites poor quality data on household composition and contact information from SFAs made it challenging to group children eligible for FRP meals into households that would each receive a single combined benefit.
The specific challenges differed between sites using active or passive consent processes, e.g., requiring guardians to return consent materials if they desired to be part of the demonstration versus returning materials if they desired to be excluded. Grantees using the active consent process were consistently surprised at how few households returned the necessary forms; return rates ranged from 23 to 57 percent of those identified as eligible and invited to participate. As a result, grantees often had to increase their outreach efforts and make midcourse corrections in order to obtain consent from the target number of households. Grantees using the passive consent process achieved much higher consent rates (90 to 97 percent). However, because the passive process did not provide an opportunity to update household composition and contact information, some of these grantees faced challenges in accurately setting up SEBTC accounts and sending SEBTC EBT cards to accurate addresses.
Since in most sites SEBTC was a demonstration that operated over only one or two summers, it is difficult to predict the rate of household participation should SEBTC become an ongoing program. For an ongoing program, household awareness and understanding of the program would likely be greater than in the demonstration. In addition, some of the implementation challenges grantees experienced arose specifically from grantees’ participation in the evaluation (e.g., establishing a control group of unserved households for research purposes), and would not arise in the absence of an evaluation. However, even absent an evaluation, States would still need to obtain accurate information about eligible children and households from school or other administrative data, and processes would need to be in place so that school districts could release data on individual students to other government agencies in the State.
5.2 SEBTC Costs
The evaluation collected and analyzed data on the costs of SEBTC administration and benefits paid as incurred by the federal government, State grantees, local SFAs, and nonprofit partners in 2011 and 2012. No cost data were collected in 2013 or 2014, limiting the ability to anticipate how administrative costs might evolve over the long run and thus become different in an established program.
In 2012, the average SEBTC cost per child issued benefits was $201, including $141 in SEBTC benefits and $60 in administrative costs (30 percent of the total). Administrative costs per child in 2012 were substantially lower than they were in 2011. This was because (1) half of the

Chapter 5 Page 61
grantees had already incurred one-time start-up costs associated with, for example, establishing new EBT processes and systems, and (2) there were economies of scale for grantees implementing SEBTC in more than one site or serving larger numbers of households in the same sites in the subsequent year.
The share of administrative costs for SEBTC is higher than for most nutrition-assistance programs (e.g., 16 percent for SNAP, according to Isaacs, 2008), but other programs are well-established and national in scale. There are several reasons why administrative costs for the SEBTC demonstration would be expected to be higher than for ongoing national programs. First, grantees experienced additional administrative costs because of their participation in the evaluation; these costs could not be isolated and removed from the cost analysis. Second, on a per-child basis many administrative costs would decline with larger-scale implementation in which more children are served. Third, recurring annual administrative costs of identifying and enrolling eligible children and households might decline over time as SEBTC becomes better known and as enrollment is routinized (and perhaps streamlined). However, compared to other food assistance programs the administrative costs for SEBTC might remain a relatively large share of total costs because application and account set-up costs must be spread over only three months instead of the longer duration of many other food assistance programs (e.g., certification for FRP meals is valid for the entire school year).
5.3 SEBTC Benefit Use
High rates of benefit use are an important benchmark of implementation success. The theory underlying SEBTC is that providing benefits to eligible households would increase those households’ purchases of SNAP-eligible foods64 or foods that were part of the SEBTC-WIC package, the first step in a process leading to improved food security. If households do not use the SEBTC benefit the demonstration could not improve children’s food security.
Almost all families issued SEBTC benefits used them. The SEBTC evaluation consistently showed that almost 90 percent of households in the $60 group issued SEBTC benefits used them at least once over the course of a summer and, among those using any benefits, households redeemed on average 86 percent of their issued benefits. Across all the years of the evaluation, approximately half (45 percent) of households issued benefits exhausted all of their SEBTC benefits in at least one month, but only 28 percent redeemed all of their benefits for an entire summer. Households in the $30 group had similar rates of participation, redemption, and exhaustion when adjusting for site-level and personal characteristics. Across all years, an eligible child in the $60 per child monthly benefit group received, on average, $133 in redeemed SEBTC benefits per summer.
64
SNAP can be used to purchase any food for home consumption but cannot be used for alcohol, tobacco, hot foods, or foods intended to be eaten out of the home.

Chapter 5 Page 62
There were differences in rates of participation, redemption, and exhaustion between the SNAP and WIC models. Households in WIC-model sites, in which SEBTC was issued using WIC EBT systems had lower average participation and redemption rates than those in SNAP-model sites, which issued benefits using SNAP EBT systems. For instance, the average participating household (i.e., a household redeeming any benefits) in the WIC-model sites redeemed only 73 percent of their potential benefits while in SNAP-model sites the average participating household redeemed 98 percent. These differences likely result for several reasons: (1) more restricted availability of WIC-authorized retailers and WIC-eligible foods compared to SNAP-authorized retailers and SNAP-eligible foods, and (2) more complexity of redemption with the WIC model. (1) a combination of implementation factors in specific sites,
5.4 SEBTC Impacts on Children and Households
To measure impacts, the evaluation randomly assigned households to receive or not receive SEBTC, or to receive the benefits at different benefit levels. Separating statistically equivalent groups of households on this basis—where the only systematic difference between the groups is the SEBTC benefits received—provides the “gold standard” for measuring the impact of different benefit levels because—when correctly implemented—random assignment ensures that no factor other than the intervention tested can be responsible for subsequent differences in outcomes between the two groups. All evidence indicates that random assignment for the SEBTC demonstration was implemented correctly. Since chance can also lead to outcome differences, unless otherwise noted, this report confines discussion in this section to instances in which there is at least 95 percent confidence that a real impact occurred (i.e., p<0.05).
On this basis, the evaluation found that in 2011 and 2012, when a $60 per child monthly SEBTC benefit was tested against a control group receiving no benefit, SEBTC unambiguously and substantially advanced the demonstration’s main goal: reducing very low food security among children (VLFS-C) in the summer. This section provides more information about the effect of SEBTC on food security and other outcomes.
In 2011 and 2012, the $60 SEBTC benefit amount decreased the prevalence of VLFS-C by one-third. Without SEBTC, 9 percent of households experienced VLFS-C; in contrast, with a $60 per child monthly SEBTC benefit, 6 percent of households experienced VLFS-C. SEBTC also reduced the prevalence of the broader category of food insecurity among children (FI-C)—which includes both VLFS-C and low food security among children (LFS-C)—by nearly a fifth. Without SEBTC, 43 percent of households experienced FI-C; with a $60 per child monthly benefit, only 35 percent of households experienced FI-C. Relative to no benefit, the $60 per child per month SEBTC benefit also reduced all other measures of food insecurity among adults and households considered in the analysis, providing evidence that SEBTC, a household level benefit, improved food security for all members of the household, not just for the children.
Compared to a $30 per child monthly benefit, a $60 benefit did not clearly reduce VLSF-C but did reduce all other measures of food insecurity considered by the study. In particular, the five other measures of food security considered by the study—FI-C, very low food security among

Chapter 5 Page 63
adults or any household member (VLFS-A, VLFS-HH) and food insecurity among adults or any household member (FI-A, FI-H)—were significantly and substantially improved by a $60 benefit compared to a $30 benefit.
The best available (albeit non-experimental) evidence suggests that, relative to no benefit, a $30 per child monthly benefit would improve all food security outcomes, including VLFS-C. Analysis based on plausible assumptions predicts that, relative to no benefit, a $30 benefit would decrease VLFS-C by 26 percent (from 9.1 to 6.7 percent) and FI-C by 11 percent (from 43.0 to 38.3 percent). For all of the food security outcomes except VLFS-C the impact of the first $30 dollars (e.g., $0 versus $30) is projected to be approximately the same as that measured directly for the second $30 (e.g., $30 versus $60). For VLFS-C, the impact of the first $30 would be much bigger (6.1 percentage points) than the impact of the second $30 (0.6 percentage points).
With a fixed level of funding (administrative costs aside), FNS could serve twice as many households with a $30 benefit amount than with a $60 amount. If future sites were similar to those that participated in the demonstration, with a fixed amount of funding, the $30 benefit level therefore would move roughly the same number of households out of FI-C as would the $60 level, but the $30 level would result in moving approximately twice as many households out of VLFS-C than would the $60 level.
When comparing the $60 group with the no-benefit group, there were no differences between the SNAP and WIC models regarding impacts on VLFS-C and FI-C. This was the case despite substantial differences between the SNAP and WIC models in the rates of SEBTC participation, redemption, and exhaustion noted earlier.
Across all sites, SEBTC improved children’s dietary quality for most of the outcomes measured by the study in this domain. Children in the $60 group ate more fruits and vegetables, whole grains, and dairy products and less added sugars (excluding cereal) than children receiving no benefit. SEBTC achieved impacts on these nutrition outcomes with the $60 monthly benefit in both WIC- and SNAP-model sites. Relative to a $30 SEBTC monthly benefit, a $60 monthly benefit led to better outcomes on several measures of children’s nutrition, but the differences were substantively smaller than the impacts of a $60 benefit compared to no benefit.
Impacts on nutritional outcomes were consistently better for children in WIC-model sites than in SNAP-model sites. The size of the difference between the $60 benefit group and the $0 benefit group for fruit and vegetable intake was twice as large in WIC-model sites as in SNAP-model sites (0.52 versus 0.25 cup equivalents excluding fried potatoes, respectively), four times as large for whole grains (0.9 versus 0.2 ounce equivalents), and three times as large for dairy (0.38 versus 0.11 cup equivalents). Further, there was no statistically significant impact of the $60 SEBTC benefit on consumption of added sugars from sugar-sweetened beverages in the SNAP-model sites, but those in WIC-model sites consumed 1.3 teaspoons less added sugar from sugar-sweetened beverages than children receiving no benefit.

Chapter 5 Page 64
SEBTC unambiguously increased households’ total food expenditures. For every dollar of SEBTC benefits redeemed, total household food expenditure in the $60 benefit group increased 58 cents. The fact that the expenditure increase was not 100 cents on the dollar means that households in part reacted to the added SEBTC food assistance they received by lowering out-of-pocket spending on food, consistent with previous research on the impact of other types of food assistance on food expenditures.
The SEBTC benefit had few impacts on the use of other nutrition assistance programs. SEBTC had no impact on SNAP participation during the summer. However, comparing the $60 group with the $0 group, the study found a very small but statistically significant reduction in participation in the Summer Food Service Program (SFSP) (6.6 percent versus 7.3 percent).
The findings from the impact analysis do not automatically extrapolate to the nation as a whole since the 16 demonstration sites were not representative of the entire United States. For example, compared to all children in the country, children in the participating sites were relatively more likely to live in households with incomes below the federal poverty line and to be eligible for FRP meals. However, SEBTC’s measured impact was consistently positive across the range of sites and implementation approaches examined, suggesting that SEBTC’s impacts across a broad spectrum of American communities would be similar to those reported here.
5.5 Conclusion
With the SEBTC demonstration the 2010 Agricultural Appropriations Act funded one of the largest demonstration and evaluation of a publicly funded initiative to reduce childhood hunger ever conducted. The corresponding evaluation used the most rigorous method for estimating impacts—random assignment to different levels of the SEBTC benefit or no benefit. More than 100,000 households were randomized over three summers. For almost all objectives, the evaluation’s findings are conclusive. SEBTC is feasible as a programmatic approach and, if implemented in communities similar to those in the demonstration, children’s food security and nutrition could be expected to improve substantially. SEBTC grantees demonstrated that SEBTC can feasibly be implemented, using either a SNAP or WIC model in a range of communities and with a variety of implementation approaches. Analysis of the use of SEBTC benefits showed that nearly all households that were provided with SEBTC benefits used them, and that the households that used SEBTC benefits at least once used the vast majority of the benefits issued to them. The evaluation provided less conclusive findings about the potential costs of an SEBTC as an ongoing program because of the relatively small number of sites, the limited cost data collected for just two years, and the fact that some costs incurred were due to grantees participating in an evaluation.
Were it an ongoing program, SEBTC could be implemented using only SNAP EBT systems, only WIC EBT systems, or a combination of both systems. Relative to the SNAP model, it appears that the WIC model achieved the same impacts on food security and better impacts on children’s nutrition. The 2012 cost analysis indicated that the WIC model was slightly more expensive to implement but overall costs per child, due to lower SEBTC redemption rates, were

Chapter 5 Page 65
lower in WIC-model sites than in SNAP-model sites. The SEBTC demonstration built on existing EBT technology; it is important to note that while SNAP EBT systems are in place in every State, as of 2015, WIC EBT systems existed in a much more limited number of States.
In addition, were it an ongoing program, SEBTC could be structured to provide a $60 per child monthly benefit, a $30 monthly benefit, or some other amount. The evaluation did not show a difference in impact between these two benefit amounts on the most severe form of children’s food insecurity, VLFS-C. If the program’s sole focus was that outcome, a $60 benefit is not clearly better than a $30 benefit. However, for all other outcomes related to food security and all measures of children’s nutrition the impact of a $60 benefit was clearly greater than that of a $30 benefit.


References Page 67
References
Bartlett S, Olsho L, Patlan KL, Blocklin M, Klerman J, Connor P, Crawford P. (2013). Food and Nutrition Service Evaluation of the Fresh Fruit and Vegetable Program (FFVP): Final Evaluation Report. Cambridge, MA: Abt Associates.
Beatty T, Timothy KM, Tuttle CJ. 2014. Expenditure response to increases in in-kind transfers: Evidence from the Supplemental Nutrition Assistance Program. American Journal of Agricultural Economics, 97(2), 390–404.
Bellotti J, Collins A, Owens C, Cabili C, Logan C, Climaco C, Paxton N, Relich P, Patrabansh S. 2011. Summer Electronic Benefits Transfer for Children: Early Experiences Through June 2011 of the Proof-of-Concept Year. Submitted to the U.S. Department of Agriculture, Food and Nutrition Service. Cambridge, MA: Abt Associates.
Briefel R, Collins A, Bellotti J, Klerman J, Logan CW, Cabili C, Rowe G, Greece J, Owens C, Weiss A. 2011. Congressional Status Report: Summer Electronic Benefits Transfer for Children Demonstrations. Submitted to the U.S. Department of Agriculture, Food and Nutrition Service. Cambridge, MA: Abt Associates.
Briefel R, Collins A, Rowe G, Wolf A, Klerman JA, Logan CW, Wulsin CS, Enver A, Owens C, Jacobson J, Bell S. 2012. Summer Electronic Benefits Transfer for Children (SEBTC) Demonstration: 2012 Congressional Status Report. Submitted to the U.S. Department of Agriculture, Food and Nutrition Service. Cambridge, MA: Abt Associates.
Briefel R, Collins A, Rowe G, Wolf A, Lyskawa J, Logan CW, Klerman JA, Fatima S. (unpublished). Summer Electronic Benefits Transfer for Children (SEBTC) Demonstration: 2013 Congressional Status Report. Submitted to the U.S. Department of Agriculture, Food and Nutrition Service. Cambridge, MA: Abt Associates.
Coleman-Jensen A, Gregory C, Singh A. (2014). Household Food Security in the United States in 2013 (ERS Report No. 173). Washington, DC: United States Department of Agriculture, Economic Research Service. http://www.ers.usda.gov/media/1565415/err173.pdf
Collins A, Briefel R, Klerman JA, Bell S, Bellotti J, Logan CW, Gordon A, Wolf A, Rowe G, McLaughlin SM, Enver A, Fernandes M, Wolfson C, Komarovksy M, Cabili C, Owens C. 2012. Summer Electronic Benefits Transfer for Children (SEBTC) Demonstration: Evaluation Findings for the Proof-of- Concept Year. U.S. Department of Agriculture, Food and Nutrition Service.
Collins AM, Briefel R, Klerman JA, Rowe G, Wolf A, Logan CW, Gordon A, Wolfson C, Enver A, l Owens C, Cabili C, Bell S. 2013. Summer Electronic Benefits Transfer for Children (SEBTC) Demonstration: Evaluation Findings for the Full Implementation Year.

References Page 68
Collins AM, Briefel R, Klerman JA, Wolf A, Rowe G, Enver A, Logan CW, Fatima S, Komarovksy M, Lyskawa J, Bell S. 2014. Summer Electronic Benefits Transfer for Children (SEBTC) Demonstration: Findings for the Third Implementation Year.
Economic Research Service. 2013. Current Population Survey Food Security Supplement Data Files: 2012. Available at: http://www.ers.usda.gov/data-products/food-security-in-the-united-states.aspx.
Economic Research Service. 2014. Food Security in the U.S. Survey Tools. Available at: http://www.ers.usda.gov/topics/food-nutrition-assistance/food-security-in-the-us/survey-tools.aspx.
Finney Rutten LJ, Yaroch AL, Colon-Ramos U, Johnson-Askew W, Story M. 2010. Poverty, food insecurity, and obesity: A conceptual framework for research, practice, and policy. Journal of Hunger & Environmental Nutrition, 5(4), 403-415.
Food and Nutrition Service. 2006. Analysis of Summer Food Service Program and Food Needs of Nonparticipating Children: Final Report. Special Nutrition Programs Report No. CN-06-SFSP. Available at: http://www.fns.usda.gov/Ora/menu/Published/CNP/FILES/SFSPFoodNeeds.pdf.
Food and Nutrition Service. 2015a. National School Lunch Program. Available at: http://www.fns.usda.gov/slp
Food and Nutrition Service. 2014b. School Breakfast Program. Available at: http://www.fns.usda.gov/sbp
Food and Nutrition Service. 2014c. Summer Food Service Program. Available at: http://www.fns.usda.gov/summer-food-service-program-sfsp.
Food and Nutrition Service. 2015d. Summer Food for Children Demonstrations. Available at: http://www.fns.usda.gov/Ora/menu/DemoProjects/SummerFood/Default.htm
Food and Nutrition Service. 2015. WIC EBT Activities. Available at: http://www.fns.usda.gov/wic/wic-ebt-activities
Food Research and Action Center. 2015a. Hunger Doesn't Take a Vacation: Summer Nutrition Status Report 2013. Available at: http://frac.org/pdf/2014_summer_nutrition_report.pdf
Food Research and Action Center. 2015b. Summer Meals Reaching Fewer Low-Income Children. http://frac.org/federal-foodnutrition-programs/summer-programs
Fox MK, Hamilton W, Lin B-H. 2004. Effects of Food Assistance and Nutrition Programs on Nutrition and Health: Volume 3, Literature Review (Food Assistance and Nutrition Research Report No. FANRR19-3). Washington, DC: Economic Research Service.
References Page 69
Gordon A, Briefel R. 2003. Feeding Low-income Children When School is Out. The Summer Food Service Program: Executive Summary. Food Assistance and Nutrition Research Report, no. 30. Washington, DC: U.S. Department of Agriculture, Economic Research Service.
Gundersen C, Kreider B, Pepper J. 2012. The impact of the National School Lunch Program on child health: A nonparametric bounds analysis. Journal of Econometrics 166(1), 79-91.
Gundersen C., Oliveira V. 2001. The food stamp program and food insufficiency. American Journal of Agricultural Economics 83(4), 875-887.
Herman DR, Harrison GG, Afifi AA, Jenks E. 2004. Effect of the WIC program on food security status of pregnant, first-time participants. Family Economics and Nutrition Review 16(1), 21.
Isacs JB. 2008. The costs of benefit delivery in the Food Stamp Program: Lessons from a cross-site analysis (Contractor and Cooperator Report No. 39). Washington, DC: Economic Research Service.
Kreider, B., Pepper, J. V., Gundersen, C., & Jolliffe, D. (2012). Identifying the effects of SNAP (Food Stamps) on child health outcomes when participation is endogenous and misreported. Journal of the American Statistical Association, 107(499), 958-975.
Mabli J, Worthington J. 2014. Supplemental Nutrition Assistance Program participation and child food security. Pediatrics. Advance online publication. doi: 10.1542/peds.2013-2823
Mykerezi E, Mills B. 2010. The impact of Food Stamp Program participation on household food insecurity. American Journal of Agricultural Economics 92(5), 1379-1391.
National Center for Education Statistics. 2014. Common Core of Data [Interactive database]. Washington, DC: Author. Available at: http://nces.ed.gov/
Nord M, Golla AM. 2009. Does SNAP decrease food insecurity? Untangling the self-selection effect. ERR-85. Washington, DC: US Department of Agriculture, Economic Research Service.
Nord M, Prell MA. 2011. Food security improved following the 2009 ARRA increase in SNAP benefits. Washington, DC: US Department of Agriculture, Economic Research Service.
Nord M, Romig K. 2006. Hunger in the summer: Seasonal food insecurity and the National School Lunch and Summer Food Service Programs. Journal of Children and Poverty 12(2),141-158.
Nord, M. 2013. Effects of the Decline in the Real Value of SNAP Benefits From 2009 to 2011. ERR-151. Washington, DC: US Department of Agriculture, Economic Research Service.
Ratcliffe C, McKernan S-M, Zhang S. 2011. How much does the Supplemental Nutrition Assistance Program reduce food insecurity?. American Journal of Agricultural Economics 93(4), 1082-1098.

References Page 70
Schmidt L, Sheppard LS, Watson T. 2013. The effect of safety net programs on food insecurity. No. w19558. Cambridge, MA: National Bureau of Economic Research.
Southworth HM. 1945. The Economics of Public Measures to Subsidize Food Consumption. Journal of Farm Economics, 27, 38-66.
U.S. Census Bureau. 2012. Current Population Survey, Annual Social and Economic Supplements. Table 4: Poverty Status of Families, by Type of Family, Presence of Related Children, Race, and Hispanic Origin: 1959 to 2013. Available at: http://www.census.gov/hhes/www/poverty/data/historical/hstpov4.xls. Retrieved December 1, 2014.
U.S. Department of Agriculture. 2014. Fresh Fruit and Vegetable Program. Available at: http://www.fns.usda.gov/ffvp/fresh-fruit-and-vegetable-program
U.S. Department of Agriculture. 2015. Food Groups Overview. Available at: http://www.choosemyplate.gov/food-groups/
U.S. Department of Agriculture, Center for Food Policy and Promotion. 2013. USDA Food Patterns. Available at: http://www.cnpp.usda.gov/USDAFoodPatterns.htm
U.S. Department of Agriculture, Supplemental Nutrition Assistance Program. 2013. SNAP Retailer Management 2013 Annual Report. Washington, DC: Author.
Yaktine AL, Caswell JA, eds. 2013. Supplemental Nutrition Assistance Program: Examining the Evidence to Define Benefit Adequacy. National Academies Press.

Appendix 1 Page 71
Appendix 1
SEBTC Food Package in Sites
Implementing the WIC Model

Appendix 1 Page 72
Standard SEBTC WIC Food Packages
Exhibit 1.A shows the standard WIC package issued to children ages 1–4 and compares it with the SEBTC food packages in WIC-model sites. Using Nielsen national price data, the standard SEBTC food package for $60 benefit households was valued at $46.81 in FY 2011 and $53.00 in FY 2012, and the food package for the $30 benefit households was valued at $26.57 in FY 2012.
The grantees implementing the WIC model worked with FNS to customize the packages to meet the tastes of the local population (for example, substituting whole grain tortillas for whole wheat bread) and to adjust for local food costs. For those reasons, the value of the SEBTC WIC benefit varied by site. The evaluation team imputed the value of benefits issued for each food category using the average cost per unit based on total quantity and dollars redeemed from the redemption data for that month in each site. The site-level value for the $60 benefit in FY 2012 ranged from $59.43 to $68.34. The value of the $30 benefit ranged from $27.75 to $32.21 in 2013. (See Appendix 1 in Collins et al., 2012, Collins et al., 2013, and Collins et al., 2014 for more details on the site-level value of the benefits in 2011, 2012, and 2013, respectively.)

Appendix 1 Page 73
Exhibit 1.A SEBTC Food Package in Sites Implementing the WIC Model
Substitutes or
Food Subgroup
WIC Package for 1-4 Year Olds $60 SEBTC Package $30 SEBTC Package
WIC Food Group Quantity Unit Quantity Unit Quantity Unit
Juice (100%) 128 Oz 64 Oz 0 --
Milk, low fat/nonfat 13 Qt 12 Qt 12 Qt
Cheese 1 Lb 1 Lb 0 --
Cereal, all 36 Oz 36 Oz 18 Oz
Eggs 1 Doz 1 Doz 1 Doz
Cash Value Voucher 6 $ 16 $ 8 $
Bread, whole wheat 2 Lb 3 Lb 1 Lb
Beans, dry 0.33 Lb 0.50 Lb 0.25 Lb
Bean, canned 21 Oz 32 Oz 16 Oz
Peanut Butter 6 Oz 18 Oz 9 Oz
Canned fish, all 0 -- 18 Oz 0 --
WIC Food Group Substitutes or
Food Subgroups FY 2011 Food Package
Cost in Dollars ($)
FY 2012 SEBTC $60 Food Package Cost in Dollars ($)
FY 2012 SEBTC $30 Food Package Cost in Dollars ($)
Juice (100%) 7.47 2.37 --
Milk, low fat/nonfat 12.14 9.60 9.60
Cheese 4.53 3.83 --
Cereal, all 7.77 6.20 3.10
Eggs 1.55 1.47 1.47
Cash Value Voucher 6.00 16.00 8.00
Bread, whole wheat 4.43 5.40 1.80
Beans, dry 0.51 0.67 0.33
Bean, canned 1.52 1.80 0.90
Peanut Butter 0.87 2.72 1.36
Canned fish, all 0.00 2.93 --
$46.81 $53.00 $26.57
Source: Provided by the USDA, FNS for FY2011 in December 2010 and revised for FY2012 in January 2013.
Note: Cash voucher is for fruits and vegetables. Totals may not equal the sum of the individual items due to rounding of the cost of individual items.


Appendix 2 Page 75
Appendix 2
Characteristics of SEBTC Sites

Appendix 2 Page 76
SEBTC Demonstration Site Characteristics
Exhibit 2.A provides a general overview of the grantee and site characteristics. (For more detailed information about the sites, see Collins et al., 2011; Collins et al., 2012; and Collins et al., 2013.)
Exhibit 2.A Characteristics of SEBTC Demonstration Sites
Site
Study Participation
No. of School Food
Author-ities Urbanicity
% of Children Eligible for FRP Meals
2
Approx. Number of
SEBTC Eligible
Children3
Program Model
Consent Process
20
11
20
12
20
13
20
14
Cherokee Nation X X 2012: 29 2014: 29
Rural 54 to 93 2012: 17,500 2014: 17,500
WIC Passive
Chickasaw Nation X X 2012: 41 2013: 41
Rural 2012: 30 to 96
2013: 35 to 100 2012: 22,000 2013: 21,600
WIC Active
Connecticut: Windham, Tolland, and New London Counties1
X X 2011: 17 2012: 28
Mostly rural 10 to 73 2011: 11,000 2012: 17,500
SNAP Active Connecticut: Hartford, Litchfield and New Haven Counties
X 2012: 6 Urban and
rural 1 to 70 22,000
Delaware1 X X 2012: 4
2013: 19 Urban and
rural 2012: 21 to 60
2013: 50 2012: 24,000 2013: 64,400
SNAP Active
Michigan: Detroit X X 2013: 1 2014: 1
Urban 2013: 1004 2014: 1004
2013: 32,000 2014: 32,000
WIC Active5 Michigan: Grand Rapids/Kentwood1
X X X 2011: 1 2012: 1 2013: 2
Urban 2011: 80 2012: 86
2013: 60 to 85
2011: 16,000 2012: 16,500 2013: 23,000
Michigan: Mid-Michigan X X 2012: 32 2013: 32
Rural 2012: 31 to 59 2013: 31 to 59
2012: 21,000 2013: 21,000
Missouri: Kansas City X X 2011: 3 2012: 3
Mostly urban 2011: 74 to 87 2012: 74 to 88
2011: 20,000 2012: 22,500 SNAP Passive
Missouri: St. Louis X 2012:1 Urban 82 22,000
Nevada X 2012:3 Urban and
rural 35 to 48 24,000 WIC Passive
Oregon: Linn, Jefferson, and Deschutes Counties1
X X 2011: 9
2012: 12 Mostly rural 40 to 81
2011: 13,000 2012: 24, 500
SNAP Active5 Oregon: Marion County X 2012: 1 Urban 60 24,000
Oregon: Portland X X 2013: 1 2014: 1
Urban 2013: 46 2014: 46
2013: 21,700 2014: 21,700
Texas X X 2011: 1 2012: 1
Mostly urban 2011: 83 2012: 82
2011: 38,000 2012: 37,000
WIC Passive
Washington X 2012: 2 Urban 47 29,500 SNAP Active
Source: Grant proposal documents and technical assistance efforts with grantees, 2011-2014. 1Several sites expanded to new areas during the demonstration; (Connecticut and Oregon expanded in 2012 and Grand Rapids
and Delaware expanded in 2013). 2Approximations based on information on children eligible for FRP meals provided by grantees and SFAs.
3Calculation based on information provided by grantees during technical assistance efforts.
4Detroit Public Schools (DPS) participate in the USDA Community Eligibility Provision (CEP), which provided free meals to all
children in all schools in the district due to the high poverty level in the area. 5Used passive consent in 2014.

Appendix 2 Page 77
SEBTC Costs by Site
Exhibit 2.B provides information about site level costs for SEBTC sites in 2012. (For more detailed information see Collins et al., 2013.)
Exhibit 2.B Average Total Cost Per Child and Household
Children Issued Benefits Households Issued Benefits
Total costs $
Number of Children
Average Cost per Child ($)
Number of Households
Average Cost Per Household ($)
Cherokee Nation 770,855 5,838 132 3,635 212
Chickasaw Nation 1,345,159 5,355 251 2,592 519
Connecticut: Windham, Tolland, and New London Counties
1
778,872 4,486 174 2,345 332
Connecticut: Hartford, Litchfield, and New Haven Counties
496,872 2,636 188 1,273 390
Delaware 1,167,795 5,307 220 2,864 408
Michigan: Grand Rapids 856,792 5,368 160 3,042 282
Michigan: Mid-Michigan 1,181,363 5,365 220 2,784 424
Missouri: Kansas City 1,112,552 5,452 204 3,056 364
Missouri: St. Louis 1,094,301 5,353 204 3,374 324
Nevada 954,187 5,431 176 3,295 290
Oregon: Linn, Jefferson, and Deschutes Counties
1
841,935 3,511 240 1,849 455
Oregon: Marion County 815,396 3,553 229 1,805 452
Texas 963,731 5,751 168 3,430 281
Washington 851,399 3,366 253 1,612 528
All sites 13,232,208 66,772 201 36,956 376 Sources: Administrative cost data from SEBTC grantees and partners, 2012. Expenditure reports of grantees and other agencies, supplemented with staff responses to questions and published data. EBT issuance and redemption data provided by grantees.
Note: Averages for all sites were computed with equal weight for each site, so the average cost per child or household does not equal the total cost divided by total children or households.


Appendix 3 Page 79
Appendix 3
SEBTC Benefit Use: Findings by Cohort
and Regression Analysis Description
Methods and Results

Appendix 3 Page 80
Overview
As described in Chapter 3, the EBT analysis uses five cohorts of SEBTC transaction data representing the households in the 2011, 2012, 2013, and 2014 evaluations, as well as households who were issued benefits in 2013 but not included in the initial evaluation that year (referred to as 2013 non-evaluation households). Chapter 3 provides summary information about rates of household participation (i.e., percentage of all demonstration households that redeemed any benefits in the summer); the benefit redemption rate (i.e., percentage of SEBTC benefits redeemed over the summer) and the benefit exhaustion rate (i.e., proportion of households that redeemed all of their benefits in at least one month during the summer) for all five cohorts combined. In SNAP-model sites, a household exhausted their benefits if they redeemed 100 percent of the available benefit for the month. In the WIC-model sites, households were considered to have exhausted their benefits if they redeemed their entire credit for fruits and vegetables and if they redeemed enough of their benefits in all other food categories that they could not purchase any more food in any food category.
This appendix provides supplementary information for the descriptive findings presented in Chapter 3. Additional detail is provided on:
Data processing methods and checks performed on EBT analysis files The method used to combine EBT use outcomes across cohorts WIC quantity exhaustion thresholds Cohort-level EBT use descriptive findings Differences in EBT use patterns among $30 benefit households between SNAP-model and
WIC-model sites and Methods and full results of the EBT regression analysis that associated household
characteristics with patterns of EBT use.
EBT Data Processing and Checks of Household-level Analysis Files
For each year, the evaluation team obtained the transaction data from each State’s EBT system, which tracks the SEBTC benefits of participating households. For each grantee, the EBT system provided data on when and where benefits were redeemed, the amount spent for each transaction, the proportion of benefits redeemed each month, and for those households that exhausted the benefit (i.e., redeemed 100% of it), when this occurred.
Grantees using the SNAP model provided data on the date, time, and dollar value of each credit and debit to the account. Credits include issuances, returns credited by retailers, and adjustments for processing errors. Debits include purchases, cancelled issuances, and adjustments. A purchase transaction represents the total amount spent in a particular location at one time for any number of SNAP-eligible items.

Appendix 3 Page 81
Grantees using the WIC model also provided data on the date, time, and dollar value of each transaction. The data for these sites permit the analysis of redemptions at the food category level. Unlike the SNAP data, the WIC data have separate issuance transactions indicating the quantity issued for each category of foods. In the WIC data, for each time a household made a purchase, there is a separate transaction record for each category of foods purchased with data indicating the quantity and the dollar amount paid to the retailer for the food items. The original issuance data did not include the dollar value of benefits issued, so the average cost per unit for each food category was imputed, based upon the redemption data.
From these raw EBT data, the evaluation team created analysis files that included a record for each household in each month by summing the value of transactions by type (issuances, redemptions, and other credits and debits). The analysis files included constructed variables for monthly issuances, redemptions, whether a household exhausted their benefits, and if so, the number of days taken to spend all of the benefit. The dollar value of WIC benefits issued was determined from the quantities of foods and their average purchase price.
Various data checks were performed during the process of aggregating transaction records to monthly issuance and purchase amounts for each evaluation household. The raw SEBTC transaction data were checked for missing information and inconsistencies, and the created household-level variables were checked for consistency with the transaction data. For instance, constructed variables for monthly net available benefit and redemption amounts per household were checked for accuracy in the SNAP sites. The calculated account balance (difference between net benefits and net redemptions) was compared to the account balance from the raw data after the last transaction of the monthly benefit cycle. If balances did not match, the transaction data were investigated for missing records or records where the settlement time may have been after the transaction time at the end of the cycle.
Additional checks were performed for the 2013 evaluation, where the SEBTC implementation compared impacts of the $60 benefit to the $30 benefit. For the WIC-model sites, the issuance data were checked to confirm that the quantity issued per household was consistent with the household’s assigned benefit package. WIC SEBTC data contained child-level records for each food item issued. The evaluation team checked whether the issuance amounts per child matched the household’s assigned benefit group. For cases with discrepancies between the issuance data and assigned benefit group, further investigation determined whether children in the same household were assigned to different benefit groups. Only a handful of households in Chickasaw Nation and Michigan received an incorrect or mixed package. Similar checks to confirm that households were issued the correct benefit package could not be performed in the SNAP-model sites, because the data did not provide child-level issuance information or the number of children in each household. Moreover, site update information on the number of children receiving benefits was not always sufficient or consistent with the SEBTC issuance data.

Appendix 3 Page 82
Pooling Results across Cohorts
The results presented in this report are pooled EBT benefit use outcomes across all years of the SEBTC implementation. Participation, redemption and exhaustion rates were calculated by taking a weighted average of the respective outcomes across the different cohorts. For the analysis of households that received the $60 per eligible child benefit, the weight for a cohort was computed as the ratio of households issued the $60 benefit in that cohort to the total number of households issued the $60 benefit across all cohorts. Weights for the $30 benefit analysis were calculated similarly. For WIC-specific outcomes, such as the redemption of food categories in the WIC SEBTC package, weights were computed by using the total number of households in the WIC-model sites as the base. Likewise for the differences in outcomes between SEBTC models, weights for SNAP-model households were calculated using the total number of households in the SNAP-model sites.
Benefit Exhaustion Thresholds in WIC-Model Sites
This section provides the minimum remaining quantities in SEBTC-WIC accounts used in the analysis determining when households exhausted their SEBTC-WIC benefits for the month. We present the threshold amounts for the 2012 (Exhibit 3A) and 2013 (Exhibit 3B) evaluations. For each site and each food category, the amount listed in the exhibits is the minimum quantity that participants could purchase with their benefits, based on the approved foods list. For example, the minimum amount of tuna or salmon that a participant could buy during the 2013 implementation was 3.75 ounces in Chickasaw but 5 ounces in Michigan. These minimum purchase amounts were determined by examining the State’s WIC food list and the observed purchase amounts. If a participant had less than the minimum purchase amount for a food category remaining in their SEBTC account before the end of the month, that participant was determined to have exhausted benefits for that category. Participants who exhausted benefits for every category in a month were determined to have exhausted all of their benefits for the month.
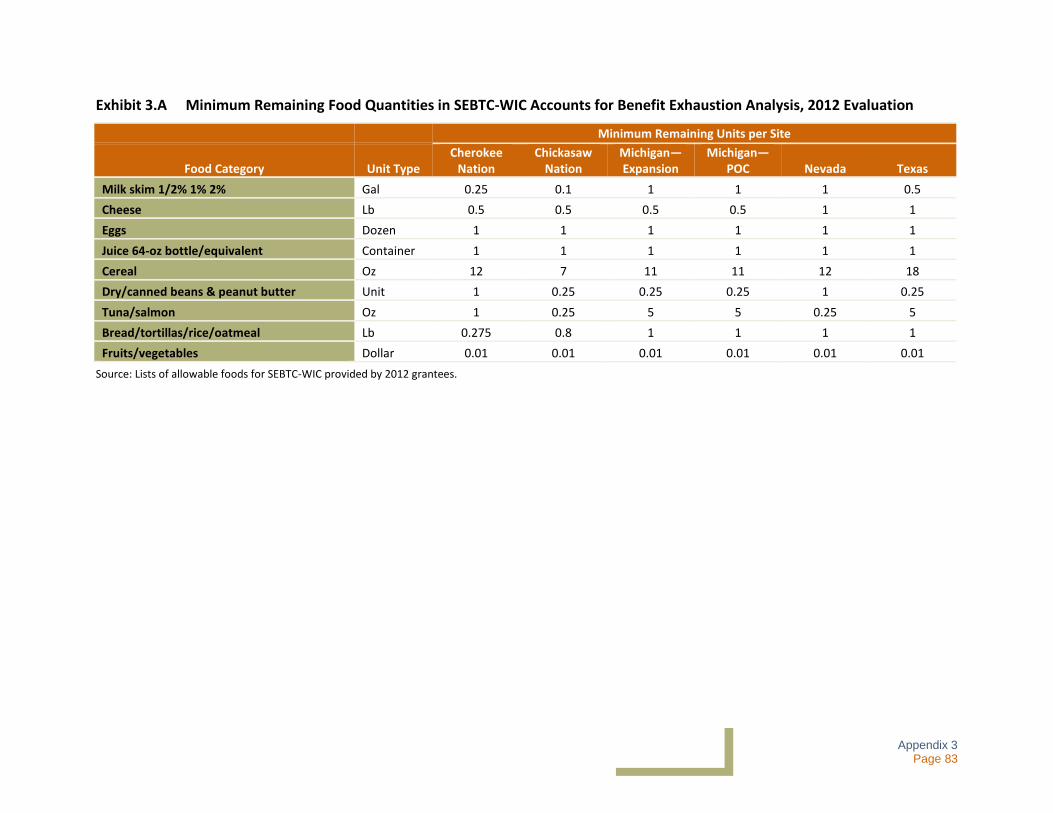
Appendix 3 Page 83
Exhibit 3.A Minimum Remaining Food Quantities in SEBTC-WIC Accounts for Benefit Exhaustion Analysis, 2012 Evaluation
Minimum Remaining Units per Site
Food Category Unit Type Cherokee
Nation Chickasaw
Nation Michigan—Expansion
Michigan—POC Nevada Texas
Milk skim 1/2% 1% 2% Gal 0.25 0.1 1 1 1 0.5
Cheese Lb 0.5 0.5 0.5 0.5 1 1
Eggs Dozen 1 1 1 1 1 1
Juice 64-oz bottle/equivalent Container 1 1 1 1 1 1
Cereal Oz 12 7 11 11 12 18
Dry/canned beans & peanut butter Unit 1 0.25 0.25 0.25 1 0.25
Tuna/salmon Oz 1 0.25 5 5 0.25 5
Bread/tortillas/rice/oatmeal Lb 0.275 0.8 1 1 1 1
Fruits/vegetables Dollar 0.01 0.01 0.01 0.01 0.01 0.01
Source: Lists of allowable foods for SEBTC-WIC provided by 2012 grantees.

Appendix 3 Page 84
Exhibit 3.B Minimum Remaining Food Quantities in SEBTC-WIC Accounts for Benefit Exhaustion Analysis, 2013 Evaluation
Minimum Remaining Units per Site
Food Category Unit Type Chickasaw Michigan—
Detroit
Michigan— Grand Rapids /Kentwood
Mid-Michigan
Milk: skim, 1/2%, 1%, 2% Gal 0.18 1 1 1
Cheese Lb 0.5 0.5 0.5 0.5
Eggs Dozen 1 1 1 1
Juice 64-oz bottle/ equivalent
Container 1 1 1 1
Cereal Oz 7 11 11 11
Dry/canned beans & peanut butter
Unit 0.25 0.25 0.25 0.25
Tuna/salmon Oz 3.75 5 5 5
Bread/tortillas/rice/ oatmeal
Lb 0.8 1 1 1
Fruits/vegetables Dollar 0.01 0.01 0.01 0.01 Sources: State WIC Food Lists and SEBTC WIC transaction data, 2013.
Descriptive SEBTC Findings by Cohort
This section of the appendix provides descriptive findings by cohort. Specifically, the following exhibits provide information by cohort for the following measures:
Exhibit 3.C: rates of SEBTC participation for $60 benefit households. Exhibit 3.D: rates of SEBTC participation for $30 benefit households. Exhibit 3.E: SEBTC redemption rates for $60 benefit households. Exhibit 3.F: SEBTC redemption rates for $30 benefit households. Exhibit 3.G: redemption rates of WIC food categories by cohort for sites implementing the
WIC model for $60 benefit households. Exhibit 3.H: redemption rates of WIC food categories by cohort for sites implementing the
WIC model for $30 benefit households. Exhibit 3.I: SEBTC benefit exhaustion rate for $60 benefit households. Exhibit 3.J: SEBTC benefit exhaustion rate for $30 benefit households.

Appendix 3 Page 85
Exhibit 3.C Participation of Households and Children in SEBTC, by Cohort, $60 Benefit Amount (2011-2014)
Cohort
Households Issued Benefits Children Issued Benefits
Number
Percent Participating (Redeeming
Benefits) Number
Percent in Participating Households
2011 6,968 90.0% 12,463 91.6% 2012 36,956 89.7% 66,772 91.5%
2013Ea 11,284 93.1% 21,066 93.5%
2013NEb 27,977 88.3% 50,315 90.5%
2014 6,191 81.6% 11,623 83.5% All Cohorts 89,376 89.1% 162,239 90.9%
Source: SEBTC benefit use data analyses for the 2011, 2012 and 2013 evaluation (2013E) reports; 2013 EBT data from non-evaluation households (2013NE) and 2014 EBT data.
Note: 2011 included 3 SNAP sites and 2 WIC sites. 2012 included 8 SNAP sites and 6 WIC sites. 2013 non-evaluation (2013NE) included 7 SNAP sites and 6 WIC sites. 2013 evaluation (2013E) included 2 SNAP sites and 4 WIC sites. 2014 included 1 SNAP site and 2 WIC sites. aHouseholds participating in the 2013 evaluation
bHouseholds receiving SEBTC benefits in 2013 but not participating in the evaluation
Exhibit 3.D Participation of Households and Children in SEBTC, by Cohort, $30 Benefit Amount (2013-2014)
Cohort
Households Issued Benefits Children Issued Benefits
Number
Percent Participating (Redeeming
Benefits) Number
Percent in Participating Households
2013Ea 11,393 91.3% 21,322 92.4%
2014 4,147 84.6% 8,320 85.0%
All Cohorts 15,540 89.5% 29,642 90.4% Source: SEBTC benefit use data analyses for 2013 and 2014 EBT data.
Note: 2013 evaluation included 2 SNAP sites and 4 WIC sites. 2014 included 1 SNAP site and 2 WIC sites. aHouseholds participating in the 2013 evaluation

Appendix 3 Page 86
Exhibit 3.E SEBTC Benefit Redemption, by Cohort, $60 Benefit Amount (2011-2014)
Cohort
Mean Percentage of Dollars Redeemed Mean $ Redeemed per
(All Households)
Mean $ Redeemed per Child
(All Households) All Households Participating Households
2011 80.4% 89.4% $235 $127
2012 76.7% 85.5% $250 $135
2013Ea 74.4% 81.6% $258 $134
2013NEb
77.1% 87.3% $243 $133
2014 67.2% 82.3% $235 $122
All Cohorts 76.2% 85.7% $247 $133 Source: SEBTC benefit use data analyses for the 2011, 2012 and 2013 evaluation (2013E) reports; 2013 EBT data from non-evaluation households (2013NE) and 2014 EBT data (n=89,376). 2013E and 2014 results exclude households getting $30 per month per child.
For sites using the WIC model, the value of benefits issued was computed using the average prices paid for foods in each site.
Notes: 2011 included 3 SNAP sites and 2 WIC sites. 2012 included 8 SNAP sites and 6 WIC sites. 2013 non-evaluation (2013NE) included 7 SNAP sites and 6 WIC sites. 2013 evaluation (2013E) included 2 SNAP sites and 4 WIC sites. 2014 included 1 SNAP site and 2 WIC sites.
The mean dollars redeemed per child and per household as reported here for 2012 differ from the benefit costs per child and per household reported for 2012 in Exhibit 2.4 and 2.5. Exhibit 3.B provides the means of the dollars redeemed per child and per household over all households. These figures differ by definition from the figures reported in Exhibit 2.4 and 2.5, which were computed by dividing the total benefits redeemed by the numbers of children and households issued benefits.
The mean dollars redeemed per child in Exhibit 3.B are for all households issued benefits. In the 2012 evaluation report, Exhibit X provided the mean dollars redeemed per child for all households redeeming benefits, but this figure was mislabeled as representing all households issued benefits. aHouseholds participating in the 2013 evaluation
bHouseholds receiving SEBTC benefits in 2013 but not participating in the evaluation
Exhibit 3.F SEBTC Benefit Redemption, by Cohort, $30 Benefit Amount (2013-2014)
Cohort
Mean Percentage of Dollars Redeemed Mean $ Redeemed per
(All Households)
Mean $ Redeemed per Child
(All Households) All Households Participating Households
2013Ea 72.4% 80.6% $124 $64
2014 70.7% 83.5% $124 $62
All Cohorts 71.9% 81.4% $124 $63 Source: SEBTC benefit use data analyses for 2013 and 2014 EBT data (n=15,540).
Note: 2013 evaluation included 2 SNAP sites and 4 WIC sites. 2014 included 1 SNAP site and 2 WIC sites. aHouseholds participating in the 2013 evaluation

Appendix 3 Page 87
Exhibit 3.G Rates of Redemption for WIC Food Categories, by Cohort (ordered by average for all cohorts), $60 Benefit Amount (2011-2014)
Food Type 2011 2012 2013
Evaluationa
2013 Non- Evaluation
b
2014 All Cohorts
Juice (64 oz bottle or equivalent)
74.1% 81.9% 76.6% 70.7% 66.4% 75.9%
Cheese 70.0% 82.0% 74.5% 72.0% 65.6% 75.7%
Eggs 74.8% 81.0% 77.1% 70.0% 65.7% 75.3%
Milk (skim, 1/2%, 1%, 2%)
71.7% 78.6% 70.7% 68.6% 59.4% 72.3%
Fruits and vegetables 70.8% 76.1% 72.8% 68.6% 61.3% 71.7%
Cereal 66.7% 73.9% 65.8% 65.1% 58.8% 68.3%
Fish (canned tuna or salmon)
60.6% 68.4% 64.3% 56.7% 55.3% 62.6%
Dry or canned beans & peanut butter
57.1% 67.2% 57.4% 51.0% 46.4% 58.5%
Grain products (bread, tortillas, rice, oatmeal)
52.6% 61.6% 50.4% 53.1% 57.9% 56.8%
All Foods (Total) 67.1% 71.8% 67.3% 64.1% 57.9% 67.3%
Source: SEBTC benefit use data analyses for the 2011, 2012 and 2013 evaluation (2013E) reports; 2013 EBT data from non-evaluation households (2013NE) and 2014 EBT data (n=89,376). 2013E and 2014 results exclude households getting $30 per month per child.
Note: 2011 included 2 WIC sites. 2012 included 6 WIC sites. 2013 non-evaluation (2013NE) included 6 WIC sites. 2013 evaluation (2013E) included 4 WIC sites. 2014 included 1 SNAP site and 2 WIC sites. aHouseholds participating in the 2013 evaluation
bHouseholds receiving SEBTC benefits in 2013 but not participating in the evaluation
Exhibit 3.H Rates of Redemption for WIC Food Categories, by Cohort (ordered by average for all cohorts), $30 Benefit Amount (2013-2014)
Food Type 2013 Evaluationa 2014 All Cohorts
Eggs 72.5% 59.5% 68.7%
Fruits/vegetables 70.5% 59.0% 67.2%
Milk—skim, 1/2%, 1%, 2% 66.2% 51.8% 62.0%
Cereal 62.9% 55.9% 60.9%
Bread/tortillas/rice/oatmeal 60.3% 55.1% 58.8%
Dry/canned beans and peanut butter 54.2% 40.1% 50.1%
Total 65.6% 53.9% 62.2% Source: SEBTC benefit use data analyses for 2013 and 2014 EBT data (n=15,540).
Note: 2013 evaluation included 4 WIC sites. 2014 included 2 WIC sites. aHouseholds participating in the 2013 evaluation

Appendix 3 Page 88
Exhibit 3.I Percent of Households Exhausting Benefits in one or more summer months, by Cohort, $60 Benefit Amount (2011-2014)
Cohort All Sites SNAP Sites WIC Sites
2011 57.0% 81.4% 22.5%
2012 44.7% 81.2% 9.4%
2013Ea 36.1% 73.8% 15.8%
2013NEb 47.3% 79.62% 13.5%
2014 31.9% 90.9% 7.6%
All cohorts 44.5% 80.1% 12.1% Source: SEBTC benefit use data analyses for the 2011, 2012 and 2013 evaluation (2013E) reports; 2013 EBT data from non-evaluation households (2013 NE) and 2014 EBT data (n=89,376). 2013E and 2014 results exclude households getting $30 per month per child.
Notes: 2011 included 3 SNAP sites and 2 WIC sites. 2012 included 8 SNAP sites and 6 WIC sites. 2013 non-evaluation (2013NE) included 7 SNAP sites and 6 WIC sites. 2013 evaluation (2013E) included 2 SNAP sites and 4 WIC sites. 2014 included 1 SNAP site and 2 WIC sites. aHouseholds participating in the 2013 evaluation
bHouseholds receiving SEBTC benefits in 2013 but not participating in the evaluation
Exhibit 3.J Percent of Households Exhausting Benefits in one or more summer months, by Cohort, $30 Benefit Amount (2013-2014)
Cohort All Sites SNAP Sites WIC Sites
2013Ea 43.2% 74.8% 25.9%
2014 52.1% 88.5% 22.6%
All cohorts 45.6% 78.1% 24.9% Source: SEBTC benefit use data analyses for 2013 and 2014 EBT data (n=15,540).
Note: 2013 evaluation included 2 SNAP sites and 4 WIC sites. 2014 included 1 SNAP site and 2 WIC sites. aHouseholds participating in the 2013 evaluation

Appendix 3 Page 89
Differences in EBT Use Patterns between SNAP-Model and WIC-Model Sites, Among $30 Benefit Households
Exhibit 3.K provides descriptive information about the rates of SEBTC participation redemption and exhaustion for the group receiving the $30 per monthly child benefit by the WIC and SNAP models. These rates are very similar to those for the $60 benefit group (Section 3.2).
Exhibit 3.K SEBTC Participation, Redemption, and Benefit Exhaustion Rates for SNAP and WIC-Model Sites, All Cohorts, $30 Benefit Amount (2013-2014)
Households Issued
Benefits Children in Households
Issued Benefits Percent of Dollars
Redeemed
Exhausted Benefits in
One or More
Months
Site Type Number
Percent Participating (Redeeming
Benefits) Number
Percent Participating (Redeeming
Benefits) All
Households Participating Households
% Households
SNAP Sites 7,749 95.2% 14,046 96.0% 91.5% 95.7% 78.0%
WIC Sites 7,791 83.9% 15,596 85.3% 59.6% 65.9% 24.9%
All Sites 15,540 89.5% 29,642 90.4% 71.9% 81.4% 45.6% Source: SEBTC benefit use data analyses for 2013 and 2014 EBT data.
Note: 2013 evaluation included 2 SNAP sites and 4 WIC sites. 2014 included 1 SNAP site and 2 WIC sites. EBT Regression Analysis
The evaluation team used regression models to investigate the relationship of SEBTC benefit use to the characteristics of demonstration households and sites. This appendix presents the methods used in the regression analysis of SEBTC benefit use and the estimated regression results. The evaluation team estimated regression models of the three measures of SEBTC benefit (participation, redemption, and exhaustion) summarized in Exhibit 3.L.
Exhibit 3.L SEBTC Benefit Use Outcome Variables
Outcome Variable Name Definition
Participation rate Whether the household participated in SEBTC or not
Redemption rate Redemptions as a percentage of available benefits for the month
Benefit exhaustion rate Whether the household exhausted benefits or not during the month
A household was considered to have participated in SEBTC if they redeemed benefits at any time in the summer. The redemption rate is the percentage of benefits redeemed as a share of total available benefits for the month. Redemption rates are calculated only for participating households. The benefit exhaustion analysis examined the incidence of households exhausting their benefits in each monthly cycle. (The definition of exhaustion in SNAP- and WIC-model sites is discussed in the previous section on descriptive findings.)

Appendix 3 Page 90
This section of the appendix provides a brief description of the data and methods, including the sample, outcome variables (i.e., the measures of benefit use), control variables, and models. The final section presents the regression estimates in tabular form.
Data and Methods
To conduct the regression analysis of benefit use, the team merged the EBT transaction data with data on the characteristics of households in the treatment group that responded to the spring 2012 survey. The final sample of households used in the regression analyses comprised 13,100 households from 13 of the 14 demonstration sites, excluding the Cherokee Nation.65 The data were weighted to adjust for sampling and non-response in the spring.
Household characteristics collected in the spring survey were hypothesized to have a potential association with the outcome variables. The relevant characteristics included the demographics of the primary caretaker, household composition, educational attainment, employment status and monthly income relative to poverty, food security status, and participation in food assistance programs. The models of redemption and benefit exhaustion used monthly data and included controls for the month, given the observed variation by month in the aggregate data.66 The number of days in the monthly issuance cycles varied by month and by site, and in Chickasaw Nation, the cycles varied by school food authorities (SFAs) as well. Therefore these models controlled for the length of the cycle period.67
The evaluation team estimated two sets of models to test for how implementation of SEBTC influenced household SEBTC participation, benefit redemption, benefit exhaustion, and time to benefit exhaustion. Both sets of models included the same set of spring (pre-SEBTC) household characteristics, including participation in food assistance programs, food insecurity, and demographics. The first set of models included site-specific indicators (with Texas as the omitted site). This specification was used to explore the extent to which site differences in SEBTC benefit use, as observed in the descriptive analysis, persisted after controlling for differences in household characteristics across the sites. The second set of estimation models replaced the site-specific indicators with indicators for whether the site used the SEBTC WIC model (for comparison to the SEBTC SNAP model) and whether the site used passive consent (for comparison to sites with active consent).
The second set of models was used to test whether differences in benefit use outcomes were related to the different approaches used to implement SEBTC. Since the second set of estimation models did not account for systematic differences among sites other than the two
65
The Cherokee Nation was excluded from all impact analysis because it had a low spring survey response rate. 66
The participation model used a single observation per household for the summer, so month effects were not estimated for this outcome. 67
The lengths of the benefit cycles as reported in Chapter 2 include periods when a full month and a partial month were combined for analysis. These extended periods were used for modeling redemption rates. However, only periods representing a calendar month were used for modeling benefit exhaustion analysis, because it was expected that redemption patterns in partial months would not be comparable to those in full months.

Appendix 3 Page 91
implementation variables and the household characteristics, there is greater confidence in the results from the first and more inclusive set of models, which have site-specific effects. Nevertheless, the results from the second set of models (those without site-specific effects) help to interpret both the site differences observed in the aggregate descriptive analysis and the site-specific effects estimated in the first set of models.
The regression models were not meant to test causal hypotheses. The purpose of this analysis was to explore the factors associated with variations in benefit use, because these factors help us understand who was using SEBTC most fully. In the case of the regression models that control for whether SEBTC is WIC or used passive consent, the implementation study suggested possible causal pathways in the interpretation of the descriptive results. However, since households were not randomly assigned to SEBTC models, the analysis can only provide suggestive evidence that these factors were or were not at work.
The models for the continuous outcome variables (the redemption rate and days to benefit exhaustion) were estimated using ordinary least-squares (OLS) regression. Logistic regression (logit) models were used to analyze participation and benefit exhaustion rates, and odds ratios were computed from the estimated coefficients.
Regression Results
Exhibit 3.M presents the results of the three models of participation rate, redemption rate, and benefit exhaustion that include indicators for the sites. Exhibit 3.M presents the models that replace the site indicators with program indicators for the WIC model and passive consent model.
Exhibit 3.M Parameter Estimates for the Three Models with Site Indicators
1.Participation Rate
2. Redemption Rate (Among Participating
Households) 3. Benefit Exhaustion
Rate
Odds Ratio Parameter Estimate Odds Ratio
Chickasaw Nation 4.31 *** -8.15 *** 0.04 ***
Connecticut: Windham, Tolland, and New London Counties
1
3.14 **
6.19 *** 3.13 ***
Connecticut: Hartford, Litchfield, and New Haven Counties
7.31 ***
7.40 *** 2.84 ***
Delaware 6.64 *** 6.73 *** 3.22 ***
Michigan: Grand Rapids/Kentwood
1
2.88 ***
-14.35 *** 0.26 ***
Michigan: Mid-Michigan 6.51 *** -14.68 *** 0.07 ***
Missouri: Kansas City 3.99 *** 7.93 *** 9.95 ***
Missouri: St. Louis 2.81 *** 8.45 *** 12.72 ***
Nevada 1.57 ** -23.49 *** 0.00 ***
Oregon: Linn, Jefferson, and Deschutes Counties
1
9.68 ***
6.90 *** 10.35 ***
Oregon: Marion County 17.05 *** 7.22 *** 11.90 ***

Appendix 3 Page 92
1.Participation Rate
2. Redemption Rate (Among Participating
Households) 3. Benefit Exhaustion
Rate
Odds Ratio Parameter Estimate Odds Ratio
Washington 9.09 *** 4.67 *** 1.65 ***
June 0.67 *** 0.85 ***
July 1.22 *** 1.05
Number of days in benefit cycle
0.09 *** 1.04 ***
Black 1.82 ** -0.12 0.86 ***
Hispanic 0.66 * 0.02 0.86 ***
Less than a high school education
0.93
-0.03 0.94
Number of adults 0.95 0.02 0.97 *
Only female caretaker 0.89 -1.18 *** 0.95
Only male caretaker 0.33 *** -2.41 *** 0.75 ***
Age of oldest child less than 21 years
1.00
0.23 *** 0.99
Number of children 1.10 * -0.12 1.06 ***
Employment status 0.61 *** -0.59 ** 0.99
Relative income to poverty line
1.33
0.89 * 1.03
Relative income to poverty line squared
0.94
-0.16 1.01
Low food security at baseline household
1.48 ***
0.99 *** 1.08 *
Very low food security at baseline household
0.96
0.21 0.95
Free/reduced breakfast 0.90 0.21 0.85 ***
SNAP household 1.42 ** 0.86 *** 1.37 ***
WIC household 0.91 0.15 1.00
Number of observations 13,100 35,438 38,999 Source: From regression models estimated on pooled SEBTC Spring and Summer Surveys from 2012 and SEBTC transaction data from 2012.
*.05 < p < .10, **.01 < p < .05, ***p <. 01
Notes: The sample used for the Participation Rate model had one observation per household for the entire summer. The sample used for the Redemption Rate model had at most three observations per household. It included one observation for each month in which a household redeemed benefits. The sample used for the Benefit Exhaustion Rate analysis had at most three observations per household. It included one observation for each month in which a household received a benefit. The omitted category for the month indicators is August, and the omitted category for the site indicators is Texas. Data are missing from Cherokee Nation because of a low spring response rate in 2012.

Appendix 3 Page 93
Exhibit 3.N Parameter Estimates for the Three Models with WIC model and Passive Consent Indicators
1.Participation Rate
2. Redemption Rate (among participating)
3. Benefit Exhaustion Rate
Odds Ratio Parameter Estimate Odds Ratio
WIC site 0.48 *** -19.29 *** 0.03 ***
Passive consent 0.38 *** 0.19 3.07 ***
June 0.60 ** 0.92 *
July 1.37 *** 1.06
Number of days in benefit cycle 0.02 1.04 ***
Black 1.75 ** 0.92 *** 0.81 ***
Hispanic 0.52 *** 2.38 *** 1.06
Less than a high school education 1.02 -0.99 *** 0.93 *
Number of adults 0.95 0.09 0.97 *
Only female caretaker 0.85 -0.86 *** 0.90 ***
Only male caretaker 0.34 *** -1.98 *** 0.79 **
Age of oldest child less than 21 years 1.00 0.26 *** 1.00
Number of children 1.11 ** -0.37 *** 1.03 **
Employment status 0.62 *** -0.60 ** 0.95
Relative income to poverty line 1.30 0.80 * 1.03
Relative income to poverty line squared 0.94 -0.09 1.01
Low food security at baseline-household 1.50 *** 0.59 ** 1.07 *
Very low food security at baseline- household 0.96 -0.21 0.93 *
Free/Reduced Breakfast 0.91 1.20 *** 0.89 **
SNAP household 1.42 ** 0.83 *** 1.49 ***
WIC household 0.92 0.17 1.06
Number of observations 13100 35438 38999 Source: From regression models estimated on pooled SEBTC Spring and Summer Surveys from 2012 and SEBTC transaction data from 2012.
*.05 < p < .10, **.01 < p < .05, ***p <. 01
Notes: The sample used for the Participating Rate model had one observation per household for the entire Summer. The sample used for the Redemption Rate model had at most three observations per household. It included one observation for each month in which a household redeemed benefits. The sample used for the Benefit Exhaustion Rate analysis had at most three observations per household. It included one observation for each month in which a household received a benefit.


Appendix 4 Page 95
Appendix 4
Summary of Impact Data and Methods

Appendix 4 Page 96
Overview
This appendix provides additional detail on the impact analysis results presented in Chapter 4. The appendix begins with a description of random assignment, data collection, and survey response rates. It then discusses the pooled analyses file for those analyses and additional detail on analytic methods. Finally, it presents additional details on impact findings. (For more details on these topics, see Collins et al., 2012; Collins et al., 2013; and Collins et al., 2014.)
Random Assignment and Data Collection
Random Assignment
The impact analysis relied on random assignment of households that provided consent to various treatment conditions. In 2011 and 2012, participating school food authorities (SFAs) at each site constructed lists of households with children certified for FRP meals. After obtaining consent from the families of those children (by either passive or active processes), the SFAs or their grantees sent the lists of consenting households to the evaluation team. The team then randomly assigned the families of the consented children to be in the $60 benefit group or the no-benefit group.
In 2011 and 2012 in most of the participating sites (five sites participated in 2011 and 14 participated in 2012), more households were assigned SEBTC benefits than were included in the impact evaluation (i.,e., the sample that received the household survey). Therefore, the evaluation team selected a random subsample of households from the benefit and no-benefit groups to participate in the evaluation. (For more detail, see Collins, et al., 2012, Appendix 4A and Collins et al., 2013 Appendix 4A.)
In 2013, six sites participated. In five of the six sites, all households with consented children were randomly assigned–half to be in the $60 benefit group and half to be in the $30 benefit group. In the sixth site, funding was not sufficient to provide benefits to all households with consented children; therefore, the households were randomly selected to receive benefits and were then randomly assigned–half to the $60 group and half to the $30 group. The remaining households did not receive any benefit and were not included in the evaluation. All households that were randomized to the $60 and $30 benefit groups were included in the evaluation sample. (For more detail, see Collins et al., 2013, Appendix 4A.)
Data Collection
The primary source of data for the impact analysis was a household survey, administered twice in each demonstration year; (1) at baseline survey during the school year in the spring (before SEBTC benefits began) and (2) follow-up survey in the summer. The survey attempted to reach households in the summer whether or not they were successfully interviewed in the spring.
The spring household survey included questions about household characteristics, household and children’s participation in nutrition assistance programs, household food security, and

Appendix 4 Page 97
monthly food expenditures. The summer survey collected similar information, as well as additional information on children’s food consumption, and breakfast and lunch behaviors. (For copies of the surveys, see Collins et al., 2013, Appendix 4C.)
For both the spring and summer surveys, telephone calls were made from the evaluation team’s call centers using computer-assisted telephone interviewing (CATI). Those not reached on the phone were assigned to field staff for locating. The overall process varied from year to year. In 2011 and 2012, two-phase sampling was used, such that only a random sub-sample of those who were not interviewed on the phone were passed to the field staff. (As discussed below, sampling weights adjust for this two-phase design). In 2013, all households not interviewed on the phone were passed to the field staff. In all years, respondents who were located in the field and agreed to answer the survey were connected to the call center to conduct the interview.
Response Rates
Exhibit 4.A shows the spring and summer response rates by treatment arm for 2011, 2012, and 2013.
Exhibit 4.A Response Rates, All Sites and by Site, Spring and Summer 2011, 2012, and 2013
Spring Summer
All Cases $60 Group $0/
$30 Groupa
All Cases $60
Group $0/
$30 Groupa
2011 Sitesb
67.5% 70.6% 64.4% 66.0% 71.6% 60.5%
2012 Sitesb
72.9% 74.9% 70.9% 80.3% 83.0% 77.5%
2013 Sites 88.8% 89.1% 88.5% 88.1% 88.3% 87.8% Source: Spring and Summer household samples 2011 (Spring n=9,743; Summer n=9,491), 2012 (n=42,309), and 2013 (n=22,831). aIn 2011 and 2012, households were assigned to a $0 benefit group. In 2013, households were assigned to receive either the
$60 or the $30 benefit amount; no households received $0 benefits. bIn 2011 and 2012, response rates were weighted. Please see Collins et al., 2012, Appendix 4B, for further detail.

Appendix 4 Page 98
SEBTC Impact Analysis Sample
Most of the impact estimates in the body of Chapter 4 analyzed pooled data from the 2011, 2012, and 2013 spring and summer household surveys. Households were not in the pooled data if they responded in the spring but not in the summer. In some cases, the same household in a site was part of the evaluation subsample in more than one year.68 For these households, survey information from their second year of participation was dropped from the evaluation. Doing so ensures that the observations are independent across years (conditional on site) and therefore simplifies estimation. In total, 3,571 observations are dropped due to this condition (1,355 in 2012 and 2,216 in 2013).
The primary impact analysis, comparing outcomes in the summer, relied on the sample that responded to the summer survey. Some other analyses, including descriptions of households at baseline, and analysis of household subgroups, relied on the sample that completed both the spring and summer surveys (i.e., the “panel sample”).
For the pooled analysis, the evaluation team started with weights developed for these two of samples (the sample of households that responded to the summer survey and the panel sample of households that responded to both the spring and summer surveys) for each site and each year. These weights adjust for the sample design and differential survey non-response, such that the weighted sample represents all eligible and consenting households in the site. Most analyses use these household weights. The nutrition questions and some questions about children’s participation in nutrition assistance programs were asked for a randomly selected focal child. For analyses of these questions, the evaluation used corresponding child weights that further adjust for the within household child sampling, such that the weighted sample represents all eligible children in consenting households in the sites.
For within-year analyses (described in earlier reports), weights were scaled so that each site contributed equally to overall estimates (pooled across all sites for the given year). For the current analyses pooling across years and sites, the weights are rescaled such that the sum of the weights equals the number of completed interviews in the specific year in the specific site (i.e., larger sites are more heavily weighted and smaller sites are less heavily weighted in overall estimates). If there was no variation across years and sites in the design effects (i.e., DEFF), then this rescaling would be the minimum variance combination of the observations. DEFFs are not equal across sites, so this is only a rough approximation to the minimum variance combination.
Exhibit 4.B provides the sample sizes, by year, for the pooled analysis. These sample sizes are slightly different than those used in the impact analysis for 2012 and 2013, because (as noted earlier in this appendix) households that participated in the SEBTC evaluation in a previous year were omitted from the next year’s analysis files for the pooled sample.
68
In these cases, these households were in the $0 benefit group in their first year of participating in the evaluation and in a benefit group (either $30 or $60, depending on the evaluation year) in the subsequent year. All households that received a benefit in a given year were excluded from the evaluation in subsequent year(s).

Appendix 4 Page 99
Exhibit 4.B Sample Size, by Year for the Pooled Data
All Cases $0 Group $30 Group $60 Group
2011 (5 Sites) 5,237 2,348 n/a 2,889
2012 (14 Sites) 25,739 12,513 n/a 13,226
2013 (6 Sites) 17,473 n/a 8,703 8,770
Total 48,449 14,861 8,703 24,885 Source: Summer household samples 2011, 2012, and 2013.
n/a = Not applicable. No households were assigned to the $30 benefit group in 2011 or 2012, and no households were assigned to the $0 benefit group in 2013.
Impact Analysis Methods
The impact estimates in the body of this report were computed from weighted linear regressions estimated on the pooled 2011, 2012, and 2013 data. Those regressions have the following form:
(1) iststistististist Xddy ,,,,,
6060
,,
3030
,,,,
Where the subscript t indexes time period (i.e., 2011, 2012, 2013), s indexes site within a year, and i indexes observation within year and site. Then, y is the outcome; the two ds are dummy variables assigned to a $30 or a $60 benefit, respectively (i.e., for the control group, both dummy variables are set to zero; for a $30 benefit, the first dummy variable is set to one and the other to zero; and for a $60 benefit, the first dummy variable is set to zero and the other is set to one). In addition, X is a vector of other covariates determined at baseline (before the revelation of randomization status).
The key parameters to be estimated are the two s corresponding to the impact of a $30 and
$60 benefit, respectively. In addition, is a vector of regression coefficients (assumed common
across years); is a vector of site x year dummy variables. Finally, is a regression residual.
These estimates are hybrids. With the inclusion of the site x year specific dummy variables, the estimates of the impact of the contrasts that were randomly assigned in a single site—that is, a
$60 benefit versus no benefit in 2011 and 2012 (i.e., 60 ), and a $60 benefit versus a $30
benefit in 2013 (i.e., 3060 )—are fully supported by the experimental design and randomization. They estimate the average impact of these contrasts across the year x site pairs in which the contrasts were randomly assigned. The weight assigned to each year x site is proportional to the number of survey observations.
The estimates of the impact of $30 versus no benefit (i.e., 30 ) are different. As noted in
Chapter 4, in no year x site was any household randomized between $30 and no benefit. The estimates of that contrast reported here can be thought of as the difference between the estimated impacts for the two randomly assigned contrasts (i.e., a $60 benefit versus no benefit and a $60 benefit versus a $30 benefit). (The analogy is not exact because the regression
estimates a single set of covariate impacts, ). The two experimentally derived estimates refer

Appendix 4 Page 100
to two different sets of year-site pairs. Subtracting the two experimentally derived estimators to derive a non-experimental estimate of the impact of a $30 benefit relative to no benefit implicitly assumes that the impacts would be the same if we had switched the sets of year-site pairs each experiment had been run on. That assumption is unlikely to be exactly satisfied. We therefore term these estimates “non-experimental.” (Collins et al., 2014 presents an alternative approach to estimating such non-experimental impacts which rely on pooling data across years.)
Estimation proceeds by weighted least squares, both for continuous outcomes and for binary outcomes (i.e., the linear probability model). To adjust both for the heteroscedasticity induced by the binary outcome (when appropriate) and more general forms of heteroscedasticity, standard errors are computed via the sandwich estimator (i.e., robust standard errors).
Each subgroup dimension (e.g., SNAP at baseline yes/no; poverty at baseline yes/no) is considered separately. Estimation of subgroup impacts is by a simple generalization of Equation (1):
(2) iststistististististististist Xdgdgddy ,,,,,
6060
,,,,
3030
,,,,
6060
,,
3030
,,,,
Where g indexes subgroup membership (i.e., g=1 if this observation is in the subgroup; g=0
otherwise). Then the impact for g=0 is ; the impact for g=1 is +[ and g=0 is a simple test for homogeneity (i.e., whether the impact varies across the subgroups). For sub-groups taking on three values (e.g., urban/suburban/rural, white/Black/Hispanic), g has two terms and we use an F-test to simultaneously test for homogeneity of impacts (i.e., that the impact is equal across all three groups).
Summary of Findings
Household and Respondent Characteristics
This section describes households participating in the evaluation, reporting information pooled for all years and conditions. Household characteristics that might be affected by participation in SEBTC—household income, participation in household nutrition assistance programs, and food security—come from the baseline survey, prior to the implementation of SEBTC. Because there were 6,656 households that did not complete the spring survey but did complete the summer survey and were included in the analytic sample, additional information about stable respondent characteristics and household composition were available from the summer survey. For these variables—respondent race/ethnicity; respondent education level; household composition; and number of children in the household—frequencies are reported from the summer survey.
Exhibits 4.C and 4.D present pooled information on households and respondent characteristics, respectively.

Appendix 4 Page 101
Exhibit 4.C SEBTC Household Characteristics at Baseline
Characteristic Estimate SE
Household Sizea
Mean number of people in household 4.3 0.01
Household Compositiona
Household with one adult, female 49.9% 0.29
Household with one adult, male 3.8% 0.10
Household with more than one adult 46.3% 0.29
Number of Childrena
1 child 24.1% 0.23
2 children 34.9% 0.29
3 or more children 41.0% 0.29
Mean number of children in household 2.4 0.01
Last Month Household Incomea, c
Median $1,399.10 15.10
Mean $1,593.27 7.02
No income (last month) 3.0% 0.09
Last Month Household Incomea, c
Below poverty lineb 71.2% 0.28
101-130 percent of poverty lineb 14.3% 0.22
131-185 percent of poverty lineb 10.8% 0.18
Above 185 percent of poverty lineb
3.8% 0.13
Household Benefits Before any Receipt of SEBTCa
Reported receiving SNAPb 64.2% 0.29
Reported receiving WICc 21.9% 0.24
Reported receiving food from food pantry/food bank/emergency kitchen
17.6% 0.22
Reported receiving none of the above 26.1% 0.27
Household Food Security Before any Receipt of SEBTCa
Very low food security among children (VLFS-C)
8.0% 0.15
Food insecurity among children (FI-C) 43.9% 0.31
Very low food security among adults (VLFS-A)
24.8% 0.26
Food insecurity among adults (FI-A) 52.6% 0.31
Very low food security in households (VLFS-HH)
26.4% 0.27
Food insecurity in households (FI-HH) 58.3% 0.31 Source: Estimates from SEBTC Spring and Summer Surveys, pooled from 2011, 2012, and 2013 (full sample: Summer Survey n=48,449; spring survey n = 41,793). a The respondent reported the household's characteristics and circumstances in the last 30 days (and last month for income).
Means and medians include households with zero income. b
Poverty level was calculated based on reported household income last month before taxes, household size, and the poverty guidelines for the given year (http://aspe.hhs.gov/poverty/13poverty.cfm for 2013). A small percentage of households provided annual income, which was used to calculate monthly income for the poverty distribution. c Estimates for household income, household nutrition benefits, and household food security are reported based on spring
survey responses.
In addition to gathering information about households, the study collected information on the individual in the household who responded to the study’s household survey (see Exhibit 4.D).

Appendix 4 Page 102
Exhibit 4.D Race/Ethnicity and Education Levels of SEBTC Respondents
Characteristic Percent SE
Race/Ethnicity of Respondenta
Hispanic 27.3% 0.22
Non-Hispanic black 22.6% 0.19
Non-Hispanic white 41.3% 0.28
Other, non-Hispanic 8.8% 0.16
Education Level of Respondentb
Less than high school 26.9% 0.25
Completed high school (or GED) 32.6% 0.27
Some college (including two-year degree) 32.5% 0.28
Four-year degree or higher 8.0% 0.16 Source: Estimates from SEBTC Summer Surveys, pooled from 2011, 2012, and 2013 (n=48,449). a Responses to the separate race and ethnicity questions were combined to create a race/ethnicity variable, according to OMB
reporting rules (see http://www.whitehouse.gov/omb/fedreg_race-ethnicity). b
Education level categories were condensed from the survey response categories to create those displayed.
Descriptive Statistics for Covariates Used in Impact Analysis Models
This section presents descriptive statistics for the covariates included in the regression-adjusted models estimating the impacts of SEBTC on food security and other food-related outcomes. Variables included as covariates in the impact analysis—baseline food security, household characteristics, respondent characteristics, and baseline participation in food assistance programs—were measured using the spring survey, before SEBTC benefits were issued. In the regression models, missing covariates are handled by the dummy variable adjustment (i.e., replacing missing values with a constant value and including a missing covariate flag).
Exhibit 4.E presents descriptive statistics for each of the six measures of spring food insecurity used as covariates—by year for households overall and for each treatment arm.
Exhibit 4.F presents descriptive statistics for household characteristics, by year, for households overall and for each treatment arm. There are seven measures describing household characteristics included in impact models as covariates: number of people in the household (continuous); number of children in the household (continuous); age of the oldest child in the household (continuous); presence of an adolescent in the household (binary); household income in the previous month (continuous, measured as a proportion of the Federal Poverty Level [FPL]); presence of an employed adult in the household (binary); household composition (three categories—two or more adults, one female adult, one male adult).
Exhibit 4.G presents the percentage of respondents for respondents overall and for respondents in each treatment arm who are in each race/ethnicity category and in each education level category.
Exhibit 4.H presents the percentage of households overall and for each treatment arm that participated during the school year in each of four nutrition assistance program—SNAP, WIC, National School Lunch Program, and School Breakfast Program.

Appendix 4 Page 103
Exhibit 4.E Prevalence during the School Year of Severe and General Food Insecurity among Children, Adults, and Households, by Benefit Status and for All Households, Spring 2011, 2012, and 2013
Covariates in Impact
Analysis
All Households $60 Benefit Group $30 Benefit Group $0 Benefit Group $60 v $0 $60 v $30
Sample size Estimate
Sample size Estimate
Sample size Estimate
Sample size Estimate Diff SE
p-value Diff SE p-value
Very low food security among children (%)
2011 Missing 1,174 601 573
N 4,063 7.2 2,288 7.0 NA NA 1,775 7.4 -0.4 0.95 0.708 NA NA NA
2012 Missing 4,564 2,315 2,249
N 21,175 8.6 10,911 8.7 NA NA 10,264 8.5 0.2 0.45 0.718 NA NA NA
2013 Missing 952 458 494
N 16,521 7.4 8,312 7.5 8,209 7.2 NA NA NA NA NA 0.3 0.42 0.493
Food insecurity among children (%)
2011 Missing 1,174 601 573
N 4,063 42.9 2,288 42.9 NA NA 1,775 42.9 -0.1 1.84 0.977 NA NA NA
2012 Missing 4,564 2,315 2,249
N 21,175 45.0 10,911 44.9 NA NA 10,264 45.2 -0.4 0.99 0.717 NA NA NA
2013 Missing 952 458 494
N 16,521 42.7 8,312 42.5 8,209 42.9 NA NA NA NA NA -0.4 0.78 0.613
Very low food security among adults (%)
2011 Missing 1,174 601 573
N 4,063 24.3 2,288 24.8 NA NA 1,775 23.9 0.8 1.61 0.600 NA NA NA
2012 Missing 4,563 2,315 2,248
N 21,176 25.1 10,911 24.5 NA NA 10,265 25.7 -1.3 0.84 0.130 NA NA NA
2013 Missing 956 460 496
N 16,517 24.6 8,310 24.8 8,207 24.4 NA NA NA NA NA 0.4 0.68 0.545
Food insecurity among adults (%)
2011 Missing 1,174 601 573
N 4,063 53.4 2,288 52.9 NA NA 1,775 53.9 -1.0 1.87 0.595 NA NA NA
2012 Missing 4,563 2,315 2,248
N 21,176 53.6 10,911 53.8 NA NA 10,265 53.5 0.3 0.99 0.728 NA NA NA
2013 Missing 956 460 496
N 16,517 51.0 8,310 50.8 8,207 51.2 NA NA NA NA NA -0.4 0.79 0.570

Appendix 4 Page 104
Covariates in Impact
Analysis
All Households $60 Benefit Group $30 Benefit Group $0 Benefit Group $60 v $0 $60 v $30
Sample size Estimate
Sample size Estimate
Sample size Estimate
Sample size Estimate Diff SE
p-value Diff SE p-value
Very low food security among households (%)
2011 Missing 1,174 601 573
N 4,063 25.9 2,288 26.0 NA NA 1,775 25.8 0.2 1.64 0.925 NA NA NA
2012 Missing 4,563 2,315 2,248
N 21,176 26.9 10,911 26.3 NA NA 10,265 27.5 -1.2 0.85 0.155 NA NA NA
2013 Missing 957 461 496
N 16,516 25.8 8,309 26.1 8,207 25.6 NA NA NA NA NA 0.5 0.69 0.443
Food insecurity among households (%)
2011 Missing 1,174 601 573
N 4,063 58.2 2,288 58.2 NA NA 1,775 58.2 0.0 1.87 0.995 NA NA NA
2012 Missing 4,563 2,315 2,248
N 21,176 59.4 10,911 59.4 NA NA 10,265 59.4 0.1 0.98 0.942 NA NA NA
2013 Missing 957 461 496
N 16,516 56.9 8,309 56.6 8,207 57.2 NA NA NA NA NA -0.6 0.78 0.436 Source: Estimates from SEBTC Spring Surveys, pooled from 2011, 2012, and 2013.
Note: The p-values are reported for a test of the difference in the prevalence rate for households in the $60 Benefit Group compared to households in the $0 Benefit Group or compared to households in the $30 Benefit Group. The null hypothesis being tested is that the total percentage point difference in the prevalence rates is zero.
NA = Not applicable.
*p<.10 **p<.05 ***p<.01
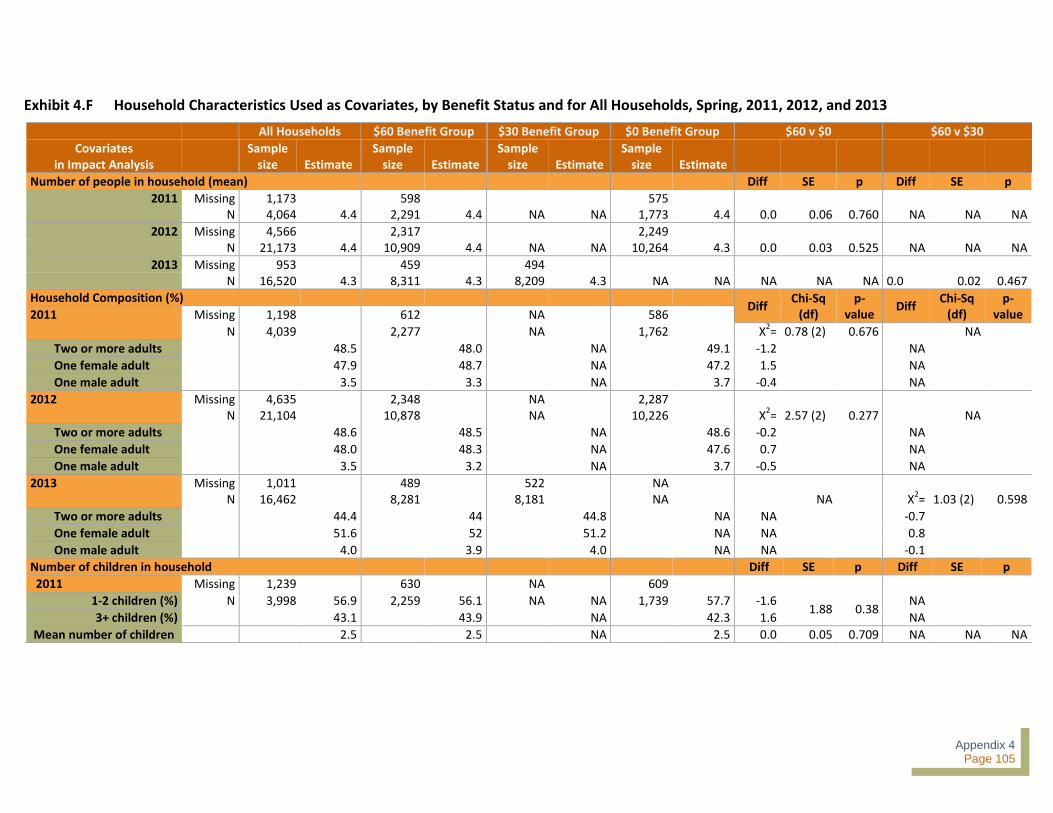
Appendix 4 Page 105
Exhibit 4.F Household Characteristics Used as Covariates, by Benefit Status and for All Households, Spring, 2011, 2012, and 2013
All Households $60 Benefit Group $30 Benefit Group $0 Benefit Group $60 v $0 $60 v $30
Covariates in Impact Analysis
Sample size Estimate
Sample size Estimate
Sample size Estimate
Sample size Estimate
Number of people in household (mean) Diff SE p Diff SE p
2011 Missing 1,173 598 575 N 4,064 4.4 2,291 4.4 NA NA 1,773 4.4 0.0 0.06 0.760 NA NA NA
2012 Missing 4,566 2,317 2,249 N 21,173 4.4 10,909 4.4 NA NA 10,264 4.3 0.0 0.03 0.525 NA NA NA
2013 Missing 953 459 494 N 16,520 4.3 8,311 4.3 8,209 4.3 NA NA NA NA NA 0.0 0.02 0.467
Household Composition (%) Diff
Chi-Sq (df)
p-value
Diff Chi-Sq
(df) p-
value 2011 Missing 1,198 612 NA 586
N 4,039 2,277 NA 1,762 Χ2= 0.78 (2) 0.676 NA
Two or more adults 48.5 48.0 NA 49.1 -1.2 NA
One female adult 47.9 48.7 NA 47.2 1.5 NA
One male adult 3.5 3.3 NA 3.7 -0.4 NA
2012 Missing 4,635 2,348 NA 2,287 N 21,104 10,878 NA 10,226 Χ
2= 2.57 (2) 0.277 NA
Two or more adults 48.6 48.5 NA 48.6 -0.2 NA
One female adult 48.0 48.3 NA 47.6 0.7 NA
One male adult 3.5 3.2 NA 3.7 -0.5 NA
2013 Missing 1,011 489 522 NA N 16,462 8,281 8,181 NA NA Χ
2= 1.03 (2) 0.598
Two or more adults 44.4 44 44.8 NA NA -0.7
One female adult 51.6 52 51.2 NA NA 0.8
One male adult 4.0 3.9 4.0 NA NA -0.1
Number of children in household Diff SE p Diff SE p
2011 Missing 1,239 630 NA 609
1-2 children (%) N 3,998 56.9 2,259 56.1 NA NA 1,739 57.7 -1.6 1.88 0.38
NA
3+ children (%) 43.1 43.9 NA 42.3 1.6 NA
Mean number of children 2.5 2.5 NA 2.5 0.0 0.05 0.709 NA NA NA

Appendix 4 Page 106
All Households $60 Benefit Group $30 Benefit Group $0 Benefit Group $60 v $0 $60 v $30
Covariates in Impact Analysis
Sample size Estimate
Sample size Estimate
Sample size Estimate
Sample size Estimate
2012 Missing 4,565 2,315 NA 2,248 NA
1-2 children N 21,176 58.9 10,911 58.6 NA NA 10,265 59.1 -0.5 0.98 0.629
NA
3+ children 41.2 41.4 NA 40.9 0.5 NA
Mean number of children 2.4 2.4 NA 2.4 0.0 0.03 0.306 NA NA NA
2013 Missing 922 439 483 NA NA
1-2 children (%) N 16,551 60.8 8,331 60.9 8,220 60.8 NA NA NA 0.1 0.77 0.898
3+ children (%) 39.2 39.2 39.3 NA NA -0.1
Mean number of children 2.4 2.4 2.4 NA NA NA NA 0.0 0.02 0.819
Age of oldest child in the household (mean in years) Diff SE p Diff SE p
2011 Missing 1,253 639 614 N 3,984 12.4 2250 12.4 NA NA 1,734 12.3 0.1 0.15 0.487 NA NA NA
2012 Missing 4,780 2,423 2,357 N 20,959 12.4 10,803 12.4 NA NA 10,156 12.4 -0.0 0.08 0.869 NA NA NA
2013 Missing 1,188 578 610 N 16,285 12.2 8,192 12.2 8,093 12.2 NA NA NA NA NA 0.0 0.065 0.906
Presence of an adolescent in the household (%) Diff SE p Diff SE p
2011 Missing 1,310 670 640 N 3,927 51.0 2,219 51.5 NA NA 1,708 50.6 0.9 1.91 0.653 NA NA NA
2012 Missing 4,757 2,415 2,342 N 20,982 51.7 10,811 51.5 NA NA 10,171 51.9 -0.4 1.00 0.700 NA NA NA
2013 Missing 1,152 556 596 N 16,321 49.8 8,214 49.4 8,107 50.2 NA NA NA NA NA -0.8 0.80 0.338
Last Month Household Income (Proportion of FPLa, b
) Diff SE p Diff SE p
2011 Missing 1,577 819 NA 758 N 3,660 0.80 2,070 0.80 NA NA 1,590 0.81 -0.01 0.02 0.638 NA NA NA
2012 Missing 4,897 2,475 NA 2,422
N 20,842 0.81 10,751 0.81 NA NA 10,091 0.81 0.00 0.01 0.749 NA NA NA
2013 Missing 1,241 600 641 NA
N 16,232 0.78 8,170 0.78 8,062 0.78 NA NA NA NA NA 0.00 0.01 0.768

Appendix 4 Page 107
All Households $60 Benefit Group $30 Benefit Group $0 Benefit Group $60 v $0 $60 v $30
Covariates in Impact Analysis
Sample size Estimate
Sample size Estimate
Sample size Estimate
Sample size Estimate
At least one employed adult in household (%) Diff SE p Diff SE p
2011 Missing 1,186 605 NA 581 N 4,051 69.6 2,284 70.4 NA NA 1,767 68.8 1.6 1.75 0.358 NA NA NA
2012 Missing 4,603 2,336 NA 2,267 N 21,136 71.5 10,890 71.6 NA NA 10,246 71.3 0.2 0.83 0.786 NA NA NA
2013 Missing 986 481 505 NA N 16,487 70.3 8,289 70.3 8,198 70.3 NA NA NA NA NA 0.0 0.72 0.963
Source: Estimates from SEBTC Spring Surveys, pooled from 2011, 2012, and 2013. a The respondent reported the household's characteristics and circumstances in the last 30 days (last month for household income).
b FPL = Federal Poverty Level. Means include households with zero income. The Federal Poverty Level was calculated based on reported household income last month before taxes, household size, and the
HHS poverty guidelines for the given year –2011 (http://aspe.hhs.gov/poverty/11poverty.shtml), 2012 (http://aspe.hhs.gov/poverty/12poverty.shtml), or 2013 (http://aspe.hhs.gov/poverty/13poverty.cfm). A small percentage of households provided annual income, which was used to calculate monthly income for the poverty distribution.
Note: The p-values are reported for a test of the difference in the prevalence rate for households in the $60 Benefit Group compared to households in the $0 Benefit Group or compared to households in the $30 Benefit Group. The null hypothesis being tested is that the total percentage point difference in the prevalence rates is zero.
NA = Not applicable.
*p<.10 **p<.05 ***p<.01
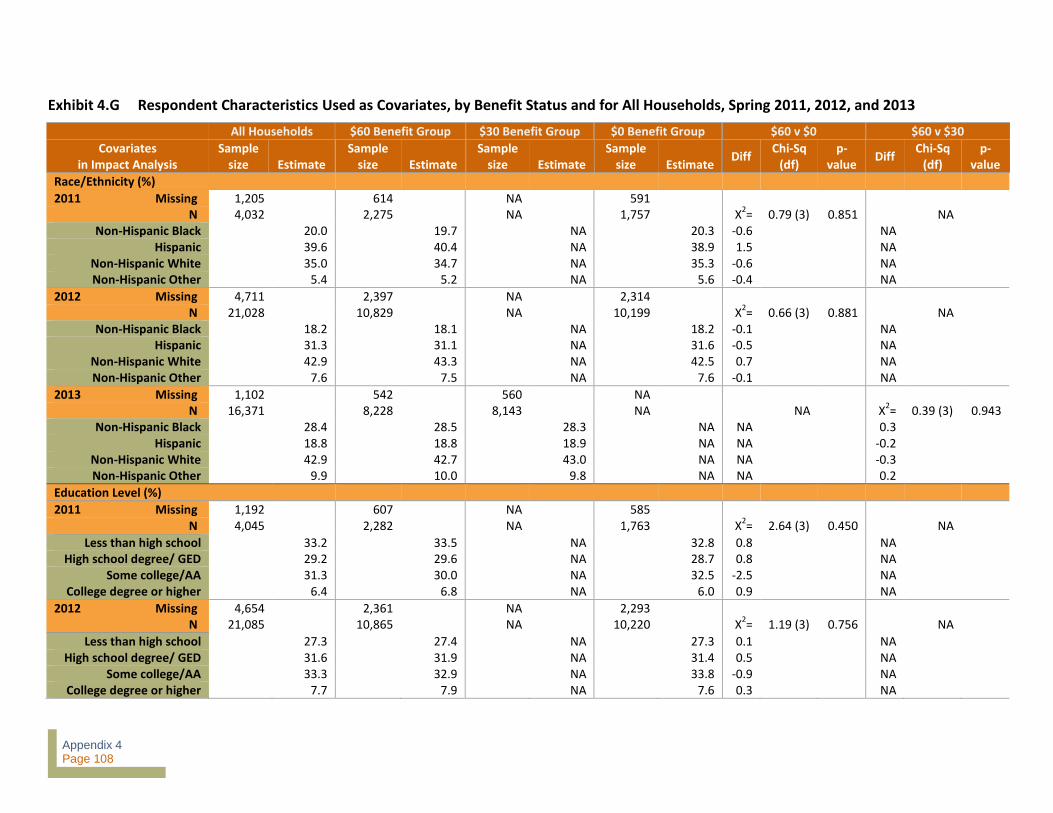
Appendix 4 Page 108
Exhibit 4.G Respondent Characteristics Used as Covariates, by Benefit Status and for All Households, Spring 2011, 2012, and 2013
All Households $60 Benefit Group $30 Benefit Group $0 Benefit Group $60 v $0 $60 v $30
Covariates in Impact Analysis
Sample size Estimate
Sample size Estimate
Sample size Estimate
Sample size Estimate
Diff Chi-Sq
(df) p-
value Diff
Chi-Sq (df)
p-value
Race/Ethnicity (%)
2011 Missing 1,205 614 NA 591 N 4,032 2,275 NA 1,757 Χ
2= 0.79 (3) 0.851 NA
Non-Hispanic Black 20.0 19.7 NA 20.3 -0.6 NA Hispanic 39.6 40.4 NA 38.9 1.5 NA
Non-Hispanic White 35.0 34.7 NA 35.3 -0.6 NA Non-Hispanic Other 5.4 5.2 NA 5.6 -0.4 NA
2012 Missing 4,711 2,397 NA 2,314 N 21,028 10,829 NA 10,199 Χ
2= 0.66 (3) 0.881 NA
Non-Hispanic Black 18.2 18.1 NA 18.2 -0.1 NA Hispanic 31.3 31.1 NA 31.6 -0.5 NA
Non-Hispanic White 42.9 43.3 NA 42.5 0.7 NA Non-Hispanic Other 7.6 7.5 NA 7.6 -0.1 NA
2013 Missing 1,102 542 560 NA N 16,371 8,228 8,143 NA NA Χ
2= 0.39 (3) 0.943
Non-Hispanic Black 28.4 28.5 28.3 NA NA 0.3 Hispanic 18.8 18.8 18.9 NA NA -0.2
Non-Hispanic White 42.9 42.7 43.0 NA NA -0.3 Non-Hispanic Other 9.9 10.0 9.8 NA NA 0.2
Education Level (%)
2011 Missing 1,192 607 NA 585 N 4,045 2,282 NA 1,763 Χ
2= 2.64 (3) 0.450 NA
Less than high school 33.2 33.5 NA 32.8 0.8 NA High school degree/ GED 29.2 29.6 NA 28.7 0.8 NA
Some college/AA 31.3 30.0 NA 32.5 -2.5 NA College degree or higher 6.4 6.8 NA 6.0 0.9 NA
2012 Missing 4,654 2,361 NA 2,293 N 21,085 10,865 NA 10,220 Χ
2= 1.19 (3) 0.756 NA
Less than high school 27.3 27.4 NA 27.3 0.1 NA High school degree/ GED 31.6 31.9 NA 31.4 0.5 NA
Some college/AA 33.3 32.9 NA 33.8 -0.9 NA College degree or higher 7.7 7.9 NA 7.6 0.3 NA

Appendix 4 Page 109
All Households $60 Benefit Group $30 Benefit Group $0 Benefit Group $60 v $0 $60 v $30
Covariates in Impact Analysis
Sample size Estimate
Sample size Estimate
Sample size Estimate
Sample size Estimate
Diff Chi-Sq
(df) p-
value Diff
Chi-Sq (df)
p-value
2013 Missing 1,031 506 525 NA N 16,442 8,264 8,178 NA NA Χ
2= 1.55 (3) 0.672
Less than high school 24.8 25.0 24.6 NA NA 0.4
High school degree/ GED 33.6 33.8 33.4 NA NA 0.3
Some college/AA 32.4 32.0 32.9 NA NA -0.9
College degree or higher 9.1 9.2 9.0 NA NA 0.2 Source: Estimates from SEBTC Spring and Summer Surveys, pooled from 2011, 2012, and 2013.
Note: The p-values are reported for a test of the difference in the prevalence rate for households in the $60 Benefit Group compared to households in the $0 Benefit Group or compared to households in the $30 Benefit Group. The null hypothesis being tested is that the total percentage point difference in the prevalence rates is zero.
NA = Not applicable.
*p<.10 **p<.05 ***p<.01
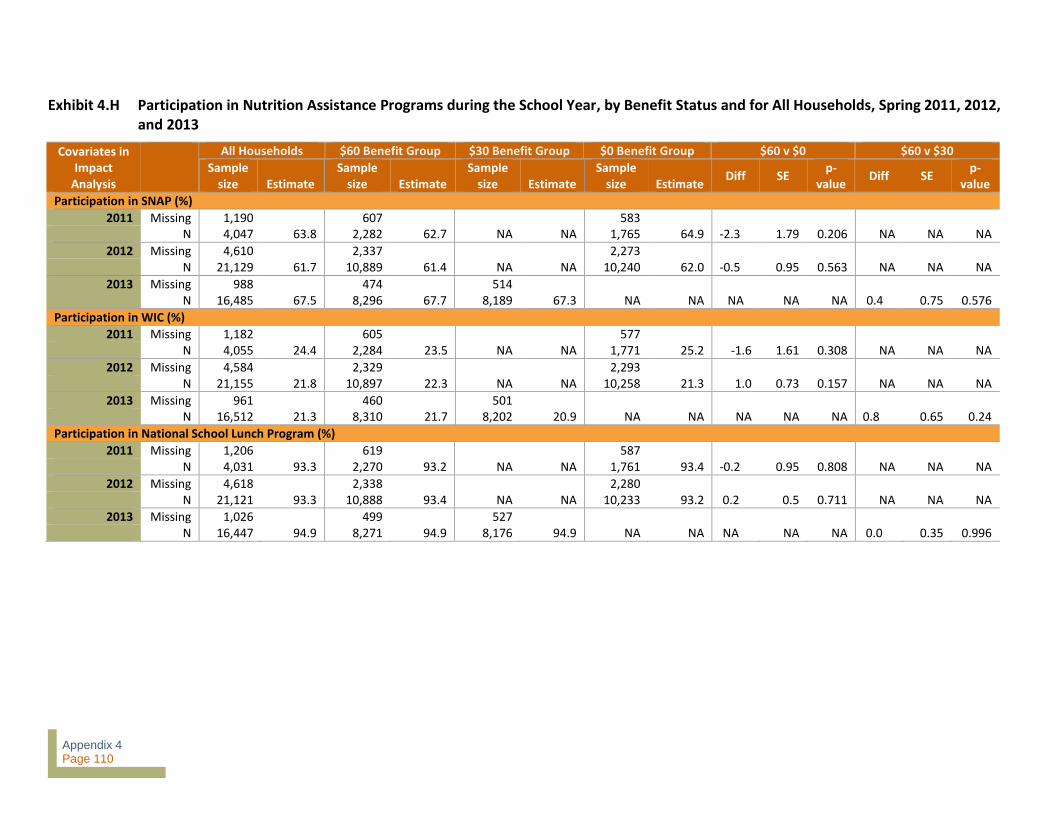
Appendix 4 Page 110
Exhibit 4.H Participation in Nutrition Assistance Programs during the School Year, by Benefit Status and for All Households, Spring 2011, 2012, and 2013
Covariates in Impact
Analysis
All Households $60 Benefit Group $30 Benefit Group $0 Benefit Group $60 v $0 $60 v $30
Sample size Estimate
Sample size Estimate
Sample size Estimate
Sample size Estimate
Diff SE p-
value Diff SE
p-value
Participation in SNAP (%)
2011 Missing 1,190 607 583 N 4,047 63.8 2,282 62.7 NA NA 1,765 64.9 -2.3 1.79 0.206 NA NA NA
2012 Missing 4,610 2,337 2,273 N 21,129 61.7 10,889 61.4 NA NA 10,240 62.0 -0.5 0.95 0.563 NA NA NA
2013 Missing 988 474 514 N 16,485 67.5 8,296 67.7 8,189 67.3 NA NA NA NA NA 0.4 0.75 0.576
Participation in WIC (%)
2011 Missing 1,182 605 577 N 4,055 24.4 2,284 23.5 NA NA 1,771 25.2 -1.6 1.61 0.308 NA NA NA
2012 Missing 4,584 2,329 2,293 N 21,155 21.8 10,897 22.3 NA NA 10,258 21.3 1.0 0.73 0.157 NA NA NA
2013 Missing 961 460 501 N 16,512 21.3 8,310 21.7 8,202 20.9 NA NA NA NA NA 0.8 0.65 0.24
Participation in National School Lunch Program (%)
2011 Missing 1,206 619 587 N 4,031 93.3 2,270 93.2 NA NA 1,761 93.4 -0.2 0.95 0.808 NA NA NA
2012 Missing 4,618 2,338 2,280 N 21,121 93.3 10,888 93.4 NA NA 10,233 93.2 0.2 0.5 0.711 NA NA NA
2013 Missing 1,026 499 527 N 16,447 94.9 8,271 94.9 8,176 94.9 NA NA NA NA NA 0.0 0.35 0.996

Appendix 4 Page 111
Covariates in Impact
Analysis
All Households $60 Benefit Group $30 Benefit Group $0 Benefit Group $60 v $0 $60 v $30
Sample size Estimate
Sample size Estimate
Sample size Estimate
Sample size Estimate
Diff SE p-
value Diff SE
p-value
Participation in School Breakfast Program (%)
2011 Missing 1,247 637 610 N 3,990 84.3 2,252 84.9 NA NA 1,738 83.8 1.0 1.41 0.457 NA NA NA
2012 Missing 4,617 2,346 2,271 N 21,122 82.6 10,880 82.6 NA NA 10,242 82.7 0.0 0.72 0.962 NA NA NA
2013 Missing 1,215 595 620 N 16,258 84.8 8,175 84.5 8,083 85.1 NA NA NA NA NA -0.6 0.57 0.282
Source: Estimates from SEBTC Spring Surveys, pooled from 2011, 2012, and 2013.
Note: The p-values are reported for a test of the difference in the prevalence rate for households in the $60 Benefit Group compared to households in the $0 Benefit Group or compared to households in the $30 Benefit Group. The null hypothesis being tested is that the total percentage point difference in the prevalence rates is zero.
NA = Not applicable.
*p<.10 **p<.05 ***p<.01

Appendix 4 Page 112
SEBTC Impacts on Food Security
Exhibit 4.I provides summary information on the impact of SEBTC on very low food security and food insecurity among children, adults, and children and/or adults (households). Exhibit 4.J presents subgroup analysis results for impacts on VLFS-C, including tests for homogeneity of impacts across the subgroup values. Exhibit 4.K presents subgroup analysis results for impacts on FI-C, including tests of homogeneity of impacts across the subgroup values.
Each of the exhibits in this appendix that follows is presented in two parts. The first part of the table includes tests of the $60 benefit versus the $0 benefit and the $60 benefit versus the $30 benefit. The remaining columns in the table—showing tests of the $30 benefit versus the $0 benefit and $60-$30 versus $30-$0—wrap into a second, related table.
SEBTC Impacts Children’s Nutrition
Exhibit 4.L provides information about the impact of SEBTC on children’s food consumption Exhibits 4.M, 4.N and 4.O present subgroup analysis results, again including tests for homogeneity of impacts across the subgroup values, for subgroups based on SEBTC program model (Exhibit 4.M), household poverty status (Exhibit 4.N), and school district locale (Exhibit 4.O).
SEBTC Impacts on Other Outcomes
Exhibit 4.P provides information about the impact of SEBTC on food expenditures. Exhibit 4.Q presents impacts on expenditures by SEBTC WIC and SNAP program model, including tests for homogeneity of impacts across the WIC/SNAP program model subgroups.
Exhibit 4.R provides information about the impact of SEBTC on program participation.
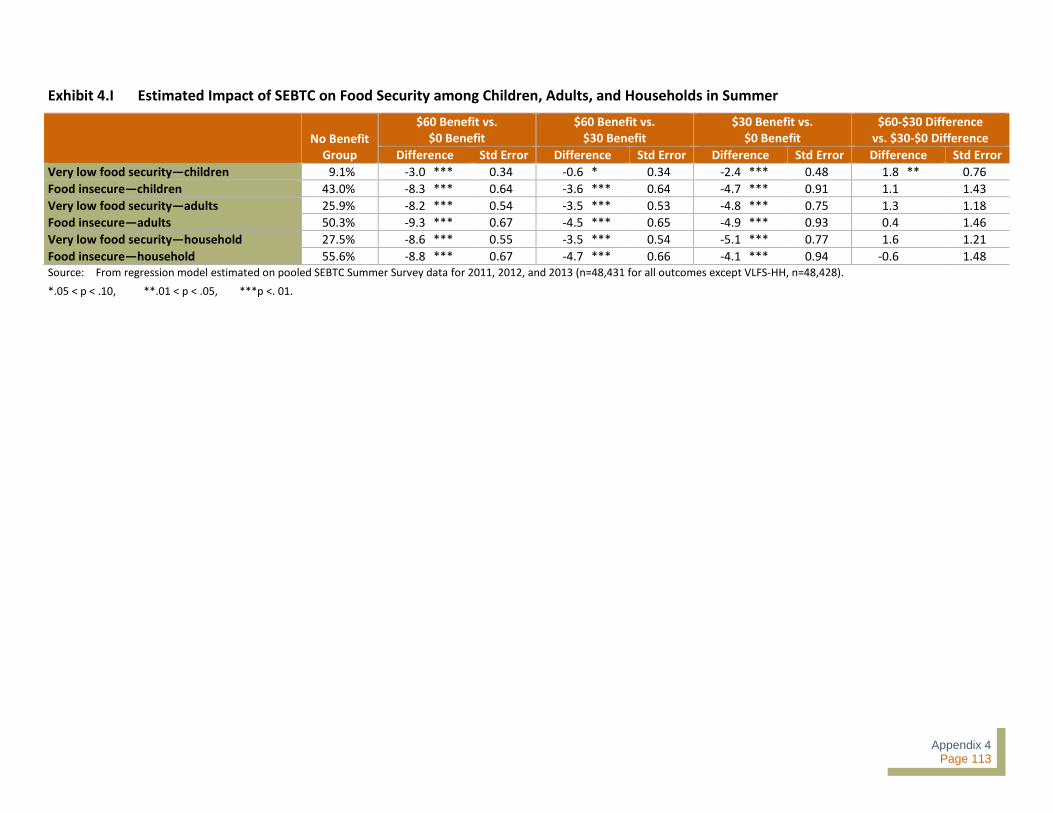
Appendix 4 Page 113
Exhibit 4.I Estimated Impact of SEBTC on Food Security among Children, Adults, and Households in Summer
No Benefit
Group
$60 Benefit vs. $0 Benefit
$60 Benefit vs. $30 Benefit
$30 Benefit vs. $0 Benefit
$60-$30 Difference vs. $30-$0 Difference
Difference Std Error Difference Std Error Difference Std Error Difference Std Error
Very low food security—children 9.1% -3.0 *** 0.34 -0.6 * 0.34 -2.4 *** 0.48 1.8 ** 0.76
Food insecure—children 43.0% -8.3 *** 0.64 -3.6 *** 0.64 -4.7 *** 0.91 1.1 1.43
Very low food security—adults 25.9% -8.2 *** 0.54 -3.5 *** 0.53 -4.8 *** 0.75 1.3 1.18
Food insecure—adults 50.3% -9.3 *** 0.67 -4.5 *** 0.65 -4.9 *** 0.93 0.4 1.46
Very low food security—household 27.5% -8.6 *** 0.55 -3.5 *** 0.54 -5.1 *** 0.77 1.6 1.21
Food insecure—household 55.6% -8.8 *** 0.67 -4.7 *** 0.66 -4.1 *** 0.94 -0.6 1.48 Source: From regression model estimated on pooled SEBTC Summer Survey data for 2011, 2012, and 2013 (n=48,431 for all outcomes except VLFS-HH, n=48,428).
*.05 < p < .10, **.01 < p < .05, ***p <. 01.

Appendix 4 Page 114
Exhibit 4.J Estimated Impact of SEBTC on Very Low Food Security among Children in Summer, by Subgroup
Prevalence of Very Low Food Security—Children (VLFS-C) Sample Size
No Benefits Group (%)
$60 Benefit vs. $0 Benefit
$60 Benefit vs. $30 Benefit
$30 Benefit vs. $0 Benefit
$60-$30 Difference vs. $30-$0 Difference
Difference Std. Error Difference Std. Error Difference Std. Error Difference Std. Error
WIC/SNAP Model
SNAP model 28,010 9.7 -3.1 *** 0.42 -0.9 * 0.49 -2.1 *** 0.65 1.2 1.06
WIC model 20,421 8.3 -2.9 *** 0.57 -0.2 0.46 -2.7 *** 0.73 2.5 ** 1.08
Difference 48,431 -1.4 0.2 0.71 0.8 0.67 -0.6 0.98 1.3 1.52
Active/Passive Consent
Passive consent 7,507 11.7 -3.2 *** 0.66 NA NA NA NA NA NA
Active consent 18,364 9.9 -3.8 *** 0.44 NA NA NA NA NA NA
Difference 25,871 -1.7 -0.6 0.79 NA NA NA NA NA NA
Very Low Food Security among Children (VLFS-C) at Baseline
Not VLFS-C at baseline 38,402 6.2 -3.2 *** 0.34 -0.4 0.31 -2.8 *** 0.48 2.5 *** 0.73
VLFS-C at baseline 3,347 47.6 -7.6 *** 2.22 -2.1 2.47 -5.5 ** 2.77 3.4 4.76
Difference 41,749 41.4 -4.5 ** 2.23 -1.8 2.48 -2.7 2.77 0.9 4.76
Food Insecurity among Children (FI-C) at Baseline
Not FI-C at baseline 23,245 2.4 -1.3 *** 0.3 -0.1 0.29 -1.2 ** 0.46 1.1 0.71
FI-C at baseline 18,504 18.4 -6.2 *** 0.75 -0.7 0.71 -5.5 *** 0.92 4.8 *** 1.46
Difference 41,749 16.0 -4.9 *** 0.77 -0.6 0.72 -4.3 *** 0.9 3.7 *** 1.43
Poverty
Not below 100% FPL 11,696 7.1 -3.4 *** 0.58 -1.2 ** 0.53 -2.2 *** 0.75 1.0 1.17
Below 100% FPL 29,029 10.6 -3.8 *** 0.44 -0.2 0.41 -3.6 *** 0.57 3.4 *** 0.89
Difference 40,725 3.5 -0.4 0.71 1.0 0.62 -1.4 * 0.84 2.4 * 1.29
Participation in SNAP in Spring
Does not receive SNAP 14,889 8.9 -3.0 *** 0.58 -0.2 0.54 -2.8 *** 0.75 2.6 ** 1.16
Receives SNAP in spring 26,762 9.8 -3.8 *** 0.44 -0.6 0.40 -3.2 *** 0.57 2.6 *** 0.89
Difference 41,651 0.9 -0.8 0.71 -0.4 0.62 -0.4 0.83 0.0 1.28
Number of Children in Household
3 or more children in HH 17,044 10.1 -4.3 *** 0.58 -0.7 0.51 -3.6 *** 0.72 2.9 *** 1.11
2 or fewer children 24,672 9.0 -3.0 *** 0.44 -0.4 0.41 -2.7 *** 0.57 2.3 ** 0.90
Difference 41,716 -1.1 1.2 * 0.70 0.3 0.61 0.9 0.80 -0.6 1.25
Presence of an Adolescent in Household (HH)
No adolescent in HH 19,945 6.5 -2.0 *** 0.43 0.0 0.41 -2.1 *** 0.56 2.1 ** 0.88
Adolescent in HH 21,279 12.3 -4.9 *** 0.55 -1.0 ** 0.50 -3.9 *** 0.70 2.8 *** 1.08
Difference 41,224 5.9 -2.9 *** 0.67 -1.1 * 0.59 -1.8 ** 0.77 0.7 1.20

Appendix 4 Page 115
Prevalence of Very Low Food Security—Children (VLFS-C) Sample Size
No Benefits Group (%)
$60 Benefit vs. $0 Benefit
$60 Benefit vs. $30 Benefit
$30 Benefit vs. $0 Benefit
$60-$30 Difference vs. $30-$0 Difference
Difference Std. Error Difference Std. Error Difference Std. Error Difference Std. Error
Respondent Race/Ethnicity
Difference overall 41,421 F(4,62) = 0.31, p=0.872
African American (AA) 9,438 10.9 -4.0 *** 0.83 -0.2 0.63 -3.8 *** 0.96 3.5 ** 1.39
Hispanic 11,460 11.5 -3.3 *** 0.63 -0.1 0.97 -2.9 *** 0.90 -1.0 1.96
White/Other 20,523 7.8 -3.5 *** 0.48 -0.5 0.74 -2.7 *** 0.63 -1.6 1.58
Difference (AA vs. other) 29,961 3.2 -0.5 0.93 0.5 0.74 -1.0 1.07 1.6 1.58
Difference (Hispanic vs. other) 31,983 3.8 0.2 0.78 0.4 0.85 -0.2 1.01 0.6 1.70
Difference (AA vs. Hisp.) 20,898 -0.6 -0.7 1.02 0.1 0.97 -0.8 1.23 1.0 1.96
School District Locale
Difference overall 48,431 F(4,69) = 0.40, p=0.809
Rural 8,645 7.6 -3.6 *** 0.99 -1.0 * 0.60 -2.6 ** 1.07 1.6 1.42
Town/suburb 16,670 8.8 -3.0 *** 0.54 0.3 0.76 -2.2 *** 0.72 -0.2 1.65
Urban 23,116 9.9 -2.8 *** 0.45 0.8 0.81 -2.6 *** 0.70 0.8 1.82
Rural vs. urban difference 31,761 -2.3 -0.8 1.08 -0.8 0.81 0.0 1.26 -0.8 1.82
Town vs. urban difference 39,786 -1.1 -0.2 0.70 -0.6 0.74 0.4 0.96 -1.0 1.57
Rural vs. town difference 25,315 -1.3 -0.7 1.10 -0.3 0.76 -0.4 1.18 0.2 1.65 Source: From regression model estimated on pooled SEBTC Summer Survey data for 2011, 2012, and 2013.
*.05 < p < .10, **.01 < p < .05, ***p <. 01.
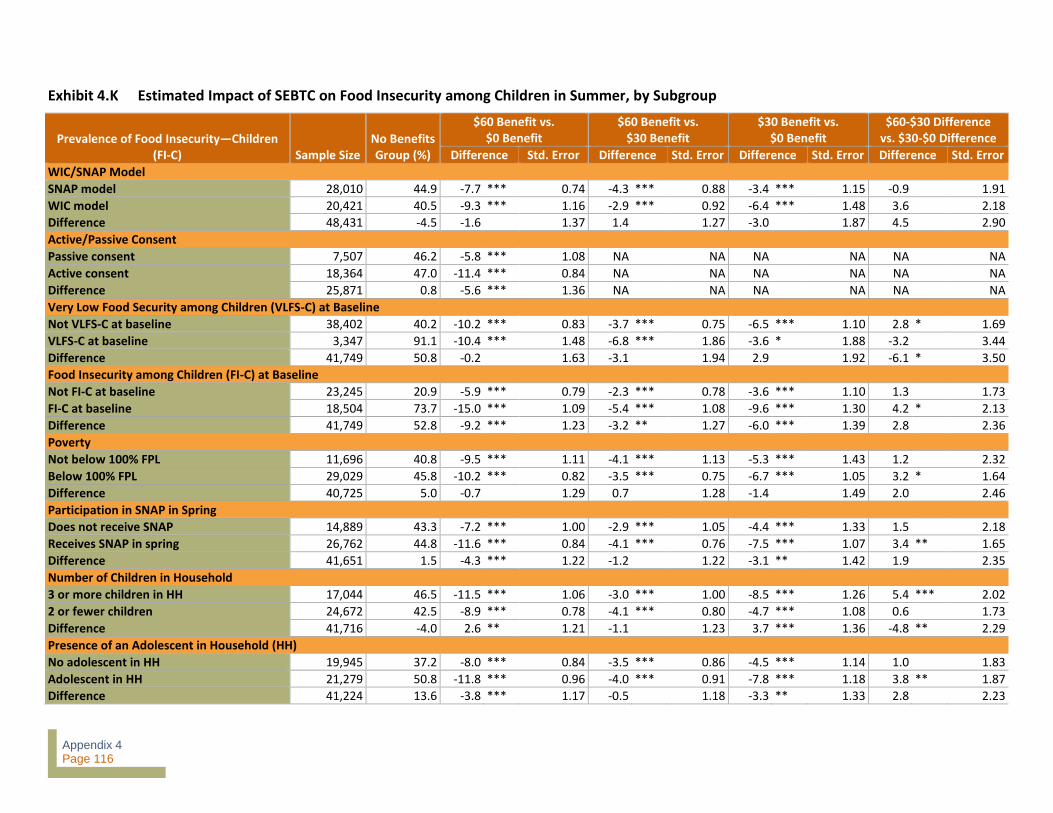
Appendix 4 Page 116
Exhibit 4.K Estimated Impact of SEBTC on Food Insecurity among Children in Summer, by Subgroup
Prevalence of Food Insecurity—Children (FI-C) Sample Size
No Benefits Group (%)
$60 Benefit vs. $0 Benefit
$60 Benefit vs. $30 Benefit
$30 Benefit vs. $0 Benefit
$60-$30 Difference vs. $30-$0 Difference
Difference Std. Error Difference Std. Error Difference Std. Error Difference Std. Error
WIC/SNAP Model
SNAP model 28,010 44.9 -7.7 *** 0.74 -4.3 *** 0.88 -3.4 *** 1.15 -0.9 1.91
WIC model 20,421 40.5 -9.3 *** 1.16 -2.9 *** 0.92 -6.4 *** 1.48 3.6 2.18
Difference 48,431 -4.5 -1.6 1.37 1.4 1.27 -3.0 1.87 4.5 2.90
Active/Passive Consent
Passive consent 7,507 46.2 -5.8 *** 1.08 NA NA NA NA NA NA
Active consent 18,364 47.0 -11.4 *** 0.84 NA NA NA NA NA NA
Difference 25,871 0.8 -5.6 *** 1.36 NA NA NA NA NA NA
Very Low Food Security among Children (VLFS-C) at Baseline
Not VLFS-C at baseline 38,402 40.2 -10.2 *** 0.83 -3.7 *** 0.75 -6.5 *** 1.10 2.8 * 1.69
VLFS-C at baseline 3,347 91.1 -10.4 *** 1.48 -6.8 *** 1.86 -3.6 * 1.88 -3.2 3.44
Difference 41,749 50.8 -0.2 1.63 -3.1 1.94 2.9 1.92 -6.1 * 3.50
Food Insecurity among Children (FI-C) at Baseline
Not FI-C at baseline 23,245 20.9 -5.9 *** 0.79 -2.3 *** 0.78 -3.6 *** 1.10 1.3 1.73
FI-C at baseline 18,504 73.7 -15.0 *** 1.09 -5.4 *** 1.08 -9.6 *** 1.30 4.2 * 2.13
Difference 41,749 52.8 -9.2 *** 1.23 -3.2 ** 1.27 -6.0 *** 1.39 2.8 2.36
Poverty
Not below 100% FPL 11,696 40.8 -9.5 *** 1.11 -4.1 *** 1.13 -5.3 *** 1.43 1.2 2.32
Below 100% FPL 29,029 45.8 -10.2 *** 0.82 -3.5 *** 0.75 -6.7 *** 1.05 3.2 * 1.64
Difference 40,725 5.0 -0.7 1.29 0.7 1.28 -1.4 1.49 2.0 2.46
Participation in SNAP in Spring
Does not receive SNAP 14,889 43.3 -7.2 *** 1.00 -2.9 *** 1.05 -4.4 *** 1.33 1.5 2.18
Receives SNAP in spring 26,762 44.8 -11.6 *** 0.84 -4.1 *** 0.76 -7.5 *** 1.07 3.4 ** 1.65
Difference 41,651 1.5 -4.3 *** 1.22 -1.2 1.22 -3.1 ** 1.42 1.9 2.35
Number of Children in Household
3 or more children in HH 17,044 46.5 -11.5 *** 1.06 -3.0 *** 1.00 -8.5 *** 1.26 5.4 *** 2.02
2 or fewer children 24,672 42.5 -8.9 *** 0.78 -4.1 *** 0.80 -4.7 *** 1.08 0.6 1.73
Difference 41,716 -4.0 2.6 ** 1.21 -1.1 1.23 3.7 *** 1.36 -4.8 ** 2.29
Presence of an Adolescent in Household (HH)
No adolescent in HH 19,945 37.2 -8.0 *** 0.84 -3.5 *** 0.86 -4.5 *** 1.14 1.0 1.83
Adolescent in HH 21,279 50.8 -11.8 *** 0.96 -4.0 *** 0.91 -7.8 *** 1.18 3.8 ** 1.87
Difference 41,224 13.6 -3.8 *** 1.17 -0.5 1.18 -3.3 ** 1.33 2.8 2.23

Appendix 4 Page 117
Prevalence of Food Insecurity—Children (FI-C) Sample Size
No Benefits Group (%)
$60 Benefit vs. $0 Benefit
$60 Benefit vs. $30 Benefit
$30 Benefit vs. $0 Benefit
$60-$30 Difference vs. $30-$0 Difference
Difference Std. Error Difference Std. Error Difference Std. Error Difference Std. Error
Respondent Race/Ethnicity
Difference overall 41,421 F(4,62) = 3.38, p=0.009
African American (AA) 9,438 43.1 -10.3 *** 1.24 -2.8 ** 1.11 -7.6 *** 1.52 4.8 ** 2.35
Hispanic 11,460 48.8 -7.2 *** 1.05 -1.8 1.67 -2.6 * 1.55 -6.8 ** 3.29
White/Other 20,523 42.5 -11.6 *** 1.01 -1.0 1.36 -7.8 *** 1.24 -0.7 2.76
Difference (AA vs. other) 29,961 0.6 1.2 1.52 1.0 1.36 0.3 1.76 0.7 2.76
Difference (Hispanic vs. other) 31,983 6.3 4.4 *** 1.40 -0.9 1.52 5.2 *** 1.75 -6.1 ** 2.97
Difference (AA vs. Hisp.) 20,898 -5.7 -3.1 ** 1.57 1.8 1.67 -5.0 ** 1.96 6.8 ** 3.29
School District Locale
Difference overall 48,431 F(4,69) = 1.71, p=0.145
Rural 8,645 40.0 -10.8 *** 2.05 -3.4 *** 1.30 -7.3 *** 2.09 3.9 2.82
Town/suburb 16,670 44.9 -9.6 *** 0.98 -0.4 1.64 -5.9 *** 1.36 -1.8 3.20
Urban 23,116 43.1 -6.8 *** 0.78 -0.3 1.62 -3.2 *** 1.22 -4.4 3.43
Rural vs. urban difference 31,761 -3.1 -3.9 * 2.18 0.3 1.62 -4.2 * 2.37 4.4 3.43
Town vs. urban difference 39,786 1.8 -2.8 ** 1.23 -0.1 1.38 -2.7 1.74 2.6 2.89
Rural vs. town difference 25,315 -5.0 -1.1 2.14 0.4 1.64 -1.5 2.17 1.8 3.20
Source: From regression model estimated on pooled SEBTC Summer Survey data for 2011, 2012, and 2013.
*.05 < p < .10, **.01 < p < .05, ***p <. 01.

Appendix 4 Page 118
Exhibit 4.L Estimated Impact of SEBTC on Children’s Food Consumption in Summer
Outcome Sample Size No Benefits Group (%)
$60 Benefit vs. $0 Benefit
$60 Benefit vs. $30 Benefit
$30 Benefit vs. $0 Benefit
$60-$30 Difference vs. $30-$0 Difference
Difference Std. Error Difference Std. Error Difference Std. Error Difference Std. Error
Fruits and vegetables (cup equivalents per day)
a
42,774 2.87 0.36 *** 0.03 0.20 *** 0.03 0.16 *** 0.04 0.03 0.06
Fruits and vegetables, without fried potatoes (cup equivalents per day)
a
42,818 2.75 0.36 *** 0.03 0.19 *** 0.03 0.17 *** 0.04 0.03 0.06
Whole grains (ounce equivalents per day)b 43,165 1.66 0.49 *** 0.05 0.13 ** 0.06 0.36 *** 0.08 -0.24 * 0.14
Dairy products (cup equivalents per day)c 43,302 2.25 0.22 *** 0.03 0.07 *** 0.02 0.15 *** 0.03 -0.08 * 0.05
Usually drank nonfat or low-fat milk d 42,406 13.70 -0.54 0.71 0.34 0.55 -0.89 0.89 1.23 1.30
Added sugars (teaspoons per day)e 42,494 18.22 -0.18 0.17 0.13 0.18 -0.31 0.25 0.44 0.40
Added sugars excluding cereals (teaspoons per day)
e
42,800 17.10 -0.47 *** 0.15 0.02 0.16 -0.49 ** 0.22 0.51 0.36
Sugar-sweetened beverages (teaspoons per day)
e
43,357 8.15 -0.59 *** 0.16 0.06 0.18 -0.65 *** 0.24 0.71 * 0.39
Source: From regression model estimated on pooled SEBTC Summer Survey data for 2012 and 2013. *.05 < p < .10, **.01 < p < .05, ***p < .01. a Daily amounts of fruits and vegetables and dairy are measured in cup equivalents and in ounce equivalents for whole grains, as defined by the 2010 Dietary Guidelines for Americans. For fruits and
vegetables, 1 1 cup equivalent is defined as 1 cup raw or cooked fruit or vegetables, vegetable juice, or fruit juice; 2 cups leafy green vegetables; or 1/2 cup dried fruit. b
One ounce equivalent of whole grains is 1 one-ounce slice bread; 1 ounce uncooked pasta or rice; 1/2 cup cooked rice, pasta, or cereal; 1 6-inch diameter tortilla; 1 5-inch diameter pancake; or 1 ounce ready-to-eat cereal. c One cup equivalent of dairy is 1 cup milk, fortified soy beverage, or yogurt; 1½ ounces natural cheese; or 2 ounces of processed cheese.
d Respondents who reported that their child consumed more than one type of milk were included if any of the milk types reported were nonfat or low-fat. Those reporting only whole milk and/or
2% milk were not considered to usually consume nonfat or low-fat milk. e
Teaspoons of added sugars are derived from reported frequencies of consuming sugar-sweetened beverages (soda, fruit-flavored drinks, and sugar or honey added to coffee or tea); cookies/cakes/pies; doughnuts; ice cream; candy; and cereals.

Appendix 4 Page 119
Exhibit 4.M Estimated Impact of SEBTC on Children’s Food Consumption in Summer, by WIC/SNAP Program Model
Sample Size No Benefits Group (%)
$60 Benefit vs. $0 Benefit
$60 Benefit vs. $30 Benefit
$30 Benefit vs. $0 Benefit
$60-$30 Difference vs. $30-$0 Difference
Difference Std. Error Difference Std. Error Difference Std. Error Difference Std. Error
Fruits and Vegetables
SNAP model 24,881 2.91 0.25 *** 0.03 0.14 *** 0.04 0.11 ** 0.05 0.03 0.08
WIC model 17,893 2.81 0.52 *** 0.06 0.26 *** 0.04 0.26 *** 0.08 0.00 0.10
Difference 42,774 -0.10 0.28 *** 0.07 0.12 ** 0.05 0.15 * 0.09 -0.03 0.13
Fruits and Vegetables without Fried Potatoes
SNAP model 24,912 2.79 0.25 *** 0.03 0.13 *** 0.04 0.11 ** 0.05 0.02 0.08
WIC model 17,906 2.68 0.52 *** 0.06 0.26 *** 0.04 0.26 *** 0.07 -0.01 0.10
Difference 42,818 -0.12 0.28 *** 0.07 0.12 ** 0.05 0.15 * 0.09 -0.03 0.13
Whole Grains
SNAP model 25,087 1.72 0.21 *** 0.06 0.04 0.09 0.16 0.11 -0.12 0.20
WIC model 18,078 1.55 0.91 *** 0.10 0.22 *** 0.08 0.69 *** 0.13 -0.46 ** 0.19
Difference 43,165 -0.17 0.70 *** 0.11 0.18 0.12 0.52 *** 0.17 -0.35 0.27
Dairy Products
SNAP model 25,167 2.24 0.11 *** 0.03 0.08 *** 0.03 0.02 0.04 0.06 0.06
WIC model 18,135 2.25 0.38 *** 0.05 0.05 0.04 0.33 *** 0.06 -0.28 *** 0.09
Difference 43,302 0.01 0.28 *** 0.06 -0.03 0.04 0.31 *** 0.07 -0.34 *** 0.10
Usually Drank Nonfat or Low-fat Milk (%)
SNAP model 24,399 16.25 -0.04 0.82 0.19 0.81 -0.23 1.15 0.42 1.82
WIC model 18,007 10.29 -1.29 1.28 0.52 0.71 -1.81 1.47 2.32 1.92
Difference 42,406 -5.97 -1.25 1.53 0.32 1.08 -1.58 1.88 1.90 2.65
Added Sugars
SNAP model 24,662 17.83 0.20 0.21 0.17 0.23 0.03 0.32 0.14 0.52
WIC model 17,832 18.80 -0.74 ** 0.29 0.08 0.29 -0.83 ** 0.41 0.91 0.64
Difference 42,494 0.97 -0.95 *** 0.36 -0.09 0.37 -0.86 * 0.52 0.78 0.82
Added Sugars Excluding Cereals
SNAP model 24,839 16.65 0.05 0.19 0.18 0.21 -0.12 0.28 0.30 0.45
WIC model 17,961 17.78 -1.25 *** 0.26 -0.16 0.25 -1.09 *** 0.36 0.92 0.57
Difference 42,800 1.13 -1.30 *** 0.32 -0.34 0.33 -0.96 ** 0.46 0.62 0.73

Appendix 4 Page 120
Sample Size No Benefits Group (%)
$60 Benefit vs. $0 Benefit
$60 Benefit vs. $30 Benefit
$30 Benefit vs. $0 Benefit
$60-$30 Difference vs. $30-$0 Difference
Difference Std. Error Difference Std. Error Difference Std. Error Difference Std. Error
Sugar-Sweetened Beverages
SNAP model 25,150 7.62 -0.12 0.20 0.23 0.22 -0.36 0.30 0.59 0.49
WIC model 18,207 8.93 -1.28 *** 0.28 -0.14 0.28 -1.14 *** 0.40 1.00 0.63
Difference 43,357 1.31 -1.16 *** 0.34 -0.38 0.36 -0.78 0.50 0.40 0.80 Source: From regression model estimated on pooled SEBTC Summer Survey data for 2012 and 2013.
*.05 < p < .10, **.01 < p < .05, ***p <. 01.

Appendix 4 Page 121
Exhibit 4.N Estimated Impact of SEBTC on Children’s Food Consumption in Summer, by Poverty Status
Sample Size No Benefits Group (%)
$60 Benefit vs. $0 Benefit
$60 Benefit vs. $30 Benefit
$30 Benefit vs. $0 Benefit
$60-$30 Difference vs. $30-$0 Difference
Difference Std. Error Difference Std. Error Difference Std. Error Difference Std. Error
Fruits and Vegetables
Not below 100% FPL 10,523 2.65 0.37 *** 0.05 0.23 *** 0.05 0.14 ** 0.06 0.08 0.09
Below 100% FPL 25,668 2.93 0.38 *** 0.04 0.19 *** 0.03 0.19 *** 0.05 0.01 0.07
Difference 36,191 0.29 0.02 0.06 -0.03 0.05 0.05 0.06 -0.08 0.10
Fruits and Vegetables without Fried Potatoes
Not below 100% FPL 10,530 2.53 0.37 *** 0.05 0.23 *** 0.04 0.15 ** 0.06 0.08 0.09
Below 100% FPL 25,700 2.81 0.39 *** 0.04 0.19 *** 0.03 0.20 *** 0.05 -0.01 0.07
Difference 36,230 0.28 0.01 0.06 -0.04 0.05 0.05 0.06 -0.09 0.10
Whole Grains
Not below 100% FPL 10,549 1.35 0.50 *** 0.08 0.00 0.10 0.50 *** 0.12 -0.49 ** 0.20
Below 100% FPL 25,956 1.83 0.44 *** 0.10 0.16 ** 0.07 0.28 ** 0.11 -0.12 0.16
Difference 36,505 0.47 -0.05 0.11 0.16 0.11 -0.21 * 0.12 0.37 * 0.20
Dairy Products
Not below 100% FPL 10,599 2.11 0.24 *** 0.04 0.00 0.04 0.25 *** 0.05 -0.25 *** 0.09
Below 100% FPL 26,015 2.25 0.27 *** 0.04 0.09 *** 0.03 0.18 *** 0.04 -0.10 0.06
Difference 36,614 0.14 0.02 0.05 0.09 * 0.05 -0.06 0.05 0.15 * 0.09
Usually Drank Nonfat or Low-fat Milk (%)
Not below 100% FPL 10,210 22.05 -2.40 2.03 -0.27 1.20 -2.13 2.16 1.86 2.85
Below 100% FPL 25,542 11.38 0.47 0.78 0.58 0.62 -0.11 0.97 0.70 1.43
Difference 35,752 -10.70 2.87 2.12 0.85 1.32 2.02 2.20 -1.16 2.95
Added Sugars
Not below 100% FPL 10,395 16.88 -0.28 0.29 0.21 0.27 -0.49 0.36 0.70 0.56
Below 100% FPL 25,550 18.33 -0.31 0.23 -0.10 0.22 -0.22 0.30 0.12 0.48
Difference 35,945 1.45 -0.04 0.34 -0.31 0.32 0.27 0.39 -0.58 0.63
Added Sugars Excluding Cereals
Not below 100% FPL 10,467 16.20 -0.55 ** 0.27 0.28 0.24 -0.83 ** 0.33 1.11 ** 0.51
Below 100% FPL 25,721 17.11 -0.67 *** 0.20 -0.22 0.20 -0.45 * 0.27 0.23 0.43
Not below 100% FPL 36,188 0.91 -0.12 0.31 -0.50 * 0.29 0.38 0.35 -0.88 0.57

Appendix 4 Page 122
Sample Size No Benefits Group (%)
$60 Benefit vs. $0 Benefit
$60 Benefit vs. $30 Benefit
$30 Benefit vs. $0 Benefit
$60-$30 Difference vs. $30-$0 Difference
Difference Std. Error Difference Std. Error Difference Std. Error Difference Std. Error
Sugar-Sweetened Beverages
Not below 100% FPL 10,589 7.22 -0.67 ** 0.29 0.28 0.24 -0.95 *** 0.35 1.22 ** 0.53
Below 100% FPL 26,049 8.11 -0.74 *** 0.21 -0.21 0.22 -0.53 * 0.29 0.31 0.47
Not below 100% FPL 36,638 0.90 -0.07 0.33 -0.49 0.31 0.42 0.38 -0.91 0.61 Source: From regression model estimated on pooled SEBTC Summer Survey data for 2012 and 2013.
*.05 < p < .10, **.01 < p < .05, ***p <. 01.

Appendix 4 Page 123
Exhibit 4.O Estimated Impact of SEBTC on Children’s Food Consumption in Summer, by School District Locale
Sample Size No Benefits Group (%)
$60 Benefit vs. $0 Benefit
$60 Benefit vs. $30 Benefit
$30 Benefit vs. $0 Benefit
$60-$30 Difference vs. $30-$0 Difference
Difference Std. Error Difference Std. Error Difference Std. Error Difference Std. Error
Fruits and Vegetables
Difference overall 42,774 F(4,64) = 0.97, p=0.423
Rural 7,868 2.79 0.48 *** 0.11 0.28 *** 0.06 0.19 * 0.11 0.09 0.14
Town/suburb 14,968 2.87 0.34 *** 0.05 -0.11 0.08 0.17 *** 0.06 -0.08 0.16
Urban 19,938 2.91 0.33 *** 0.03 -0.12 * 0.07 0.17 *** 0.05 -0.10 0.16
Rural vs. urban difference 27,806 -0.11 0.15 0.11 0.12 * 0.07 0.02 0.12 0.10 0.16
Town vs. urban difference 34,906 -0.04 0.01 0.06 0.01 0.06 0.00 0.07 0.01 0.12
Rural vs. town difference 22,836 -0.08 0.13 0.11 0.11 0.08 0.03 0.11 0.08 0.16
Fruits and Vegetables without Fried Potatoes
Difference overall 42,818 F(4,64) = 1.19, p=0.313
Rural 7,874 2.66 0.48 *** 0.11 0.29 *** 0.06 0.19 * 0.11 0.09 0.14
Town/suburb 14,985 2.74 0.35 *** 0.05 -0.12 0.08 0.17 *** 0.06 -0.09 0.15
Urban 19,959 2.78 0.33 *** 0.03 -0.13 * 0.07 0.17 *** 0.05 -0.11 0.16
Rural vs. urban difference 27,833 -0.12 0.16 0.11 0.13 * 0.07 0.02 0.12 0.11 0.16
Town vs. urban difference 34,944 -0.04 0.02 0.06 0.02 0.06 0.00 0.07 0.01 0.12
Rural vs. town difference 22,859 -0.08 0.14 0.11 0.12 0.08 0.02 0.11 0.09 0.15
Whole Grains
Difference overall 43,165 F(4,64) = 4.42***, p<0.001
Rural 7,919 1.38 0.83 *** 0.15 0.45 *** 0.09 0.38 ** 0.15 0.07 0.20
Town/suburb 15,105 1.49 0.44 *** 0.07 -0.45 *** 0.12 0.44 *** 0.11 -0.51 ** 0.24
Urban 20,141 1.87 0.41 *** 0.07 -0.39 *** 0.14 0.35 *** 0.12 -0.36 0.29
Rural vs. urban difference 28,060 -0.49 0.42 ** 0.16 0.39 *** 0.14 0.03 0.19 0.36 0.29
Town vs. urban difference 35,246 -0.38 0.03 0.10 -0.06 0.13 0.09 0.15 -0.15 0.27
Rural vs. town difference 23,024 -0.11 0.39 ** 0.16 0.45 *** 0.12 -0.06 0.16 0.51 ** 0.24
Dairy Products
Difference overall 43,302 F(4,64) = 1.08, p=0.125
Rural 7,955 2.25 0.39 *** 0.09 0.14 *** 0.05 0.25 *** 0.09 -0.11 0.11
Town/suburb 15,164 2.26 0.17 *** 0.04 -0.10 0.07 0.13 ** 0.05 0.02 0.13
Urban 20,183 2.24 0.20 *** 0.03 -0.09 0.06 0.15 *** 0.04 0.01 0.13
Rural vs. urban difference 28,138 0.01 0.19 ** 0.09 0.09 0.06 0.10 0.09 -0.01 0.13
Town vs. urban difference 35,347 0.02 -0.03 0.05 -0.01 0.05 -0.02 0.06 0.01 0.10
Rural vs. town difference 23,119 0.00 0.22 *** 0.09 0.10 0.07 0.12 0.09 -0.02 0.13

Appendix 4 Page 124
Sample Size No Benefits Group (%)
$60 Benefit vs. $0 Benefit
$60 Benefit vs. $30 Benefit
$30 Benefit vs. $0 Benefit
$60-$30 Difference vs. $30-$0 Difference
Difference Std. Error Difference Std. Error Difference Std. Error Difference Std. Error
Usually Drank Nonfat or Low-fat Milk (%)
Difference overall 42,406 F(4,64) = 1.32, p=0.259
Rural 7,854 9.79 1.69 1.73 -1.43 1.21 3.12 2.02 -4.54 2.85
Town/suburb 14,812 16.12 -1.06 1.68 2.24 1.60 -1.87 1.99 7.22 * 4.25
Urban 19,740 13.35 -0.92 0.68 2.34 1.47 -1.82 * 1.06 7.27 ** 3.34
Rural vs. urban difference 27,594 -3.55 2.60 1.85 -2.34 1.47 4.94 ** 2.26 -7.27 ** 3.34
Town vs. urban difference 34,552 2.77 -0.14 1.77 -0.09 1.23 -0.04 2.14 -0.05 3.01
Rural vs. town difference 22,666 -6.33 2.74 2.53 -2.24 1.60 4.98 3.11 -7.22 * 4.25
Added Sugars
Difference overall 42,494 F(4,64) = 2.57**, p=0.036
Rural 7,818 18.67 -1.29 *** 0.49 -0.33 0.32 -0.96 * 0.54 0.63 0.73
Town/suburb 14,856 18.40 -0.26 0.28 0.37 0.44 -0.31 0.39 -0.28 0.92
Urban 19,820 18.02 0.22 0.22 0.79 * 0.42 -0.24 0.34 0.07 0.92
Rural vs. urban difference 27,638 0.65 -1.51 *** 0.54 -0.79 * 0.42 -0.72 0.62 -0.07 0.92
Town vs. urban difference 34,676 0.37 -0.48 0.35 -0.41 0.40 -0.06 0.49 -0.35 0.82
Rural vs. town difference 22,674 0.28 -1.03 * 0.54 -0.37 0.44 -0.65 0.61 0.28 0.92
Added Sugars Excluding Cereals
Difference overall 42,800 F(4,64) = 3.33***, p=0.010
Rural 7,870 17.82 -1.69 *** 0.45 -0.48 0.29 -1.22 ** 0.47 0.74 0.65
Town/suburb 14,956 17.32 -0.50 ** 0.25 0.50 0.40 -0.53 0.35 -0.19 0.81
Urban 19,974 16.76 -0.08 0.19 0.77 ** 0.38 -0.37 0.30 -0.08 0.81
Rural vs. urban difference 27,844 1.06 -1.61 *** 0.48 -0.77 ** 0.38 -0.85 0.55 0.08 0.81
Town vs. urban difference 34,930 0.56 -0.42 0.30 -0.26 0.35 -0.16 0.44 -0.10 0.73
Rural vs. town difference 22,826 0.50 -1.19 ** 0.49 -0.50 0.40 -0.69 0.54 0.19 0.81
Sugar-Sweetened Beverages
Difference overall 43,357 F(4,64) = 2.67**, p=0.030
Rural 7,966 9.02 -1.57 *** 0.45 -0.39 0.31 -1.18 ** 0.50 0.80 0.70
Town/suburb 15,126 8.48 -0.67 ** 0.28 0.31 0.45 -0.58 0.41 -0.29 0.94
Urban 20,265 7.67 -0.24 0.20 0.81 ** 0.40 -0.67 ** 0.31 0.30 0.86
Rural vs. urban difference 28,231 1.35 -1.33 *** 0.49 -0.81 ** 0.40 -0.52 0.58 -0.30 0.86
Town vs. urban difference 35,391 0.81 -0.43 0.34 -0.51 0.40 0.08 0.48 -0.59 0.82
Rural vs. town difference 23,092 0.55 -0.90 * 0.51 -0.31 0.45 -0.60 0.61 0.29 0.94 Source: From regression model estimated on pooled SEBTC Summer Survey data for 2012 and 2013.
*.05 < p < .10, **.01 < p < .05, ***p <. 01.

Appendix 4 Page 125
Exhibit 4.P Estimated Impact of SEBTC on Food Expenditures in Summer
Outcome Sample Size No Benefits Group (%)
$60 Benefit vs. $0 Benefit
$60 Benefit vs. $30 Benefit
$30 Benefit vs. $0 Benefit
$60-$30 Difference vs. $30-$0 Difference
Difference Std. Error Difference Std. Error Difference Std. Error Difference Std. Error
Total Food Expenditures (SEBTC + out-of-pocket + SNAP)
46,053 $578.50 -39.50 *** 4.02 -19.00 *** 4.20 -20.50 *** 5.81 1.50 9.30
SEBTC benefits redeemed 47,855 $ 0.00 92.90 *** 0.70 45.70 *** 0.63 47.20 *** 0.94 -1.60 1.44
SNAP plus out-of-pocket (Grocery + Restaurants)
45,641 $577.30 53.70 *** 4.09 26.90 *** 4.24 26.80 *** 5.89 0.20 9.41
Spending at grocery stores 47,311 $289.70 -32.60 *** 3.22 -17.50 *** 3.25 -15.10 *** 4.58 -2.40 7.26
Spending at restaurants 47,617 $59.70 -3.50 *** 1.30 -0.50 1.28 -3.10 * 1.82 2.60 2.86 Source: From regression model estimated on pooled SEBTC Summer Survey data for 2011, 2012, and 2013.
Note: Numbers may not add due to rounding.
*.05 < p < .10, **.01 < p < .05, ***p < .01.
Exhibit 4.Q Estimated Impact of SEBTC on Food Expenditures in Summer, by WIC/SNAP Program Model
Sample Size No Benefits Group (%)
$60 Benefit vs. $0 Benefit
$60 Benefit vs. $30 Benefit
$30 Benefit vs. $0 Benefit
$60-$30 Difference vs. $30-$0 Difference
Difference Std. Error Difference Std. Error Difference Std. Error Difference Std. Error
Total Food Expenditures (SEBTC + out-of-pocket + SNAP)
SNAP model 26,368 $579.80 66.6 *** 5.10 27.8 *** 5.94 38.8 *** 7.83 -10.9 12.92
WIC model 19,273 $575.30 34.7 *** 6.80 25.9 *** 6.03 8.8 9.08 17.0 13.83
Difference 45,641 $-4.50 -31.9 *** 8.51 -2.0 8.45 -29.9 ** 12.00 28.0 18.93
SEBTC Benefits Redeemed
SNAP model 27,659 -$2.90 103.2 *** 0.70 46.8 *** 0.80 56.4 *** 1.06 -9.6 *** 1.75
WIC model 20,196 $2.20 77.7 *** 1.40 44.3 *** 0.99 33.5 *** 1.71 10.8 *** 2.41
Difference 47,855 $5.10 -25.4 *** 1.56 -2.5 ** 1.27 -22.9 *** 2.01 20.4 *** 2.98
SNAP plus Out-of-Pocket Expenditures
SNAP model 26,609 $582.60 -37.0 *** 4.96 -19.4 *** 5.88 -17.6 ** 7.69 -1.8 12.76
WIC model 19,444 $573.10 -43.2 *** 6.76 -18.5 *** 5.96 -24.7 *** 9.00 6.2 13.69
Difference 46,053 -$9.50 -6.2 8.39 1.0 8.36 -7.1 11.85 8.1 18.72 Source: From regression model estimated on pooled SEBTC Summer Survey data for 2011, 2012, and 2013.
Note: Numbers may not add due to rounding.
*.05 < p < .10, **.01 < p < .05, ***p < .01.

Appendix 4 Page 126
Exhibit 4.R Estimated Impact of SEBTC on Participation in Nutrition Assistance Programs in Summer
Outcome Sample Size No Benefits Group (%)
$60 Benefit vs. $0 Benefit
$60 Benefit vs. $30 Benefit
$30 Benefit vs. $0 Benefit
$60-$30 Difference vs. $30-$0 Difference
Difference Std. Error Difference Std. Error Difference Std. Error Difference Std. Error Participation in SFSP 48,004 7.3% -0.7 ** 0.32 -0.7 * 0.38 -0.1 0.50 -0.6 0.82
Participation in SNAP 48,235 62.5% 0.8 0.52 -0.2 0.47 1.1 0.70 -1.3 1.07 Participation in WIC 48,230 19.3% 1.4 *** 0.51 -0.5 0.41 2 *** 0.65 -2.5 *** 0.95 Child receives free lunch 47,804 18.9% -2.3 *** 0.50 -0.3 0.60 -2 ** 0.78 1.7 1.30 Source: From regression model estimated on pooled SEBTC Summer Survey data for 2011, 2012, and 2013.
*.05 < p < .10, **.01 < p < .05, ***p < .01.