Summary Vanguard Small Cap Growth Index Fund (VBK) · Vanguard Small Cap Growth Index Fund (VBK)...
6
Vanguard Small Cap Growth Index Fund (VBK) Tearsheet as of 7:52 pm, May 02, 2014. Last 120.01 Change 0.38 (0.32%) Last Volume 1178 Bid 113.55 Ask 121.20 High 120.70 Low 119.46 Open 119.84 Previous Close 119.63 Volume 159K Dividend Yield 0.02% Beta 1.24 52wk High 129.65 52wk Low 115.70 Date 5/2/2014 Time 6:40:04 PM Key - Green Diamond Reward Ratings Key: 1 2 3 4 5 6 7 8 9 10 Underperform Market Perform Outperform Key - Red Diamond Risk Ratings Key: 1 2 3 4 5 6 7 8 9 10 Low Risk Moderate Risk High Risk Summary RATINGS* DIAMONDS* ETFG RISK RATING 4.16 ETFG REWARD RATING 4.60 Description Vanguard Small-Cap Growth ETF is an exchange-traded fund incorporated in the USA. The Fund seeks to track the performance of the CRSP U.S. Small Cap Growth Index. The Fund invests all of its assets in the stocks that make up the Index holding each stock in the same proportion as its weighting in the Index. ETFG SCORE BEHAVIORAL FUNDAMENTAL GLOBAL QUALITY 49.6 45.9 43.1 62.7 77.1 Inception Date: 01/30/2004 Expense Ratio: 0.1% Related Index: CRSP US Small Cap Growth TR USD Historical prices (1 year) May 02 Apr 28 Apr 17 Apr 10 Apr 02 126.71 (c) ETF Global Page 1 of 6
Transcript of Summary Vanguard Small Cap Growth Index Fund (VBK) · Vanguard Small Cap Growth Index Fund (VBK)...
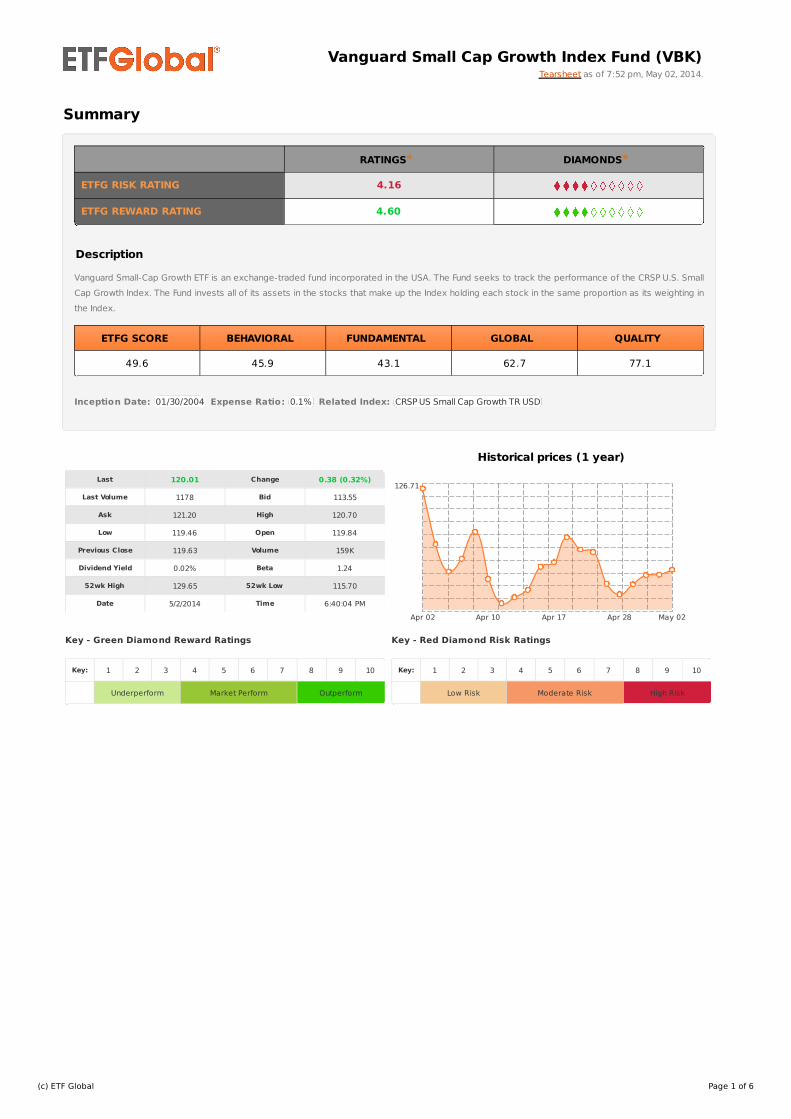
Vanguard Small Cap Growth Index Fund (VBK)Tearsheet as of 7:52 pm, May 02, 2014.
Last 120.01 Change 0.38 (0.32%)
Last Volume 1178 Bid 113.55
Ask 121.20 High 120.70
Low 119.46 Open 119.84
Previous Close 119.63 Volume 159K
Dividend Yield 0.02% Beta 1.24
52wk High 129.65 52wk Low 115.70
Date 5/2/2014 Time 6:40:04 PM
Key - Green Diamond Reward Ratings
Key: 1 2 3 4 5 6 7 8 9 10
Underperform Market Perform Outperform
Key - Red Diamond Risk Ratings
Key: 1 2 3 4 5 6 7 8 9 10
Low Risk Moderate Risk High Risk
Summary
RATINGS* DIAMONDS*
ETFG RISK RATING 4.16
ETFG REWARD RATING 4.60
Description
Vanguard Small-Cap Growth ETF is an exchange-traded fund incorporated in the USA. The Fund seeks to track the performance of the CRSP U.S. Small
Cap Growth Index. The Fund invests all of its assets in the stocks that make up the Index holding each stock in the same proportion as its weighting in
the Index.
ETFG SCORE BEHAVIORAL FUNDAMENTAL GLOBAL QUALITY
49.6 45.9 43.1 62.7 77.1
Inception Date: 01/30/2004 Expense Ratio: 0.1% Related Index: CRSP US Small Cap Growth TR USD
Historical prices (1 year)
May 02Apr 28Apr 17Apr 10Apr 02
126.71
(c) ETF Global Page 1 of 6
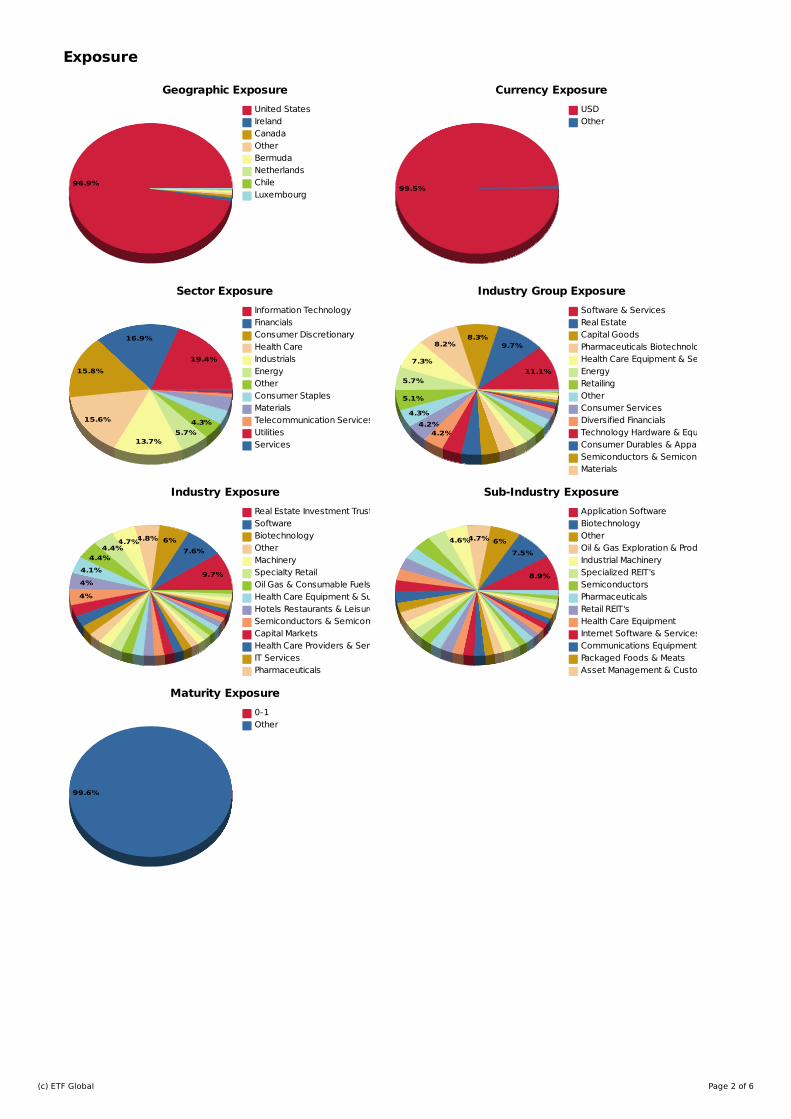
Geographic Exposure Currency Exposure
Sector Exposure Industry Group Exposure
Industry Exposure Sub-Industry Exposure
Maturity Exposure
Exposure
96.9%
United StatesIrelandCanadaOtherBermudaNetherlandsChileLuxembourg
99.5%
USDOther
19.4%
Information Technology
16.9%
Financials
15.8%
Consumer Discretionary
15.6%
Health Care
13.7%
Industrials
5.7%
Energy
4.3%
OtherConsumer StaplesMaterialsTelecommunication ServicesUtilitiesServices
11.1%
Software & Services
9.7%
Real Estate
8.3% Capital Goods8.2% Pharmaceuticals Biotechnology & Life Sciences
7.3% Health Care Equipment & Services
5.7%Energy
5.1%
Retailing
4.3%
Other
4.2%
Consumer Services
4.2%
Diversified FinancialsTechnology Hardware & EquipmentConsumer Durables & ApparelSemiconductors & Semiconductor EquipmentMaterialsFood Beverage & TobaccoCommercial & Professional ServicesBanksTransportationMediaTelecommunication ServicesTechnologyCommercial & Professional ServicesFood & Staples RetailingUtilitiesAutomobiles & ComponentsFinancialHousehold & Personal ProductsServicesInsurance
9.7%
Real Estate Investment Trusts (REITs)
7.6%
Software
6%Biotechnology4.8%
Other4.7%
Machinery
4.4%
Specialty Retail
4.4%
Oil Gas & Consumable Fuels
4.1%
Health Care Equipment & Supplies
4%
Hotels Restaurants & Leisure
4%
Semiconductors & Semiconductor EquipmentCapital MarketsHealth Care Providers & ServicesIT ServicesPharmaceuticalsHousehold DurablesFood ProductsInternet Software & ServicesCommunications EquipmentMediaEnergy Equipment & ServicesCommercial BanksCommercial Services & SuppliesMetals & MiningProfessional ServicesDiversified Financial ServicesElectronic Equipment Instruments & ComponentsElectrical EquipmentTextiles Apparel & Luxury GoodsHealth Care TechnologyRoad & RailInternet & Catalog Retail
8.9%
Application Software
7.5%
Biotechnology
6%Other4.7%
Oil & Gas Exploration & Production4.6%
Industrial MachinerySpecialized REIT'sSemiconductorsPharmaceuticalsRetail REIT'sHealth Care EquipmentInternet Software & ServicesCommunications EquipmentPackaged Foods & MeatsAsset Management & Custody BanksSpecialty StoresOffice REIT'sRegional BanksResidential REIT'sData Processing & Outsourced ServicesHealth Care SuppliesRestaurantsOil & Gas Equipment & ServicesSpecialized FinanceHealth Care ServicesApparel RetailHealth Care TechnologyHomebuildingElectrical Components & EquipmentSemiconductor EquipmentResearch & Consulting ServicesHotels Resorts & Cruise Lines
0-1
99.6%
Other
(c) ETF Global Page 2 of 6
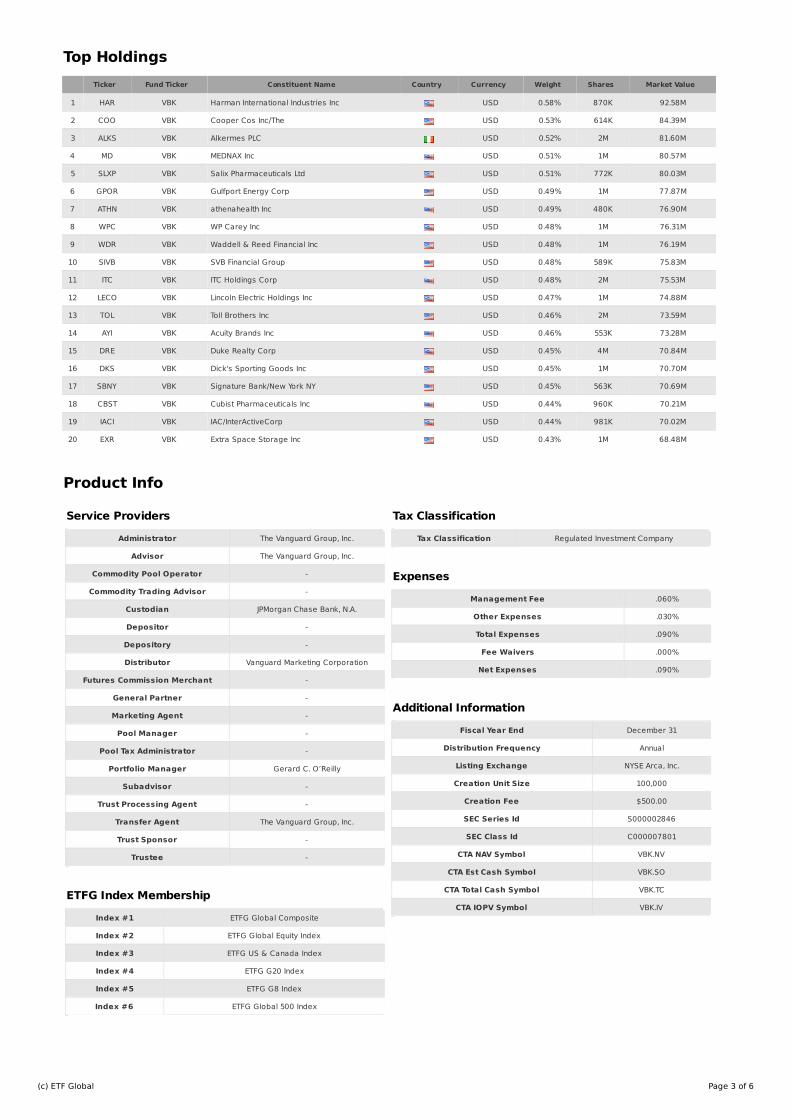
Service Providers
Administrator The Vanguard Group, Inc.
Advisor The Vanguard Group, Inc.
Commodity Pool Operator -
Commodity Trading Advisor -
Custodian JPMorgan Chase Bank, N.A.
Depositor -
Depository -
Distributor Vanguard Marketing Corporation
Futures Commission Merchant -
General Partner -
Marketing Agent -
Pool Manager -
Pool Tax Administrator -
Portfolio Manager Gerard C. O’Reilly
Subadvisor -
Trust Processing Agent -
Transfer Agent The Vanguard Group, Inc.
Trust Sponsor -
Trustee -
ETFG Index Membership
Index #1 ETFG Global Composite
Index #2 ETFG Global Equity Index
Index #3 ETFG US & Canada Index
Index #4 ETFG G20 Index
Index #5 ETFG G8 Index
Index #6 ETFG Global 500 Index
Tax Classification
Tax Classification Regulated Investment Company
Expenses
Management Fee .060%
Other Expenses .030%
Total Expenses .090%
Fee Waivers .000%
Net Expenses .090%
Additional Information
Fiscal Year End December 31
Distribution Frequency Annual
Listing Exchange NYSE Arca, Inc.
Creation Unit Size 100,000
Creation Fee $500.00
SEC Series Id S000002846
SEC Class Id C000007801
CTA NAV Symbol VBK.NV
CTA Est Cash Symbol VBK.SO
CTA Total Cash Symbol VBK.TC
CTA IOPV Symbol VBK.IV
Top Holdings
Product Info
Ticker Fund Ticker Constituent Name Country Currency Weight Shares Market Value
1 HAR VBK Harman International Industries Inc USD 0.58% 870K 92.58M
2 COO VBK Cooper Cos Inc/The USD 0.53% 614K 84.39M
3 ALKS VBK Alkermes PLC USD 0.52% 2M 81.60M
4 MD VBK MEDNAX Inc USD 0.51% 1M 80.57M
5 SLXP VBK Salix Pharmaceuticals Ltd USD 0.51% 772K 80.03M
6 GPOR VBK Gulfport Energy Corp USD 0.49% 1M 77.87M
7 ATHN VBK athenahealth Inc USD 0.49% 480K 76.90M
8 WPC VBK WP Carey Inc USD 0.48% 1M 76.31M
9 WDR VBK Waddell & Reed Financial Inc USD 0.48% 1M 76.19M
10 SIVB VBK SVB Financial Group USD 0.48% 589K 75.83M
11 ITC VBK ITC Holdings Corp USD 0.48% 2M 75.53M
12 LECO VBK Lincoln Electric Holdings Inc USD 0.47% 1M 74.88M
13 TOL VBK Toll Brothers Inc USD 0.46% 2M 73.59M
14 AYI VBK Acuity Brands Inc USD 0.46% 553K 73.28M
15 DRE VBK Duke Realty Corp USD 0.45% 4M 70.84M
16 DKS VBK Dick's Sporting Goods Inc USD 0.45% 1M 70.70M
17 SBNY VBK Signature Bank/New York NY USD 0.45% 563K 70.69M
18 CBST VBK Cubist Pharmaceuticals Inc USD 0.44% 960K 70.21M
19 IACI VBK IAC/InterActiveCorp USD 0.44% 981K 70.02M
20 EXR VBK Extra Space Storage Inc USD 0.43% 1M 68.48M
(c) ETF Global Page 3 of 6
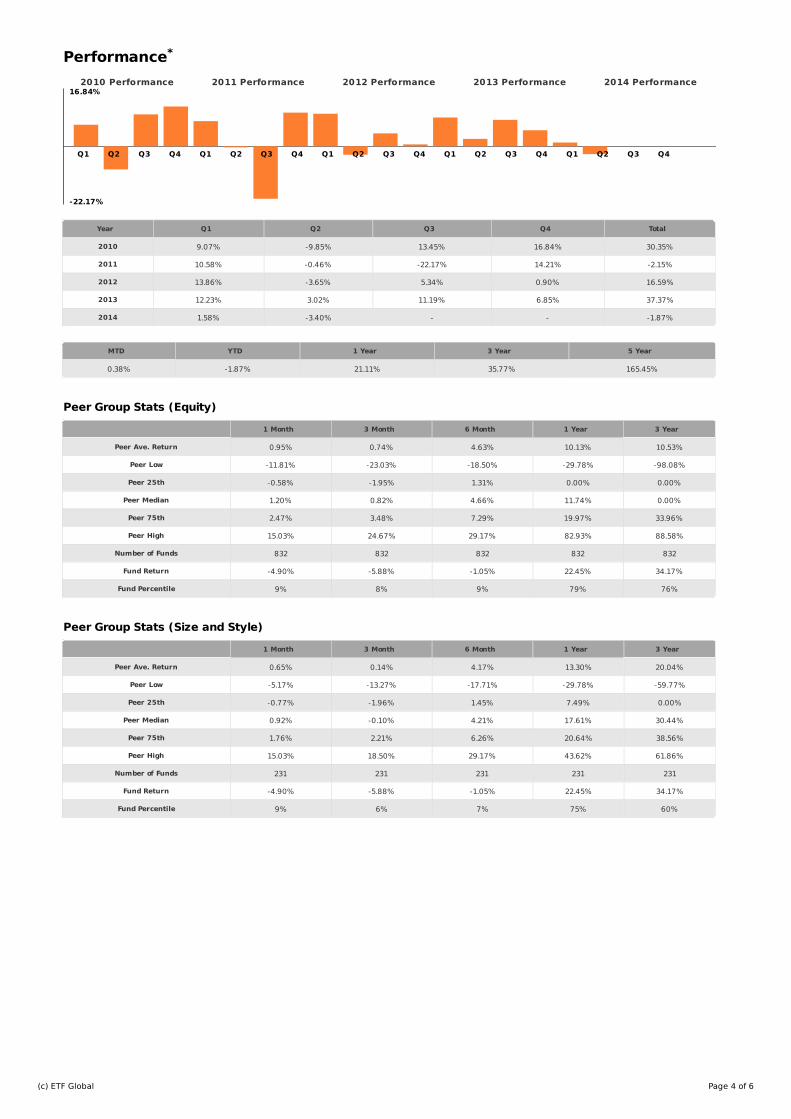
2010 Performance 2011 Performance 2012 Performance 2013 Performance 2014 Performance
Performance
Year Q1 Q2 Q3 Q4 Total
2010 9.07% -9.85% 13.45% 16.84% 30.35%
2011 10.58% -0.46% -22.17% 14.21% -2.15%
2012 13.86% -3.65% 5.34% 0.90% 16.59%
2013 12.23% 3.02% 11.19% 6.85% 37.37%
2014 1.58% -3.40% - - -1.87%
MTD YTD 1 Year 3 Year 5 Year
0.38% -1.87% 21.11% 35.77% 165.45%
Peer Group Stats (Equity)
1 Month 3 Month 6 Month 1 Year 3 Year
Peer Ave. Return 0.95% 0.74% 4.63% 10.13% 10.53%
Peer Low -11.81% -23.03% -18.50% -29.78% -98.08%
Peer 25th -0.58% -1.95% 1.31% 0.00% 0.00%
Peer Median 1.20% 0.82% 4.66% 11.74% 0.00%
Peer 75th 2.47% 3.48% 7.29% 19.97% 33.96%
Peer High 15.03% 24.67% 29.17% 82.93% 88.58%
Number of Funds 832 832 832 832 832
Fund Return -4.90% -5.88% -1.05% 22.45% 34.17%
Fund Percentile 9% 8% 9% 79% 76%
Peer Group Stats (Size and Style)
1 Month 3 Month 6 Month 1 Year 3 Year
Peer Ave. Return 0.65% 0.14% 4.17% 13.30% 20.04%
Peer Low -5.17% -13.27% -17.71% -29.78% -59.77%
Peer 25th -0.77% -1.96% 1.45% 7.49% 0.00%
Peer Median 0.92% -0.10% 4.21% 17.61% 30.44%
Peer 75th 1.76% 2.21% 6.26% 20.64% 38.56%
Peer High 15.03% 18.50% 29.17% 43.62% 61.86%
Number of Funds 231 231 231 231 231
Fund Return -4.90% -5.88% -1.05% 22.45% 34.17%
Fund Percentile 9% 6% 7% 75% 60%
*
16.84%
-22.17%
Q1 Q2 Q3 Q4 Q1 Q2 Q3 Q4 Q1 Q2 Q3 Q4 Q1 Q2 Q3 Q4 Q1 Q2 Q3 Q4
(c) ETF Global Page 4 of 6
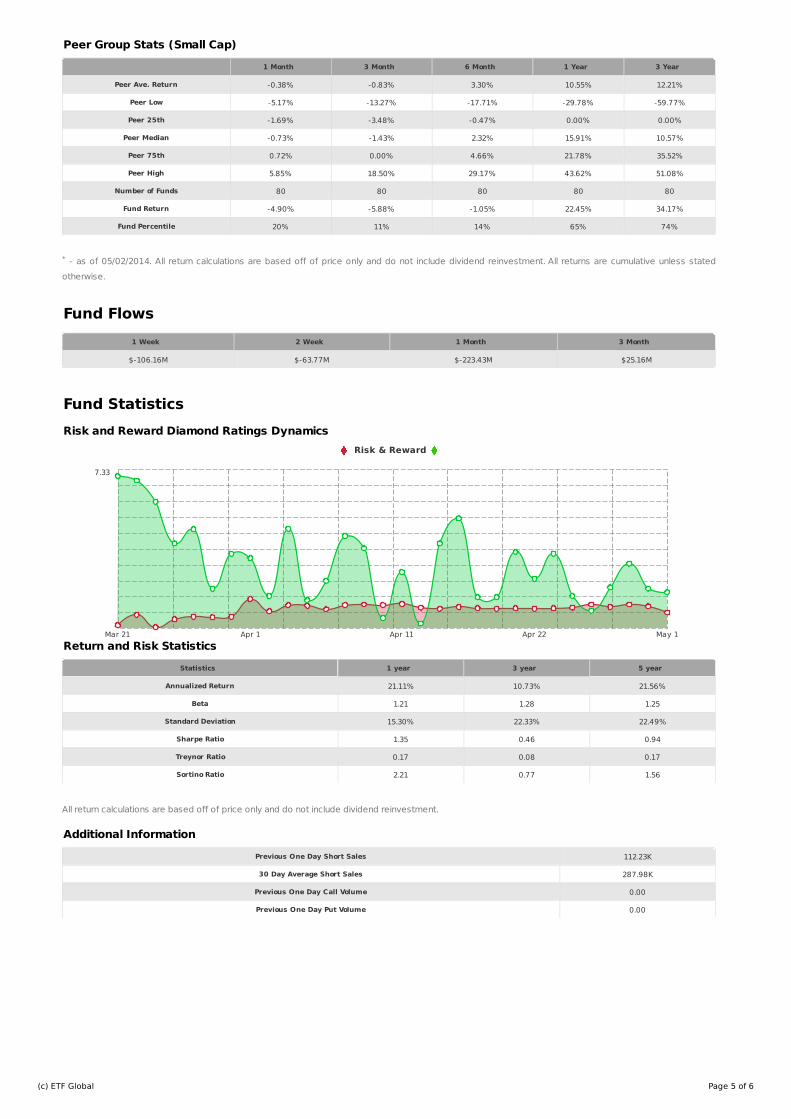
Risk & Reward
Peer Group Stats (Small Cap)
1 Month 3 Month 6 Month 1 Year 3 Year
Peer Ave. Return -0.38% -0.83% 3.30% 10.55% 12.21%
Peer Low -5.17% -13.27% -17.71% -29.78% -59.77%
Peer 25th -1.69% -3.48% -0.47% 0.00% 0.00%
Peer Median -0.73% -1.43% 2.32% 15.91% 10.57%
Peer 75th 0.72% 0.00% 4.66% 21.78% 35.52%
Peer High 5.85% 18.50% 29.17% 43.62% 51.08%
Number of Funds 80 80 80 80 80
Fund Return -4.90% -5.88% -1.05% 22.45% 34.17%
Fund Percentile 20% 11% 14% 65% 74%
- as of 05/02/2014. All return calculations are based off of price only and do not include dividend reinvestment. All returns are cumulative unless stated
otherwise.
Fund Flows
1 Week 2 Week 1 Month 3 Month
$-106.16M $-63.77M $-223.43M $25.16M
Fund Statistics
Risk and Reward Diamond Ratings Dynamics
Return and Risk Statistics
Statistics 1 year 3 year 5 year
Annualized Return 21.11% 10.73% 21.56%
Beta 1.21 1.28 1.25
Standard Deviation 15.30% 22.33% 22.49%
Sharpe Ratio 1.35 0.46 0.94
Treynor Ratio 0.17 0.08 0.17
Sortino Ratio 2.21 0.77 1.56
All return calculations are based off of price only and do not include dividend reinvestment.
Additional Information
Previous One Day Short Sales 112.23K
30 Day Average Short Sales 287.98K
Previous One Day Call Volume 0.00
Previous One Day Put Volume 0.00
*
May 1Apr 22Apr 11Apr 1Mar 21
7.33
(c) ETF Global Page 5 of 6
DISCLAIMERS
Assumptions, opinions and estimates constitute our judgment as of the date of this material and are subject to change without notice. ETF Global LLC (“ETFG”) and its affiliates and any
third-party providers, as well as their directors, officers, shareholders, employees or agents (collectively ETFG Parties) do not guarantee the accuracy, completeness, adequacy or
timeliness of any information, including ratings and are not responsible for errors and omissions or for the results obtained from the use of such information and ETFG Parties shall have
no liability for any errors, omissions, or interruptions therein, regardless of the cause, or for the results obtained from the use of such information. ETFG PARTIES DISCLAIM ANY AND ALL
EXPRESS OR IMPLIED WARRANTIES, INCLUDING, BUT NOT LIMITED TO, ANY WARRANTIES OF MERCHANTABILITY, SUITABILITY OR FITNESS FOR A PARTICULAR PURPOSE OR USE. In no event
shall ETFG Parties be liable to any party for any direct, indirect, incidental, exemplary, compensatory, punitive, special or consequential damages, costs, expenses, legal fees, or losses
(including, without limitation, lost income or lost profits and opportunity costs) in connection with any use of the information contained in this document even if advised of the possibility
of such damages. ETFG ratings are statements of opinion as of the date they are expressed and not statements of fact or recommendations to purchase, hold, or sell any securities or
to make any investment decisions. ETFG ratings should not be relied on when making any investment or other business decision. ETFG’s opinions and analyses do not address the
suitability of any security. ETFG does not act as a fiduciary or an investment advisor. While ETFG has obtained information from sources they believe to be reliable, ETFG does not
perform an audit or undertake any duty of due diligence or independent verification of any information it receives. ETFG keeps certain activities of its business units separate from each
other in order to preserve the independence and objectivity of their respective activities. As a result, certain business units of ETFG may have information that is not available to other
ETFG business units. ETFG has established policies and procedures to maintain the confidentiality of certain non-public information received in connection with each analytical process.
ETFG may receive compensation for its ratings and certain analyses. ETFG reserves the right to disseminate its opinions and analyses. ETFG's public ratings and analyses are made
available on its Websites, www.etfg.com (free of charge) and may be distributed through other means, including via ETFG publications and third party redistributors. This material is not
intended as an offer or solicitation for the purchase or sale of any security or other financial instrument. Securities, financial instruments or strategies mentioned herein may not be
suitable for all investors. Any opinions expressed herein are given in good faith, are subject to change without notice, and are only correct as of the stated date of their issue. Prices,
values, or income from any securities or investments mentioned in this report may fall against the interests of the investor and the investor may get back less than the amount invested.
Where an investment is described as being likely to yield income, please note that the amount of income that the investor will receive from such an investment may fluctuate. Where an
investment or security is denominated in a different currency to the investor's currency of reference, changes in rates of exchange may have an adverse effect on the value, price or
income of or from that investment to the investor. The information contained in this report does not constitute advice on the tax consequences of making any particular investment
decision. This material does not take into account your particular investment objectives, financial situations or needs and is not intended as a recommendation of particular securities,
financial instruments or strategies to you nor is it considered to be investment advice. Before acting on any recommendation in this material, you should consider whether it is suitable
for your particular circumstances and, if necessary, seek professional advice.
(c) ETF Global Page 6 of 6