Summary Report: Baseline Survey Nutrition Assessment · Summary Report: Baseline Survey ... Health...
25
WFP/IFAD Qinling Mountains Area Poverty Alleviation Project (China) Summary Report: Baseline Survey Nutrition Assessment December 12, 2000 Report Prepared by: Seán Kennedy IFAD Technical Advisory Division, Rome Han Zheng Wang Li WFP Vulnerability Analysis and Mapping Unit, Beijing
Transcript of Summary Report: Baseline Survey Nutrition Assessment · Summary Report: Baseline Survey ... Health...
WFP/IFAD Qinling Mountains Area
Poverty Alleviation Project (China)
Summary Report:
Baseline Survey Nutrition Assessment
December 12, 2000
Report Prepared by:
Seán Kennedy IFAD Technical Advisory Division, Rome
Han Zheng
Wang Li WFP Vulnerability Analysis and Mapping Unit, Beijing
Qinling Mountains Area Poverty Alleviation Project in Shaanxi and Hubei Provinces
I. Introduction 1. WFP/IFAD Qinling Mountain Area Poverty Alleviation Project in Shaanxi and Hubei provinces of China is a six-year integrated rural development project, combining food aid and long-term loans. The goal of the project is to improve food security and the living standards of the rural population in that area. 2. The nutrition assessment of children under 5 years old is a key part of the baseline survey, which will facilitate the measurement of changes in food security and living standards. According to field investigations carried out by the Vulnerability Analysis and Mapping (VAM) Unit and a national nutrition expert in 1998 and 1999, malnutrition was prevalent among pre-school children1 due to limited dietary variety, limited nutrition and childcare related knowledge, and insufficient access to health facilities and technicians. However, a more precise assessment of the situation was considered imperative for the project monitoring and evaluation process. The indicators generated from this survey will serve as benchmarks and will also be included in project mid-term and final evaluations, providing an important measure of project impact.
II. Methodology 3. The sample size required for the survey was calculated to be 6002 children under the age of five years per Province3, providing a total sample size of 1,200 children for the combined project area. Sampling frames were prepared and 30 clusters (Administrative Villages) were randomly selected in each Province, with 20 children weighed and measured per cluster. 4. As most Administrative Villages consist of six or more Natural Villages, a further random selection was made on the spot to determine the starting point for the data collection.
1 During a previous VAM mission to the project area, Mid Upper Arm Circumference measurements (MUAC) of pre-school children were taken. It was found that the MUAC of approximately one-third of the children measured was below 12.5cm. 2 FAO, Conducting Small-Scale Nutrition Surveys: A Field Manual (Rome: 1990). Formula used: n = D x t2 x p(1-p) m2
D = design effect (standard value of 2 for nutrition survey) n = sample size t = confidence level at 95% (standard value of 1.96) p = estimated prevalence of chronic malnutrition in the project area (est. 25%) m = margin of error at %5 (standard value of .05) Calculation: n = 2 x 1.962 x .25(1 - .25) n = 576 .052 3 According to VAM township data analysis, project areas in the two provinces have different characteristics; hence separate sampling and assessment can provide more information and better benchmark for measuring project impact in the two provinces respectively.
Baseline Survey: Nutrition Assessment, October-November 2000.
2
Qinling Mountains Area Poverty Alleviation Project in Shaanxi and Hubei Provinces
Each of the Natural Village was assigned a number, the numbers were written on slips of paper and one of these was drawn at random. Most villages had fewer than 20 children aged less than five years. In those cases all eligible children were weighed and measured, and a second Natural Village was chosen from the paper slips. When there were more eligible children than required, households were selected according to the “random walk” method.4 5. Anthropometric equipment for the survey was purchased jointly by WFP/IFAD. This included 10 locally constructed measuring boards, and 10 Chinese-made digital scales accurate to 0.1 kilogram. The equipment performed well under field conditions. Following completion of the survey, the equipment will be kept by local Project Management Offices (PMOs) for future surveys in the project area or in other WFP/IFAD projects. 6. Approximately 45 persons were trained in survey methodology and anthropometric techniques. Participants included the Monitoring and Evaluation Officers from the PMOs of Shaanxi and Hubei Provinces, and staff from the County PMOs and Maternal and Child Health Services. The training consisted a limited amount of classroom-style discussion, with larger amount of practical activities such as role playing, field testing and coaching. 7. The training and data collection in Shaanxi Province was facilitated by a nutrition and public health specialist from the IFAD Technical Advisory Division in Rome. All survey work in Hubei Province was coordinated and carried out by trained WFP/IFAD project staff without any continued external assistance. 8. Data collection for the 60 villages was completed between 19 – 30 October. Data collectors worked in pairs of two, at least one of whom was a woman. The pairs were divided between the counties according to the number of villages to be surveyed. The fieldwork took slightly longer in Shaanxi than was expected, as rain and cold weather made the dirt roads hard to travel (some villages could only be reached by walking). Despite the difficulties involved, the teams successfully completed the data collection in a relatively short period of time. 9. Data entry and analysis were carried out at the VAM Unit in Beijing. Data entry was done in an Excel worksheet, which was then imported into Epi Info 6.04 for the analysis. Epi Info is a shareware product developed by the WHO and the Centers for Disease Control (CDC) for use in public health and nutrition surveys. The software can be downloaded from the CDC website at no charge.5
III. Results 10. There are three primary indicators of malnutrition (also called anthropometric indicators). Each is briefly described in the following:
• Chronic Malnutrition (sometimes called “stunting”) is a measure of height relative to age. It is generally the result of months or years of food insecurity and nutritional deprivation. Chronic malnutrition is considered one of the best indicators of the overall wellbeing of a community.6 It is a key indicator for the monitoring and evaluation systems of WFP/IFAD assisted projects.
4 UNICEF, A Practical Handbook for Multiple Indicator Surveys (New York: 1995). 5 See www.cdc.gov.epiinfo 6 WHO, Physical Status: The use and interpretation of anthropometry (Geneva, WHO Expert Committee on Physical Status: 1995).
Baseline Survey: Nutrition Assessment, October-November 2000.
3
Qinling Mountains Area Poverty Alleviation Project in Shaanxi and Hubei Provinces
• Acute Malnutrition (sometimes called “wasting”) is a measure of weight relative to height. Acute malnutrition tends to result from shorter-term events, such as a drought or natural disaster, or a resent illness.
• Underweight is a measure of weight relative to age. Underweight is most
commonly used to monitor the status of individual children, such as in UNICEF growth promotion programs.
11. The results reported below are based on Z-scores (standard deviation units). According to WHO standards, children who have fallen more than two standard deviation units below the reference population are classified as suffering from malnutrition. Table 1: Indicators of Malnutrition—Combined Project Area (Shaanxi and Hubei). Indicator
Girls
Boys
Both Sexes
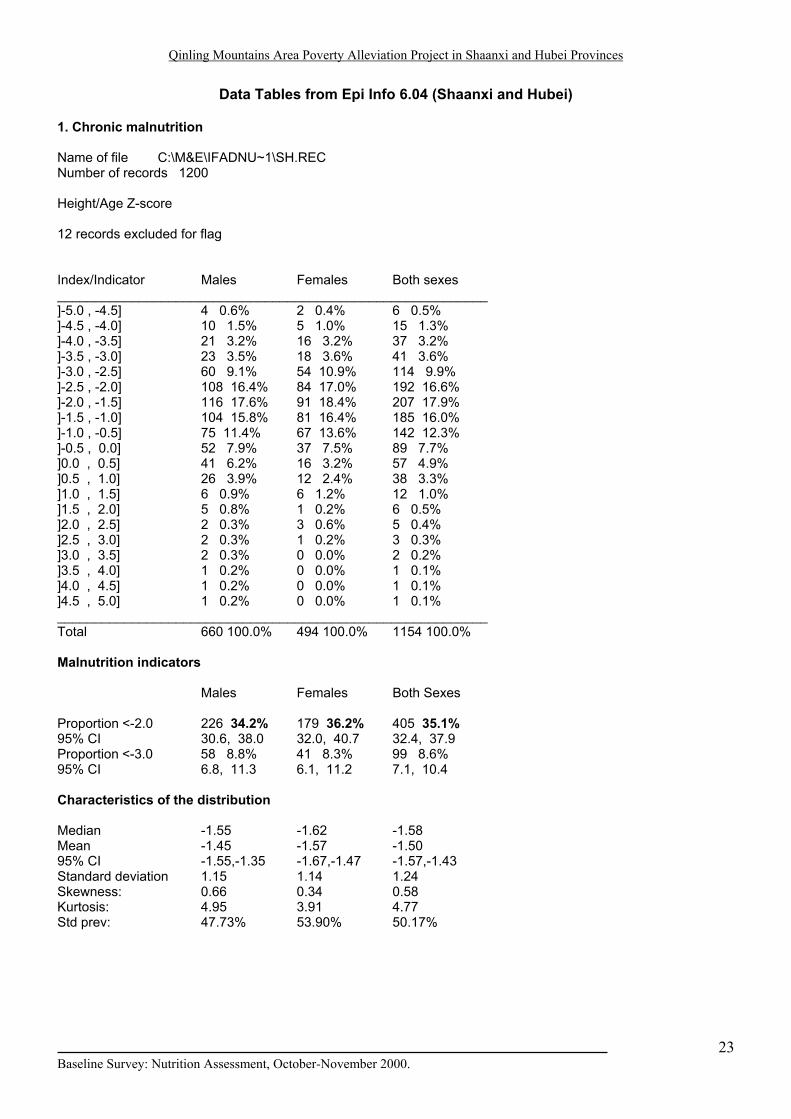
Chronic Malnutrition (height-for-age) Proportion <2.0
36.2%
34.2%
35.1%
95% Confidence Interval
32.0-40.7
30.6-38.0
32.4-37.9
Underweight (weight-for-age) Proportion <2.0
21.0 %
18.3%
19.4 %
95% Confidence Interval
17.5-24.8
15.4-21.5
17.2-21.8
Acute Malnutrition (weight-for-height) Proportion <2.0
3.6 %
3.2 %
3.4 %
95% Confidence Interval
2.2-5.8
2.0-4.9
2.4-4.6
[Source: Qinling Mountains Baseline 2000] Note: more detailed data tables and statistics are located in appendix (pages 16-24). Key Finding: Approximately 35 % of children in the project area (Shaanxi and Hubei
Provinces) suffer from chronic malnutrition. Table 2: Indicators of Malnutrition—Shaanxi Province. Indicator
Girls
Boys
Both Sexes
Chronic Malnutrition (height-for-age) Proportion <2.0
31.5 %
28.9 %
30.0 %
95% Confidence Interval
25.9 – 37.7
24.2 – 34.2
26.4 – 34.0
Underweight (weight-for-age) Proportion <2.0
21.4 %
18.6 %
19.8 %
Baseline Survey: Nutrition Assessment, October-November 2000.
4
Qinling Mountains Area Poverty Alleviation Project in Shaanxi and Hubei Provinces
95% Confidence Interval 16.7 – 27.0 14.7 – 23.3 16.7 – 23.3 Acute Malnutrition (weight-for-height) Proportion <2.0
4.7 %
3.3 %
3.9 %
95% Confidence Interval
2.6 – 8.3
1.8 – 6.0
2.6 – 5.9
[Source: Qinling Mountains Baseline 2000] Table 3: Indicators of Malnutrition—Hubei Province. Indicator
Girls
Boys
Both Sexes
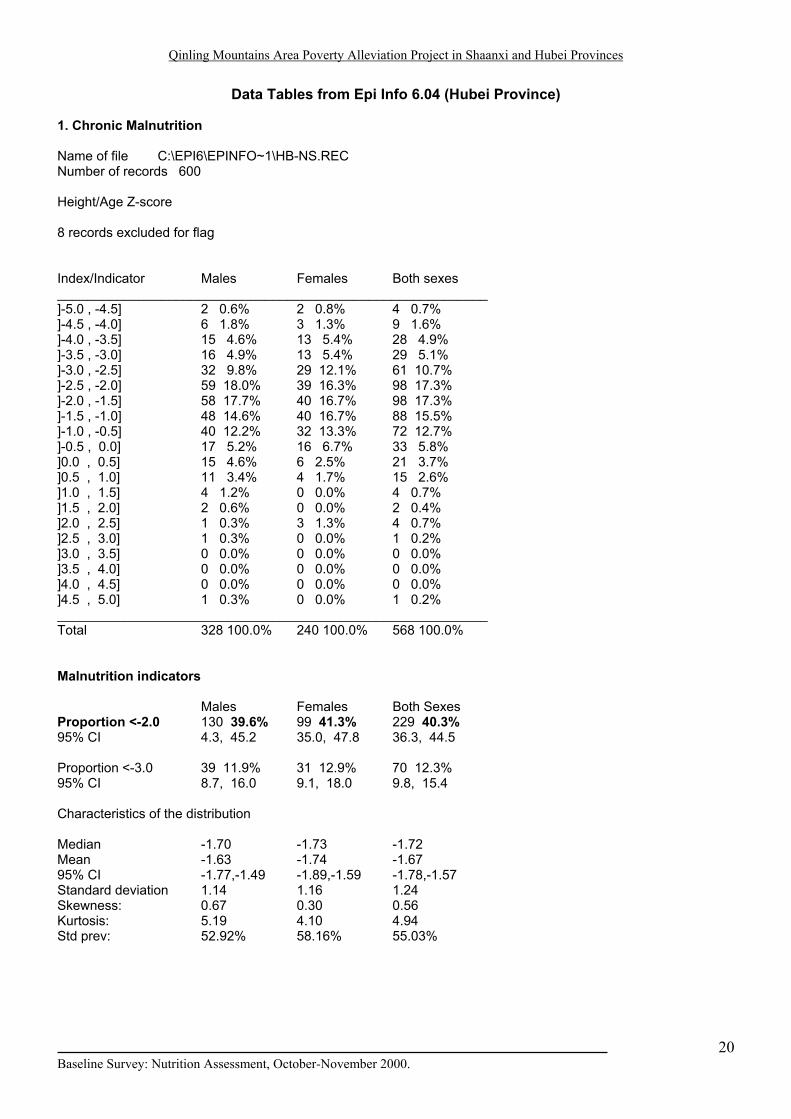
Chronic Malnutrition (height-for-age) Proportion <2.0
41.3 %
39.6 %
40.3 %
95% Confidence Interval
35.0-47.8
34.3-45.2
36.3-44.5
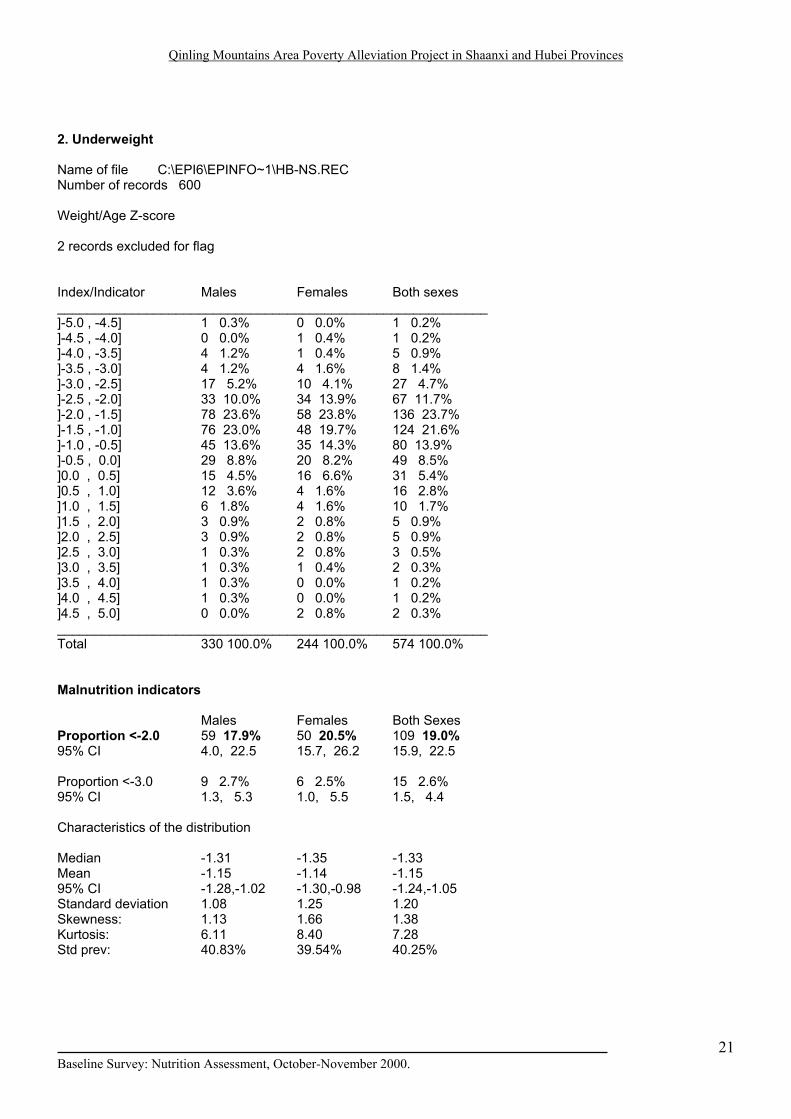
Underweight (weight-for-age) Proportion <2.0
20.5 %
17.9 %
19 %
95% Confidence Interval
15.7-26.2
14.0-22.5
15.9-22.5
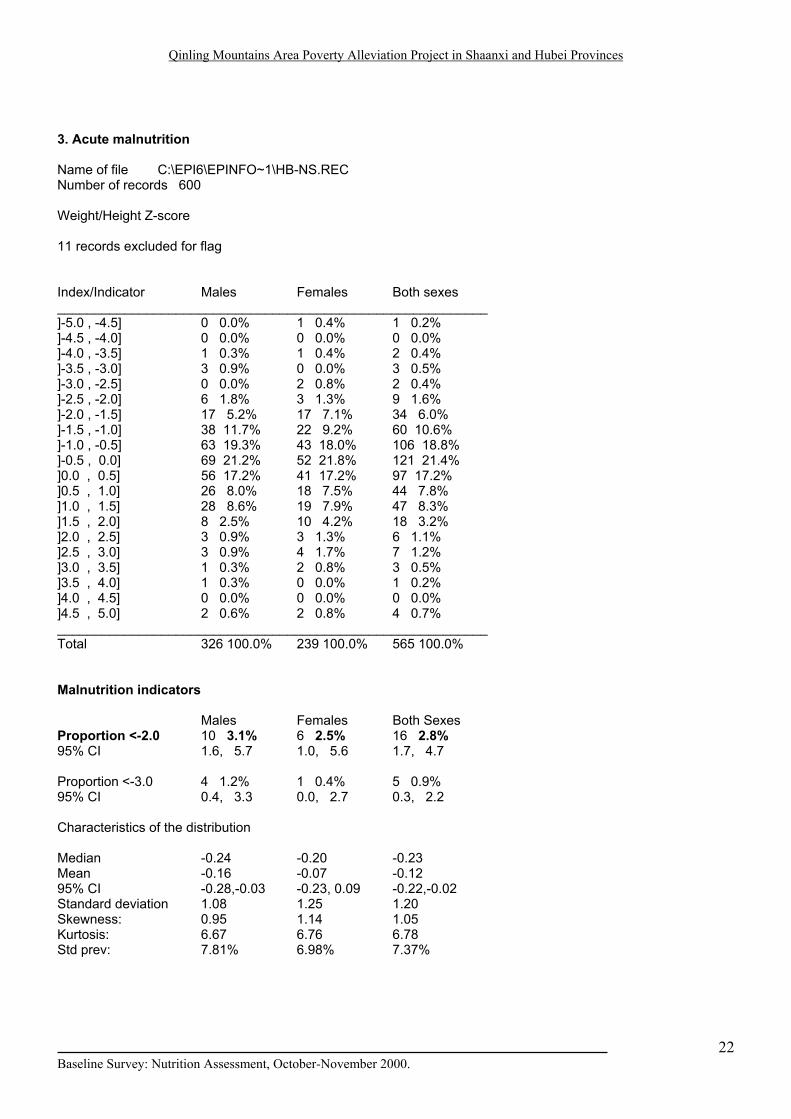
Acute Malnutrition (weight-for-height) Proportion <2.0
2.5 %
3.1%
2.8%
95% Confidence Interval
1.0-5.6
1.6-5.7
1.7-4.7
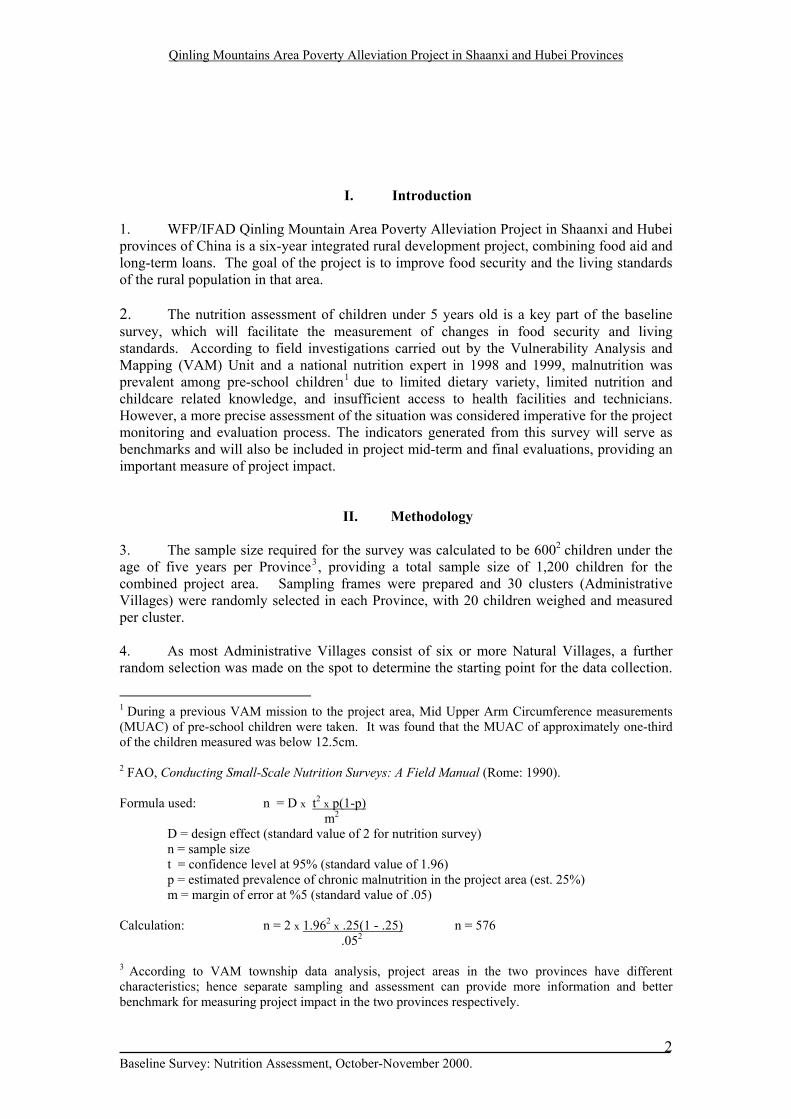
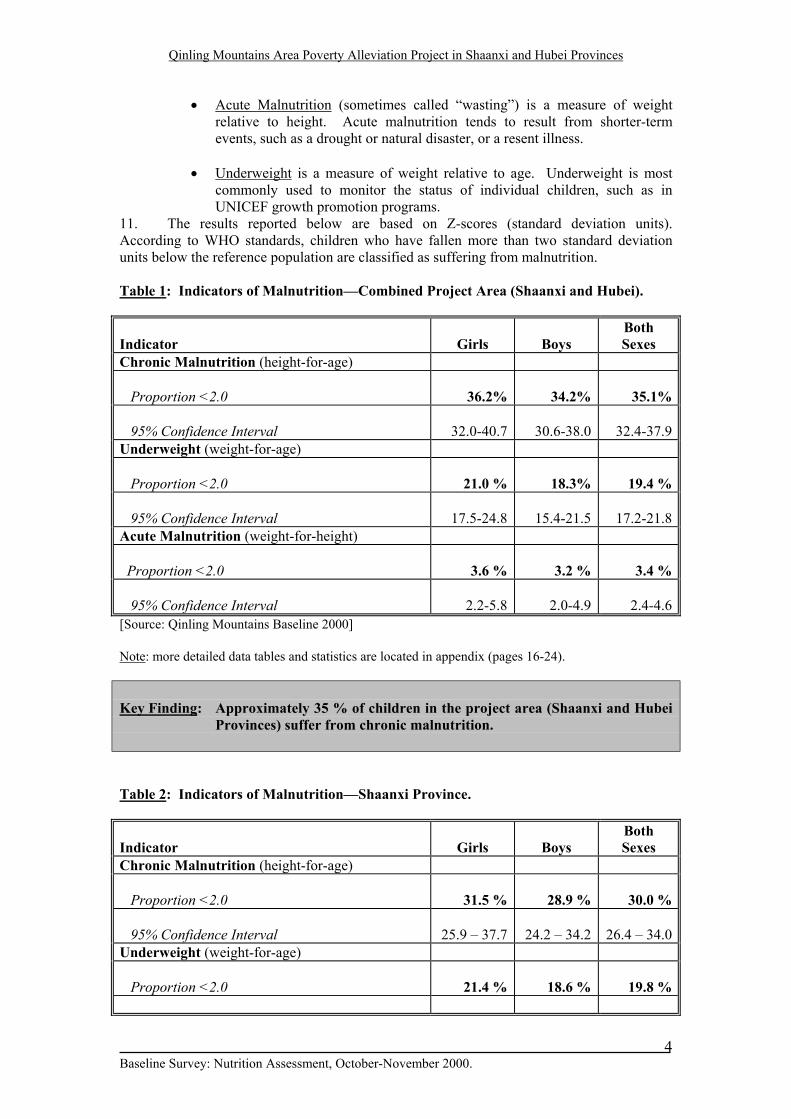
[Source: Qinling Mountains Baseline 2000] 12. There are small differences in the prevalence of malnutrition when the indicators are disaggregated by gender. In most instances, the levels of malnutrition were slightly higher for girls than boys. However, those differences are not considered statistically significant. Figure 1: Chronic Malnutrition (height-for-age).
Baseline Survey: Nutrition Assessment, October-November 2000.
5
Qinling Mountains Area Poverty Alleviation Project in Shaanxi and Hubei Provinces
05
101520253035404550
Shaanxi Hubei Combined
GirlsBoysBoth Sexes
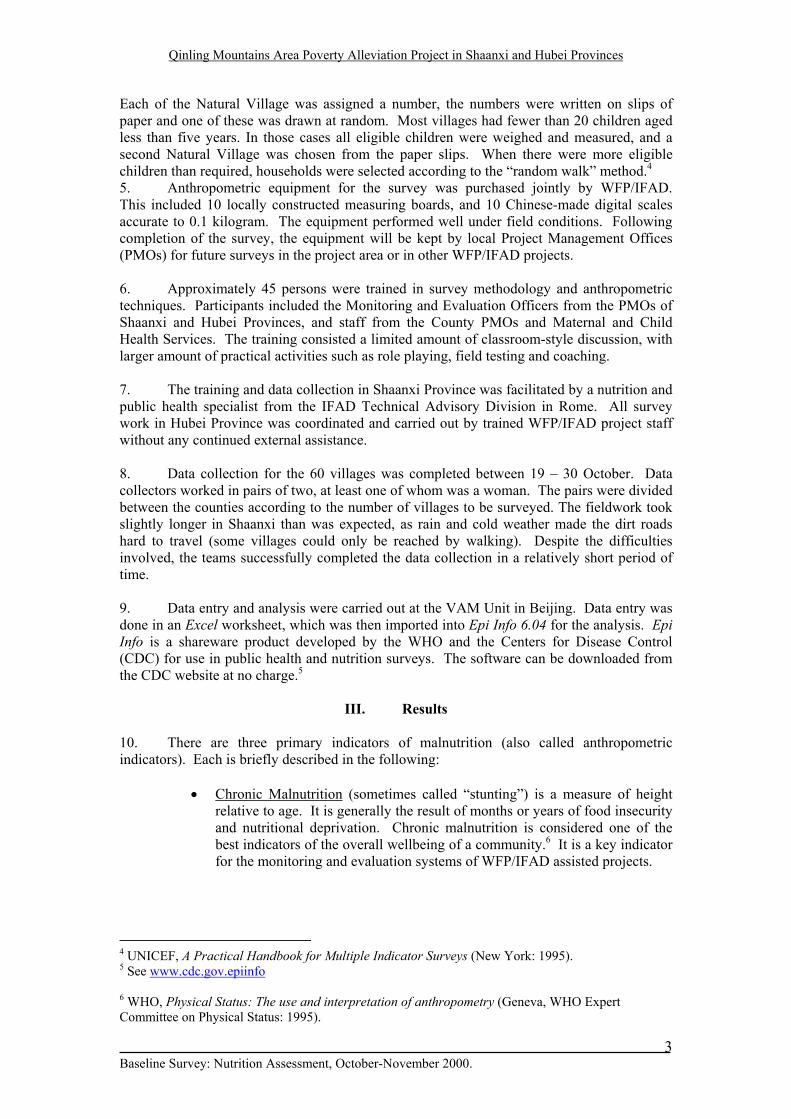
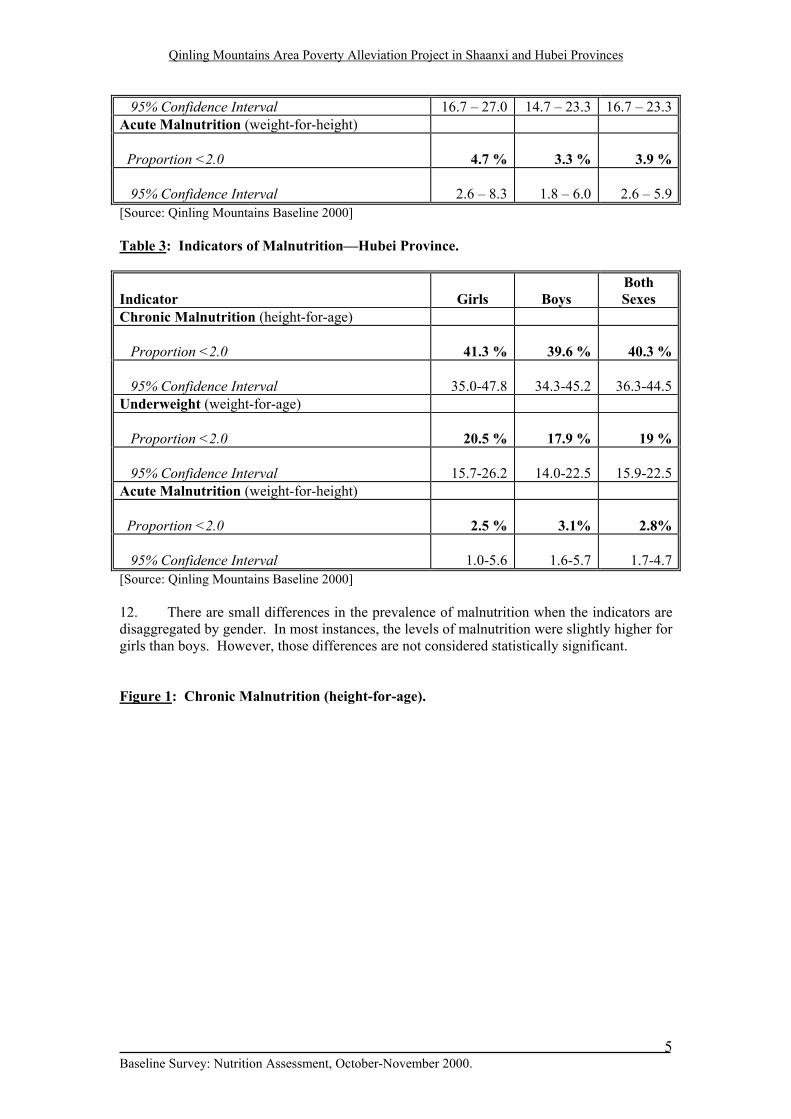
[Source: Qinling Mountains Baseline 2000] 13. The levels of chronic malnutrition were significantly higher in Hubei than in Shaanxi. That difference was approximately 10 percentage points, for both girls and boys, indicating a worse nutrition status in the Hubei Province project area. Figure 2: Underweight (weight-for-age).
05
101520253035404550
Shaanxi Hubei Combined
GirlsBoysBoth Sexes
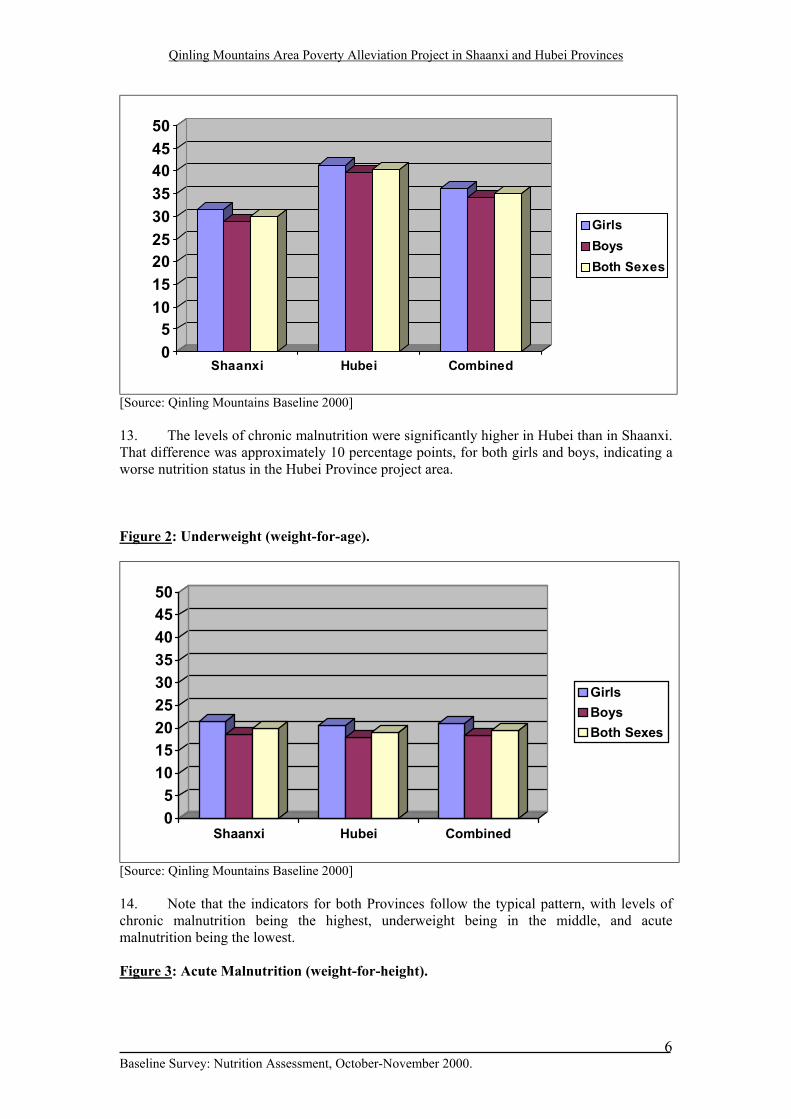
[Source: Qinling Mountains Baseline 2000] 14. Note that the indicators for both Provinces follow the typical pattern, with levels of chronic malnutrition being the highest, underweight being in the middle, and acute malnutrition being the lowest. Figure 3: Acute Malnutrition (weight-for-height).
Baseline Survey: Nutrition Assessment, October-November 2000.
6
Qinling Mountains Area Poverty Alleviation Project in Shaanxi and Hubei Provinces
05
101520253035404550
Shaanxi Hubei Combined
GirlsBoysBoth Sexes
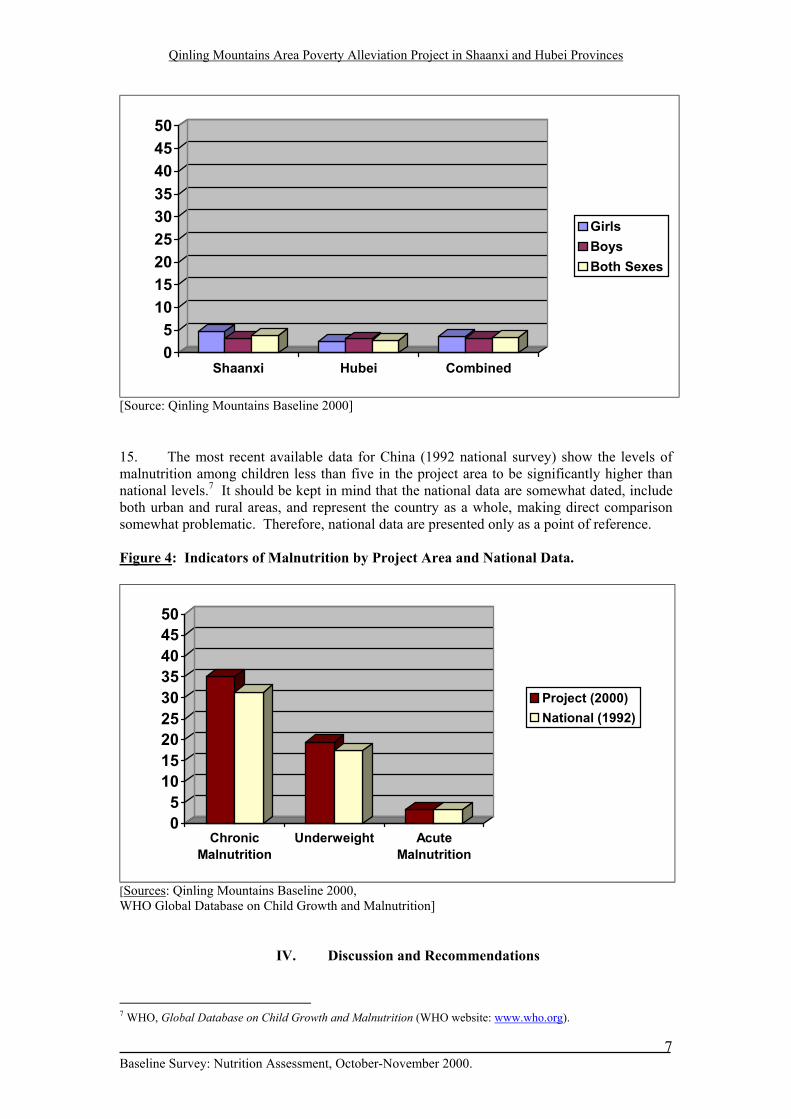
[Source: Qinling Mountains Baseline 2000] 15. The most recent available data for China (1992 national survey) show the levels of malnutrition among children less than five in the project area to be significantly higher than national levels.7 It should be kept in mind that the national data are somewhat dated, include both urban and rural areas, and represent the country as a whole, making direct comparison somewhat problematic. Therefore, national data are presented only as a point of reference. Figure 4: Indicators of Malnutrition by Project Area and National Data.
05
101520253035404550
ChronicMalnutrition
Underweight AcuteMalnutrition
Project (2000)National (1992)
[Sources: Qinling Mountains Baseline 2000, WHO Global Database on Child Growth and Malnutrition]
IV. Discussion and Recommendations
7 WHO, Global Database on Child Growth and Malnutrition (WHO website: www.who.org).
Baseline Survey: Nutrition Assessment, October-November 2000.
7
Qinling Mountains Area Poverty Alleviation Project in Shaanxi and Hubei Provinces
16. Initially, there was resistance to the idea of using a random sample of villages for the survey. Many of the participants felt that it would be preferable to select villages that were more accessible, and that such a sample would be considered “representative.” This is not an acceptable method for several reasons. Most importantly, remote or marginal communities are the populations most IFAD/WFP projects are intended to reach. Isolated villages tend to have higher levels of malnutrition and excluding them from the survey would invalidate the results. Also, underestimating the true level of malnutrition would make it more difficult for a project to demonstrate the impact of its activities.
• Recommendation: The importance of the sampling methodology should be consistently emphasized in future survey preparation. Survey reports should briefly describe how the sample size was calculated, how the sampling frame was constructed and how the villages were selected.
17. Participants were concerned that parents would not consent to the weighing and measuring procedures. Due to unseasonably cold weather, there was considerable reluctance to undress the children before weighing them, which is necessary for valid weight measures. To solve this problem, the survey team used blankets (appropriately decorated with teddy bears to appeal to the children). During the fieldwork, each mother was first weighed while holding an empty blanket. The mother then undressed the child, wrapped the child in the blanket, and was weighed a second time holding the child in the blanket. The first weight was then subtracted from the second to obtain the weight of the undressed child.
• Recommendation: This procedure should be used in other surveys where appropriate. The survey team should not weigh children who are dressed.
18. Family members most often recalled the date of birth of the child according to the Chinese lunar calendar. For this reason, both the date of the interview and the date of birth were recorded in lunar calendar format. It was thought that there were software programs able to convert the dates to the Western calendar as batch files, although the survey team could not locate the appropriate software. As a result, all dates were converted by hand at the VAM office in Beijing, which was a tedious but necessary step in the analysis.
• Recommendation: In areas where family members can accurately recall dates according to the Western calendar, the survey form should be adapted to record dates in that format. Where lunar calendar dates are used, the conversion should be done at the PMO level, not by survey workers in the field.
19. Seasonal changes in food supply, income levels and disease patterns can significantly influence several of the indicators of malnutrition. Seasonality can be a confounding factor in follow-up surveys (mid-term review, final evaluation) unless it is taken into account. All follow-up surveys should take place during the same season as the baseline. For nutrition assessments it is not required that the survey take place during a specific season, but it is important that follow-up surveys match the season of the baseline.
• Recommendation: The mid-term review for the Qinling Mountains project should be scheduled for October of 2003. Other projects should take seasonality into account when scheduling surveys.
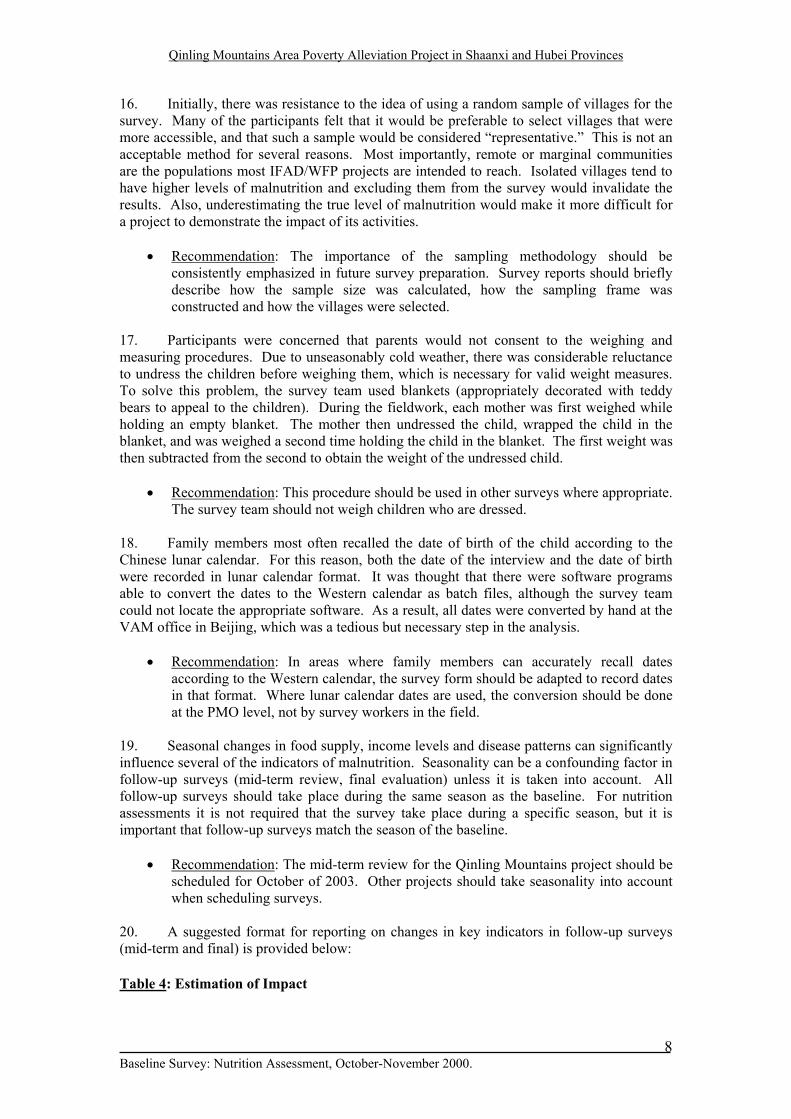
20. A suggested format for reporting on changes in key indicators in follow-up surveys (mid-term and final) is provided below: Table 4: Estimation of Impact
Baseline Survey: Nutrition Assessment, October-November 2000.
8
Qinling Mountains Area Poverty Alleviation Project in Shaanxi and Hubei Provinces
Indicator: Chronic Malnutrition (height-for-age)
Benchmark – 2000
Mid-term Review - 2003
Final evaluation - 2006
Girls
Boys
Both Sexes
Girls
Boys
Both Sexes
% change 2000- 2003
Girls
Boys
Both Sexes
% change 2000- 2006
36.2% 34.2% 35.1% x% x% x% x% y% y% y% y% 32.0- 40.7
30.6- 38.0
32.4- 37.9
Baseline Survey: Nutrition Assessment, October-November 2000.
9
Qinling Mountains Area Poverty Alleviation Project in Shaanxi and Hubei Provinces
Appendix Materials:
Survey Form, Sampling Frame, and Data Tables
Baseline Survey: Nutrition Assessment, October-November 2000.
10
Qinling Mountains Area Poverty Alleviation Project in Shaanxi and Hubei Provinces
Baseline Survey: Nutrition Assessment, October-November 2000.
11
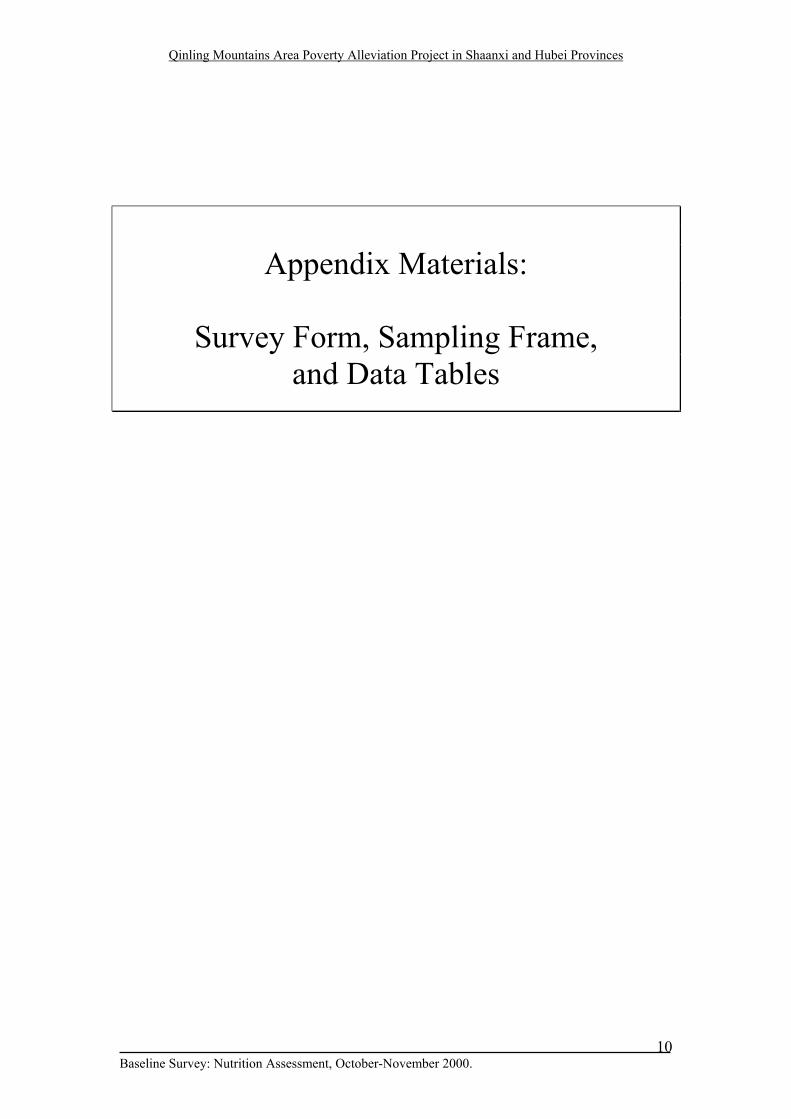
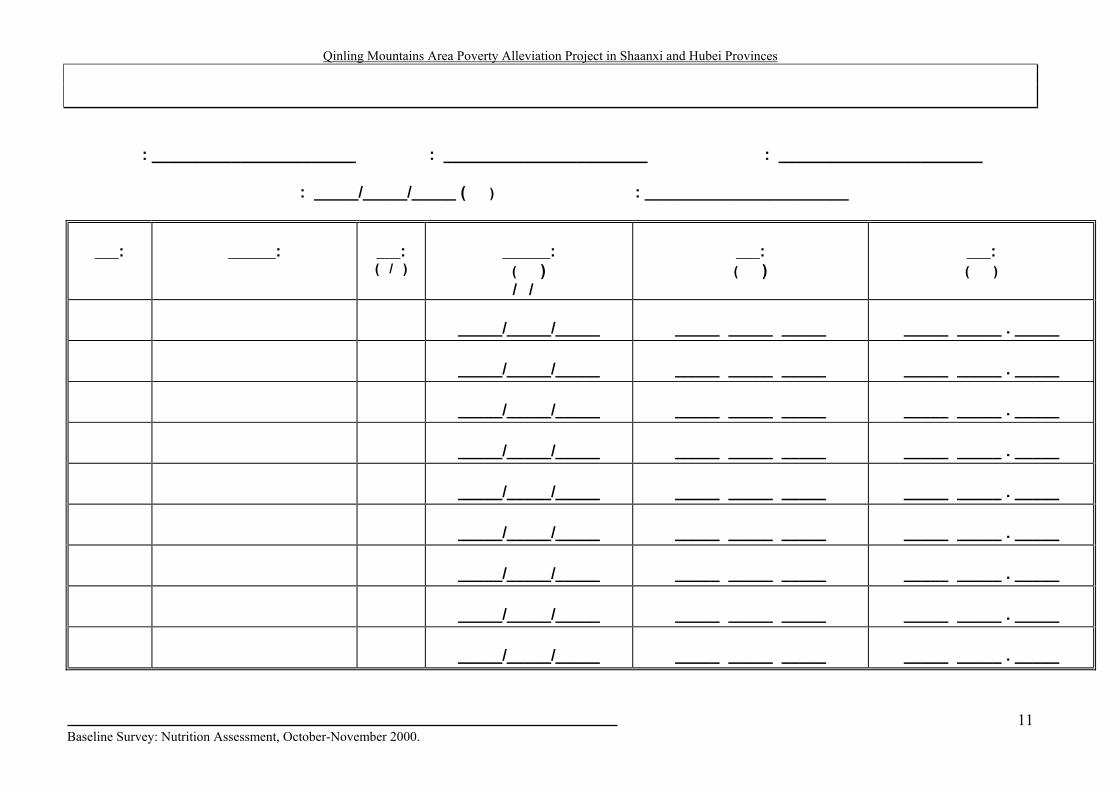
����������������
��: _______________________ ��: _______________________ ��: _______________________
����: _____/_____/_____ (��) ����: _______________________
��:
����:
��: (�/�)
����:
(��) �/�/��
��: (��)
��: (��)
_____/_____/_____
_____ _____ _____
_____ _____ . _____
_____/_____/_____
_____ _____ _____
_____ _____ . _____
_____/_____/_____
_____ _____ _____
_____ _____ . _____
_____/_____/_____
_____ _____ _____
_____ _____ . _____
_____/_____/_____
_____ _____ _____
_____ _____ . _____
_____/_____/_____
_____ _____ _____
_____ _____ . _____
_____/_____/_____
_____ _____ _____
_____ _____ . _____
_____/_____/_____
_____ _____ _____
_____ _____ . _____
_____/_____/_____
_____ _____ _____
_____ _____ . _____
Qinling Mountains Area Poverty Alleviation Project in Shaanxi and Hubei Provinces
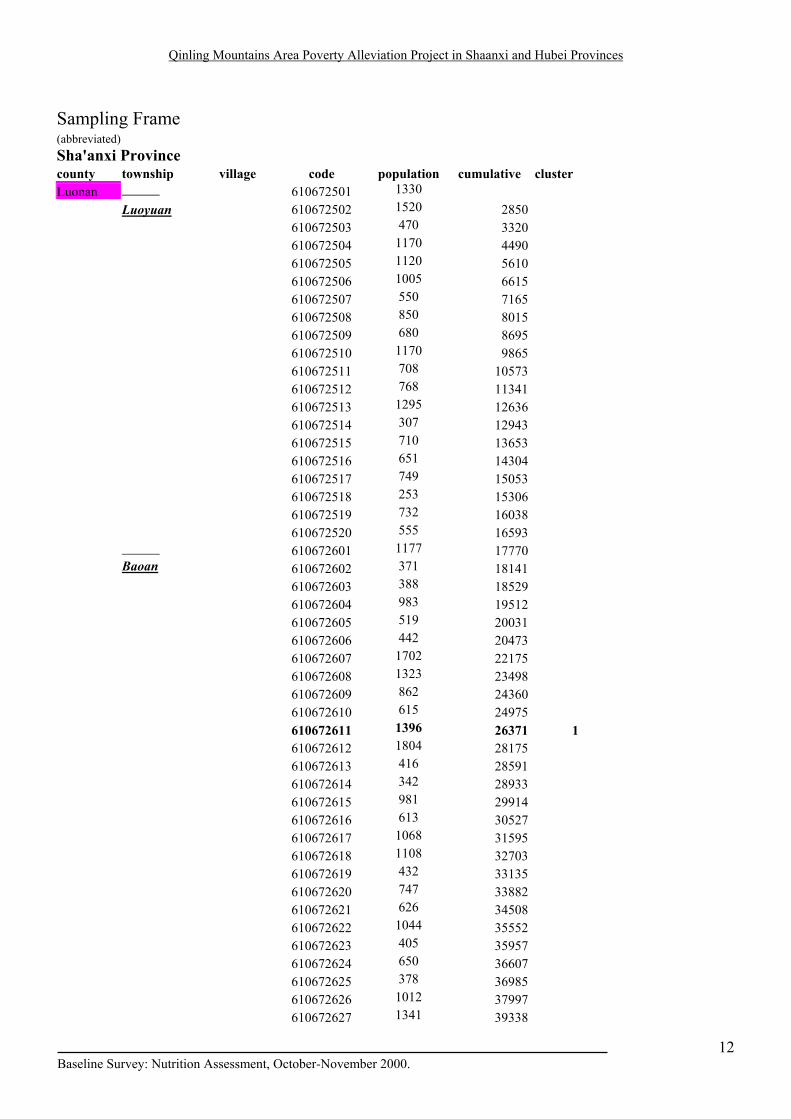
Sampling Frame (abbreviated) Sha'anxi Province county township village code population cumulative cluster Luonan � � � � � 610672501 1330 Luoyuan ��� 610672502 1520 2850 � � 610672503 470 3320 � � 610672504 1170 4490 � � 610672505 1120 5610 � � 610672506 1005 6615 � � 610672507 550 7165 � � 610672508 850 8015 � � 610672509 680 8695 � � 610672510 1170 9865 � � 610672511 708 10573 � � 610672512 768 11341 � � 610672513 1295 12636 � � 610672514 307 12943 � � 610672515 710 13653 � � 610672516 651 14304 � � 610672517 749 15053 � � 610672518 253 15306 � � 610672519 732 16038 � � 610672520 555 16593 � � � ��� 610672601 1177 17770 Baoan � � 610672602 371 18141 � � 610672603 388 18529 � � 610672604 983 19512 ��� 610672605 519 20031 � � 610672606 442 20473 ��� 610672607 1702 22175 � � 610672608 1323 23498 ��� 610672609 862 24360 ��� 610672610 615 24975 ��� 610672611 1396 26371 1 � � 610672612 1804 28175 � � 610672613 416 28591 ��� 610672614 342 28933 ��� 610672615 981 29914 ��� 610672616 613 30527 � � 610672617 1068 31595 � � 610672618 1108 32703 � � 610672619 432 33135 � � 610672620 747 33882 � � 610672621 626 34508 � � 610672622 1044 35552 � � 610672623 405 35957 ��� 610672624 650 36607 � � 610672625 378 36985 � � 610672626 1012 37997 � � 610672627 1341 39338
Baseline Survey: Nutrition Assessment, October-November 2000.
12
Qinling Mountains Area Poverty Alleviation Project in Shaanxi and Hubei Provinces
Baseline Survey: Nutrition Assessment, October-November 2000.
13
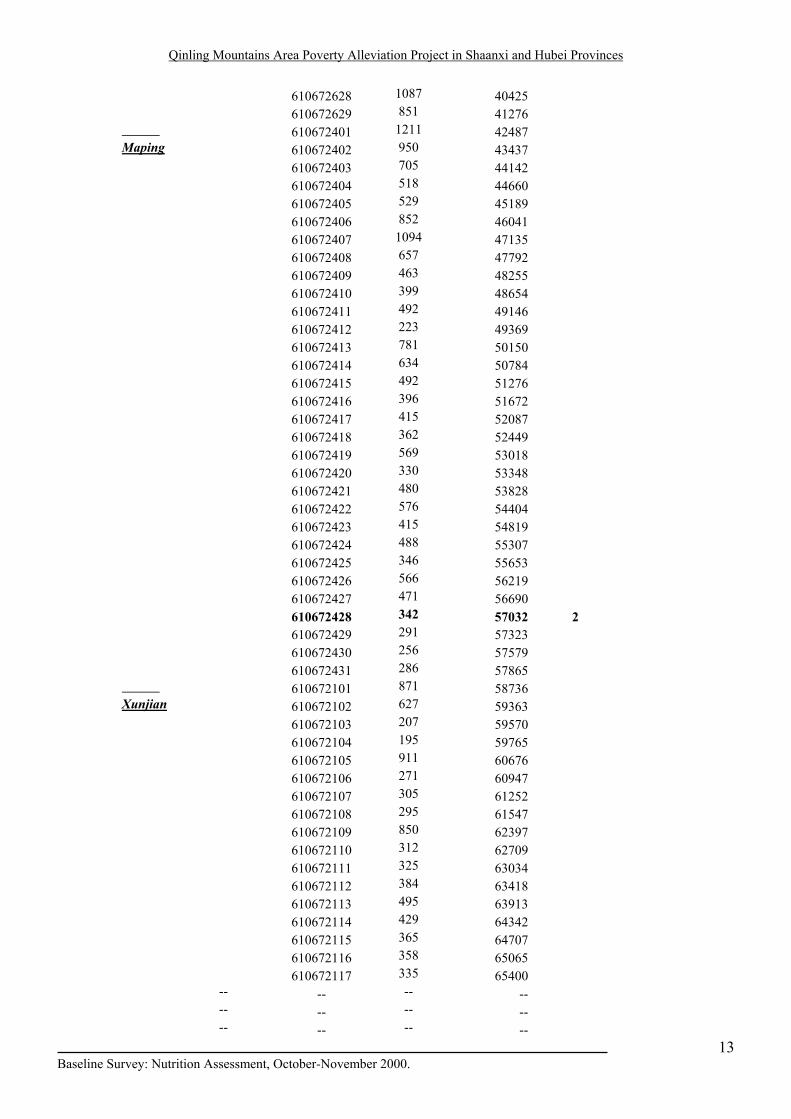
� � 610672628 1087 40425 � � 610672629 851 41276 � � � � � 610672401 1211 42487 Maping � � 610672402 950 43437 ��� 610672403 705 44142 � � 610672404 518 44660 � � 610672405 529 45189 � � 610672406 852 46041 � � 610672407 1094 47135 � � 610672408 657 47792 � � 610672409 463 48255 � � 610672410 399 48654 � � 610672411 492 49146 � � 610672412 223 49369 � � 610672413 781 50150 � � 610672414 634 50784 ��� 610672415 492 51276 � � 610672416 396 51672 � � 610672417 415 52087 � � 610672418 362 52449 � � 610672419 569 53018 � � 610672420 330 53348 � � 610672421 480 53828 � � 610672422 576 54404 ��� 610672423 415 54819 � � 610672424 488 55307 ��� 610672425 346 55653 � � 610672426 566 56219 ��� 610672427 471 56690 ��� 610672428 342 57032 2 ��� 610672429 291 57323 ��� 610672430 256 57579 ��� 610672431 286 57865 � � � � � 610672101 871 58736 Xunjian � � 610672102 627 59363 � � 610672103 207 59570 ��� 610672104 195 59765 ��� 610672105 911 60676 � � 610672106 271 60947 � � 610672107 305 61252 � � 610672108 295 61547 � � 610672109 850 62397 ��� 610672110 312 62709 ��� 610672111 325 63034 � � 610672112 384 63418 � � 610672113 495 63913 � � 610672114 429 64342 � � 610672115 365 64707 � � 610672116 358 65065 � � 610672117 335 65400 -- -- -- -- -- -- -- -- -- -- -- --
Qinling Mountains Area Poverty Alleviation Project in Shaanxi and Hubei Provinces
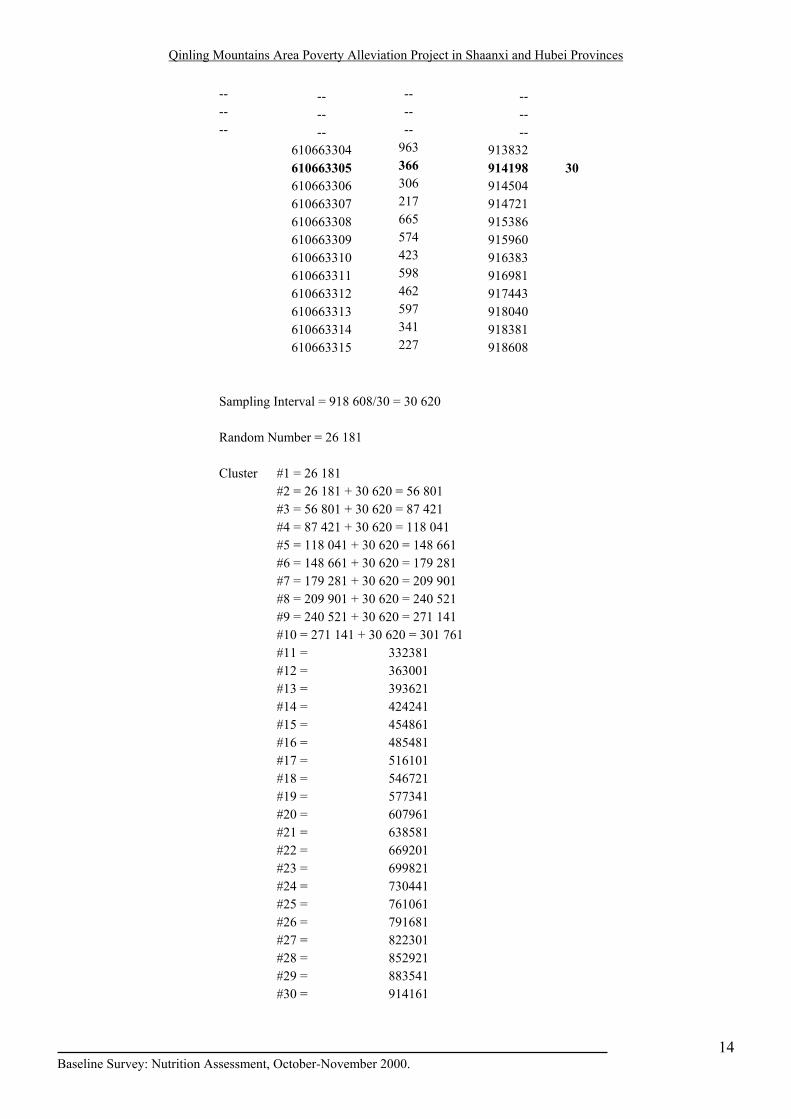
-- -- -- -- -- -- -- -- -- -- -- -- ��� 610663304 963 913832 � � 610663305 366 914198 30 � � 610663306 306 914504 � � 610663307 217 914721 � � 610663308 665 915386 � � 610663309 574 915960 � � 610663310 423 916383 � � 610663311 598 916981 � � 610663312 462 917443 � � 610663313 597 918040 � � 610663314 341 918381 � � 610663315 227 918608 Sampling Interval = 918 608/30 = 30 620 Random Number = 26 181 Cluster #1 = 26 181 #2 = 26 181 + 30 620 = 56 801 #3 = 56 801 + 30 620 = 87 421 #4 = 87 421 + 30 620 = 118 041 #5 = 118 041 + 30 620 = 148 661 #6 = 148 661 + 30 620 = 179 281 #7 = 179 281 + 30 620 = 209 901 #8 = 209 901 + 30 620 = 240 521 #9 = 240 521 + 30 620 = 271 141 #10 = 271 141 + 30 620 = 301 761 #11 = 332381 #12 = 363001 #13 = 393621 #14 = 424241 #15 = 454861 #16 = 485481 #17 = 516101 #18 = 546721 #19 = 577341 #20 = 607961 #21 = 638581 #22 = 669201 #23 = 699821 #24 = 730441 #25 = 761061 #26 = 791681 #27 = 822301 #28 = 852921 #29 = 883541 #30 = 914161
Baseline Survey: Nutrition Assessment, October-November 2000.
14
Qinling Mountains Area Poverty Alleviation Project in Shaanxi and Hubei Provinces
Hubei province
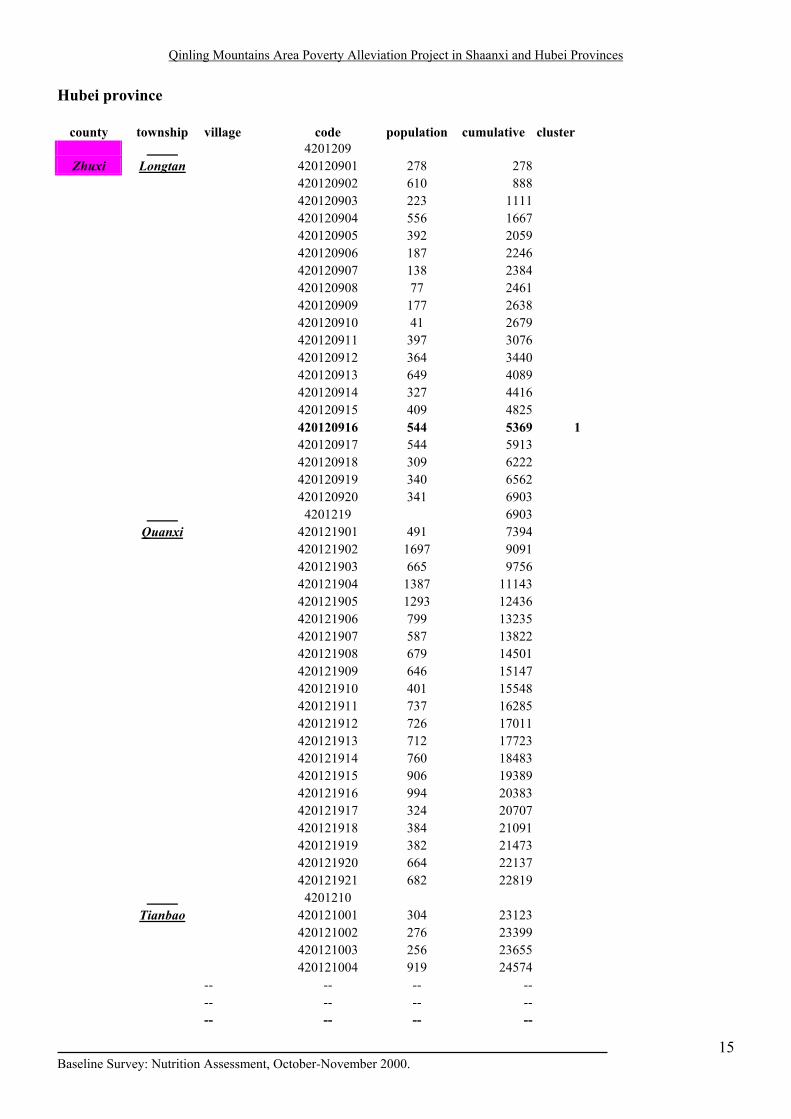
county township village code population cumulative cluster ��� ��� 4201209 Zhuxi Longtan �� 420120901 278 278
��� 420120902 610 888 �� 420120903 223 1111 ��� 420120904 556 1667 ��� 420120905 392 2059 ��� 420120906 187 2246 �� 420120907 138 2384 ��� 420120908 77 2461 ��� 420120909 177 2638 ��� 420120910 41 2679 �� 420120911 397 3076 �� 420120912 364 3440 ��� 420120913 649 4089 ��� 420120914 327 4416 ��� 420120915 409 4825 �� 420120916 544 5369 1 �� 420120917 544 5913 �� 420120918 309 6222 �� 420120919 340 6562 �� 420120920 341 6903 ��� 4201219 6903 Quanxi ��� 420121901 491 7394 ��� 420121902 1697 9091 ��� 420121903 665 9756 ��� 420121904 1387 11143 ��� 420121905 1293 12436 ��� 420121906 799 13235 ��� 420121907 587 13822 ���� 420121908 679 14501 ��� 420121909 646 15147 �� 420121910 401 15548 ��� 420121911 737 16285 ��� 420121912 726 17011 ��� 420121913 712 17723 ��� 420121914 760 18483 ��� 420121915 906 19389 ��� 420121916 994 20383 ��� 420121917 324 20707 ��� 420121918 384 21091 ��� 420121919 382 21473 ��� 420121920 664 22137 ��� 420121921 682 22819 ��� 4201210 Tianbao �� 420121001 304 23123 �� 420121002 276 23399 ��� 420121003 256 23655 �� 420121004 919 24574 -- -- -- -- -- -- -- -- -- -- -- --
Baseline Survey: Nutrition Assessment, October-November 2000.
15
Qinling Mountains Area Poverty Alleviation Project in Shaanxi and Hubei Provinces
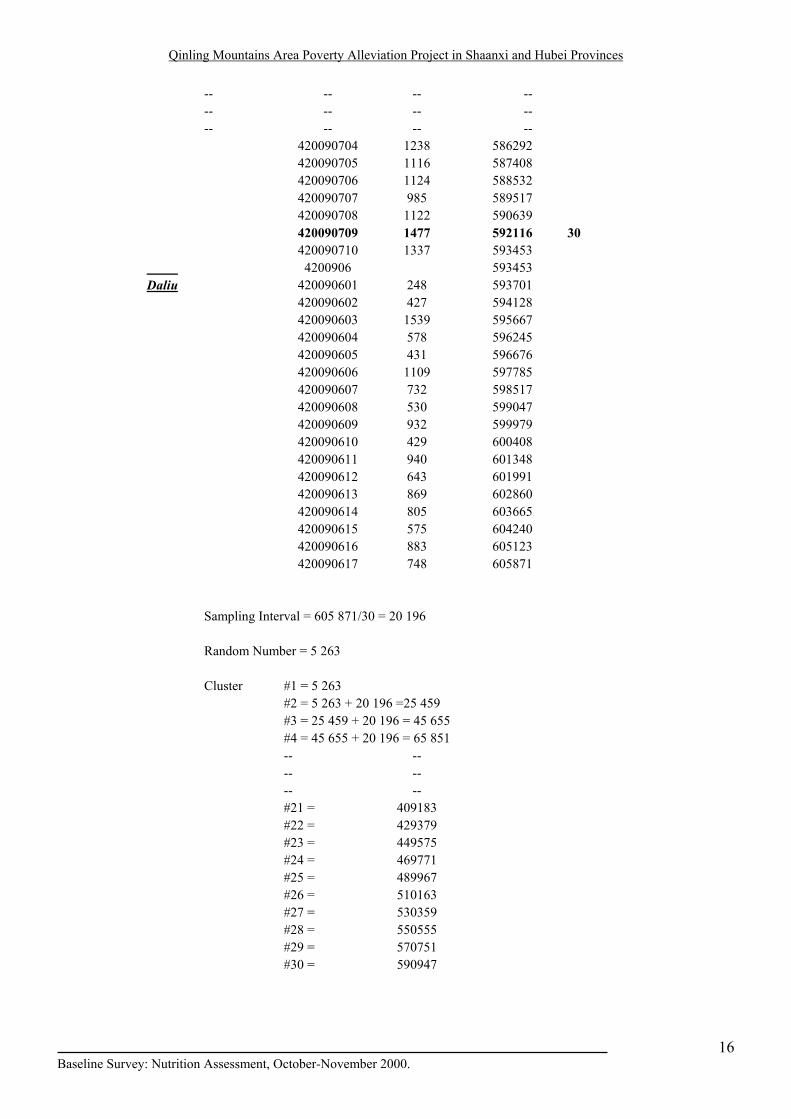
-- -- -- -- -- -- -- -- -- -- -- -- ��� 420090704 1238 586292 ��� 420090705 1116 587408 �� 420090706 1124 588532 �� 420090707 985 589517 ��� 420090708 1122 590639 �� 420090709 1477 592116 30 ��� 420090710 1337 593453 ��� 4200906 593453 Daliu ��� 420090601 248 593701 ��� 420090602 427 594128 �� 420090603 1539 595667 ��� 420090604 578 596245 ��� 420090605 431 596676 ��� 420090606 1109 597785 ��� 420090607 732 598517 ��� 420090608 530 599047 �� 420090609 932 599979 �� 420090610 429 600408 �� 420090611 940 601348 �� 420090612 643 601991 �� 420090613 869 602860 ��� 420090614 805 603665 ��� 420090615 575 604240 ��� 420090616 883 605123 �� 420090617 748 605871 Sampling Interval = 605 871/30 = 20 196 Random Number = 5 263 Cluster #1 = 5 263 #2 = 5 263 + 20 196 =25 459 #3 = 25 459 + 20 196 = 45 655 #4 = 45 655 + 20 196 = 65 851 -- -- -- -- -- -- #21 = 409183 #22 = 429379 #23 = 449575 #24 = 469771 #25 = 489967 #26 = 510163 #27 = 530359 #28 = 550555 #29 = 570751 #30 = 590947
Baseline Survey: Nutrition Assessment, October-November 2000.
16
Qinling Mountains Area Poverty Alleviation Project in Shaanxi and Hubei Provinces
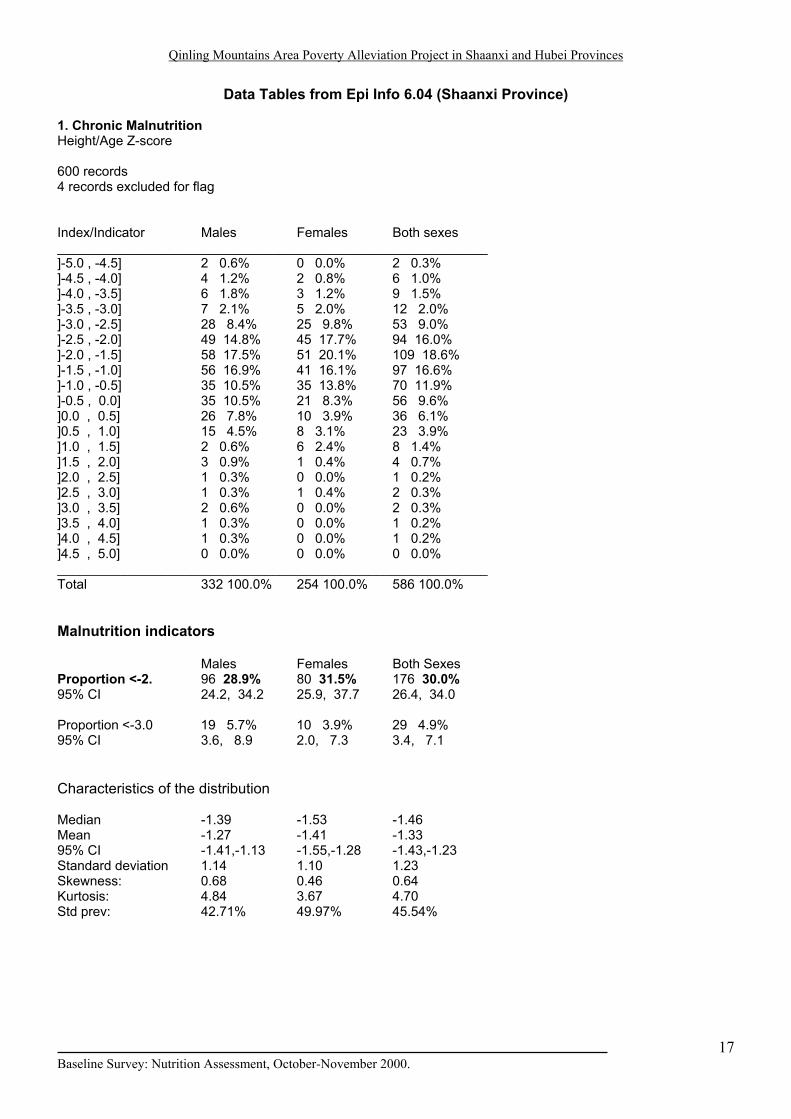
Data Tables from Epi Info 6.04 (Shaanxi Province) 1. Chronic Malnutrition Height/Age Z-score 600 records 4 records excluded for flag Index/Indicator Males Females Both sexes __________________________________________________________ ]-5.0 , -4.5] 2 0.6% 0 0.0% 2 0.3% ]-4.5 , -4.0] 4 1.2% 2 0.8% 6 1.0% ]-4.0 , -3.5] 6 1.8% 3 1.2% 9 1.5% ]-3.5 , -3.0] 7 2.1% 5 2.0% 12 2.0% ]-3.0 , -2.5] 28 8.4% 25 9.8% 53 9.0% ]-2.5 , -2.0] 49 14.8% 45 17.7% 94 16.0% ]-2.0 , -1.5] 58 17.5% 51 20.1% 109 18.6% ]-1.5 , -1.0] 56 16.9% 41 16.1% 97 16.6% ]-1.0 , -0.5] 35 10.5% 35 13.8% 70 11.9% ]-0.5 , 0.0] 35 10.5% 21 8.3% 56 9.6% ]0.0 , 0.5] 26 7.8% 10 3.9% 36 6.1% ]0.5 , 1.0] 15 4.5% 8 3.1% 23 3.9% ]1.0 , 1.5] 2 0.6% 6 2.4% 8 1.4% ]1.5 , 2.0] 3 0.9% 1 0.4% 4 0.7% ]2.0 , 2.5] 1 0.3% 0 0.0% 1 0.2% ]2.5 , 3.0] 1 0.3% 1 0.4% 2 0.3% ]3.0 , 3.5] 2 0.6% 0 0.0% 2 0.3% ]3.5 , 4.0] 1 0.3% 0 0.0% 1 0.2% ]4.0 , 4.5] 1 0.3% 0 0.0% 1 0.2% ]4.5 , 5.0] 0 0.0% 0 0.0% 0 0.0% __________________________________________________________ Total 332 100.0% 254 100.0% 586 100.0% Malnutrition indicators Males Females Both Sexes Proportion <-2. 96 28.9% 80 31.5% 176 30.0% 95% CI 24.2, 34.2 25.9, 37.7 26.4, 34.0 Proportion <-3.0 19 5.7% 10 3.9% 29 4.9% 95% CI 3.6, 8.9 2.0, 7.3 3.4, 7.1 Characteristics of the distribution Median -1.39 -1.53 -1.46 Mean -1.27 -1.41 -1.33 95% CI -1.41,-1.13 -1.55,-1.28 -1.43,-1.23 Standard deviation 1.14 1.10 1.23 Skewness: 0.68 0.46 0.64 Kurtosis: 4.84 3.67 4.70 Std prev: 42.71% 49.97% 45.54%
Baseline Survey: Nutrition Assessment, October-November 2000.
17
Qinling Mountains Area Poverty Alleviation Project in Shaanxi and Hubei Provinces
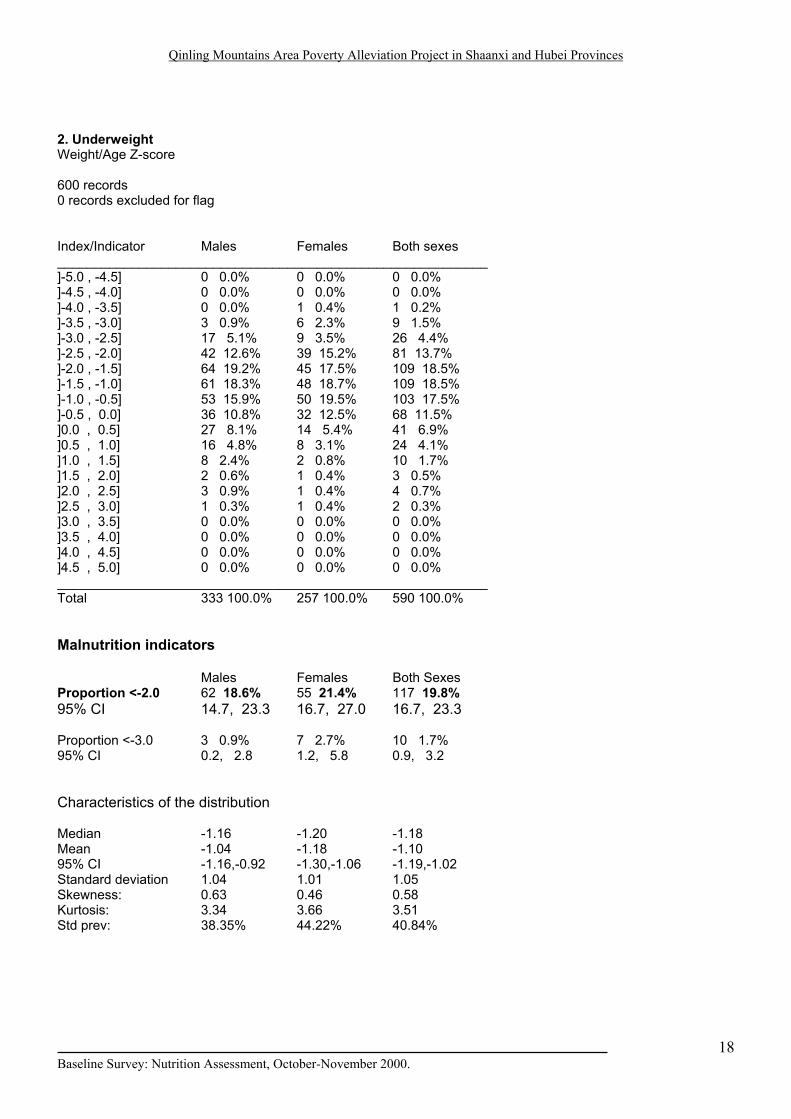
2. Underweight Weight/Age Z-score 600 records 0 records excluded for flag Index/Indicator Males Females Both sexes __________________________________________________________ ]-5.0 , -4.5] 0 0.0% 0 0.0% 0 0.0% ]-4.5 , -4.0] 0 0.0% 0 0.0% 0 0.0% ]-4.0 , -3.5] 0 0.0% 1 0.4% 1 0.2% ]-3.5 , -3.0] 3 0.9% 6 2.3% 9 1.5% ]-3.0 , -2.5] 17 5.1% 9 3.5% 26 4.4% ]-2.5 , -2.0] 42 12.6% 39 15.2% 81 13.7% ]-2.0 , -1.5] 64 19.2% 45 17.5% 109 18.5% ]-1.5 , -1.0] 61 18.3% 48 18.7% 109 18.5% ]-1.0 , -0.5] 53 15.9% 50 19.5% 103 17.5% ]-0.5 , 0.0] 36 10.8% 32 12.5% 68 11.5% ]0.0 , 0.5] 27 8.1% 14 5.4% 41 6.9% ]0.5 , 1.0] 16 4.8% 8 3.1% 24 4.1% ]1.0 , 1.5] 8 2.4% 2 0.8% 10 1.7% ]1.5 , 2.0] 2 0.6% 1 0.4% 3 0.5% ]2.0 , 2.5] 3 0.9% 1 0.4% 4 0.7% ]2.5 , 3.0] 1 0.3% 1 0.4% 2 0.3% ]3.0 , 3.5] 0 0.0% 0 0.0% 0 0.0% ]3.5 , 4.0] 0 0.0% 0 0.0% 0 0.0% ]4.0 , 4.5] 0 0.0% 0 0.0% 0 0.0% ]4.5 , 5.0] 0 0.0% 0 0.0% 0 0.0% __________________________________________________________ Total 333 100.0% 257 100.0% 590 100.0% Malnutrition indicators Males Females Both Sexes Proportion <-2.0 62 18.6% 55 21.4% 117 19.8% 95% CI 14.7, 23.3 16.7, 27.0 16.7, 23.3 Proportion <-3.0 3 0.9% 7 2.7% 10 1.7% 95% CI 0.2, 2.8 1.2, 5.8 0.9, 3.2 Characteristics of the distribution Median -1.16 -1.20 -1.18 Mean -1.04 -1.18 -1.10 95% CI -1.16,-0.92 -1.30,-1.06 -1.19,-1.02 Standard deviation 1.04 1.01 1.05 Skewness: 0.63 0.46 0.58 Kurtosis: 3.34 3.66 3.51 Std prev: 38.35% 44.22% 40.84%
Baseline Survey: Nutrition Assessment, October-November 2000.
18
Qinling Mountains Area Poverty Alleviation Project in Shaanxi and Hubei Provinces
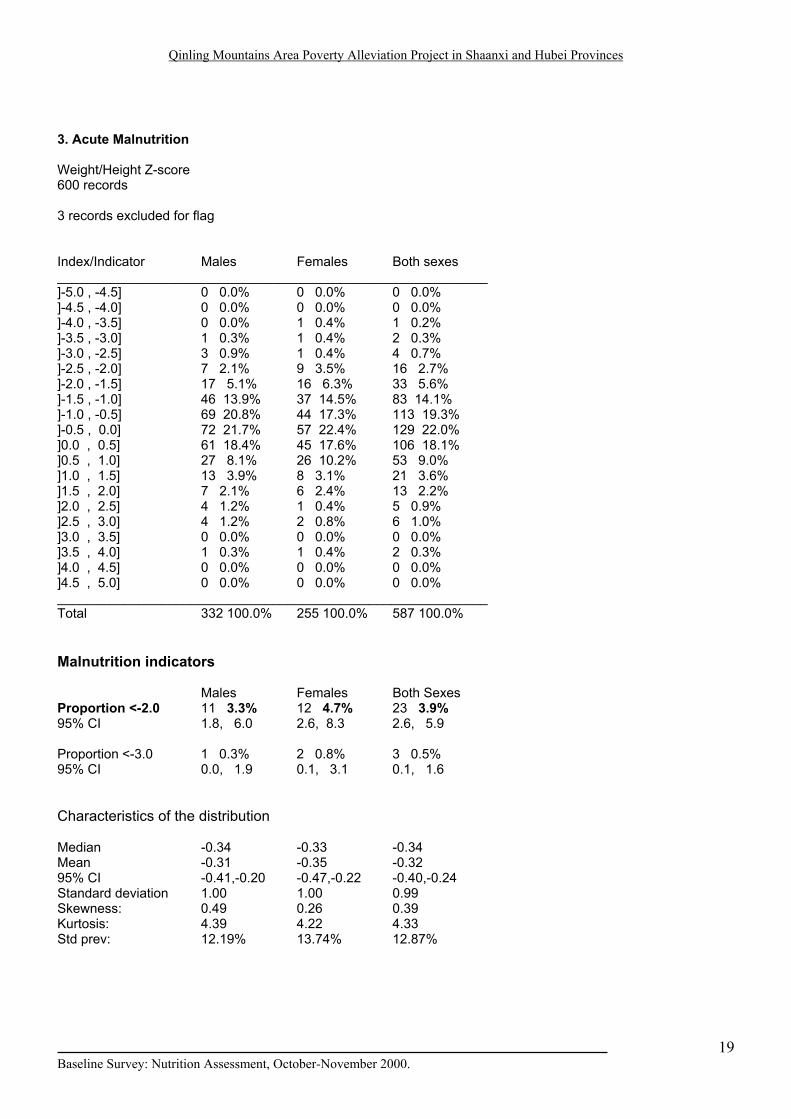
3. Acute Malnutrition Weight/Height Z-score 600 records 3 records excluded for flag Index/Indicator Males Females Both sexes __________________________________________________________ ]-5.0 , -4.5] 0 0.0% 0 0.0% 0 0.0% ]-4.5 , -4.0] 0 0.0% 0 0.0% 0 0.0% ]-4.0 , -3.5] 0 0.0% 1 0.4% 1 0.2% ]-3.5 , -3.0] 1 0.3% 1 0.4% 2 0.3% ]-3.0 , -2.5] 3 0.9% 1 0.4% 4 0.7% ]-2.5 , -2.0] 7 2.1% 9 3.5% 16 2.7% ]-2.0 , -1.5] 17 5.1% 16 6.3% 33 5.6% ]-1.5 , -1.0] 46 13.9% 37 14.5% 83 14.1% ]-1.0 , -0.5] 69 20.8% 44 17.3% 113 19.3% ]-0.5 , 0.0] 72 21.7% 57 22.4% 129 22.0% ]0.0 , 0.5] 61 18.4% 45 17.6% 106 18.1% ]0.5 , 1.0] 27 8.1% 26 10.2% 53 9.0% ]1.0 , 1.5] 13 3.9% 8 3.1% 21 3.6% ]1.5 , 2.0] 7 2.1% 6 2.4% 13 2.2% ]2.0 , 2.5] 4 1.2% 1 0.4% 5 0.9% ]2.5 , 3.0] 4 1.2% 2 0.8% 6 1.0% ]3.0 , 3.5] 0 0.0% 0 0.0% 0 0.0% ]3.5 , 4.0] 1 0.3% 1 0.4% 2 0.3% ]4.0 , 4.5] 0 0.0% 0 0.0% 0 0.0% ]4.5 , 5.0] 0 0.0% 0 0.0% 0 0.0% __________________________________________________________ Total 332 100.0% 255 100.0% 587 100.0% Malnutrition indicators Males Females Both Sexes Proportion <-2.0 11 3.3% 12 4.7% 23 3.9% 95% CI 1.8, 6.0 2.6, 8.3 2.6, 5.9 Proportion <-3.0 1 0.3% 2 0.8% 3 0.5% 95% CI 0.0, 1.9 0.1, 3.1 0.1, 1.6 Characteristics of the distribution Median -0.34 -0.33 -0.34 Mean -0.31 -0.35 -0.32 95% CI -0.41,-0.20 -0.47,-0.22 -0.40,-0.24 Standard deviation 1.00 1.00 0.99 Skewness: 0.49 0.26 0.39 Kurtosis: 4.39 4.22 4.33 Std prev: 12.19% 13.74% 12.87%
Baseline Survey: Nutrition Assessment, October-November 2000.
19
Qinling Mountains Area Poverty Alleviation Project in Shaanxi and Hubei Provinces
Data Tables from Epi Info 6.04 (Hubei Province) 1. Chronic Malnutrition Name of file C:\EPI6\EPINFO~1\HB-NS.REC Number of records 600 Height/Age Z-score 8 records excluded for flag Index/Indicator Males Females Both sexes __________________________________________________________ ]-5.0 , -4.5] 2 0.6% 2 0.8% 4 0.7% ]-4.5 , -4.0] 6 1.8% 3 1.3% 9 1.6% ]-4.0 , -3.5] 15 4.6% 13 5.4% 28 4.9% ]-3.5 , -3.0] 16 4.9% 13 5.4% 29 5.1% ]-3.0 , -2.5] 32 9.8% 29 12.1% 61 10.7% ]-2.5 , -2.0] 59 18.0% 39 16.3% 98 17.3% ]-2.0 , -1.5] 58 17.7% 40 16.7% 98 17.3% ]-1.5 , -1.0] 48 14.6% 40 16.7% 88 15.5% ]-1.0 , -0.5] 40 12.2% 32 13.3% 72 12.7% ]-0.5 , 0.0] 17 5.2% 16 6.7% 33 5.8% ]0.0 , 0.5] 15 4.6% 6 2.5% 21 3.7% ]0.5 , 1.0] 11 3.4% 4 1.7% 15 2.6% ]1.0 , 1.5] 4 1.2% 0 0.0% 4 0.7% ]1.5 , 2.0] 2 0.6% 0 0.0% 2 0.4% ]2.0 , 2.5] 1 0.3% 3 1.3% 4 0.7% ]2.5 , 3.0] 1 0.3% 0 0.0% 1 0.2% ]3.0 , 3.5] 0 0.0% 0 0.0% 0 0.0% ]3.5 , 4.0] 0 0.0% 0 0.0% 0 0.0% ]4.0 , 4.5] 0 0.0% 0 0.0% 0 0.0% ]4.5 , 5.0] 1 0.3% 0 0.0% 1 0.2% __________________________________________________________ Total 328 100.0% 240 100.0% 568 100.0% Malnutrition indicators Males Females Both Sexes Proportion <-2.0 130 39.6% 99 41.3% 229 40.3% 95% CI 4.3, 45.2 35.0, 47.8 36.3, 44.5 Proportion <-3.0 39 11.9% 31 12.9% 70 12.3% 95% CI 8.7, 16.0 9.1, 18.0 9.8, 15.4 Characteristics of the distribution Median -1.70 -1.73 -1.72 Mean -1.63 -1.74 -1.67 95% CI -1.77,-1.49 -1.89,-1.59 -1.78,-1.57 Standard deviation 1.14 1.16 1.24 Skewness: 0.67 0.30 0.56 Kurtosis: 5.19 4.10 4.94 Std prev: 52.92% 58.16% 55.03%
Baseline Survey: Nutrition Assessment, October-November 2000.
20
Qinling Mountains Area Poverty Alleviation Project in Shaanxi and Hubei Provinces
2. Underweight Name of file C:\EPI6\EPINFO~1\HB-NS.REC Number of records 600 Weight/Age Z-score 2 records excluded for flag Index/Indicator Males Females Both sexes __________________________________________________________ ]-5.0 , -4.5] 1 0.3% 0 0.0% 1 0.2% ]-4.5 , -4.0] 0 0.0% 1 0.4% 1 0.2% ]-4.0 , -3.5] 4 1.2% 1 0.4% 5 0.9% ]-3.5 , -3.0] 4 1.2% 4 1.6% 8 1.4% ]-3.0 , -2.5] 17 5.2% 10 4.1% 27 4.7% ]-2.5 , -2.0] 33 10.0% 34 13.9% 67 11.7% ]-2.0 , -1.5] 78 23.6% 58 23.8% 136 23.7% ]-1.5 , -1.0] 76 23.0% 48 19.7% 124 21.6% ]-1.0 , -0.5] 45 13.6% 35 14.3% 80 13.9% ]-0.5 , 0.0] 29 8.8% 20 8.2% 49 8.5% ]0.0 , 0.5] 15 4.5% 16 6.6% 31 5.4% ]0.5 , 1.0] 12 3.6% 4 1.6% 16 2.8% ]1.0 , 1.5] 6 1.8% 4 1.6% 10 1.7% ]1.5 , 2.0] 3 0.9% 2 0.8% 5 0.9% ]2.0 , 2.5] 3 0.9% 2 0.8% 5 0.9% ]2.5 , 3.0] 1 0.3% 2 0.8% 3 0.5% ]3.0 , 3.5] 1 0.3% 1 0.4% 2 0.3% ]3.5 , 4.0] 1 0.3% 0 0.0% 1 0.2% ]4.0 , 4.5] 1 0.3% 0 0.0% 1 0.2% ]4.5 , 5.0] 0 0.0% 2 0.8% 2 0.3% __________________________________________________________ Total 330 100.0% 244 100.0% 574 100.0% Malnutrition indicators Males Females Both Sexes Proportion <-2.0 59 17.9% 50 20.5% 109 19.0% 95% CI 4.0, 22.5 15.7, 26.2 15.9, 22.5 Proportion <-3.0 9 2.7% 6 2.5% 15 2.6% 95% CI 1.3, 5.3 1.0, 5.5 1.5, 4.4 Characteristics of the distribution Median -1.31 -1.35 -1.33 Mean -1.15 -1.14 -1.15 95% CI -1.28,-1.02 -1.30,-0.98 -1.24,-1.05 Standard deviation 1.08 1.25 1.20 Skewness: 1.13 1.66 1.38 Kurtosis: 6.11 8.40 7.28 Std prev: 40.83% 39.54% 40.25%
Baseline Survey: Nutrition Assessment, October-November 2000.
21
Qinling Mountains Area Poverty Alleviation Project in Shaanxi and Hubei Provinces
3. Acute malnutrition Name of file C:\EPI6\EPINFO~1\HB-NS.REC Number of records 600 Weight/Height Z-score 11 records excluded for flag Index/Indicator Males Females Both sexes __________________________________________________________ ]-5.0 , -4.5] 0 0.0% 1 0.4% 1 0.2% ]-4.5 , -4.0] 0 0.0% 0 0.0% 0 0.0% ]-4.0 , -3.5] 1 0.3% 1 0.4% 2 0.4% ]-3.5 , -3.0] 3 0.9% 0 0.0% 3 0.5% ]-3.0 , -2.5] 0 0.0% 2 0.8% 2 0.4% ]-2.5 , -2.0] 6 1.8% 3 1.3% 9 1.6% ]-2.0 , -1.5] 17 5.2% 17 7.1% 34 6.0% ]-1.5 , -1.0] 38 11.7% 22 9.2% 60 10.6% ]-1.0 , -0.5] 63 19.3% 43 18.0% 106 18.8% ]-0.5 , 0.0] 69 21.2% 52 21.8% 121 21.4% ]0.0 , 0.5] 56 17.2% 41 17.2% 97 17.2% ]0.5 , 1.0] 26 8.0% 18 7.5% 44 7.8% ]1.0 , 1.5] 28 8.6% 19 7.9% 47 8.3% ]1.5 , 2.0] 8 2.5% 10 4.2% 18 3.2% ]2.0 , 2.5] 3 0.9% 3 1.3% 6 1.1% ]2.5 , 3.0] 3 0.9% 4 1.7% 7 1.2% ]3.0 , 3.5] 1 0.3% 2 0.8% 3 0.5% ]3.5 , 4.0] 1 0.3% 0 0.0% 1 0.2% ]4.0 , 4.5] 0 0.0% 0 0.0% 0 0.0% ]4.5 , 5.0] 2 0.6% 2 0.8% 4 0.7% __________________________________________________________ Total 326 100.0% 239 100.0% 565 100.0% Malnutrition indicators Males Females Both Sexes Proportion <-2.0 10 3.1% 6 2.5% 16 2.8% 95% CI 1.6, 5.7 1.0, 5.6 1.7, 4.7 Proportion <-3.0 4 1.2% 1 0.4% 5 0.9% 95% CI 0.4, 3.3 0.0, 2.7 0.3, 2.2 Characteristics of the distribution Median -0.24 -0.20 -0.23 Mean -0.16 -0.07 -0.12 95% CI -0.28,-0.03 -0.23, 0.09 -0.22,-0.02 Standard deviation 1.08 1.25 1.20 Skewness: 0.95 1.14 1.05 Kurtosis: 6.67 6.76 6.78 Std prev: 7.81% 6.98% 7.37%
Baseline Survey: Nutrition Assessment, October-November 2000.
22
Qinling Mountains Area Poverty Alleviation Project in Shaanxi and Hubei Provinces
Data Tables from Epi Info 6.04 (Shaanxi and Hubei) 1. Chronic malnutrition Name of file C:\M&E\IFADNU~1\SH.REC Number of records 1200 Height/Age Z-score 12 records excluded for flag Index/Indicator Males Females Both sexes __________________________________________________________ ]-5.0 , -4.5] 4 0.6% 2 0.4% 6 0.5% ]-4.5 , -4.0] 10 1.5% 5 1.0% 15 1.3% ]-4.0 , -3.5] 21 3.2% 16 3.2% 37 3.2% ]-3.5 , -3.0] 23 3.5% 18 3.6% 41 3.6% ]-3.0 , -2.5] 60 9.1% 54 10.9% 114 9.9% ]-2.5 , -2.0] 108 16.4% 84 17.0% 192 16.6% ]-2.0 , -1.5] 116 17.6% 91 18.4% 207 17.9% ]-1.5 , -1.0] 104 15.8% 81 16.4% 185 16.0% ]-1.0 , -0.5] 75 11.4% 67 13.6% 142 12.3% ]-0.5 , 0.0] 52 7.9% 37 7.5% 89 7.7% ]0.0 , 0.5] 41 6.2% 16 3.2% 57 4.9% ]0.5 , 1.0] 26 3.9% 12 2.4% 38 3.3% ]1.0 , 1.5] 6 0.9% 6 1.2% 12 1.0% ]1.5 , 2.0] 5 0.8% 1 0.2% 6 0.5% ]2.0 , 2.5] 2 0.3% 3 0.6% 5 0.4% ]2.5 , 3.0] 2 0.3% 1 0.2% 3 0.3% ]3.0 , 3.5] 2 0.3% 0 0.0% 2 0.2% ]3.5 , 4.0] 1 0.2% 0 0.0% 1 0.1% ]4.0 , 4.5] 1 0.2% 0 0.0% 1 0.1% ]4.5 , 5.0] 1 0.2% 0 0.0% 1 0.1% __________________________________________________________ Total 660 100.0% 494 100.0% 1154 100.0% Malnutrition indicators Males Females Both Sexes Proportion <-2.0 226 34.2% 179 36.2% 405 35.1% 95% CI 30.6, 38.0 32.0, 40.7 32.4, 37.9 Proportion <-3.0 58 8.8% 41 8.3% 99 8.6% 95% CI 6.8, 11.3 6.1, 11.2 7.1, 10.4 Characteristics of the distribution Median -1.55 -1.62 -1.58 Mean -1.45 -1.57 -1.50 95% CI -1.55,-1.35 -1.67,-1.47 -1.57,-1.43 Standard deviation 1.15 1.14 1.24 Skewness: 0.66 0.34 0.58 Kurtosis: 4.95 3.91 4.77 Std prev: 47.73% 53.90% 50.17%
Baseline Survey: Nutrition Assessment, October-November 2000.
23
Qinling Mountains Area Poverty Alleviation Project in Shaanxi and Hubei Provinces
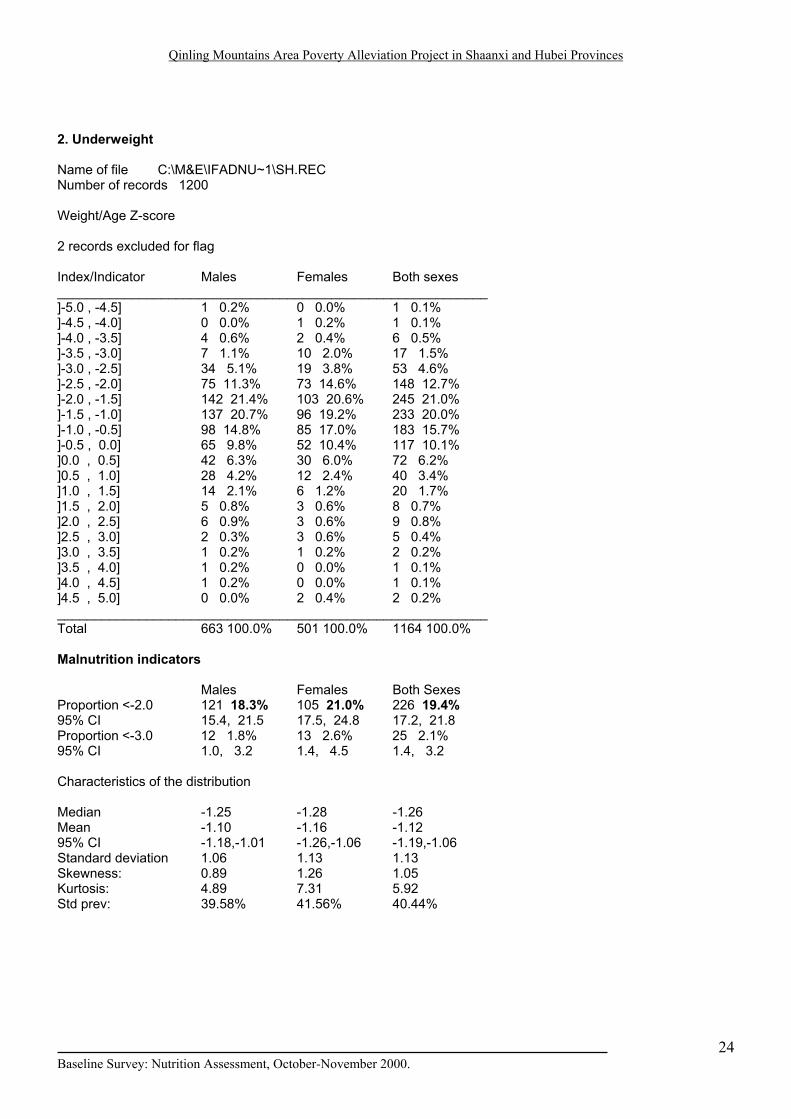
2. Underweight Name of file C:\M&E\IFADNU~1\SH.REC Number of records 1200 Weight/Age Z-score 2 records excluded for flag Index/Indicator Males Females Both sexes __________________________________________________________ ]-5.0 , -4.5] 1 0.2% 0 0.0% 1 0.1% ]-4.5 , -4.0] 0 0.0% 1 0.2% 1 0.1% ]-4.0 , -3.5] 4 0.6% 2 0.4% 6 0.5% ]-3.5 , -3.0] 7 1.1% 10 2.0% 17 1.5% ]-3.0 , -2.5] 34 5.1% 19 3.8% 53 4.6% ]-2.5 , -2.0] 75 11.3% 73 14.6% 148 12.7% ]-2.0 , -1.5] 142 21.4% 103 20.6% 245 21.0% ]-1.5 , -1.0] 137 20.7% 96 19.2% 233 20.0% ]-1.0 , -0.5] 98 14.8% 85 17.0% 183 15.7% ]-0.5 , 0.0] 65 9.8% 52 10.4% 117 10.1% ]0.0 , 0.5] 42 6.3% 30 6.0% 72 6.2% ]0.5 , 1.0] 28 4.2% 12 2.4% 40 3.4% ]1.0 , 1.5] 14 2.1% 6 1.2% 20 1.7% ]1.5 , 2.0] 5 0.8% 3 0.6% 8 0.7% ]2.0 , 2.5] 6 0.9% 3 0.6% 9 0.8% ]2.5 , 3.0] 2 0.3% 3 0.6% 5 0.4% ]3.0 , 3.5] 1 0.2% 1 0.2% 2 0.2% ]3.5 , 4.0] 1 0.2% 0 0.0% 1 0.1% ]4.0 , 4.5] 1 0.2% 0 0.0% 1 0.1% ]4.5 , 5.0] 0 0.0% 2 0.4% 2 0.2% __________________________________________________________ Total 663 100.0% 501 100.0% 1164 100.0% Malnutrition indicators Males Females Both Sexes Proportion <-2.0 121 18.3% 105 21.0% 226 19.4% 95% CI 15.4, 21.5 17.5, 24.8 17.2, 21.8 Proportion <-3.0 12 1.8% 13 2.6% 25 2.1% 95% CI 1.0, 3.2 1.4, 4.5 1.4, 3.2 Characteristics of the distribution Median -1.25 -1.28 -1.26 Mean -1.10 -1.16 -1.12 95% CI -1.18,-1.01 -1.26,-1.06 -1.19,-1.06 Standard deviation 1.06 1.13 1.13 Skewness: 0.89 1.26 1.05 Kurtosis: 4.89 7.31 5.92 Std prev: 39.58% 41.56% 40.44% Baseline Survey: Nutrition Assessment, October-November 2000.
24
Qinling Mountains Area Poverty Alleviation Project in Shaanxi and Hubei Provinces
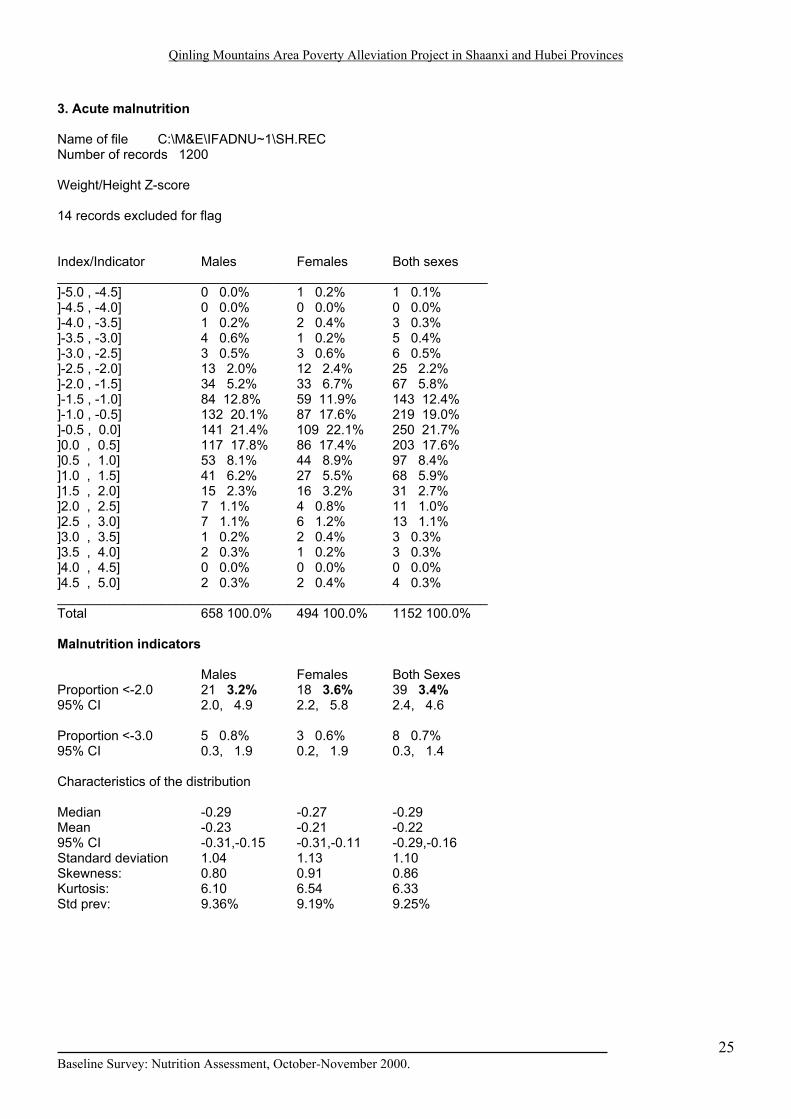
3. Acute malnutrition Name of file C:\M&E\IFADNU~1\SH.REC Number of records 1200 Weight/Height Z-score 14 records excluded for flag Index/Indicator Males Females Both sexes __________________________________________________________ ]-5.0 , -4.5] 0 0.0% 1 0.2% 1 0.1% ]-4.5 , -4.0] 0 0.0% 0 0.0% 0 0.0% ]-4.0 , -3.5] 1 0.2% 2 0.4% 3 0.3% ]-3.5 , -3.0] 4 0.6% 1 0.2% 5 0.4% ]-3.0 , -2.5] 3 0.5% 3 0.6% 6 0.5% ]-2.5 , -2.0] 13 2.0% 12 2.4% 25 2.2% ]-2.0 , -1.5] 34 5.2% 33 6.7% 67 5.8% ]-1.5 , -1.0] 84 12.8% 59 11.9% 143 12.4% ]-1.0 , -0.5] 132 20.1% 87 17.6% 219 19.0% ]-0.5 , 0.0] 141 21.4% 109 22.1% 250 21.7% ]0.0 , 0.5] 117 17.8% 86 17.4% 203 17.6% ]0.5 , 1.0] 53 8.1% 44 8.9% 97 8.4% ]1.0 , 1.5] 41 6.2% 27 5.5% 68 5.9% ]1.5 , 2.0] 15 2.3% 16 3.2% 31 2.7% ]2.0 , 2.5] 7 1.1% 4 0.8% 11 1.0% ]2.5 , 3.0] 7 1.1% 6 1.2% 13 1.1% ]3.0 , 3.5] 1 0.2% 2 0.4% 3 0.3% ]3.5 , 4.0] 2 0.3% 1 0.2% 3 0.3% ]4.0 , 4.5] 0 0.0% 0 0.0% 0 0.0% ]4.5 , 5.0] 2 0.3% 2 0.4% 4 0.3% __________________________________________________________ Total 658 100.0% 494 100.0% 1152 100.0% Malnutrition indicators Males Females Both Sexes Proportion <-2.0 21 3.2% 18 3.6% 39 3.4% 95% CI 2.0, 4.9 2.2, 5.8 2.4, 4.6 Proportion <-3.0 5 0.8% 3 0.6% 8 0.7% 95% CI 0.3, 1.9 0.2, 1.9 0.3, 1.4 Characteristics of the distribution Median -0.29 -0.27 -0.29 Mean -0.23 -0.21 -0.22 95% CI -0.31,-0.15 -0.31,-0.11 -0.29,-0.16 Standard deviation 1.04 1.13 1.10 Skewness: 0.80 0.91 0.86 Kurtosis: 6.10 6.54 6.33 Std prev: 9.36% 9.19% 9.25%
Baseline Survey: Nutrition Assessment, October-November 2000.
25