Summary of Workplace Injury, Illness and Fatality Statistics...
46
’10 Summary of Workplace Injury, Illness and Fatality Statistics 2009-2010
-
Upload
dinhkhuong -
Category
Documents
-
view
216 -
download
1
Transcript of Summary of Workplace Injury, Illness and Fatality Statistics...
’10Summary of WorkplaceInjury, I l lness and Fatal i ty
Stat ist ics 2009-2010
HSA_Stats_Report inside_10:Layout 1 21/06/2011 10:15 Page 1

Our vision:A national culture whereall commit to safe andhealthy workplaces andthe safe and sustainablemanagement of chemicals
HSA_Stats_Report inside_10:Layout 1 21/06/2011 10:15 Page 2

Contents
Published in 2011 by the Health and Safety Authority, The Metropolitan Building, James Joyce Street, Dublin 1.©All rights reserved. No part of this publication may be reproduced, stored in a retrieval system, or transmitted in anyform or by any means, electronic, mechanical, photocopying, recording or otherwise, without the prior permission ofthe Health and Safety Authority.
1. INTRODUCTION . . . . . . . . . . . . . . . . . . . . . . . . . . . . . . . . . . . . . . . . . . . . . . 4
1.1 Overview of the Summary of Statistics 2009-2010 . . . . . . . . . . . . . . . . . . . . 4
1.2 NACE Revision 2 . . . . . . . . . . . . . . . . . . . . . . . . . . . . . . . . . . . . . . . . . . . . . . . . 5
Figure 1.1: Comparison of NACE Rev.1 and NACE
Rev.2 economic activity classification . . . . . . . . . . . . . . . . . . . . . . . . . . . . . . . . . .5
1.3 Sources of Information . . . . . . . . . . . . . . . . . . . . . . . . . . . . . . . . . . . . . . . . . . .6
Eurostat . . . . . . . . . . . . . . . . . . . . . . . . . . . . . . . . . . . . . . . . . . . . . . . . . . . . . . . .7
Central Statistics Office (CSO) . . . . . . . . . . . . . . . . . . . . . . . . . . . . . . . . . . . . . . .7
Department of Social and Family Affairs . . . . . . . . . . . . . . . . . . . . . . . . . . . . . . .7
1.4 Technical Notes . . . . . . . . . . . . . . . . . . . . . . . . . . . . . . . . . . . . . . . . . . . . . . . . .8
Classification of injuries . . . . . . . . . . . . . . . . . . . . . . . . . . . . . . . . . . . . . . . . . . . .8
Calculation of non-fatal and fatal injury rates . . . . . . . . . . . . . . . . . . . . . . . . . . .8
2. NON-FATAL INJURY AND ILLNESS STATISTICS . . . . . . . . . . . . . . . . . . . . . . . .9
2.1 General Injury and Illness Statistics . . . . . . . . . . . . . . . . . . . . . . . . . . . . . . . . . . .9
Figure 2.1: Injuries reported to the HSA 2001-2010 (HSA) . . . . . . . . . . . . . . . . . . . . . . .9
Figure 2.2: Injuries reported by economic sector 2010 (HSA) . . . . . . . . . . . . . . . . . . . . .9
Figure 2.3: Numbers employed in each economic sector 2004-2009
(CSO statistical release March 2011) . . . . . . . . . . . . . . . . . . . . . . . . . . . . . .10
Figure 2.4: Number and rate of people suffering injury and illness 2005-2009 (CSO) . . . .11
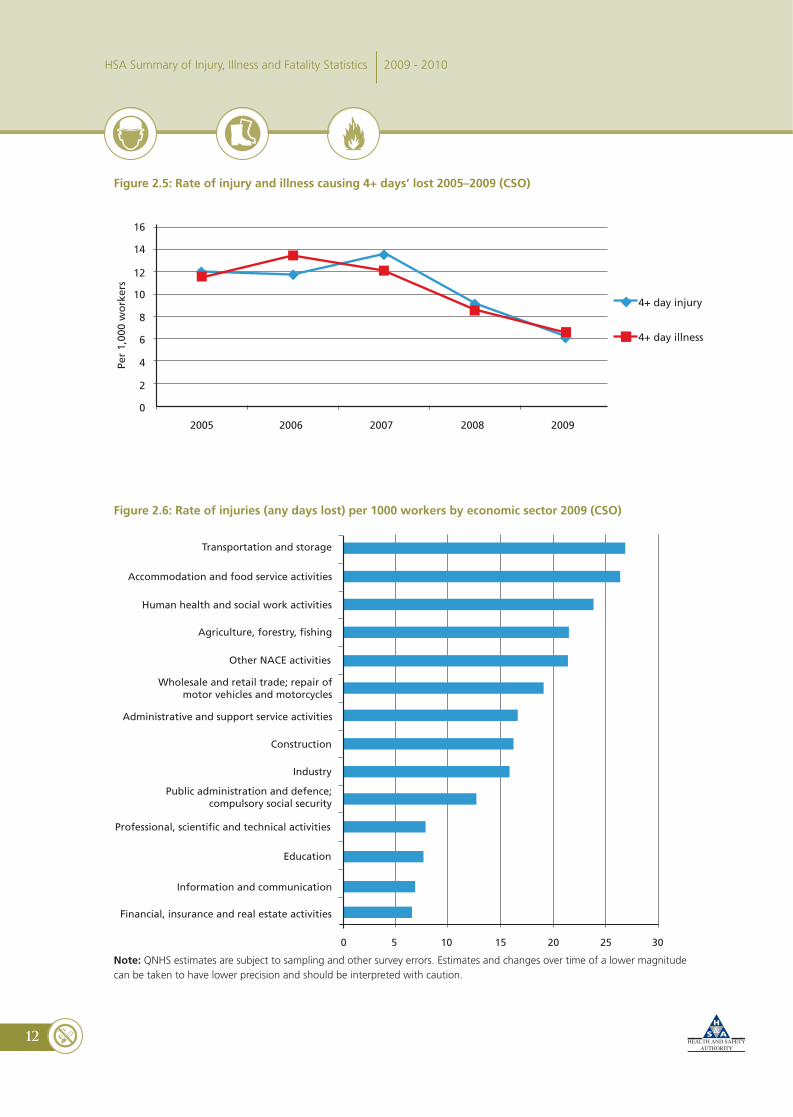
Figure 2.5: Rate of injury and illness causing 4+ days’ lost 2005-2009 (CSO) . . . . . . . .12
Figure 2.6: Rate of injuries (any days lost) per 1000 workers by
economic sector 2009 (CSO) . . . . . . . . . . . . . . . . . . . . . . . . . . . . . . . . . . .12
Figure 2.7: Rate of 4+ day injuries in construction compared to all
sectors 2005-2009 (CSO) . . . . . . . . . . . . . . . . . . . . . . . . . . . . . . . . . . . . . .13
Figure 2.8: Rate of illnesses (any days lost) per 1000 workers
by economic sector 2009 (CSO) . . . . . . . . . . . . . . . . . . . . . . . . . . . . . . . . .13
Figure 2.9: Number of OIB claims allowed 1993-2010 (DSFA) . . . . . . . . . . . . . . . . . . .14
Figure 2.10: Rate of 4+ day injuries in the EU 2007 (Eurostat) . . . . . . . . . . . . . . . . . . .14
2.2 Victim Statistics . . . . . . . . . . . . . . . . . . . . . . . . . . . . . . . . . . . . . . . . . . . . . . . . . .15
Figure 2.11: Number and rate of injury/illness* by economic sector
and gender 2009 (CSO) . . . . . . . . . . . . . . . . . . . . . . . . . . . . . . . . . . . . . . .15
Figure 2.12: Rate of total injury* by gender 2004-2009 (CSO) . . . . . . . . . . . . . . . . . . .16
Figure 2.13: Rate of total illness* by gender 2004-2009 (CSO) . . . . . . . . . . . . . . . . . .16
Figure 2.14: Rates of total injury and total illness per 1000 workers by age
band 2009 (CSO) . . . . . . . . . . . . . . . . . . . . . . . . . . . . . . . . . . . . . . . . . . . .17
1
HSA_Stats_Report inside_10:Layout 1 21/06/2011 10:15 Page 3
HSA Summary of Injury, Illness and Fatality Statistics 2009 - 2010
Figure 2.15: Rates of total injury and total illness per 1000 workers
by occupation 2009 (CSO) . . . . . . . . . . . . . . . . . . . . . . . . . . . . . . . . . . . . .17
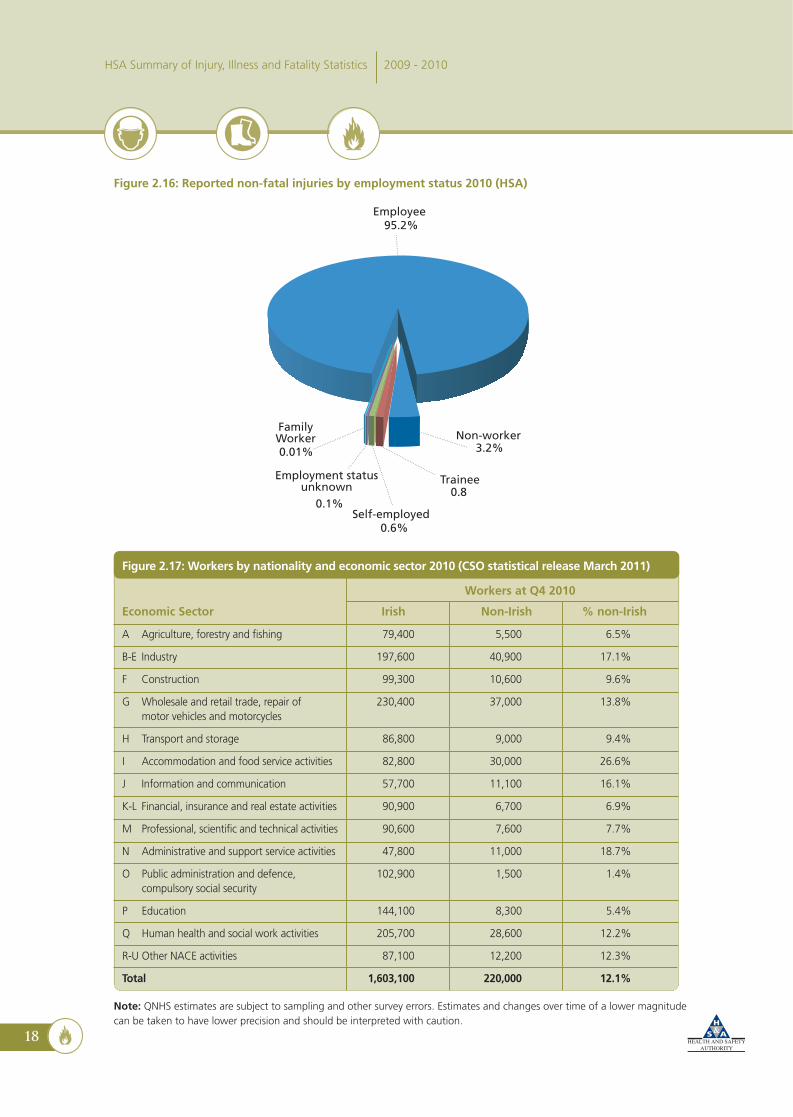
Figure 2.16: Reported non-fatal injuries by employment status 2010 (HSA) . . . . . . . . .18
Figure 2.17: Workers by nationality and economic sector 2010
(CSO statistical release March 2011) . . . . . . . . . . . . . . . . . . . . . . . . . . . . . .18
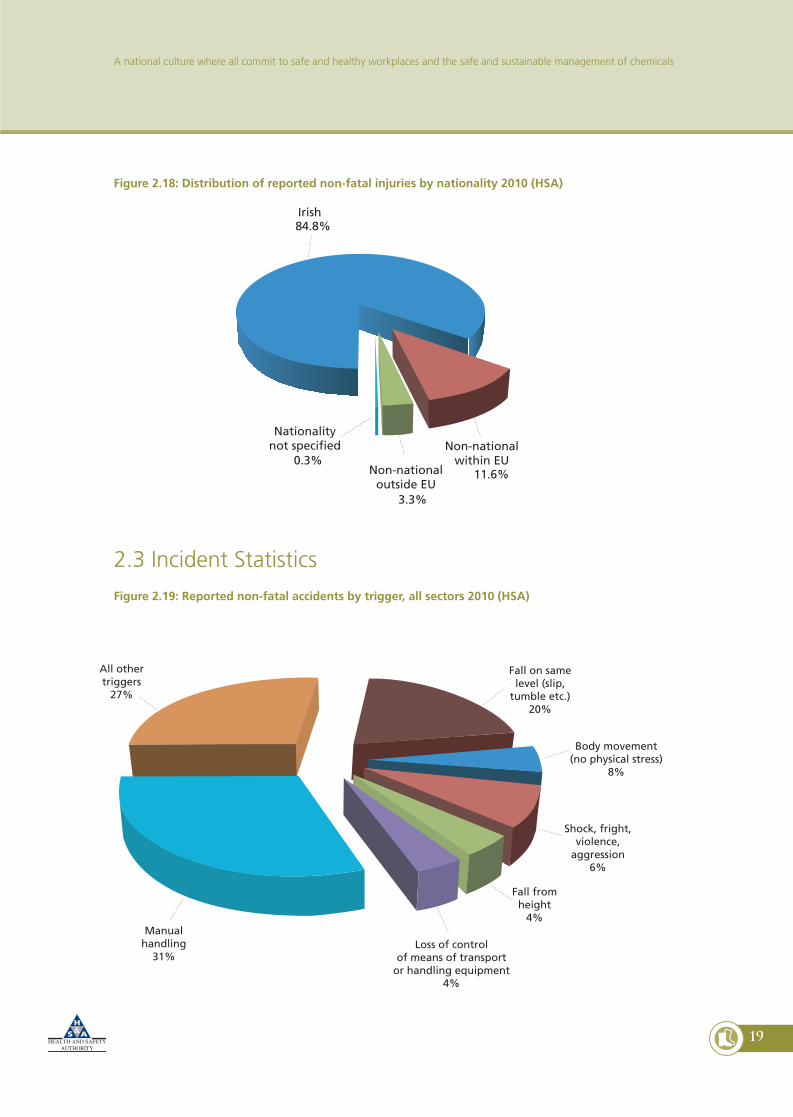
Figure 2.18: Distribution of reported non-fatal injuries by nationality 2010 (HSA) . . . . .19
2.3 Incident Statistics . . . . . . . . . . . . . . . . . . . . . . . . . . . . . . . . . . . . . . . . . . . . . . . .19
Figure 2.19: Reported non-fatal accidents by trigger, all sectors 2010 (HSA) . . . . . . . .19
Figure 2.20: Injury type by gender 2009 (CSO) . . . . . . . . . . . . . . . . . . . . . . . . . . . . . . .20
Figure 2.21: Illness type by gender 2009 (CSO) . . . . . . . . . . . . . . . . . . . . . . . . . . . . . .20
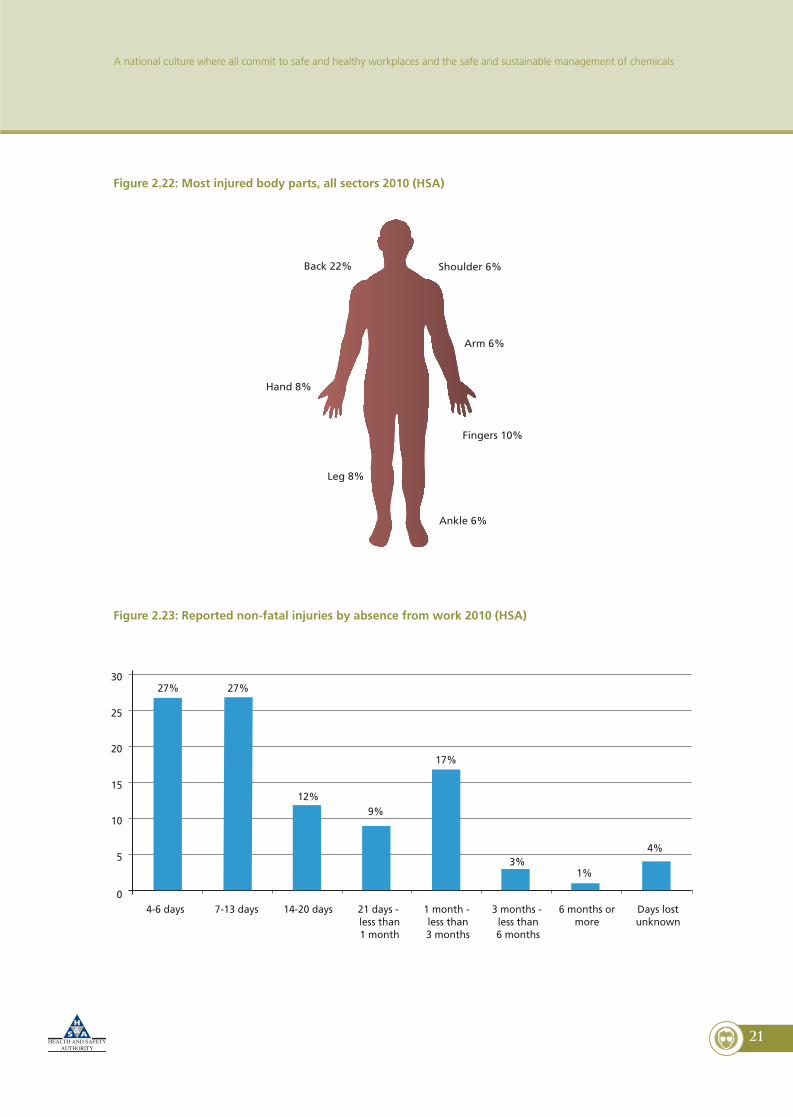
Figure 2.22: Most injured body parts, all sectors 2010 (HSA) . . . . . . . . . . . . . . . . . . . .21
Figure 2.23: Reported non-fatal injuries by absence from work 2010 (HSA) . . . . . . . . .21
2.4 Work Environment Statistics . . . . . . . . . . . . . . . . . . . . . . . . . . . . . . . . . . . . . . .22
Figure 2.24 Reported non-fatal injuries by work environment 2010 (HSA) . . . . . . . . . .22
Figure 2.25: Reported non-fatal injuries by size of employing organisation
2010 (HSA) . . . . . . . . . . . . . . . . . . . . . . . . . . . . . . . . . . . . . . . . . . . . . . . . .22
Figure 2.26: Number of reports by county 2010 (HSA) . . . . . . . . . . . . . . . . . . . . . . . . .23
Figure 2.27: Rate of illness and injury by region 2009 (CSO) . . . . . . . . . . . . . . . . . . . .23
Figure 2.28: Rate of injury per 1000 workers by region 2009 (CSO) . . . . . . . . . . . . . . .24
3. FATAL INJURY STATISTICS . . . . . . . . . . . . . . . . . . . . . . . . . . . . . . . . . . . . . . .25
Figure 3.1: Rate of worker fatalities 2002-2010 (HSA) . . . . . . . . . . . . . . . . . . . . . . . . .25
Figure 3.2: Number of reported fatalities by economic sector
(worker and non-worker) 2010 (HSA) . . . . . . . . . . . . . . . . . . . . . . . . . . . . .25
Figure 3.3: Rate of reported worker fatalities by economic sector 2010 (HSA) . . . . . . .26
Figure 3.4: Number of reported fatalities (worker and non-worker)
by economic sector 2008 - 2010 (HSA) . . . . . . . . . . . . . . . . . . . . . . . . . . . .26
Figure 3.5: Rate of reported worker fatalities by economic sector
2004–2010 (HSA) . . . . . . . . . . . . . . . . . . . . . . . . . . . . . . . . . . . . . . . . . . . .27
Figure 3.6: Comparison of total reported fatality rate with reported fatality rate in
the Agriculture/Fishing and Construction sectors 2002–2010 (HSA) . . . . . .27
Figure 3.7: Percentage of reported fatal injuries by employment status 2010 (HSA) . . .28
Figure 3.8: Number of reported fatalities (worker and non-worker) by
economic sector and age band 2010 (HSA) . . . . . . . . . . . . . . . . . . . . . . . .28
Figure 3.9: Number of reported fatalities (worker and non-worker) by age
band 2010 (HSA) . . . . . . . . . . . . . . . . . . . . . . . . . . . . . . . . . . . . . . . . . . . .29
Figure 3.10: Number of reported worker fatalities by nationality and
economic sector 2010 (HSA) . . . . . . . . . . . . . . . . . . . . . . . . . . . . . . . . . . . .29
Figure 3.11: Percentage of reported worker fatalities by nationality 2010 (HSA) . . . . . .30
Figure 3.12: Reported worker fatality rates by nationality 2008–2010 (HSA) . . . . . . . .30
2
HSA_Stats_Report inside_10:Layout 1 21/06/2011 10:15 Page 4
3
A national culture where all commit to safe and healthy workplaces and the safe and sustainable management of chemicals
Figure 3.13: Number of reported fatalities (worker and non-worker)
by accident trigger 2010 (HSA) . . . . . . . . . . . . . . . . . . . . . . . . . . . . . . . . . .30
Figure 3.14: Number of reported fatalities (worker and non-worker)
by county 2006-2010 (HSA) . . . . . . . . . . . . . . . . . . . . . . . . . . . . . . . . . . . .31
Figure 3.15: Worker fatality rates in the EU 2007 (Eurostat) . . . . . . . . . . . . . . . . . . . . .32
Figure 3:16: Map showing worker fatality rates in the EU 2007 (Eurostat) . . . . . . . . . .32
APPENDIX 1 . . . . . . . . . . . . . . . . . . . . . . . . . . . . . . . . . . . . . . . . . . . . . . . . . . . .33
Summary of reported fatalities 2010 . . . . . . . . . . . . . . . . . . . . . . . . . . . . . . . . . . . .33
APPENDIX 2 . . . . . . . . . . . . . . . . . . . . . . . . . . . . . . . . . . . . . . . . . . . . . . . . . . . .47
NACE Rev 2 – Level 1 and 2 . . . . . . . . . . . . . . . . . . . . . . . . . . . . . . . . . . . . . . . . . . .39
REFERENCES . . . . . . . . . . . . . . . . . . . . . . . . . . . . . . . . . . . . . . . . . . . . . . . . . . . .42
HSA_Stats_Report inside_10:Layout 1 21/06/2011 10:15 Page 5

1. Introduction
4
1.1 Overview of the Summary of Statistics 2009-2010
The Health and Safety Authority’s annual Summary of Statistics aims to provide information on some of the
most common queries on occupational injury, illness and workplace fatalities. Data from different sources is
brought together so that readers can review and monitor trends across a range of factors related to workplace
injury and illness, including the characteristics of the victim, the incident and the work environment.
We continue to make every effort to ensure that the information is easy to access and interpret.
Non-fatal injury and illness dataThe most recent data presented by the CSO continues to indicate a downward trend in the rates of non-fatal
injury and illness data for 2009 in Ireland. Overall, the number of persons suffering injury or illness in 2009 fell
by approximately 25% from the numbers in 2008. Of particular interest to the Authority is the large reduction
in the numbers and rates of persons suffering injury or illness causing 4+ days absence in 2009 (6.2 workers
out of every 1000 workers), the lowest rate recorded by the CSO to date. A similar trend is seen in the 4+ day
illness rate of 6.6 illnesses per 1000 workers in 2009. There is a consequent reduction in the number of
working days lost through injury and illness in 2009. At approximately 750,000 days this is almost half the
number of days lost in 2009 and is the lowest recorded number of days lost in the last decade. Mirroring
trends in CSO data, the Occupational Injuries Board at the Department of Social Protection processed fewer
claims in 2010 than the previous year.
Despite the overall downward trend in the injury and illness rates, the CSO data does show some consistent
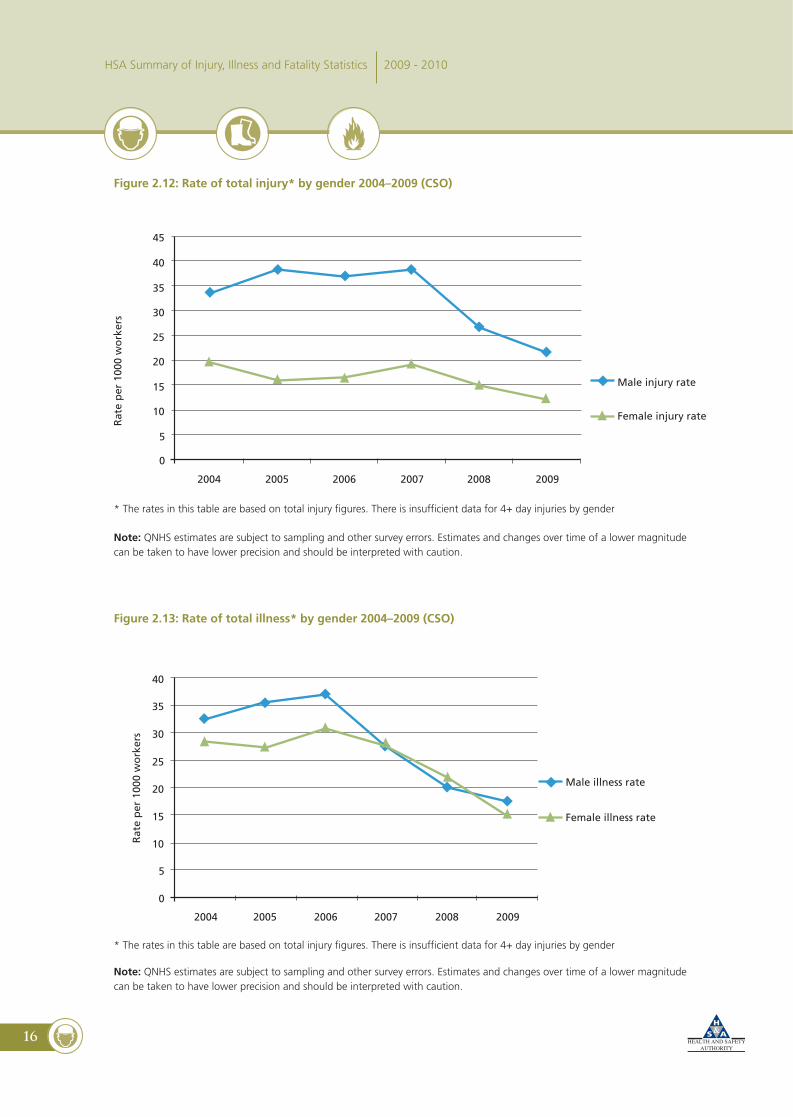
patterns with previous years. For example, female workers continue to have lower injury and illness rates than
male workers, although reductions were recorded in 2009 for both genders. A notable statistic in this area is
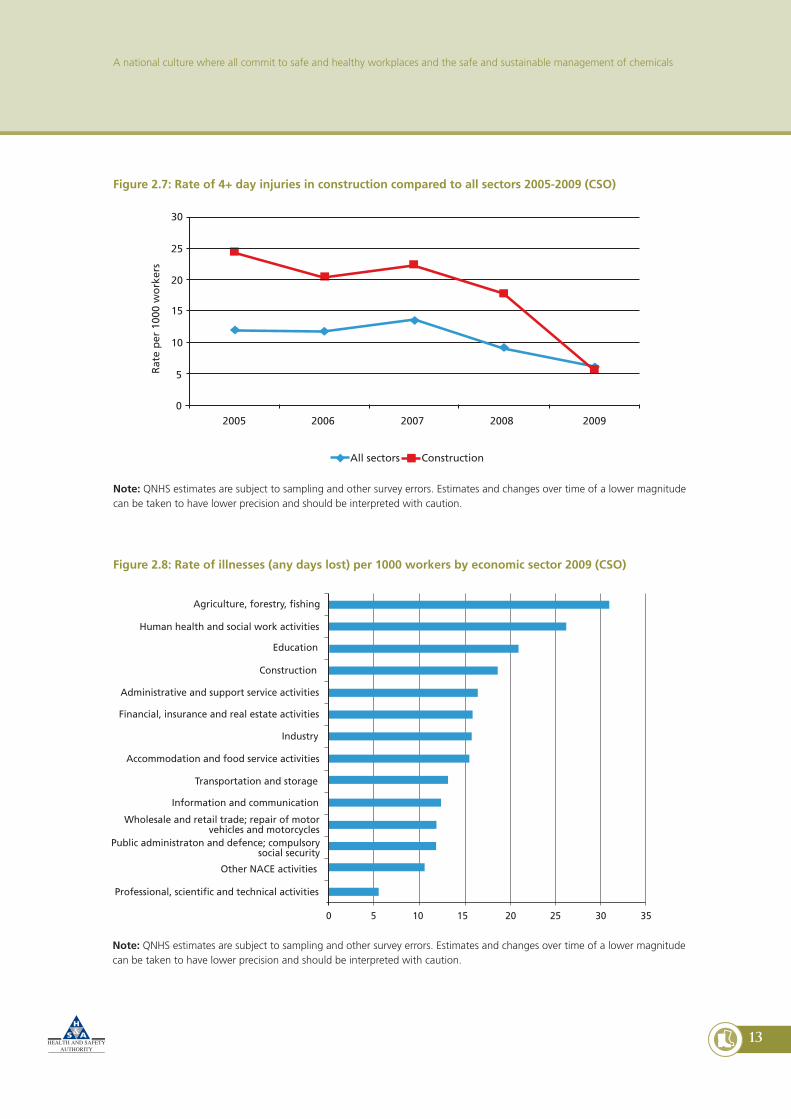
the reduction by over 50% in the male injury rate in the construction sector, 17.7 per 1000 male workers
compared to 36.7 in 2008. Workers aged between 20 and 24 years continue to display some of the highest
injury rates, although a slight decrease was observed. Conversely, this age group continues to display the
lowest rate of illness, despite a slight increase in 2009. The 65+ year age group recorded the highest rate of
illness.
Despite the very substantial reductions evident in the CSO data for 2008 and 2009 it is important tonote that the CSO has warned that many of these statistics are based on a very small number ofrespondents. Their assessment of the confidence intervals suggests that the differences in the 2008and 2009 data are not statistically significant. The move from seasonal quarters to calendar quartersand the consequent slight change in the survey questions may have influenced responses. Furtherdata must be obtained before the CSO can reach a conclusion about the statistical significance ofthe reduction.
Non-Irish national workers comprised over 12% of the Irish workforce at the end of 2010, compared to 16%
in 2009 and 17% in 2008. 15% of non-fatal injuries notified to the Authority in 2010 involved non-Irish
national workers.
In terms of the work environments in which injuries occur, the highest proportion (16%) of incidents occurred
in production areas, factories or workshops. Manual handling related injuries continue to account for
approximately one third of all reported injuries followed by slip, trip and fall incidents (21%).
HSA_Stats_Report inside_10:Layout 1 21/06/2011 10:15 Page 6

5
A national culture where all commit to safe and healthy workplaces and the safe and sustainable management of chemicals
Fatal injury dataThere were 48 workplace fatalities reported to the Authority during 2010, an increase on the record low of 43
reported in 2009. This translates to a slight increase in the worker fatality rate, with 2.3 fatal accidents per
100,000 compared to 1.9 fatalities per 100,000 workers in 2009.
There was quite a narrow sectoral distribution of fatalities in 2010. A total of 60% of fatal incidents occurred
in the farming, forestry and fishing sector (22, 3 and 4 fatalities respectively). The rate of 30.6 fatalities per
100,000 workers in the sector is almost double the rate in previous years (generally between 13 to 17 fatalities
per 100,000 workers) and is six times higher than the rate in the construction sector.
The construction sector recorded 6 fatalities in 2010, the lowest number recorded in the sector since the
Authority records began in 1989. This saw a reduction in the fatality rate to 4.5 fatalities per 100,000 workers
in the sector, the lowest rate since the 2006 figure of 4.3 fatalities per 100,000 workers.
Of the 48 fatalities, 6 involved non-workers. Of the 42 worker fatalities, 22 involved self-employed persons
and 21 of these were working in the agriculture, forestry and fishing sector. This is the highest percentage of
fatalities involving the self-employed ever recorded by the Authority. Another unique statistic that arose in
2010 is that all workplace fatalities involved male victims.
Tree felling activities claimed five lives in 2010, a significant increase on a single such incident in 2009.
A further fatality occurred, where the victim was electrocuted while pruning trees beneath power lines.
Of the 2010 fatalities, 27% involved persons aged between 55 and 64. Elderly workers continue to figure
highly in workplace fatalities, and particularly those involved in farming, with all 7 fatalities involving persons
aged 65 years and over occurring in this sector. This marks a return to an unfortunate trend after a complete
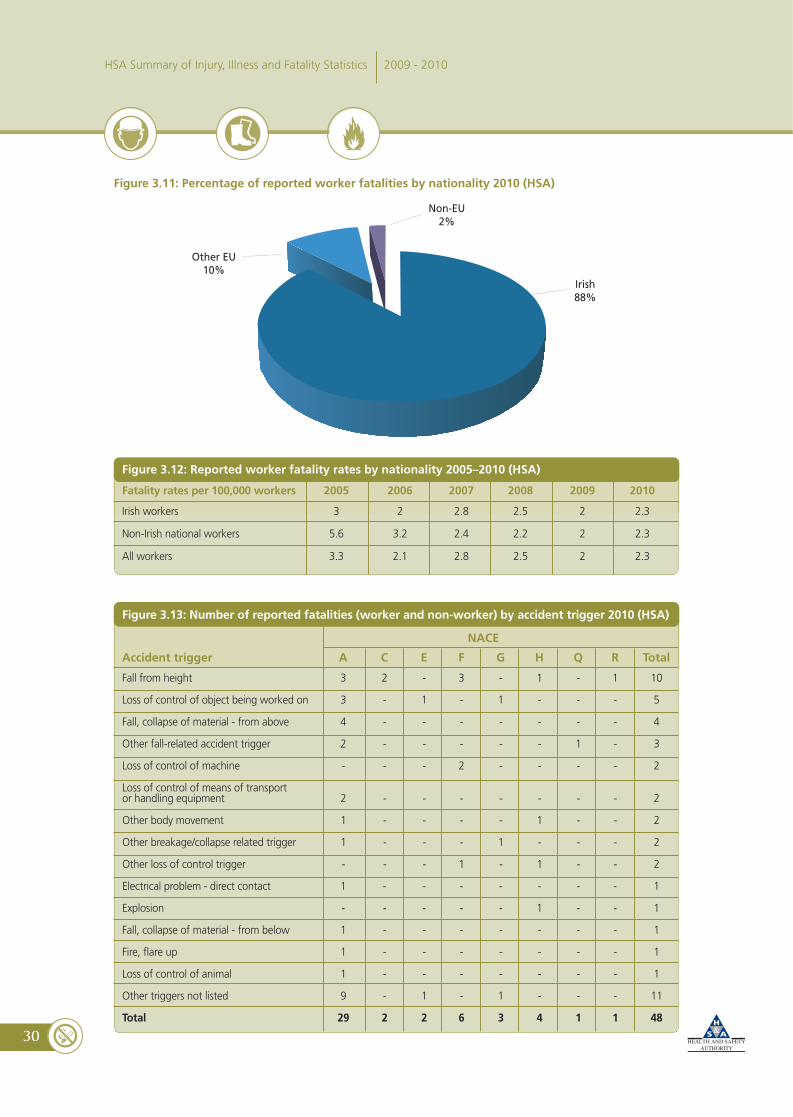
absence of such fatalities in 2009. Similar to 2009, the rate of fatal injury for non-Irish national workers was
the same as for Irish workers in 2010.
Falls from height were the most common cause of workplace deaths in 2010, with 10 such fatal accidents
recorded. The majority of these occurred in farming and construction where repair and maintenance was being
undertaken at roof level. Munster registered the highest number of workplace fatalities in 2010 with 18
fatalities in total, 7 of which occurred in Cork.
In addition to the reported workplace fatalities presented here, there may be other work-related road traffic
fatalities that were investigated by the Gardai. Recent information on road traffic fatalities is available from the
Road Safety Authority http://www.rsa.ie/en/RSA/Road-Safety/Our-Research.
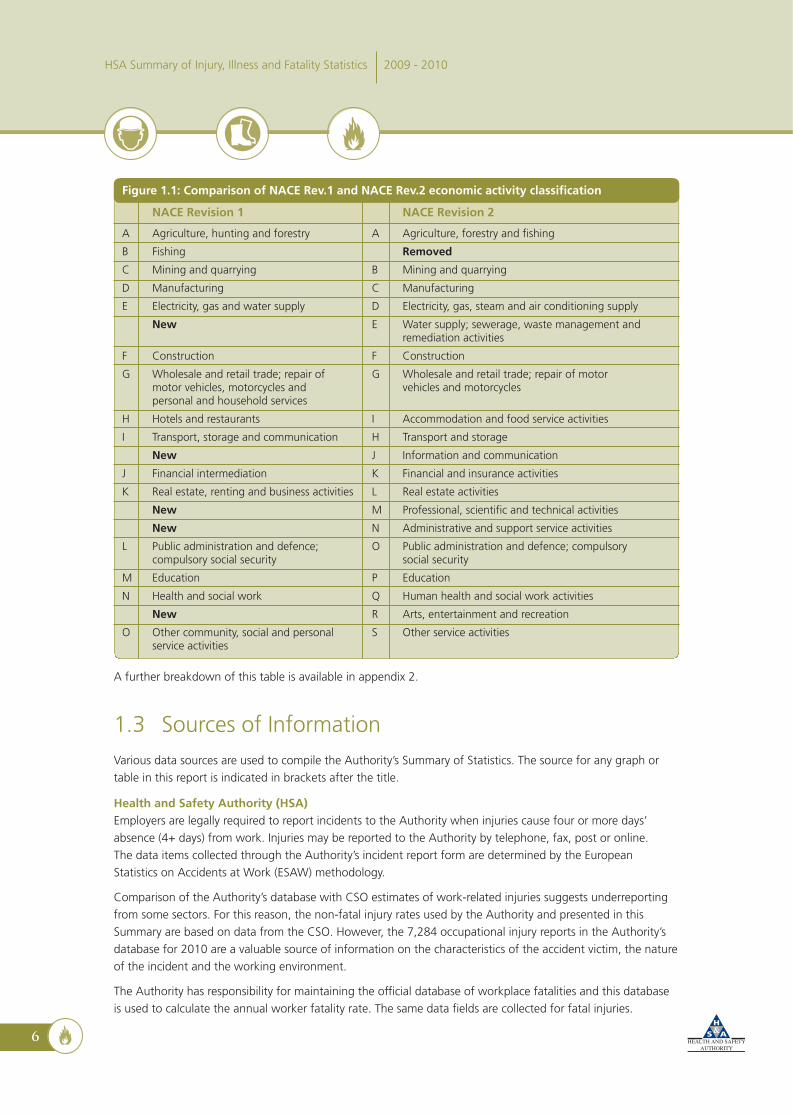
1.2 NACE Revision 2
The statistical Classification of Economic Activities, NACE, underwent a major revision (NACE Rev.2) effective
from 1 January 2008 under Regulation (EC) No 1893/2006 of the European Parliament and of the Council, 20
December 2006. The revised classification reflects developments in economic activity – see table below
comparing NACE Rev.1 and NACE Rev.2.
The Authority and all other agencies in Ireland and other EU member states were legally required to implement
the new NACE codes from this date. The Authority’s reporting systems and databases were adapted on 1
January 2008, with the result that data from 2008 onwards is recorded and presented using the NACE Rev.2
codes. CSO data is also based on the NACE Rev.2 classification since 2008. It has been necessary to re-classify
data for some of the tables in this Summary to facilitate comparison of data over time.
HSA_Stats_Report inside_10:Layout 1 21/06/2011 10:15 Page 7
6
A further breakdown of this table is available in appendix 2.
1.3 Sources of Information
Various data sources are used to compile the Authority’s Summary of Statistics. The source for any graph or
table in this report is indicated in brackets after the title.
Health and Safety Authority (HSA)Employers are legally required to report incidents to the Authority when injuries cause four or more days’
absence (4+ days) from work. Injuries may be reported to the Authority by telephone, fax, post or online.
The data items collected through the Authority’s incident report form are determined by the European
Statistics on Accidents at Work (ESAW) methodology.
Comparison of the Authority’s database with CSO estimates of work-related injuries suggests underreporting
from some sectors. For this reason, the non-fatal injury rates used by the Authority and presented in this
Summary are based on data from the CSO. However, the 7,284 occupational injury reports in the Authority’s
database for 2010 are a valuable source of information on the characteristics of the accident victim, the nature
of the incident and the working environment.
The Authority has responsibility for maintaining the official database of workplace fatalities and this database
is used to calculate the annual worker fatality rate. The same data fields are collected for fatal injuries.
Figure 1.1: Comparison of NACE Rev.1 and NACE Rev.2 economic activity classification
NACE Revision 1 NACE Revision 2
A Agriculture, hunting and forestry A Agriculture, forestry and fishing
B Fishing Removed
C Mining and quarrying B Mining and quarrying
D Manufacturing C Manufacturing
E Electricity, gas and water supply D Electricity, gas, steam and air conditioning supply
New E Water supply; sewerage, waste management andremediation activities
F Construction F Construction
G Wholesale and retail trade; repair of G Wholesale and retail trade; repair of motormotor vehicles, motorcycles and vehicles and motorcyclespersonal and household services
H Hotels and restaurants I Accommodation and food service activities
I Transport, storage and communication H Transport and storage
New J Information and communication
J Financial intermediation K Financial and insurance activities
K Real estate, renting and business activities L Real estate activities
New M Professional, scientific and technical activities
New N Administrative and support service activities
L Public administration and defence; O Public administration and defence; compulsorycompulsory social security social security
M Education P Education
N Health and social work Q Human health and social work activities
New R Arts, entertainment and recreation
O Other community, social and personal S Other service activitiesservice activities
HSA Summary of Injury, Illness and Fatality Statistics 2009 - 2010
HSA_Stats_Report inside_10:Layout 1 21/06/2011 10:15 Page 8
7
A national culture where all commit to safe and healthy workplaces and the safe and sustainable management of chemicals
EurostatEurostat is the statistical agency of the European Union. It provides a statistical information service and
promotes harmonisation of statistical methods across the member states. Eurostat has laid down the
methodologies employed by all member states for capturing information and producing statistics in relation to
occupational injuries and diseases. Eurostat administers working and technical groups that aim to promote
better practices in this field across the Community. Eurostat compiles statistics based on injury data supplied
by Member States and disseminates these statistics via the Eurostat website -
http://epp.eurostat.ec.europa.eu/portal/page/portal/health/health_safety_work.
European statistics for fatal and non-fatal injuries are included in this report.
Under Regulation No 1338/2008 of the European Parliament and of the Council on Community statistics on
public health and health and safety at work, Eurostat has developed an implementing regulation which will
make it a legal requirement for member states to submit annual data on occupational injury to Eurostat.
The regulation is due to enter into force in 2011. The Authority already supplies this data to Eurostat under
a voluntary arrangement and will continue to fulfil the legal requirement when it is introduced.
Central Statistics Office (CSO)The Central Statistics Office (CSO) estimates the number of workers that suffered a work-related injury or
illness each year. This estimate is based on the Accident and Illness module of the Quarterly National
Household Survey (QNHS), administered in the first quarter of each year. The data relating to the number and
rate of 4+ days lost injury and illness is an important indicator for the Authority as it represents the subset of
accidents that employers are legally required to report.
As of the first quarter of 2009 the QNHS is undertaken on a calendar quarter basis. Up to and including the
fourth quarter of 2008, the QNHS had operated on a seasonal quarter basis since its establishment in Q4
1997.
For the Accidents and Illness module reported in this Summary, CSO field workers asked people aged 15 or
over to indicate if they had suffered an injury incurred at work or an illness that the respondent believed had
been caused or made worse by their work in the period January 2009 to December 2009.
Changes in survey methods since 1998 mean that the results of all QNHS surveys cannot be directly compared.
However, the survey carried out in Q1 2010 is comparable to those carried out since 2003.
As the QNHS is a sample survey involving self reporting of work related accidents and illnesses the results are
subject to sampling and other survey errors. Specifically, estimates and changes over time of a lower
magnitude can be taken to have lower precision.
Department of Social and Family AffairsData provided by the Occupational Injury Benefits (OIB) division of the Department of Social and Family Affairs
is based on claims made by insured persons who are injured in the course of their work. The injury must last at
least four days, and a medical certificate and claim form must be sent within 21 days of the injury.
The number of claims is likely to be less than the number of work-related injuries because not all workers are
covered by social insurance, and not all injuries result in claims. The OIB dataset therefore includes a lower
number of work injuries than the QNHS, but the figures are a useful trend indicator because the criteria for
benefit payment have not changed over time.
HSA_Stats_Report inside_10:Layout 1 21/06/2011 10:15 Page 9
8
1.4 Technical Notes
Classification of injuriesThe Authority uses standard international classifications for its incident database and statistics:
• Economic activity: NACE (Nomenclature statistique des activités économiques dans la Communauté
Européenne: Statistical Classification of Economic Activities in the European Community).
The full classification is available to download from the Eurostat website:
http://circa.europa.eu/irc/dsis/nacecpacon/info/data/en/2007%20introduction.htm
• Occupation: ISCO (International Standard Classification of Occupations), maintained by ILO (International
Labour Organization). The ISCO codes are available to download from the Eurostat website:
http://epp.eurostat.ec.europa.eu/statistics_explained/index.php/International_standard_classification_of_occupations_(ISCO)
• European Statistics on Accidents at Work (ESAW) 2001 Methodology – variables, definitions and
classifications relating to the victim, the incident and the circumstances of the incident.
http://ec.europa.eu/eurostat/ramon/statmanuals/files/ESAW_2001_EN.pdf
Calculation of non-fatal and fatal injury ratesInjury and illness rates are calculated per 1,000 workers. Fatality rates are calculated per 100,000 workers.
HSA Summary of Injury, Illness and Fatality Statistics 2009 - 2010
HSA_Stats_Report inside_10:Layout 1 21/06/2011 10:15 Page 10
9
2. Non-Fatal Injury and Illness Statistics
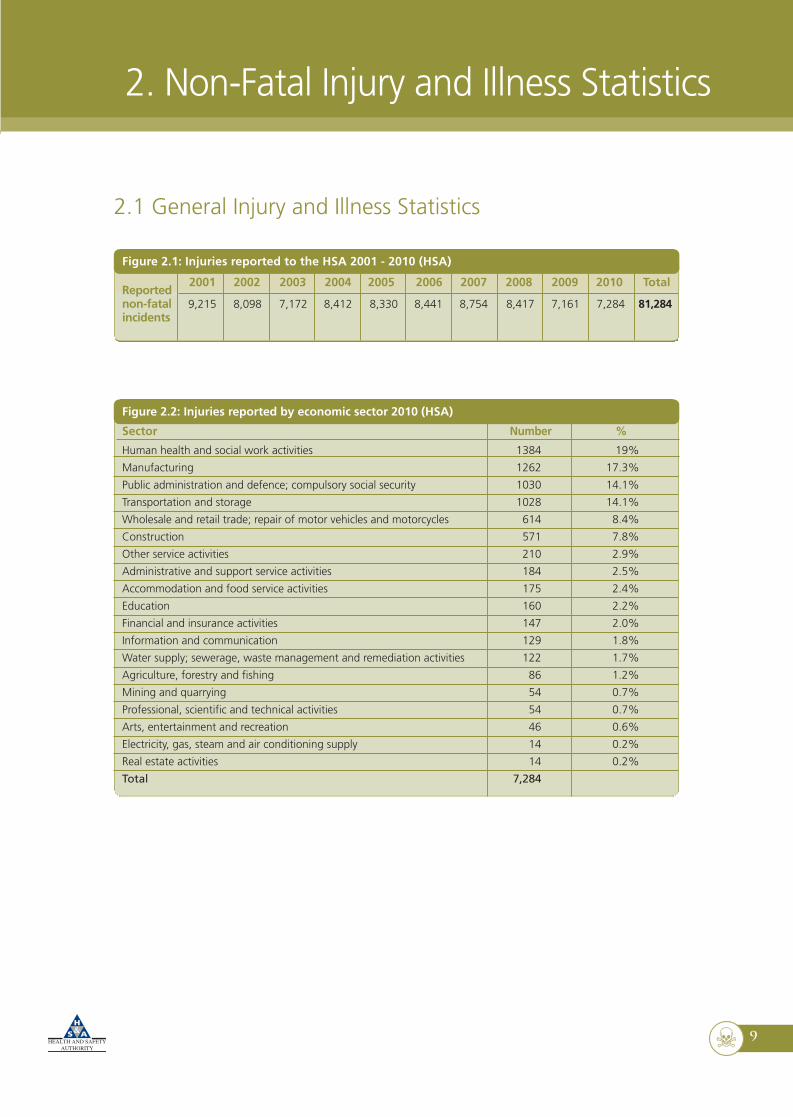
Figure 2.2: Injuries reported by economic sector 2010 (HSA)
Sector Number %
Human health and social work activities 1384 19%
Manufacturing 1262 17.3%
Public administration and defence; compulsory social security 1030 14.1%
Transportation and storage 1028 14.1%
Wholesale and retail trade; repair of motor vehicles and motorcycles 614 8.4%
Construction 571 7.8%
Other service activities 210 2.9%
Administrative and support service activities 184 2.5%
Accommodation and food service activities 175 2.4%
Education 160 2.2%
Financial and insurance activities 147 2.0%
Information and communication 129 1.8%
Water supply; sewerage, waste management and remediation activities 122 1.7%
Agriculture, forestry and fishing 86 1.2%
Mining and quarrying 54 0.7%
Professional, scientific and technical activities 54 0.7%
Arts, entertainment and recreation 46 0.6%
Electricity, gas, steam and air conditioning supply 14 0.2%
Real estate activities 14 0.2%
Total 7,284
Figure 2.1: Injuries reported to the HSA 2001 - 2010 (HSA)
2001 2002 2003 2004 2005 2006 2007 2008 2009 2010 TotalReportednon-fatal 9,215 8,098 7,172 8,412 8,330 8,441 8,754 8,417 7,161 7,284 81,284incidents
2.1 General Injury and Illness Statistics
HSA_Stats_Report inside_10:Layout 1 21/06/2011 10:15 Page 11
10
Rosie Sheerin Francis Rochford
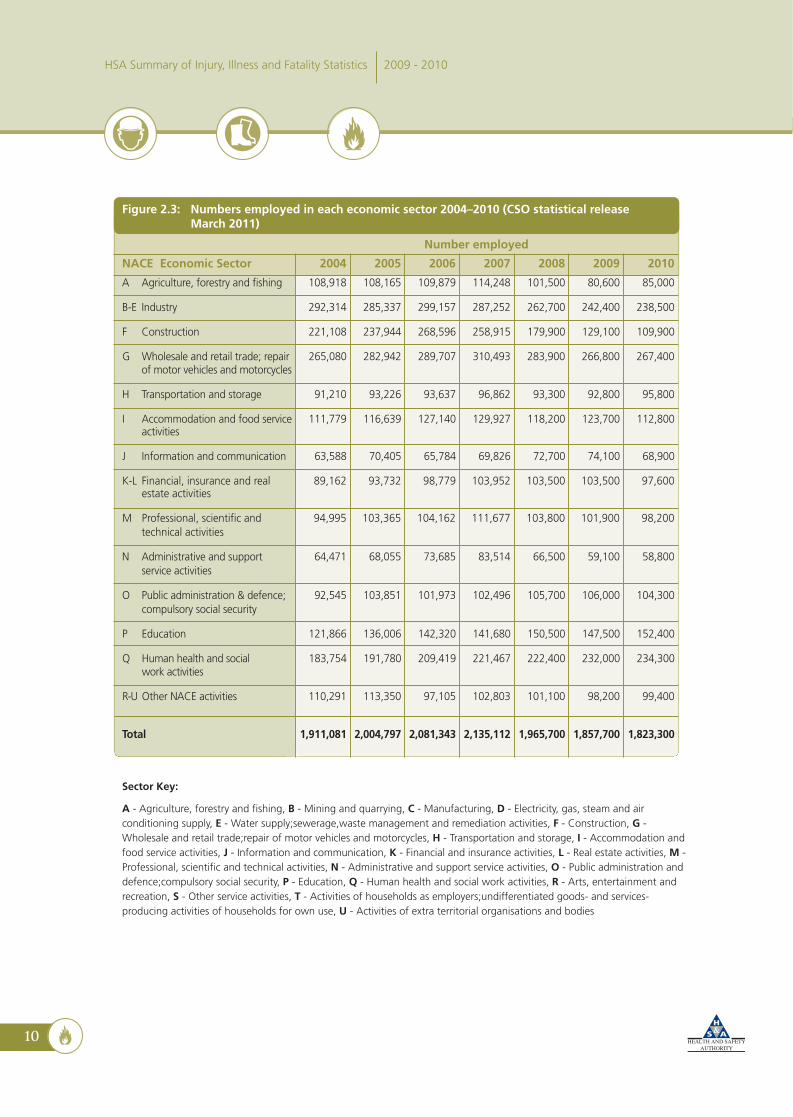
Figure 2.3: Numbers employed in each economic sector 2004–2010 (CSO statistical releaseMarch 2011)
Number employed
NACE Economic Sector 2004 2005 2006 2007 2008 2009 2010
A Agriculture, forestry and fishing 108,918 108,165 109,879 114,248 101,500 80,600 85,000
B-E Industry 292,314 285,337 299,157 287,252 262,700 242,400 238,500
F Construction 221,108 237,944 268,596 258,915 179,900 129,100 109,900
G Wholesale and retail trade; repair 265,080 282,942 289,707 310,493 283,900 266,800 267,400of motor vehicles and motorcycles
H Transportation and storage 91,210 93,226 93,637 96,862 93,300 92,800 95,800
I Accommodation and food service 111,779 116,639 127,140 129,927 118,200 123,700 112,800activities
J Information and communication 63,588 70,405 65,784 69,826 72,700 74,100 68,900
K-L Financial, insurance and real 89,162 93,732 98,779 103,952 103,500 103,500 97,600estate activities
M Professional, scientific and 94,995 103,365 104,162 111,677 103,800 101,900 98,200technical activities
N Administrative and support 64,471 68,055 73,685 83,514 66,500 59,100 58,800service activities
O Public administration & defence; 92,545 103,851 101,973 102,496 105,700 106,000 104,300compulsory social security
P Education 121,866 136,006 142,320 141,680 150,500 147,500 152,400
Q Human health and social 183,754 191,780 209,419 221,467 222,400 232,000 234,300work activities
R-U Other NACE activities 110,291 113,350 97,105 102,803 101,100 98,200 99,400
Total 1,911,081 2,004,797 2,081,343 2,135,112 1,965,700 1,857,700 1,823,300
Sector Key:
A - Agriculture, forestry and fishing, B - Mining and quarrying, C - Manufacturing, D - Electricity, gas, steam and airconditioning supply, E - Water supply;sewerage,waste management and remediation activities, F - Construction, G -Wholesale and retail trade;repair of motor vehicles and motorcycles, H - Transportation and storage, I - Accommodation andfood service activities, J - Information and communication, K - Financial and insurance activities, L - Real estate activities, M -Professional, scientific and technical activities, N - Administrative and support service activities, O - Public administration anddefence;compulsory social security, P - Education, Q - Human health and social work activities, R - Arts, entertainment andrecreation, S - Other service activities, T - Activities of households as employers;undifferentiated goods- and services-producing activities of households for own use, U - Activities of extra territorial organisations and bodies
HSA Summary of Injury, Illness and Fatality Statistics 2009 - 2010
HSA_Stats_Report inside_10:Layout 1 21/06/2011 10:15 Page 12
11
A national culture where all commit to safe and healthy workplaces and the safe and sustainable management of chemicals
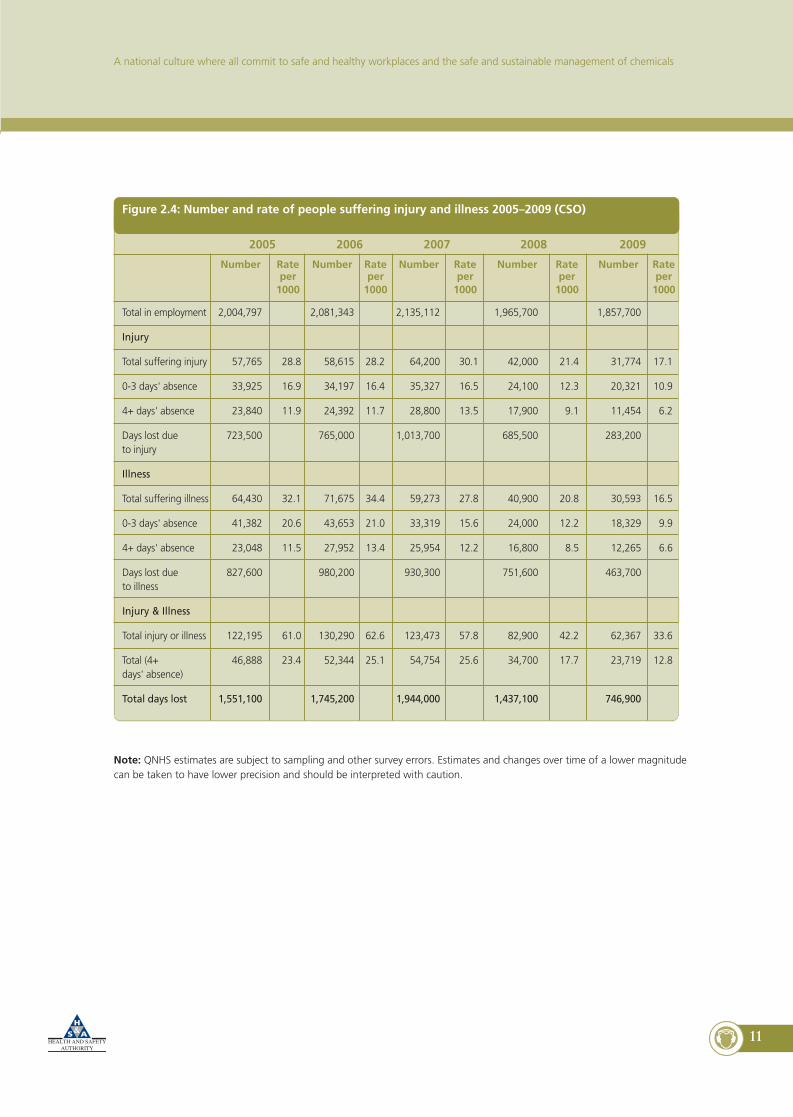
Figure 2.4: Number and rate of people suffering injury and illness 2005–2009 (CSO)
2005 2006 2007 2008 2009
Number Rate Number Rate Number Rate Number Rate Number Rateper per per per per
1000 1000 1000 1000 1000
Total in employment 2,004,797 2,081,343 2,135,112 1,965,700 1,857,700
Injury
Total suffering injury 57,765 28.8 58,615 28.2 64,200 30.1 42,000 21.4 31,774 17.1
0-3 days' absence 33,925 16.9 34,197 16.4 35,327 16.5 24,100 12.3 20,321 10.9
4+ days' absence 23,840 11.9 24,392 11.7 28,800 13.5 17,900 9.1 11,454 6.2
Days lost due 723,500 765,000 1,013,700 685,500 283,200to injury
Illness
Total suffering illness 64,430 32.1 71,675 34.4 59,273 27.8 40,900 20.8 30,593 16.5
0-3 days' absence 41,382 20.6 43,653 21.0 33,319 15.6 24,000 12.2 18,329 9.9
4+ days' absence 23,048 11.5 27,952 13.4 25,954 12.2 16,800 8.5 12,265 6.6
Days lost due 827,600 980,200 930,300 751,600 463,700to illness
Injury & Illness
Total injury or illness 122,195 61.0 130,290 62.6 123,473 57.8 82,900 42.2 62,367 33.6
Total (4+ 46,888 23.4 52,344 25.1 54,754 25.6 34,700 17.7 23,719 12.8days' absence)
Total days lost 1,551,100 1,745,200 1,944,000 1,437,100 746,900
Note: QNHS estimates are subject to sampling and other survey errors. Estimates and changes over time of a lower magnitudecan be taken to have lower precision and should be interpreted with caution.
HSA_Stats_Report inside_10:Layout 1 21/06/2011 10:15 Page 13
12
Figure 2.5: Rate of injury and illness causing 4+ days’ lost 2005–2009 (CSO)
Figure 2.6: Rate of injuries (any days lost) per 1000 workers by economic sector 2009 (CSO)
2005
0
2
4
6
8
Per
1,00
0w
ork
ers
10
12
14
16
2006 2007 2008 2009
4+ day injury
4+ day illness
HSA Summary of Injury, Illness and Fatality Statistics 2009 - 2010
Agriculture, forestry, fishing
Other NACE activities
Construction
Wholesale and retail trade; repair ofmotor vehicles and motorcycles
Transportation and storage
Financial, insurance and real estate activities
Professional, scientific and technical activities
Public administration and defence;compulsory social security
Administrative and support service activities
Industry
Education
Accommodation and food service activities
Human health and social work activities
Information and communication
0 5 10 15 20 25 30
Note: QNHS estimates are subject to sampling and other survey errors. Estimates and changes over time of a lower magnitudecan be taken to have lower precision and should be interpreted with caution.
HSA_Stats_Report inside_10:Layout 1 21/06/2011 10:15 Page 14
13
A national culture where all commit to safe and healthy workplaces and the safe and sustainable management of chemicals
Figure 2.7: Rate of 4+ day injuries in construction compared to all sectors 2005-2009 (CSO)
Figure 2.8: Rate of illnesses (any days lost) per 1000 workers by economic sector 2009 (CSO)
Rat
ep
er10
00w
ork
ers
20050
5
10
15
20
25
30
2006 2007 2008 2009
All sectors Construction
Note: QNHS estimates are subject to sampling and other survey errors. Estimates and changes over time of a lower magnitudecan be taken to have lower precision and should be interpreted with caution.
0 5 10 15 20 25 30 35
Agriculture, forestry, fishing
Other NACE activities
Construction
Wholesale and retail trade; repair of motorvehicles and motorcycles
Transportation and storage
Financial, insurance and real estate activities
Professional, scientific and technical activities
Public administraton and defence; compulsorysocial security
Administrative and support service activities
Industry
Education
Accommodation and food service activities
Human health and social work activities
Information and communication
Note: QNHS estimates are subject to sampling and other survey errors. Estimates and changes over time of a lower magnitudecan be taken to have lower precision and should be interpreted with caution.
14
HSA Summary of Injury, Illness and Fatality Statistics 2009 - 2010
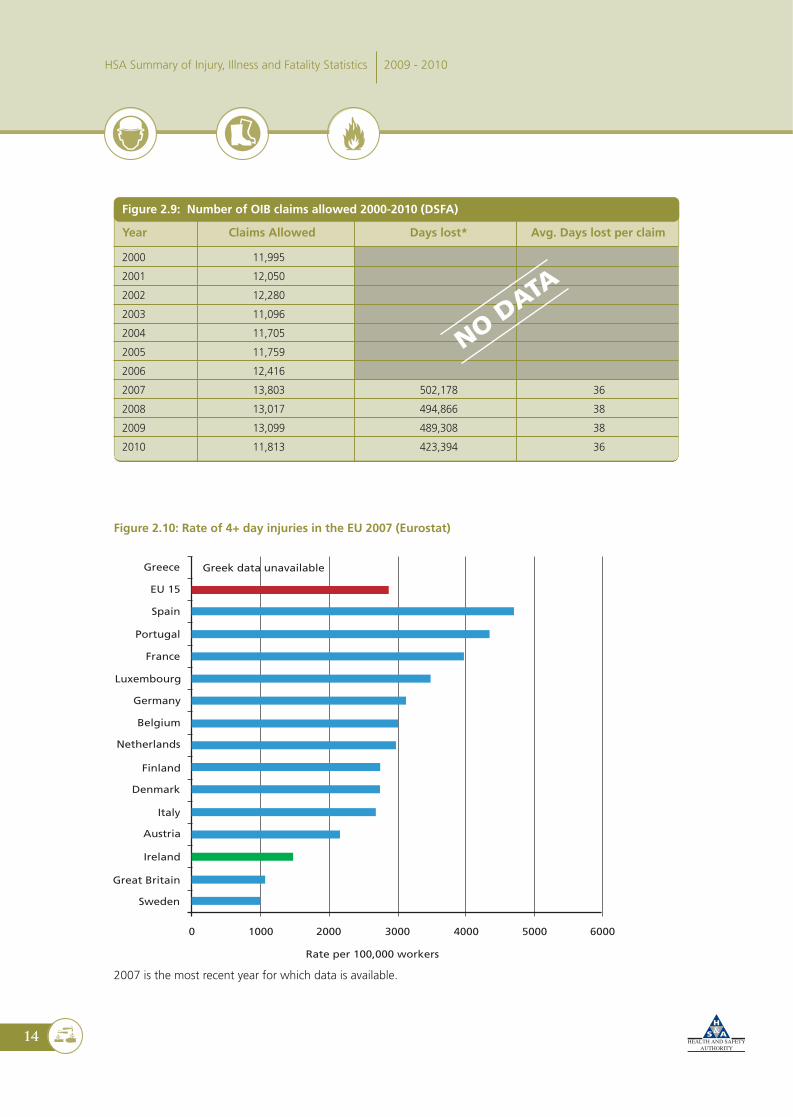
Figure 2.9: Number of OIB claims allowed 2000-2010 (DSFA)
Year Claims Allowed Days lost* Avg. Days lost per claim
2000 11,995
2001 12,050
2002 12,280
2003 11,096
2004 11,705
2005 11,759
2006 12,416
2007 13,803 502,178 36
2008 13,017 494,866 38
2009 13,099 489,308 38
2010 11,813 423,394 36
NODATA
EU 15
Spain
Portugal
France
Luxembourg
Germany
Belgium
Finland
Netherlands
Italy
Denmark
Austria
Greece Greek data unavailable
Rate per 100,000 workers
Ireland
Great Britain
Sweden
0 1000 2000 3000 4000 5000 6000
Figure 2.10: Rate of 4+ day injuries in the EU 2007 (Eurostat)
2007 is the most recent year for which data is available.
HSA_Stats_Report inside_10:Layout 1 21/06/2011 10:15 Page 16

15
A national culture where all commit to safe and healthy workplaces and the safe and sustainable management of chemicals
2.2 Victim Statistics
Figure 2.11: Number and rate of injury/illness* by economic sector and gender 2009 (CSO)
Economic Sector Number employed per 1000 workers per 1000 workers
Male Female Male Female Male Female
A Agriculture, forestry and fishing 72,700 8,000 22.6 12.3 34.4 0.0
B-E Industry 176,700 65,700 17.2 12.6 14.8 18.2
F Construction 118,800 10,300 17.7 0.0 20.3 0.0
G Wholesale and retail trade; repair of motor 131,100 135,700 32.7 6.1 19.9 4.1vehicles and motorcycles
H Transportation and storage 75,400 17,500 28.6 19.5 12.0 18.0
I Accommodation and food service activities 55,900 67,800 44.5 11.5 21.2 10.9
J Information and communication 52,600 21,500 9.8 0.0 6.6 26.6
K-L Financial, insurance and real estate activities 48,600 54,900 0.0 12.4 19.1 12.9
M Professional, scientific and technical activities 60,500 41,400 9.0 6.3 4.6 6.8
N Administrative and support service activities 29,200 29,800 17.4 16.0 19.6 13.6
O Public administration & defence; 53,300 52,600 18.4 7.1 18.5 5.1compulsory social security
P Education 40,300 107,300 0.0 10.7 0.0 28.9
Q Human health and social work activities 42,100 189,900 39.8 20.5 37.1 23.8
R-U Other NACE activities 39,200 59,000 40.8 8.6 16.9 6.3
Total 996,400 861,400 21.6 11.9 17.6 15.1
Note: QNHS estimates are subject to sampling and other survey errors. Estimates and changes over time of a lower magnitudecan be taken to have lower precision and should be interpreted with caution.
NACE
* The rates in this table are based on total injury and illness figures. There is insufficient data for 4+ day injuries and illness bygender
Injury rate Illness rate
HSA_Stats_Report inside_10:Layout 1 21/06/2011 10:15 Page 17
16
2.2 Victim StatisticsFigure 2.12: Rate of total injury* by gender 2004–2009 (CSO)
Figure 2.13: Rate of total illness* by gender 2004–2009 (CSO)
HSA Summary of Injury, Illness and Fatality Statistics 2009 - 2010
Rat
ep
er10
00w
ork
ers
45
40
35
30
25
20
15
10
5
0
2004 2005 2006 2007 2008 2009
Male injury rate
Female injury rate
Rat
ep
er10
00w
ork
ers
2004 2005 2006 2007 2008 2009
40
35
30
25
20
15
10
5
0
Male illness rate
Female illness rate
* The rates in this table are based on total injury figures. There is insufficient data for 4+ day injuries by gender
Note: QNHS estimates are subject to sampling and other survey errors. Estimates and changes over time of a lower magnitudecan be taken to have lower precision and should be interpreted with caution.
Note: QNHS estimates are subject to sampling and other survey errors. Estimates and changes over time of a lower magnitudecan be taken to have lower precision and should be interpreted with caution.
* The rates in this table are based on total injury figures. There is insufficient data for 4+ day injuries by gender
HSA_Stats_Report inside_10:Layout 1 21/06/2011 10:15 Page 18

17
A national culture where all commit to safe and healthy workplaces and the safe and sustainable management of chemicals
Figure 2.14: Rates of total injury and total illness per 1000 workers by age band 2009 (CSO)
Age range Injury rate 2009 Illness rate 2009
15-19 * *
20-24 24.0 12.5
25-34 18.6 17.5
35-44 16.7 15.7
45-54 16.6 19.0
55-64 14.5 14.8
65+ 10.1 20.7
Total 17.1 16.5
Note: QNHS estimates are subject to sampling and other survey errors. Estimates and changes over time of a lower magnitudecan be taken to have lower precision and should be interpreted with caution.
Figure 2.15: Rates of total injury and total illness per 1000 workers by occupation 2009 (CSO)
Occupation Injury rate 2009 Illness rate 2009
Managers and Administrators 16.0 18.6
Professional 15.0 19.2
Associate Professional and Technical 18.6 27.0
Clerical and Secretarial 5.9 10.6
Craft and Related 28.2 16.7
Personal and Protective Service 22.1 17.4
Sales 5.5 6.4
Plant and Machine Operatives 26.7 17.0
Other 21.7 12.0
All sectors 17.1 16.5
Note: QNHS estimates are subject to sampling and other survey errors. Estimates and changes over time of a lower magnitudecan be taken to have lower precision and should be interpreted with caution.
* Insufficient data
HSA_Stats_Report inside_10:Layout 1 21/06/2011 10:15 Page 19
18
Figure 2.16: Reported non-fatal injuries by employment status 2010 (HSA)
HSA Summary of Injury, Illness and Fatality Statistics 2009 - 2010
Figure 2.17: Workers by nationality and economic sector 2010 (CSO statistical release March 2011)
Workers at Q4 2010
Economic Sector Irish Non-Irish % non-Irish
A Agriculture, forestry and fishing 79,400 5,500 6.5%
B-E Industry 197,600 40,900 17.1%
F Construction 99,300 10,600 9.6%
G Wholesale and retail trade, repair of 230,400 37,000 13.8%motor vehicles and motorcycles
H Transport and storage 86,800 9,000 9.4%
I Accommodation and food service activities 82,800 30,000 26.6%
J Information and communication 57,700 11,100 16.1%
K-L Financial, insurance and real estate activities 90,900 6,700 6.9%
M Professional, scientific and technical activities 90,600 7,600 7.7%
N Administrative and support service activities 47,800 11,000 18.7%
O Public administration and defence, 102,900 1,500 1.4%compulsory social security
P Education 144,100 8,300 5.4%
Q Human health and social work activities 205,700 28,600 12.2%
R-U Other NACE activities 87,100 12,200 12.3%
Total 1,603,100 220,000 12.1%
95.2%Employee
FamilyWorker
Employment statusunknown
Self-employed
Non-worker
Trainee
0.01%
0.1%
0.6%
0.8
3.2%
Note: QNHS estimates are subject to sampling and other survey errors. Estimates and changes over time of a lower magnitudecan be taken to have lower precision and should be interpreted with caution.
HSA_Stats_Report inside_10:Layout 1 21/06/2011 10:15 Page 20
19
A national culture where all commit to safe and healthy workplaces and the safe and sustainable management of chemicals
Figure 2.18: Distribution of reported non-fatal injuries by nationality 2010 (HSA)
2.3 Incident Statistics
Figure 2.19: Reported non-fatal accidents by trigger, all sectors 2010 (HSA)
0.3%
3.3%
11.6%
84.8%Irish
Nationalitynot specified Non-national
within EUNon-national
outside EU
Loss of controlof means of transport
or handling equipment4%
Manualhandling
31%
Fall on samelevel (slip,
tumble etc.)20%
Body movement(no physical stress)
8%
Fall fromheight
4%
Shock, fright,violence,
aggression6%
All othertriggers
27%
HSA_Stats_Report inside_10:Layout 1 21/06/2011 10:15 Page 21
20
HSA Summary of Injury, Illness and Fatality Statistics 2009 - 2010
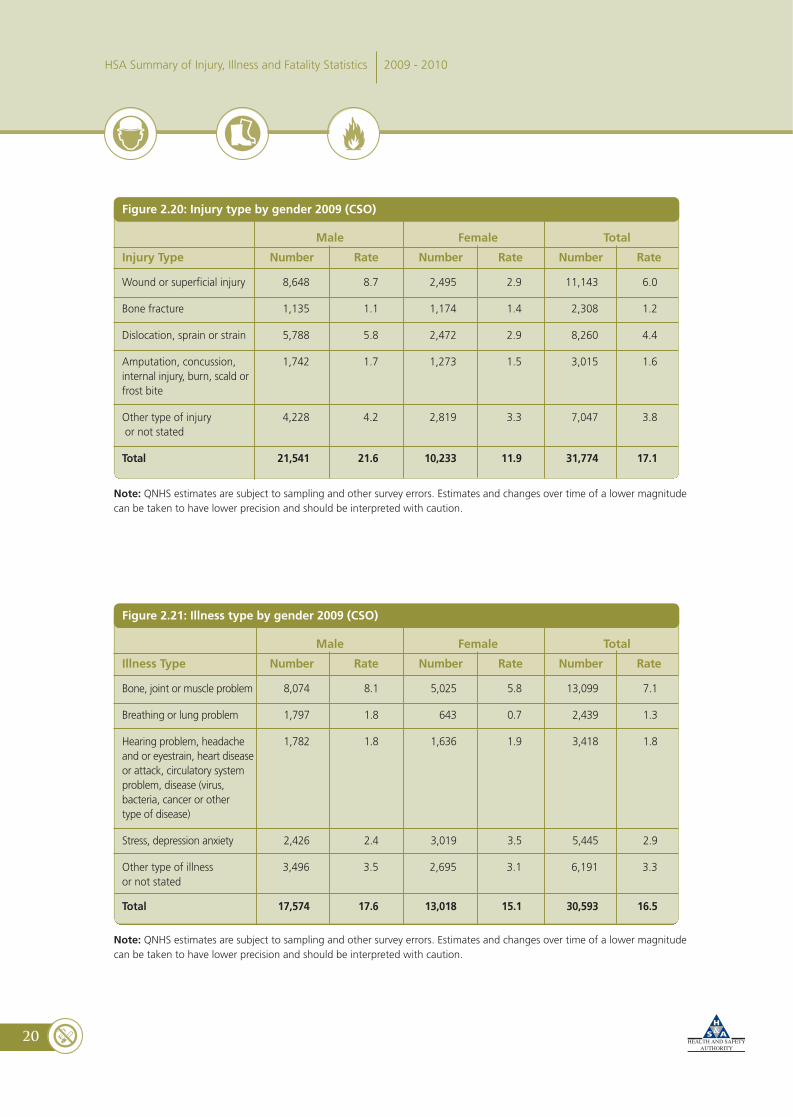
Figure 2.20: Injury type by gender 2009 (CSO)
Male Female Total
Injury Type Number Rate Number Rate Number Rate
Wound or superficial injury 8,648 8.7 2,495 2.9 11,143 6.0
Bone fracture 1,135 1.1 1,174 1.4 2,308 1.2
Dislocation, sprain or strain 5,788 5.8 2,472 2.9 8,260 4.4
Amputation, concussion, 1,742 1.7 1,273 1.5 3,015 1.6internal injury, burn, scald orfrost bite
Other type of injury 4,228 4.2 2,819 3.3 7,047 3.8or not stated
Total 21,541 21.6 10,233 11.9 31,774 17.1
Figure 2.21: Illness type by gender 2009 (CSO)
Male Female Total
Illness Type Number Rate Number Rate Number Rate
Bone, joint or muscle problem 8,074 8.1 5,025 5.8 13,099 7.1
Breathing or lung problem 1,797 1.8 643 0.7 2,439 1.3
Hearing problem, headache 1,782 1.8 1,636 1.9 3,418 1.8and or eyestrain, heart diseaseor attack, circulatory systemproblem, disease (virus,bacteria, cancer or othertype of disease)
Stress, depression anxiety 2,426 2.4 3,019 3.5 5,445 2.9
Other type of illness 3,496 3.5 2,695 3.1 6,191 3.3or not stated
Total 17,574 17.6 13,018 15.1 30,593 16.5
Note: QNHS estimates are subject to sampling and other survey errors. Estimates and changes over time of a lower magnitudecan be taken to have lower precision and should be interpreted with caution.
Note: QNHS estimates are subject to sampling and other survey errors. Estimates and changes over time of a lower magnitudecan be taken to have lower precision and should be interpreted with caution.
HSA_Stats_Report inside_10:Layout 1 21/06/2011 10:15 Page 22
21
A national culture where all commit to safe and healthy workplaces and the safe and sustainable management of chemicals
Figure 2.22: Most injured body parts, all sectors 2010 (HSA)
Figure 2.23: Reported non-fatal injuries by absence from work 2010 (HSA)
Back 22%
Hand 8%
Leg 8%
Ankle 6%
Fingers 10%
Arm 6%
Shoulder 6%
4-6 days 7-13 days 14-20 days 21 days - less than1 month
1 month - less than3 months
3 months - less than6 months
6 months ormore
Days lostunknown
0
5
10
15
20
25
30 27% 27%
12%9%
17%
3%1%
4%
HSA_Stats_Report inside_10:Layout 1 21/06/2011 10:15 Page 23

22
2.4 Work Environment Statistics
Figure 2.24 Reported non-fatal injuries by work environment 2010 (HSA)
Figure 2.25: Reported non-fatal injuries by size of employing organisation 2010 (HSA)
HSA Summary of Injury, Illness and Fatality Statistics 2009 - 2010
Production area,factory, workshop
16%
Hospital10%
Area for storageloading / unloading
7%
Shop, sales area6%
Other healthcareenvironment
5%
Other workingenvironment
44%
Public thoroughfare(e.g. roads, parking
areas)12%
Number ofemployeesunknown
7%
1-9 employees10%
10-49 employees23%
0 employees(self employed)
0.2%
50-249 employees29.3%
250-499 employees11%
500 employeesor more
21%
HSA_Stats_Report inside_10:Layout 1 21/06/2011 10:15 Page 24

23
A national culture where all commit to safe and healthy workplaces and the safe and sustainable management of chemicals
Figure 2.26: Number of non-fatal injury reports by county 2010 (HSA)
County Reports %
Carlow 101 1.4%
Cavan 84 1.2%
Clare 137 1.9%
Cork 835 11.5%
Donegal 89 1.2%
Dublin 2896 39.8%
Galway 301 4.1%
Kerry 183 2.5%
Kildare 310 4.3%
Kilkenny 116 1.6%
Laois 108 1.5%
Leitrim 38 0.5%
Limerick 293 4.0%
Longford 68 0.9%
Louth 171 2.3%
Mayo 158 2.2%
Meath 184 2.5%
Monaghan 65 0.9%
Offaly 128 1.8%
Roscommon 38 0.5%
Sligo 93 1.3%
Tipperary 279 3.8%
Waterford 163 2.2%
Westmeath 124 1.7%
Wexford 169 2.3%
Wicklow 149 2.0%
Total 7280 100%
Figure 2.27: Rate of illness and injury by region 2009 (CSO)
Total Injury IllnessRegion employed Number Rate per Number Rate per
1000 1000
Border 187,846 1876 10.0 2492 13.3
Midlands 108,208 1876 17.3 1278 11.8
West 184,036 4454 24.2 4624 25.1
Dublin 540,255 7773 14.4 10835 20.1
Mid-East 230,897 6011 26.0 2518 10.9
Mid-West 147,855 2723 18.4 1664 11.3
South-East 189,848 3241 17.1 3082 16.2
South-West 268,701 3820 14.2 4101 15.3
Note: QNHS estimates are subject to sampling and other survey errors. Estimates and changes over time of a lower magnitudecan be taken to have lower precision and should be interpreted with caution.
HSA_Stats_Report inside_10:Layout 1 21/06/2011 10:15 Page 25
24
HSA Summary of Injury, Illness and Fatality Statistics 2009 - 2010
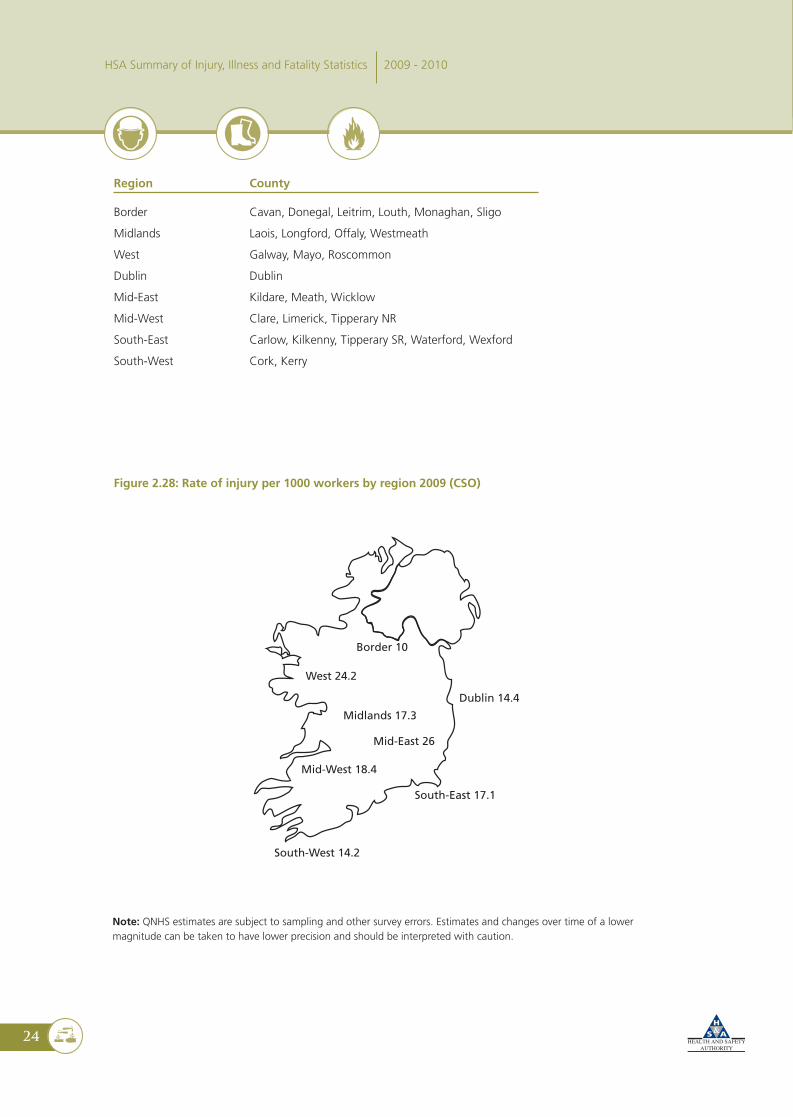
Region County
Border Cavan, Donegal, Leitrim, Louth, Monaghan, Sligo
Midlands Laois, Longford, Offaly, Westmeath
West Galway, Mayo, Roscommon
Dublin Dublin
Mid-East Kildare, Meath, Wicklow
Mid-West Clare, Limerick, Tipperary NR
South-East Carlow, Kilkenny, Tipperary SR, Waterford, Wexford
South-West Cork, Kerry
Figure 2.28: Rate of injury per 1000 workers by region 2009 (CSO)
Dublin 14.4
South-East 17.1
South-West 14.2
Mid-West 18.4
Mid-East 26
Midlands 17.3
West 24.2
Border 10
Note: QNHS estimates are subject to sampling and other survey errors. Estimates and changes over time of a lowermagnitude can be taken to have lower precision and should be interpreted with caution.
HSA_Stats_Report inside_10:Layout 1 21/06/2011 10:15 Page 26

25
3. Fatal Injury Statistics
Figure 3.1: Rate of worker fatalities 2002-2010 (HSA)
Figure 3.2: Number of reported fatalities by economic sector (worker and non-worker) 2010 (HSA)
Sector keyA – Agriculture, forestry and fishing; C – Manufacturing; E– Water supply;sewerage,waste management and remediationactivities; F – Construction; G – Wholesale/Retail trade, repair of vehicles, personal and household goods; H – Transportationand storage; Q – Human health and social work activities; R – Arts, entertainment and recreation
Nu
mb
erfa
talit
ies
0
5
10
15
20
25
30
A C E F G H Q R
Non-worker
Worker
Economic Sector
200420032002 2005 2006 2007 2008 2009 2010
Rat
ep
er10
0,00
0w
ork
ers
3.5
3
2.5
2
1.5
1
0.5
0
Annual rate 3 year rolling rate
In addition to the reported workplace fatalities presented here, there may be other work-related road traffic
fatalities that were investigated by the Gardai, but not reported to the Authority. Recent information on road traffic
fatalities is available from the Road Safety Authority http://www.rsa.ie/en/RSA/Road-Safety/Our-Research.
HSA_Stats_Report inside_10:Layout 1 21/06/2011 10:15 Page 27
26
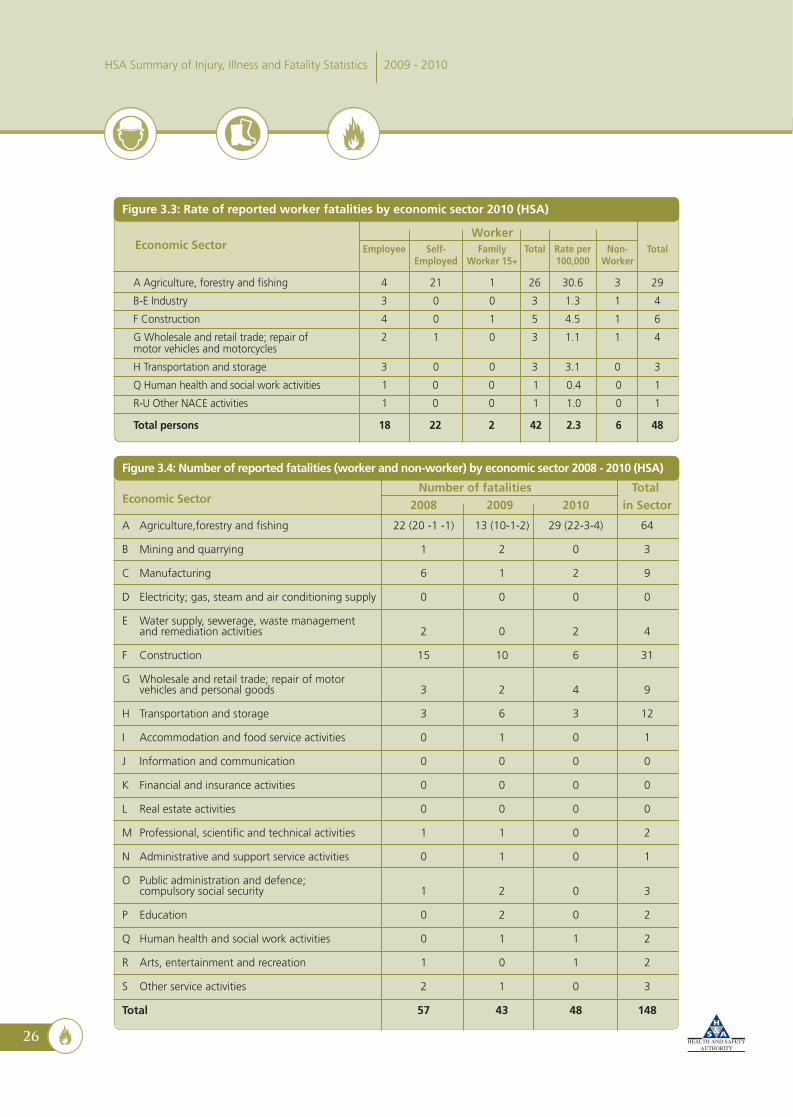
Figure 3.3: Rate of reported worker fatalities by economic sector 2010 (HSA)
WorkerEmployee Self- Family Total Rate per Non- Total
Employed Worker 15+ 100,000 Worker
A Agriculture, forestry and fishing 4 21 1 26 30.6 3 29
B-E Industry 3 0 0 3 1.3 1 4
F Construction 4 0 1 5 4.5 1 6
G Wholesale and retail trade; repair of 2 1 0 3 1.1 1 4motor vehicles and motorcycles
H Transportation and storage 3 0 0 3 3.1 0 3
Q Human health and social work activities 1 0 0 1 0.4 0 1
R-U Other NACE activities 1 0 0 1 1.0 0 1
Total persons 18 22 2 42 2.3 6 48
Figure 3.4: Number of reported fatalities (worker and non-worker) by economic sector 2008 - 2010 (HSA)
Number of fatalities Total2008 2009 2010 in Sector
A Agriculture,forestry and fishing 22 (20 -1 -1) 13 (10-1-2) 29 (22-3-4) 64
B Mining and quarrying 1 2 0 3
C Manufacturing 6 1 2 9
D Electricity; gas, steam and air conditioning supply 0 0 0 0
E Water supply, sewerage, waste managementand remediation activities 2 0 2 4
F Construction 15 10 6 31
G Wholesale and retail trade; repair of motorvehicles and personal goods 3 2 4 9
H Transportation and storage 3 6 3 12
I Accommodation and food service activities 0 1 0 1
J Information and communication 0 0 0 0
K Financial and insurance activities 0 0 0 0
L Real estate activities 0 0 0 0
M Professional, scientific and technical activities 1 1 0 2
N Administrative and support service activities 0 1 0 1
O Public administration and defence;compulsory social security 1 2 0 3
P Education 0 2 0 2
Q Human health and social work activities 0 1 1 2
R Arts, entertainment and recreation 1 0 1 2
S Other service activities 2 1 0 3
Total 57 43 48 148
Economic Sector
HSA Summary of Injury, Illness and Fatality Statistics 2009 - 2010
Economic Sector
HSA_Stats_Report inside_10:Layout 1 21/06/2011 10:15 Page 28
27
A national culture where all commit to safe and healthy workplaces and the safe and sustainable management of chemicals
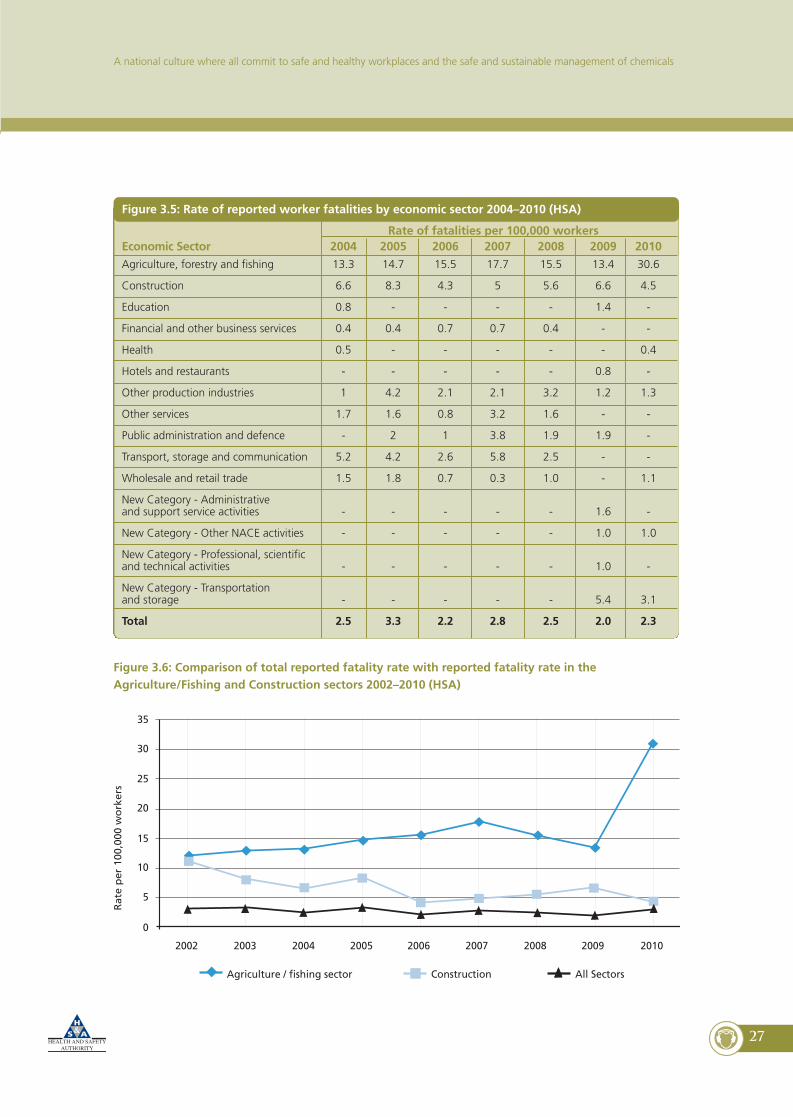
Figure 3.6: Comparison of total reported fatality rate with reported fatality rate in theAgriculture/Fishing and Construction sectors 2002–2010 (HSA)
Figure 3.5: Rate of reported worker fatalities by economic sector 2004–2010 (HSA)
Rate of fatalities per 100,000 workersEconomic Sector 2004 2005 2006 2007 2008 2009 2010Agriculture, forestry and fishing 13.3 14.7 15.5 17.7 15.5 13.4 30.6
Construction 6.6 8.3 4.3 5 5.6 6.6 4.5
Education 0.8 - - - - 1.4 -
Financial and other business services 0.4 0.4 0.7 0.7 0.4 - -
Health 0.5 - - - - - 0.4
Hotels and restaurants - - - - - 0.8 -
Other production industries 1 4.2 2.1 2.1 3.2 1.2 1.3
Other services 1.7 1.6 0.8 3.2 1.6 - -
Public administration and defence - 2 1 3.8 1.9 1.9 -
Transport, storage and communication 5.2 4.2 2.6 5.8 2.5 - -
Wholesale and retail trade 1.5 1.8 0.7 0.3 1.0 - 1.1
New Category - Administrativeand support service activities - - - - - 1.6 -
New Category - Other NACE activities - - - - - 1.0 1.0
New Category - Professional, scientificand technical activities - - - - - 1.0 -
New Category - Transportationand storage - - - - - 5.4 3.1
Total 2.5 3.3 2.2 2.8 2.5 2.0 2.3
Rat
ep
er10
0,00
0w
ork
ers
0
5
10
15
20
25
30
35
20102002 2003 2004 2005 2006 2007 2008 2009
Agriculture / fishing sector Construction All Sectors
HSA_Stats_Report inside_10:Layout 1 21/06/2011 10:15 Page 29

Figure 3.7: Percentage of reported fatal injuries by employment status 2010 (HSA)
HSA Summary of Injury, Illness and Fatality Statistics 2009 - 2010
28
Figure 3.8: Number of reported fatalities (worker and non-worker) by economic sector and ageband 2010 (HSA)
Age band A C E F G H Q R Total
0-17 3 - 1 1 1 - - - 6
18-24 2 - - - - 1 - 1 4
25-34 4 1 1 - - 1 - - 7
35-44 4 1 - - 1 1 1 - 8
45-54 - - - 1 1 1 - - 3
55-64 9 - - 4 - - - - 13
65+ 7 - - - - - - - 7
Total 29 2 2 6 3 4 1 1 48
Family worker4%
Employee38%
Non-worker12%
Self-employed46%
Economic sector
Sector keyA – Agriculture, forestry and fishing; C – Manufacturing; E– Water supply;sewerage,waste management andremediation activities; F – Construction; G – Wholesale/Retail trade, repair of vehicles, personal and householdgoods; H – Transportation and storage; Q – Human health and social work activities; R – Arts, entertainmentand recreation
HSA_Stats_Report inside_10:Layout 1 21/06/2011 10:15 Page 30
A national culture where all commit to safe and healthy workplaces and the safe and sustainable management of chemicals
29
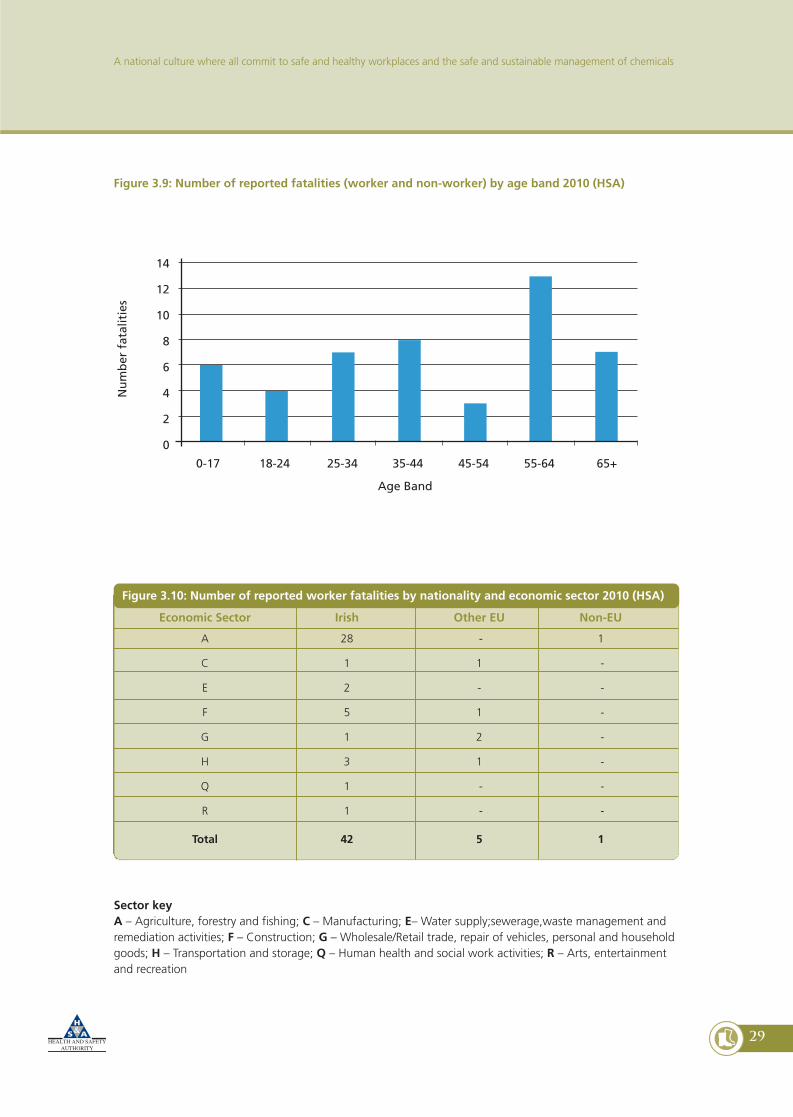
Figure 3.9: Number of reported fatalities (worker and non-worker) by age band 2010 (HSA)
Figure 3.10: Number of reported worker fatalities by nationality and economic sector 2010 (HSA)
Economic Sector Irish Other EU Non-EU
A 28 - 1
C 1 1 -
E 2 - -
F 5 1 -
G 1 2 -
H 3 1 -
Q 1 - -
R 1 - -
Total 42 5 1
0-17 18-24 25-34 35-44 45-54 55-64 65+
Age Band
Nu
mb
erfa
talit
ies
14
12
10
8
6
4
2
0
Sector keyA – Agriculture, forestry and fishing; C – Manufacturing; E– Water supply;sewerage,waste management andremediation activities; F – Construction; G – Wholesale/Retail trade, repair of vehicles, personal and householdgoods; H – Transportation and storage; Q – Human health and social work activities; R – Arts, entertainmentand recreation
HSA_Stats_Report inside_10:Layout 1 21/06/2011 10:15 Page 31
30
Figure 3.11: Percentage of reported worker fatalities by nationality 2010 (HSA)
HSA Summary of Injury, Illness and Fatality Statistics 2009 - 2010
Figure 3.12: Reported worker fatality rates by nationality 2005–2010 (HSA)
Fatality rates per 100,000 workers 2005 2006 2007 2008 2009 2010
Irish workers 3 2 2.8 2.5 2 2.3
Non-Irish national workers 5.6 3.2 2.4 2.2 2 2.3
All workers 3.3 2.1 2.8 2.5 2 2.3
Figure 3.13: Number of reported fatalities (worker and non-worker) by accident trigger 2010 (HSA)
NACE
Accident trigger A C E F G H Q R Total
Fall from height 3 2 - 3 - 1 - 1 10
Loss of control of object being worked on 3 - 1 - 1 - - - 5
Fall, collapse of material - from above 4 - - - - - - - 4
Other fall-related accident trigger 2 - - - - - 1 - 3
Loss of control of machine - - - 2 - - - - 2
Loss of control of means of transportor handling equipment 2 - - - - - - - 2
Other body movement 1 - - - - 1 - - 2
Other breakage/collapse related trigger 1 - - - 1 - - - 2
Other loss of control trigger - - - 1 - 1 - - 2
Electrical problem - direct contact 1 - - - - - - - 1
Explosion - - - - - 1 - - 1
Fall, collapse of material - from below 1 - - - - - - - 1
Fire, flare up 1 - - - - - - - 1
Loss of control of animal 1 - - - - - - - 1
Other triggers not listed 9 - 1 - 1 - - - 11
Total 29 2 2 6 3 4 1 1 48
Irish88%
Non-EU2%
Other EU10%
HSA_Stats_Report inside_10:Layout 1 21/06/2011 10:15 Page 32

31
A national culture where all commit to safe and healthy workplaces and the safe and sustainable management of chemicals
Figure 3.14: Number of reported fatalities (worker and non-worker) by county 2006-2010 (HSA)
Year
2006 2007 2008 2009 2010
Carlow - 1 1 - 1
Cavan 1 1 - 1 -
Clare 6 1 3 2 4
Cork 11 3 13 3 7
Derry - 1 - - -
Donegal 4 4 2 4 5
Dublin 5 9 5 8 2
Galway 1 2 4 - 2
Kerry 1 4 3 4 3
Kildare 1 2 1 - 2
Kilkenny 2 5 1 - 2
Laois 1 1 2 - 1
Leitrim - - 2 - 2
Limerick 2 4 4 - 1
Longford 2 - - 1 1
Louth - 5 - 4 2
Mayo 4 3 1 1 2
Meath - - 5 3 2
Monaghan - - - 3 1
Offaly 2 - 1 - 1
Roscommon 1 - - - 1
Sligo 1 2 1 - -
Tipperary - - 5 3 2
Waterford - 10 1 1 1
Westmeath 2 2 - 1 1
Wexford 3 5 2 2 1
Wicklow 1 2 - 2 1
Total 51 67 57 43 48
County
HSA_Stats_Report inside_10:Layout 1 21/06/2011 10:15 Page 33
32
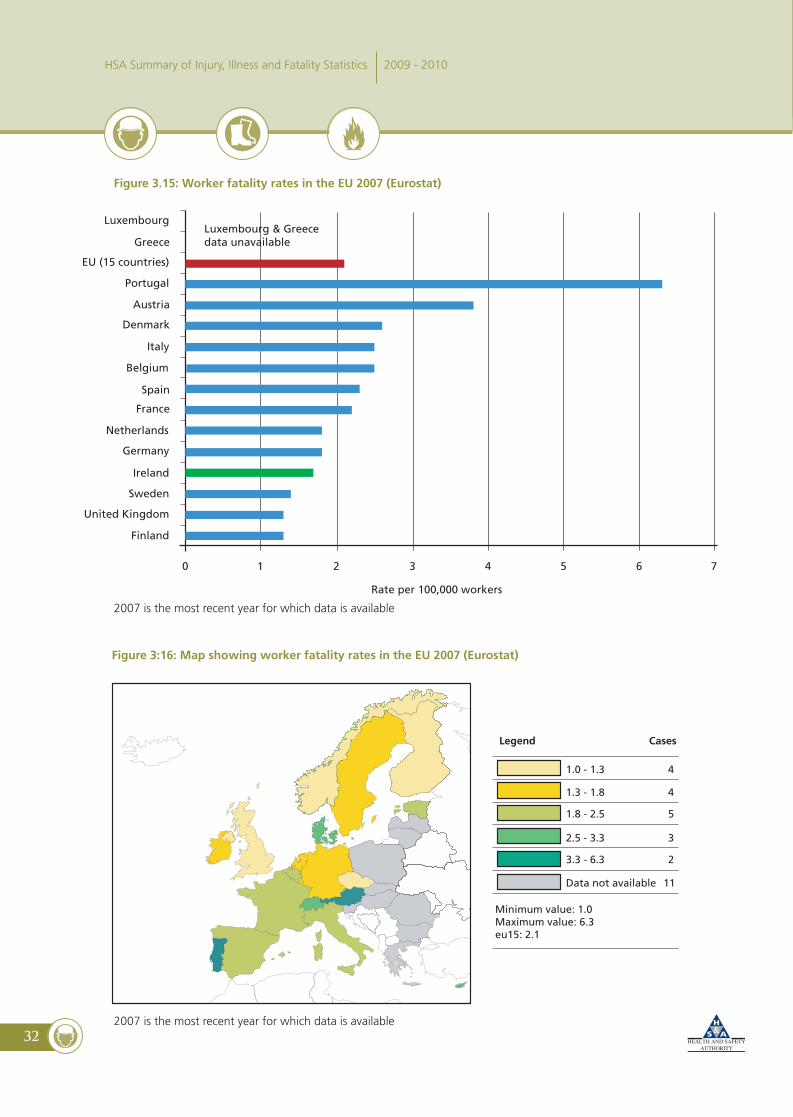
Figure 3.15: Worker fatality rates in the EU 2007 (Eurostat)
HSA Summary of Injury, Illness and Fatality Statistics 2009 - 2010
EU (15 countries)
Portugal
Austria
Greece
Spain
France
Italy
Denmark
Belgium
Ireland
Germany
Netherlands
LuxembourgLuxembourg & Greecedata unavailable
Rate per 100,000 workers
Sweden
Finland
United Kingdom
0 1 2 3 4 5 6 7
1.0 - 1.3
Legend Cases
1.3 - 1.8
1.8 - 2.5
2.5 - 3.3
3.3 - 6.3
Data not available
Minimum value: 1.0Maximum value: 6.3eu15: 2.1
4
4
5
3
2
11
Figure 3:16: Map showing worker fatality rates in the EU 2007 (Eurostat)
2007 is the most recent year for which data is available
2007 is the most recent year for which data is available
HSA_Stats_Report inside_10:Layout 1 21/06/2011 10:15 Page 34
33
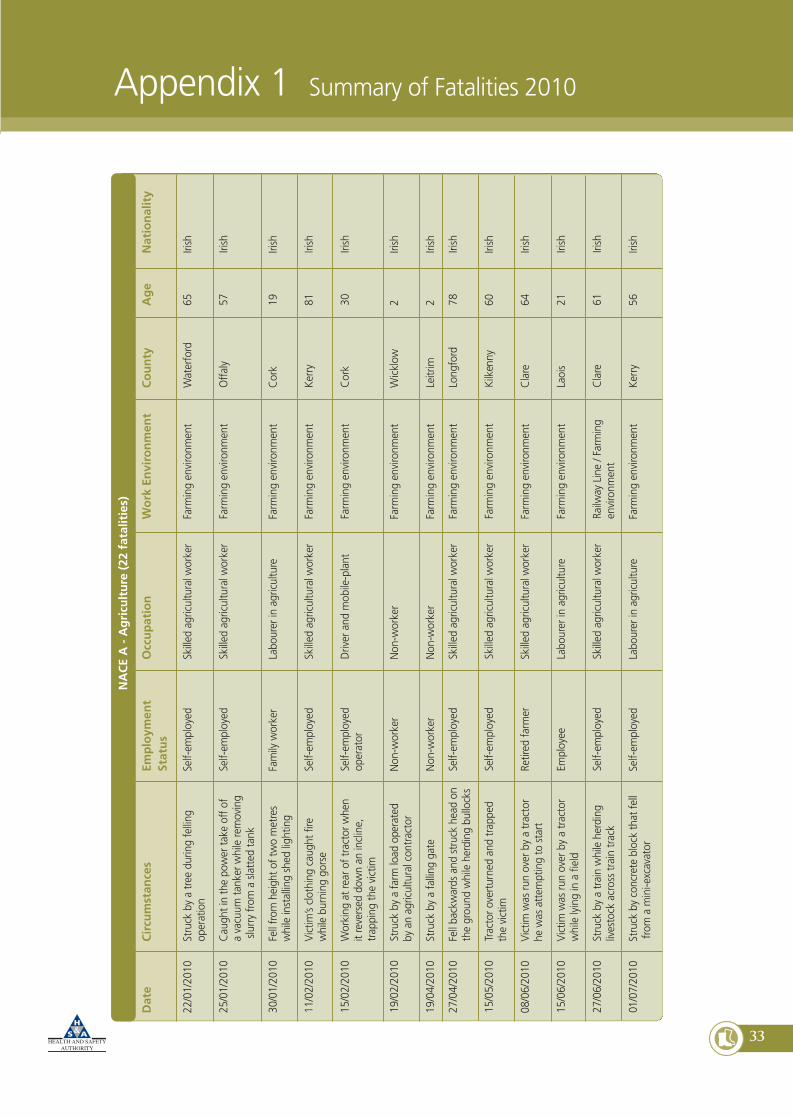
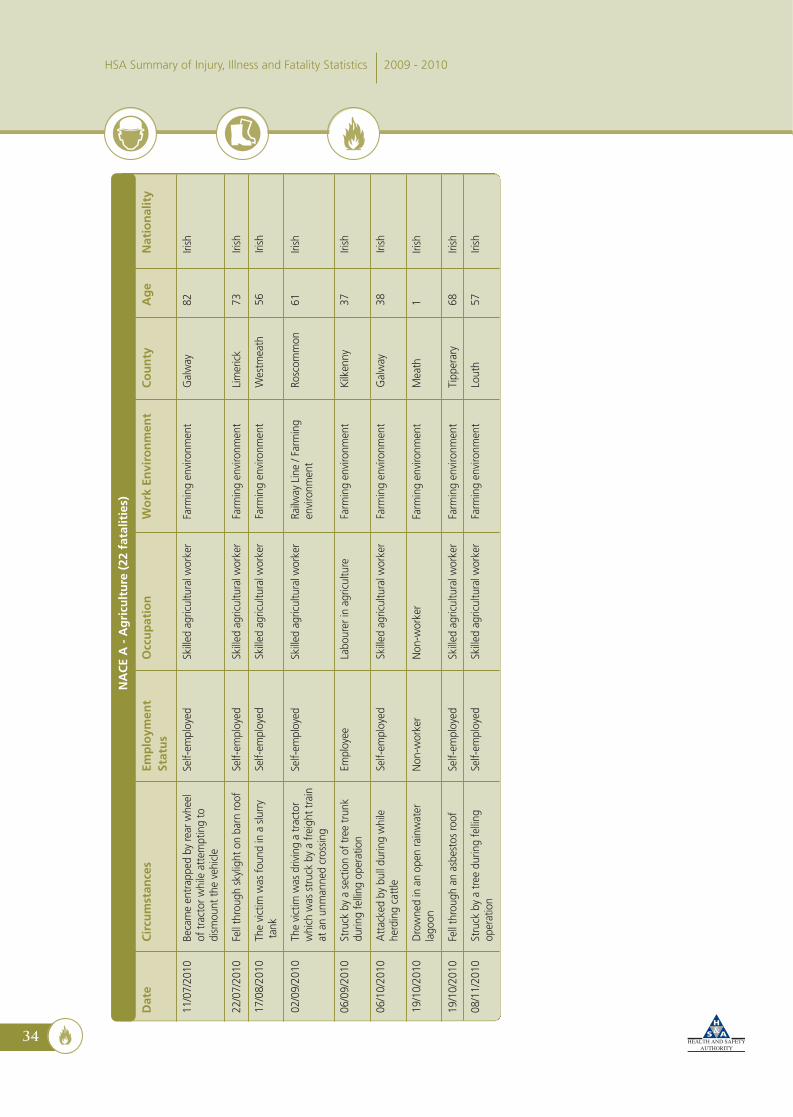
Appendix 1 Summary of Fatalities 2010N
AC
EA
-A
gri
cult
ure
(22
fata
litie
s)
Dat
eC
ircu
mst
ance
sEm
plo
ymen
tO
ccu
pat
ion
Wo
rkEn
viro
nm
ent
Co
un
tyA
ge
Nat
ion
alit
ySt
atu
s
22/01/2010
Struckbyatreeduringfelling
Self-employed
Skilledagriculturalworker
Farmingenvironm
ent
Waterford
65Irish
operation
25/01/2010
Caughtinthepowertakeoffof
Self-employed
Skilledagriculturalworker
Farmingenvironm
ent
Offaly
57Irish
avacuum
tankerwhileremoving
slurryfrom
aslattedtank
30/01/2010
Fellfrom
heightoftwometres
Familyworker
Labourerinagriculture
Farmingenvironm
ent
Cork
19Irish
whileinstallingshedlighting
11/02/2010
Victim
’sclothing
caughtfire
Self-employed
Skilledagriculturalworker
Farmingenvironm
ent
Kerry
81Irish
whileburninggorse
15/02/2010
Working
atrearoftractorw
hen
Self-employed
Driverandmobile-plant
Farmingenvironm
ent
Cork
30Irish
itreverseddownanincline,
operator
trapping
thevictim
19/02/2010
Struckbyafarm
loadoperated
Non-worker
Non-worker
Farmingenvironm
ent
Wicklow
2Irish
byanagriculturalcontractor
19/04/2010
Struckbyafalling
gate
Non-worker
Non-worker
Farmingenvironm
ent
Leitrim
2Irish
27/04/2010
Fellbackwardsandstruckheadon
Self-employed
Skilledagriculturalworker
Farmingenvironm
ent
Longford
78Irish
theground
whileherdingbullocks
15/05/2010
Tractoroverturnedandtrapped
Self-employed
Skilledagriculturalworker
Farmingenvironm
ent
Kilke nny
60Irish
thevictim
08/06/2010
Victim
wasrunoverbyatractor
Retiredfarmer
Skilledagriculturalworker
Farmingenvironm
ent
Clare
64Irish
hewasattemptingtostart
15/06/2010
Victim
wasrunoverbyatractor
Employee
Labourerinagriculture
Farmingenvironm
ent
Laois
21Irish
whilelyinginafield
27/06/2010
Struckbyatrainwhileherding
Self-employed
Skilledagriculturalworker
RailwayLine/Farming
Clare
61Irish
livestockacrosstraintrack
environm
ent
0 1/07/2010
Struckbyconcreteblockthatfell
Self-employed
Labourerinagriculture
Farmingenvironm
ent
Kerry
56Irish
from
amini-excavator
HSA_Stats_Report inside_10:Layout 1 21/06/2011 10:15 Page 35
34
HSA Summary of Injury, Illness and Fatality Statistics 2009 - 2010
NA
CE
A-
Ag
ricu
ltu
re(2
2fa
talit
ies)
Dat
eC
ircu
mst
ance
sEm
plo
ymen
tO
ccu
pat
ion
Wo
rkEn
viro
nm
ent
Co
un
tyA
ge
Nat
ion
alit
ySt
atu
s
11/07/2010
Becameentrappedbyrearwheel
Self-employed
Skilledagriculturalworker
Farmingenvironm
ent
Galway
82Irish
oftractorw
hileattemptingto
dismountthevehicle
22/07/2010
Fellthroughskylighton
barnroof
Self-employed
Skilledagriculturalworker
Farmingenvironm
ent
Limerick
73Irish
17/08/2010
Thevictimwasfoundinaslurry
Self-employed
Skilledagriculturalworker
Farmingenvironm
ent
Westmeath
56Irish
tank
02/09/2010
Thevictimwasdrivingatractor
Self-employed
Skilledagriculturalworker
RailwayLine/Farming
Roscom
mon
61Irish
whichwasstruckbyafreighttrain
environm
ent
atanunmannedcrossing
06/09/2010
Struckbyasectionoftreetrunk
Employee
Labourerinagriculture
Farmingenvironm
ent
Kilkenny
37Irish
duringfelling
operation
06/10/2010
Attackedbybullduringwhile
Self-employed
Skilledagriculturalworker
Farmingenvironm
ent
Galway
38Irish
herdingcattle
19/10/2010
Drownedinanopenrainwater
Non-worker
Non-worker
Farmingenvironm
ent
Meath
1Irish
lagoon
19/10/2010
Fellthroughanasbestosroof
Self-employed
Skilledagriculturalworker
Farmingenvironm
ent
Tipperary
68Irish
08/11/2010
Struckbyatreeduringfelling
Self-employed
Skilledagriculturalworker
Farmingenvironm
ent
Louth
57Irish
operation
HSA_Stats_Report inside_10:Layout 1 21/06/2011 10:15 Page 36

35
A national culture where all commit to safe and healthy workplaces and the safe and sustainable management of chemicals
NA
CE
A-
Fore
stry
(3fa
talit
ies)
Dat
eC
ircu
mst
ance
sEm
plo
ymen
tO
ccu
pat
ion
Wo
rkEn
viro
nm
ent
Co
un
tyA
ge
Nat
ion
alit
ySt
atu
s
04/02/2010
Struckbyatreeduringfelling
Self-employed
Skilledagriculturalworker
Forestryzone
Cork
40Irish
operation
19/05/2010
Chainsawmadecontactw
ithEmployee
Labourerinagriculture
Privatedomesticgarden
Clare
27Irish
overheadwirewhilevictimwas
working
upatree
04/08/2010
Struckbyatreeduringfelling
Self-employed
Skilledagriculturalworker
Privatehome
Donegal
58Irish
operation
NA
CE
A-
Fish
ing
(4fa
talit
ies)
Dat
eC
ircu
mst
ance
sEm
plo
ymen
tO
ccu
pat
ion
Wo
rkEn
viro
nm
ent
Co
un
tyA
ge
Nat
ion
alit
ySt
atu
s
13/02/2010
Thevictimfelloverboard
Employee
Fisherman
Seafishing
aboardvessel
Cork
33Egyptian
15/05/2010
Drownedwhen16
footfiberglass
Self-employed
Fisherman
On/overw
ater
Wexford
27Irish
puntsank
01/11/2010
Drownedwhenlobsterboatsank
Self-employed
Fisherman
On/overw
ater
Donegal
41Irish
01/11/2010
Drownedwhenlobsterboatsank
Self-employed
Fisherman
On/overw
ater
Donegal
65Irish
HSA_Stats_Report inside_10:Layout 1 21/06/2011 10:15 Page 37
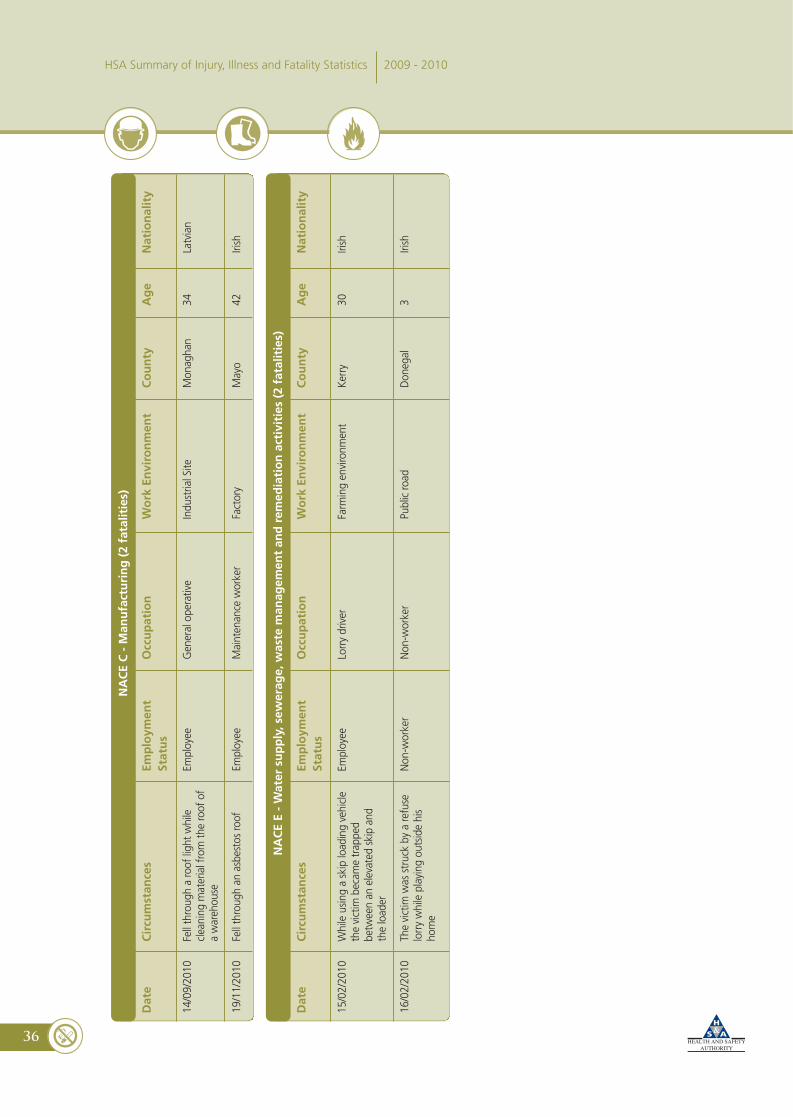
36
HSA Summary of Injury, Illness and Fatality Statistics 2009 - 2010
NA
CE
C-
Man
ufa
ctu
rin
g(2
fata
litie
s)
Dat
eC
ircu
mst
ance
sEm
plo
ymen
tO
ccu
pat
ion
Wo
rkEn
viro
nm
ent
Co
un
tyA
ge
Nat
ion
alit
ySt
atu
s
14/09/2010
Fellthrougharooflightwhile
Employee
Generaloperative
IndustrialSite
Monaghan
34Latvian
cleaning
materialfromtheroofof
awarehouse
19/11/2010
Fellthroughanasbestosroof
Employee
Maintenanceworker
Factory
Mayo
42Irish
NA
CE
E-
Wat
ersu
pp
ly,s
ewer
age,
was
tem
anag
emen
tan
dre
med
iati
on
acti
viti
es(2
fata
litie
s)
Dat
eC
ircu
mst
ance
sEm
plo
ymen
tO
ccu
pat
ion
Wo
rkEn
viro
nm
ent
Co
un
tyA
ge
Nat
ion
alit
ySt
atu
s
15/02/2010
Whileusingaskiploadingvehicle
Employee
Lorrydriver
Farmingenvironm
ent
Kerry
30Irish
thevictimbecametrapped
betweenanelevatedskipand
theloader
16/02/2010
Thevictimwasstruckbyarefuse
Non-worker
Non-worker
Publicroad
Donegal
3Irish
lorrywhileplayingoutsidehis
home
HSA_Stats_Report inside_10:Layout 1 21/06/2011 10:15 Page 38
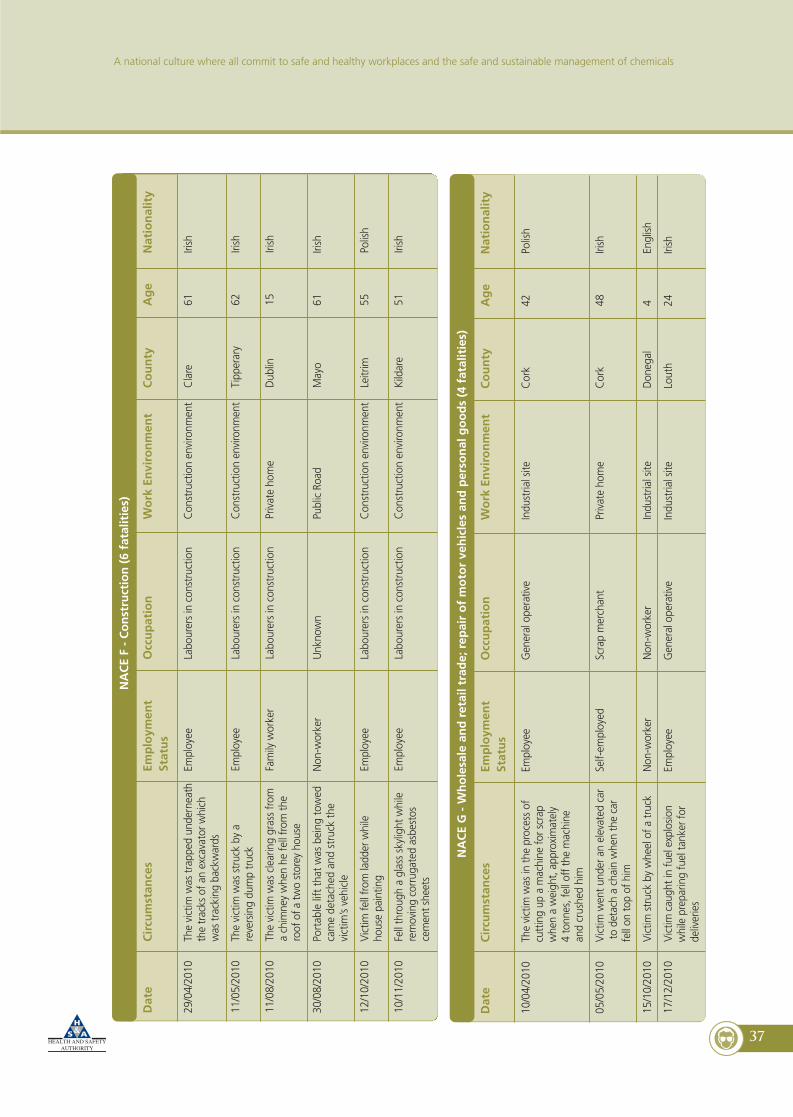
37
A national culture where all commit to safe and healthy workplaces and the safe and sustainable management of chemicals
NA
CE
F-
Co
nst
ruct
ion
(6fa
talit
ies)
Dat
eC
ircu
mst
ance
sEm
plo
ymen
tO
ccu
pat
ion
Wo
rkEn
viro
nm
ent
Co
un
tyA
ge
Nat
ion
alit
ySt
atu
s
29/04/2010
Thevictimwastrappedunderneath
Employee
Labourersinconstruction
Constructionenvironm
ent
Clare
61Irish
thetracksofanexcavatorw
hich
wastracking
backwards
11/05/2010
Thevictimwasstruckbya
Employee
Labourersinconstruction
Constructionenvironm
ent
Tipperary
62Irish
reversingdumptruck
11/08/2010
Thevictimwasclearinggrassfrom
Familyworker
Labourersinconstruction
Privatehome
Dublin
15Irish
achimneywhenhefellfrom
the
roofofatwostoreyhouse
30/08/2010
Portableliftthatwasbeingtowed
Non-worker
Unknown
PublicRoad
Mayo
61Irish
camedetachedandstruckthe
victim’svehicle
12/10/2010
Victim
fellfrom
ladderwhile
Employee
Labourersinconstruction
Constructionenvironm
ent
Leitrim
55Polish
housepainting
10/11/2010
Fellthroughaglassskylightwhile
Employee
Labourersinconstruction
Constructionenvironm
ent
Kildare
51Irish
removingcorrugatedasbestos
cementsheets
NA
CE
G-
Wh
ole
sale
and
reta
iltr
ade;
rep
air
of
mo
tor
veh
icle
san
dp
erso
nal
go
od
s(4
fata
litie
s)
Dat
eC
ircu
mst
ance
sEm
plo
ymen
tO
ccu
pat
ion
Wo
rkEn
viro
nm
ent
Co
un
tyA
ge
Nat
ion
alit
ySt
atu
s
10/04/2010
Thevictimwasintheprocessof
Employee
Generaloperative
Industrialsite
Cork
42Polish
cuttingup
amachineforscrap
whenaweight,approximately
4tonnes,felloffthemachine
andcrushedhim
05/05/2010
Victim
wentunderanelevatedcar
Self-employed
Scrapmerchant
Privatehome
Cork
48Irish
todetachachainwhenthecar
fellon
topofhim
15/10/2010
Victim
struckbywheelofatruck
Non-worker
Non-worker
Industrialsite
Donegal
4English
17/12/2010
Victim
caughtinfuelexplosion
Employee
Generaloperative
Industrialsite
Louth
24Irish
whilepreparingfueltankerfor
deliveries
HSA_Stats_Report inside_10:Layout 1 21/06/2011 10:15 Page 39
38
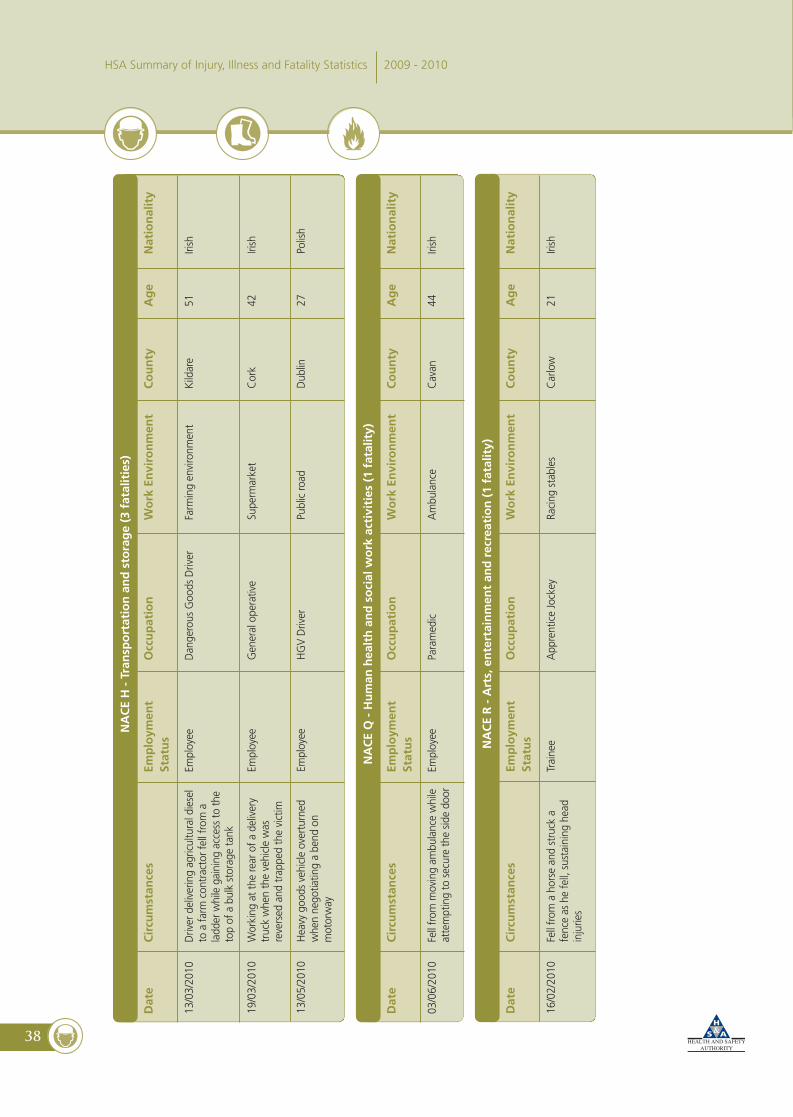
HSA Summary of Injury, Illness and Fatality Statistics 2009 - 2010
NA
CE
H-
Tran
spo
rtat
ion
and
sto
rag
e(3
fata
litie
s)
Dat
eC
ircu
mst
ance
sEm
plo
ymen
tO
ccu
pat
ion
Wo
rkEn
viro
nm
ent
Co
un
tyA
ge
Nat
ion
alit
ySt
atu
s
13/03/2010
Driverdeliveringagriculturaldiesel
Employee
DangerousGoodsDriver
Farmingenvironm
ent
Kildare
51Irish
toafarm
contractorfellfrom
aladderwhilegainingaccesstothe
topofabulkstoragetank
19/03/2010
Working
attherearofadelivery
Employee
Generaloperative
Supermarket
Cork
42Irish
truckwhenthevehiclewas
reversedandtrappedthevictim
13/05/2010
Heavygoodsvehicleoverturned
Employee
HGVDriver
Publicroad
Dublin
27Polish
whennegotiatingabend
onmotorway
NA
CE
Q-
Hu
man
hea
lth
and
soci
alw
ork
acti
viti
es(1
fata
lity)
Dat
eC
ircu
mst
ance
sEm
plo
ymen
tO
ccu
pat
ion
Wo
rkEn
viro
nm
ent
Co
un
tyA
ge
Nat
ion
alit
ySt
atu
s
03/06/2010
Fellfrom
movingambulancewhile
Employee
Paramedic
Ambulance
Cavan
44Irish
attemptingtosecurethesidedoor
NA
CE
R-
Art
s,en
tert
ain
men
tan
dre
crea
tio
n(1
fata
lity)
Dat
eC
ircu
mst
ance
sEm
plo
ymen
tO
ccu
pat
ion
Wo
rkEn
viro
nm
ent
Co
un
tyA
ge
Nat
ion
alit
ySt
atu
s
16/02/2010
Fellfrom
ahorseandstrucka
Trainee
ApprenticeJockey
Racing
stables
Carlow
21Irish
fenceashefell,sustaining
head
injuries
HSA_Stats_Report inside_10:Layout 1 21/06/2011 10:15 Page 40
39
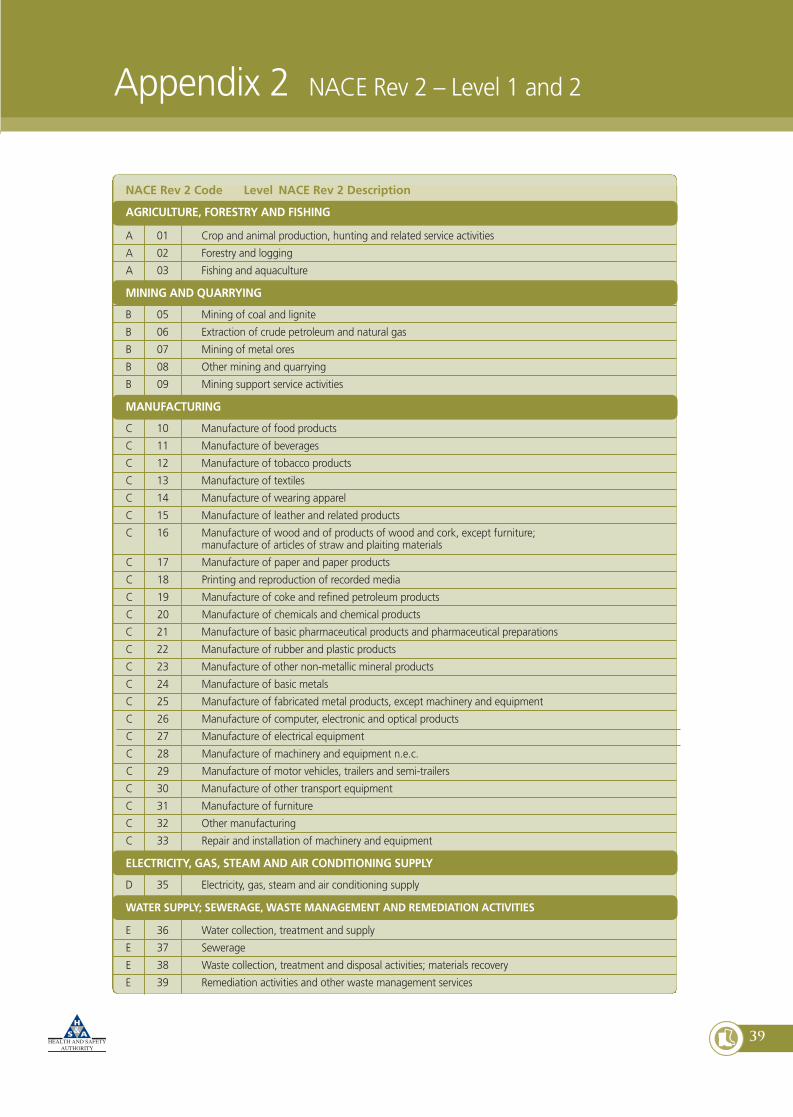
Appendix 2 NACE Rev 2 – Level 1 and 2
NACE Rev 2 Code Level NACE Rev 2 Description
AGRICULTURE, FORESTRY AND FISHING
A 01 Crop and animal production, hunting and related service activities
A 02 Forestry and logging
A 03 Fishing and aquaculture
MINING AND QUARRYING
B 05 Mining of coal and lignite
B 06 Extraction of crude petroleum and natural gas
B 07 Mining of metal ores
B 08 Other mining and quarrying
B 09 Mining support service activities
MANUFACTURING
C 10 Manufacture of food products
C 11 Manufacture of beverages
C 12 Manufacture of tobacco products
C 13 Manufacture of textiles
C 14 Manufacture of wearing apparel
C 15 Manufacture of leather and related products
C 16 Manufacture of wood and of products of wood and cork, except furniture;manufacture of articles of straw and plaiting materials
C 17 Manufacture of paper and paper products
C 18 Printing and reproduction of recorded media
C 19 Manufacture of coke and refined petroleum products
C 20 Manufacture of chemicals and chemical products
C 21 Manufacture of basic pharmaceutical products and pharmaceutical preparations
C 22 Manufacture of rubber and plastic products
C 23 Manufacture of other non-metallic mineral products
C 24 Manufacture of basic metals
C 25 Manufacture of fabricated metal products, except machinery and equipment
C 26 Manufacture of computer, electronic and optical products
C 27 Manufacture of electrical equipment
C 28 Manufacture of machinery and equipment n.e.c.
C 29 Manufacture of motor vehicles, trailers and semi-trailers
C 30 Manufacture of other transport equipment
C 31 Manufacture of furniture
C 32 Other manufacturing
C 33 Repair and installation of machinery and equipment
ELECTRICITY, GAS, STEAM AND AIR CONDITIONING SUPPLY
D 35 Electricity, gas, steam and air conditioning supply
WATER SUPPLY; SEWERAGE, WASTE MANAGEMENT AND REMEDIATION ACTIVITIES
E 36 Water collection, treatment and supply
E 37 Sewerage
E 38 Waste collection, treatment and disposal activities; materials recovery
E 39 Remediation activities and other waste management services
HSA_Stats_Report inside_10:Layout 1 21/06/2011 10:15 Page 41

40
HSA Summary of Injury, Illness and Fatality Statistics 2009 - 2010
NACE Rev 2 Code Level NACE Rev 2 Description
CONSTRUCTION
F 41 Construction of buildings
F 42 Civil engineering
F 43 Specialised construction activities
WHOLESALE AND RETAIL TRADE; REPAIR OF MOTOR VEHICLES AND MOTORCYCLES
G 45 Wholesale and retail trade and repair of motor vehicles and motorcycles
G 46 Wholesale trade, except of motor vehicles and motorcycles
G 47 Retail trade, except of motor vehicles and motorcycles
TRANSPORTATION AND STORAGE
H 49 Land transport and transport via pipelines
H 50 Water transport
H 51 Air transport
H 52 Warehousing and support activities for transportation
H 53 Postal and courier activities
ACCOMMODATION AND FOOD SERVICE ACTIVITIES
I 55 Accommodation
I 56 Food and beverage service activities
INFORMATION AND COMMUNICATION
J 58 Publishing activities
J 59 Motion picture, video and television programme production, sound recording and musicpublishing activities
J 60 Programming and broadcasting activities
J 61 Telecommunications
J 62 Computer programming, consultancy and related activities
J 63 Information service activities
FINANCIAL AND INSURANCE ACTIVITIES
K 64 Financial service activities, except insurance and pension funding
K 65 Insurance, reinsurance and pension funding, except compulsory social security
K 66 Activities auxiliary to financial services and insurance activities
REAL ESTATE ACTIVITIES
L 68 Real estate activities
PROFESSIONAL, SCIENTIFIC AND TECHNICAL ACTIVITIES
M 69 Legal and accounting activities
M 70 Activities of head offices; management consultancy activities
M 71 Architectural and engineering activities; technical testing and analysis
M 72 Scientific research and development
M 73 Advertising and market research
M 74 Other professional, scientific and technical activities
M 75 Veterinary activities
HSA_Stats_Report inside_10:Layout 1 21/06/2011 10:15 Page 42
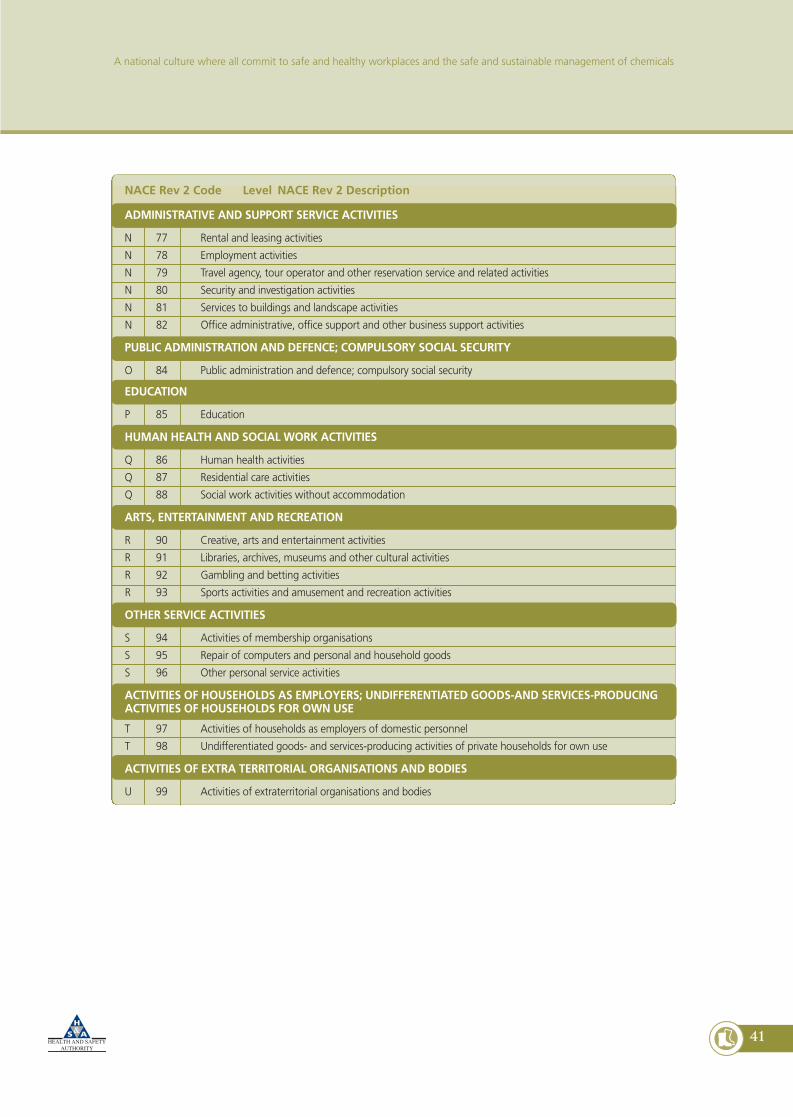
41
A national culture where all commit to safe and healthy workplaces and the safe and sustainable management of chemicals
NACE Rev 2 Code Level NACE Rev 2 Description
ADMINISTRATIVE AND SUPPORT SERVICE ACTIVITIES
N 77 Rental and leasing activities
N 78 Employment activities
N 79 Travel agency, tour operator and other reservation service and related activities
N 80 Security and investigation activities
N 81 Services to buildings and landscape activities
N 82 Office administrative, office support and other business support activities
PUBLIC ADMINISTRATION AND DEFENCE; COMPULSORY SOCIAL SECURITY
O 84 Public administration and defence; compulsory social security
EDUCATION
P 85 Education
HUMAN HEALTH AND SOCIAL WORK ACTIVITIES
Q 86 Human health activities
Q 87 Residential care activities
Q 88 Social work activities without accommodation
ARTS, ENTERTAINMENT AND RECREATION
R 90 Creative, arts and entertainment activities
R 91 Libraries, archives, museums and other cultural activities
R 92 Gambling and betting activities
R 93 Sports activities and amusement and recreation activities
OTHER SERVICE ACTIVITIES
S 94 Activities of membership organisations
S 95 Repair of computers and personal and household goods
S 96 Other personal service activities
ACTIVITIES OF HOUSEHOLDS AS EMPLOYERS; UNDIFFERENTIATED GOODS-AND SERVICES-PRODUCINGACTIVITIES OF HOUSEHOLDS FOR OWN USE
T 97 Activities of households as employers of domestic personnel
T 98 Undifferentiated goods- and services-producing activities of private households for own use
ACTIVITIES OF EXTRA TERRITORIAL ORGANISATIONS AND BODIES
U 99 Activities of extraterritorial organisations and bodies
HSA_Stats_Report inside_10:Layout 1 21/06/2011 10:15 Page 43
42
Central Statistics Office (2010), Statistical Release: Quarterly National Household Survey, Q4 2010
Health and Safety Authority (2009), Summary of Injury, Illness and Fatality Statistics 2008–2009
Central Statistics Office NaceCoder:
http://www.cso.ie/px/u/NACECoder/NACEItems/searchnace.asp
References
HSA_Stats_Report inside_10:Layout 1 21/06/2011 10:15 Page 44

HSA_Stats_Report inside_10:Layout 1 21/06/2011 10:15 Page 45

ISBN No: 978-1-84496-152-8 HSA0370
HSA_Stats_Report inside_10:Layout 1 21/06/2011 10:15 Page 46