SUMMARY OF SAFETY AND EFFECTIVENESS ... OF SAFETY AND EFFECTIVENESS INDICATIONS FOR USE The VERSANl@...
41
SUMMARY OF SAFETY AND EFFECTIVENESS INDICATIONS FOR USE The VERSANl@ HIV-1 RNA 3.0 Assay (bDNA) is an in Vitro Signal amplification nucleic acid probe assay for the direct quantitation of human immunodeficiency virus type 1 (HIV-l) RNA in plasma of HIV-1 infected individuals using the Bayer@ System 340 bDNA Analyzer. The test can quantitate HIV-1 RNA over the range of 75 - 500,OpO HIV-1 RNA copies/ml. Plasma samples containing Group M Subtypes A - G have been validated for use in the assay. This test is-intended for use in conjunction with clinical presentation and other laboratory markers of disease status as an aid in management of individuals infected with HIV-l. HIV-1 RNA results from the assay can be used to assess prognosis of disease progression and to monitor the effects of antiretroviral therapy by measuring changes in HIV-1 RNA levels during the course of therapy, Monitoring the effects of antiretroviral therapy by serial measurements of plasma HIV-1 .RNA has been validated for patients with viral loads 2 25,000 copies/mL. The VERSANT HIV-1 RNA 3.0 Assay (bDNA) is not intended for use as a screening assay for HIV infection or as a diagnostic test to confirm the diagnosis of HIV infection DEVICE DESCRIPTION The VERSANT HIV-l RNA 3.0 Assay (bDNA) is a sandwich nucleic acid hybridization procedure for the direct quantitation of HIV-1 RNA in human plasma. Test Priniciples HIV-1 is first concentrated from plasma by centrifugation. After HIV-1 genomic RNA is released from the virions, the RNA is captured to a microwell by a set of -- Page 1 of 41
Transcript of SUMMARY OF SAFETY AND EFFECTIVENESS ... OF SAFETY AND EFFECTIVENESS INDICATIONS FOR USE The VERSANl@...

SUMMARY OF SAFETY AND EFFECTIVENESS
INDICATIONS FOR USE
The VERSANl@ HIV-1 RNA 3.0 Assay (bDNA) is an in Vitro Signal amplification
nucleic acid probe assay for the direct quantitation of human immunodeficiency
virus type 1 (HIV-l) RNA in plasma of HIV-1 infected individuals using the Bayer@
System 340 bDNA Analyzer. The test can quantitate HIV-1 RNA over the range
of 75 - 500,OpO HIV-1 RNA copies/ml. Plasma samples containing Group M
Subtypes A - G have been validated for use in the assay.
This test is-intended for use in conjunction with clinical presentation and other
laboratory markers of disease status as an aid in management of individuals
infected with HIV-l. HIV-1 RNA results from the assay can be used to assess
prognosis of disease progression and to monitor the effects of antiretroviral
therapy by measuring changes in HIV-1 RNA levels during the course of therapy,
Monitoring the effects of antiretroviral therapy by serial measurements of plasma
HIV-1 .RNA has been validated for patients with viral loads 2 25,000 copies/mL.
The VERSANT HIV-1 RNA 3.0 Assay (bDNA) is not intended for use as a
screening assay for HIV infection or as a diagnostic test to confirm the diagnosis
of HIV infection
DEVICE DESCRIPTION
The VERSANT HIV-l RNA 3.0 Assay (bDNA) is a sandwich nucleic acid
hybridization procedure for the direct quantitation of HIV-1 RNA in human
plasma.
Test Priniciples
HIV-1 is first concentrated from plasma by centrifugation. After HIV-1 genomic
RNA is released from the virions, the RNA is captured to a microwell by a set of
-- Page 1 of 41

specific, synthetic oligonucleotide capture probes. A set of target probes
hybridizes to both the viral RNA and the pre-amplifier probes. The capture
probes, comprising 17 individual capture extenders, and the target probes,
comprised of 81 individual target extenders, bind to different regions of the pol
gene of the viral RNA. The amplifier probe hybridizes to the pre-amplifier forming
a branched DNA (bDNA) complex. Multiple copies of an alkaline phosphatase
crwmvumrnescent signal
SuhtMtt J
(AP) labeled probe are then hybridized to this immobilized complex.
Figure 1 Scheme of assay design.
Detection is achieved by incubating the complex with a chemiluminescent
substrate. Light emission is directly related to the amount of HIV-1 RNA present
in each sample, and results are recorded as relative light units (RLUs) by the
analyzer. A standard curve is defined by light emission from standards
containing known concentrations of beta propiolactone (BPL)-treated virus.
Concentrations of HIV-l RNA in specimens are determined from this standard
curve.
Kit Configuration and Components
Assay Kit Components
The VERSANT HIV-1 RNA 3.0 Assay (bDNA) reagents are supplied in a 2 box
kit. Box 1 contains Bead Suspension, Lysis Diluent and Reagent, Capture and
Target Probes, Wash Buffers, Capture Wells, Barrier Film, Pre-Amplifier/Amplifier .- PageZof41

and Label Diluent, Dextran Sulfate, Pm-Amplifier and Amplifier Probes and
Chemiluminescent Substrate and Substrate Enhancer. Box 2 contains Label
Probe, High Positive, Low Positive and Negative Controls, as well as Standards
A through F and Product Insert Supplement. Component lot numbers are
matched to the stated kit lot and cannot be mixed. The Product Insert
Supplement contains important information, including kit and component lot
numbers, kii expiration date, a list of lot-specific concentrations (copies/mL) of
Standards A through F, as well as the lot-specific mean concentrations of the
Positive Controls and their acceptable ranges.
lnstrumenj and Software
The VERSANT bDNA assay reagents are designed to be used with the Bayer
System 340 Analyzer and DMS software.
The analyzer can simultaneously process two 96-well plates and automates the
following functions:
seals the wells during incubation to minimize evaporation
heats the wells to a precisely controlled temperature
cools the wells after each incubation in preparation for the wash
washes unbound material from’ the wells
quantitation of the luminescence readings
exports the luminescence data and the corresponding events, errors, and
warnings form the event log to the DMS
-.
The Bayer Data Management Software (DMS) is designed to collect and analyze
luminescence data from the Bayer System 340 bDNA Analyzer and performs the
following tasks: .
l prints a plate map of the standards, controls, and sample IDS
l collects luminescence data
; - Page 3 of 41
.- - I I

:
l generates a standard curve
l calculates results for controls and samples based upon the standard curve
l calculates quality control parameters such as the standard curve fit and the
coefficient of variation (CV) of replicate values
l evaluates control results against a programmed range
l prints a report of the results and the result event log
l creates a text file from the results and event log that can be exported for use
in other software programs.
Quality Cc&al
The VERSANT HIV-1 RNA 3.0 Assay (bDNA) contains Standards A through F
and three controls, the High Positive Control, the Low Positive Control and the
Negative Control. An assay is considered valid if the following conditions occur:
l The values determined for the HIV-1 -positive controls are within the specified
range defined in the Product Insert Supplement.
l The relative light units (RLUs) for the standards are
geomean RLU Std A > RLU Std B > RLU Std C > RLU Std D > geomean RLU
Std E > geomean RLU Std F
l The HIV-1 Negative Control reads below its acceptable value as pre-
programmed into the DMS.
Manufacturing
The kits, instruments and software are manufactured in compliance with Current
Good Manufacturing Practices. In-process quality control of assay reagents,
instruments and software are performed to ensure that each kit lot and
instruments meets acceptable criteria to.support performance claims set out in
the Product Insert and Product Insert Supplement.
_ - Page 4 of 41
- I

ALTERNATiVE PRACTICES AND PROCEDUkES
Currently, there are several direct and indirect methods for the detection and
quantitation of human immunodeficiency virus type I (HIV-l) in human
specimens. These methods provide some means of measuring the progression
of HIV disease and for monitoring a patient’s response to therapy. The methods
include: nucleic acid technologies for direct detection and quantitation of
circulating viral particles; laboratory testis for CD4+ T-cell counts, which may
provide an indirect assessment of the patient’s immune system status;
quantitation of HIV p24 antigen and electron microscopic procedures for the
quantitation of circulating viral particles.
MARKETING HISTORY
The VERSANT HIV-1 RNA 3.0 Assay and System 340 instrument and DMS
software is currently approved in several countries, including France, Canada,
Australia, Spain, and Brazil. The product has not been withdrawn from the
market in any country.
POTENTIAL ADVERSE EFFECTS OF THE DEVICE ON HEALTH
HIV-1 infected patients should not experience adverse effects when the
VERSANT HIV-1 RNA 3.0 Assay (bDNA) is used according to its directions for
use and when used as an aid in the management of individuals infected with
HIV-l, The test is not indicated for use in patients who have not been diagnosed
with HIV-1 infection.
As an aid in the medical management of individuals infected with HIV-l, the
device is intended to provide the clinician with viral load information for use in
addition to other available patient medical information and laboratory test results.
In the event of an overestimation of HIV-1 RNA, there is a possibility that a
patient could have antiretroviral therapy initiated or changed when such an action *- Page 5 of 41

. .
was not needed. In the event of an underestimation of’HIV-1 RNA, the physician
could delay the initiation or change in antiretroviral therapy drug regimen when it
could have been helpful to the patient.
Based on an evaluation of the product’s performance in clinical and nonclinical
studies, reviewers believe that the probable benefit to the patient from use of the
product outweighs the probable risk of-injury or illness to the patient from its
use.
SUMMARY OF THE PERFORMANCE CHARACTERISTICS
This section summarizes the nonclinical and clinical studies performed using the
VERSANT HIV-1 RNA 3.0 Assay (bDNA) and System 340 instrument and DMS
software. Section 0 describes the results of nonclinical laboratory studies,
including studies performed to characterize the synthetic DNA used in the Assay
and studies conducted to determine the performance characteristics of the
Assay. Section 4.6.2 summarizes the results from well-controlled clinical studies
performed to support the safety and effectiveness of the VERSANT HIV-1 RNA
3.0 Assay (bDNA).
Nonclinical Laboratory Studies
DNA Characterization
Characterization studies were performed on certain DNA-containing assay
materials. Analytical test methods that demonstrated the quality (e.g., identity
and purity) of the’ DNA components were developed and validated. The
characterization studies indicated that the validated DNA synthesis and
purification process results in the production of DNA oligonucleotides with the
_ - Page 6 of 41

7.
correct sequence, including the correct order of all bases and the correct
representation of bases at the degenerate base positions.
Assav Standardization
The VERSANT HIV-1 RNA 3.0 Assay (bDNA) is anchored to a Reference \ Standard (, ), which is evaluated by * - independent, validated
analytical methods (# _ _ “-Ia The quantity of RNA in the transcript is determined from its
--- The,- assay utilizes dilutions of the United States National
Institute of Standards and Technology (NIST) - standard reference
material and is, therefore, directly traceable to the US NIST.
.A kit lots were used to determine the conversion factor between the
VERSANT HIV-1 RNA 3.0 Assay copies/ml and International Units (IU).
Dilutions of the WHO International Standard for Human lmmunodeficiency
Virus-l (HIV-l) RNA (NIBSC code 97/656) were tested in this evaluation. The
conversion factor was consistent between lots, with a mean VERSANT HIV-1
RNA copies/ml to IU factor of 0.306.
The stability of the VERSANT HIV-1 RNA 3.0 Assay (bDNA) was assessed on
manufactured kit lots. Evaluations of stability included testing the kits periodically
through for all - lot& Assay results were compared to established
specification ranges to evaluate potential assay deterioration. Results of these
real time stability studies indicate that the VERSANT HIV-l RNA 3.0 Assay
(bDNA) is stable for at least 12 months when it is stored at its labeled storage
conditions of 2” to 8” C (Box 1) and -60” to -80” C (Box 2). Stability of the kit lots
is monitored every - kit not to exceed - kits per year to verify performance
claims.
Page 7 of 41
_- I I

Assay Performance Characteristics: Reproducibilh. Linearitv, Limit of Detection and Limit of Quantitation
The performance characteristics of the VERSANT HIV-1 RNA 3.0 Assay (bDNA)
were assessed using a - member HIV-1 positive EDTA plasma panel and a
-member HIV-1 positive ACD plasma panel. The panels were created by
The 1 member EDTA panel ranged from
620,282 to 62 HIV-1 RNA copies/ml. The - ACD panel members had HIV-1
RNA at levels of 5,640 and 94 HIV-1 RNA copies/mL. Two operators at each of
3 external trial sites performed the testing, with each operator performing 4 assay
runs with each of the --clinical reagent lots. The results were used to establish
reproducibility, linearity, limit of detection and limit of quantitation.
Reproducibility I Table 1 shows, for each panel member, the percent CV for the overall between-
run, within-run and total variation, where “overall between run” incorporates lot,
site and operator components.
-.
_- Page 8 of 41
- I

Table 1 - Coefficient of Variation (%CV) fck Overall Betweenkun, Within-Run and Total Variation
I I d 2. 1216) 62,028 1 21.6% 1 12.9% 25.3%
3 216 6,203 10.7% 13.6% 23.2%
4 215 620 19.4% 15.5% 25.0%
5 216 124 18.8% 18.7% 26.7%
-6 216 93 18.7% 23.1% 30.0%
7 215 62* 19.8% 25.2% 32.4%
3A 214 5,640 _ 23.5% 16.0% 28.7%
5A 214 94 30.1% 24.2% 39.3% 1
*Below the limit of quantitation of the assay.
The total percent coefficient of variation (%CV) was less than 29% over most of
the range (124 to 620,282 HIV-1 RNA copies/ml). For the panel members
below 100 HIV-1 RNA copies/mL, the total %CV was less than 40%.
Linearity
The assay was linear across the reportable range, with the maximum deviation
from linearity less than 0.05 logjo. The linearity of the assay was confirmed using
serially diluted individual patient specimens collected into either EDTA or ACD
anticoagulants.
Limit of Detection (LoD) and Limit of Quantitation (LoQ)
Table 2 shows the percent of each panel member’s determinations that was
detected (i.e., quantitated) with respect to the reporting threshold of 35 HIV-1
RNA copies/ml. The reporting threshold (RT) is chosen so that 95% of negative Page 9 of 41

specimens read below this number. The table indicates that the LOO, at which
detection is required to be at least 95%, fell between 62 and 93 HIV-1 RNA
copies/mL.
Table 2 Percent Detection for each Panel Member
5 124 - 100
6 93 98
7 62 83
The estimated LoD was 68 HIV-1 RNA copies/ml with the upper one-sided 95%
confidence limit of 73 HIV-1 RNA copies/mL. Because the reproducibility of
quantitation was acceptable in this range ( a total imprecision of less than 40%
CV -corresponding to less than 0.17 log1 0 sd) the upper one-sided 95%
confidence limit for the LoD was rounded up to the nearest 5 HIV-1 RNA
copies/ml to obtain the LoQ of 75 HIV-1 RNA copies/ml. .- .
Potentially Interfering Substances and Conditions
The following endogenous and exogenous substances and conditions were
studied in HIV-l positive and HIV-negative specimens to determine if any had an
effect on assay specificity or HIV-1 quantitation. The various substances or
conditions were evaluated by adding these substances to HIV negative EDTA
o- Page 10 of 41

plasma specimens (N=25) and to specimens spiked with a low concentration of
BPL-treated HIV-1 viral stock solution (N=25).
Potentially Interfering Exogenous Substances
The drugs were pooled as shown in Table 3 and tested to final concentrations of
five times the reported peak serum or plasma concentrations in the therapeutic
range. Pathogens were also pooled. Each pathogen was diluted to a final
concentration of lo3 CFU/mL or PFU/mL unless otherwise noted. If a drug or
pathogen pool gave statistically different results than the control pool, the
individual drugs or pathogens in that pool were tested at the final concentrations
stated above. The drugs and pathogens listed in Table 3 were found to have no
effect on the VERSANTTM HIV-1 RNA 3.0 Assay (bDNA) at the target
concentrations.
Table 3 summarizes the substances and conditions tested and the effect on
assay performance.
Table 3 Effect of Potentially Interfering Exogenous Substances or conditions on Quantitation of HIV-1
trimethoprim/sulfamethoxazole,
influenzae, C. albicans
Streptococcus group 6
Page 11 of 41

-.
ritonavir, saquinavir, cidofovir,
ciprofloxacin, delavirdine
S. pneumoniae, M. avium, C.
neofomrans
using Bayer bDNA assays and were tested at final concentrations of approximately 6 x lo’, 1 .O x lo!, and 1 .O x lOa copies/ml, respectively.
i
Potentially Interfering Endogenous Substances
Specimens with levels of triglycerides up to 2000 mg/dL, bilirubin up to 20mgIdL
or hemoglobin up to 200 mg/dL showed no clinically significant interference with
the HIV-1 RNA quantitation by this assay. HIV-1 positive specimens with
bilirubin concentrations of 20 mg/dL shdwed 28% lower quantitation or a
difference of 0.14 logs when compared to the reference. HIV-1 positive
specimens with 2000 mg/dL of triglycerides showed 32% lower quantitation or a
difference of 0.17 logs when compared to the reference. HIV-1 positive
specimens with 200 mg/dL of hemoglobin showed 9% lower quantitation or a
difference of 0.04 logs when compared to the reference. These differences in
quantitation are well within the noise level of the assay, The official guidelines
from the DHHS’ state that “A minimally significant change in plasma viremia is
considered to be a 3-fold or 0.5 loglo increase or decrease.” Changes in viral
load of less than 0.5 log should be ignored as assay noise given the inherent
variability of the assay plus biologic variation. Therefore the change in
quantitation based on these interfering substances is of such small magnitude
that is not deemed clinically relevant.
Multiple Freeze-Thaw Cycles
The effect of 1,2 and 3 freeze-thaw cycles was tested in 25 HIV negative EDTA
plasma specimens and 25 specimens spiked with a low concentration of BPL-
Page 12 of 41

treated HIV-1 viral stock solution (N = 25). EDTA plasrfia samples were also
collected from 25 HIV-1 infected individuals, aliquoted, and tested after 1, 2 and
3 freeze thaw cycles. There was no effect of up to 3 freeze-thaw cycles on HIV-
negative or HIV-1 positive (real or spiked) specimens.
SDecimen Collection end Handling --
Studies were performed to establish the types of collection tubes that can be
used with the VERSANT HIV-1 RNA 3.0 Assay (bDNA) and to determine the
handling andstorage conditions that can be used with each tube type.
Glass K3 EDTA VacutainerTM tubes, plastic KP EDTA Vacutainer tubes,
K2 Plasma Preparation tubes (PPT), and ACD Solution A Vacutainer tubes were
evaluated, All of the EDTA types provided statistically equivalent HIV-1
quantitations. Matched ACD-A and & EDTA tubes were drawn from 126
HIV-negative individuals. There was no difference in RLUs between theses tube
types. Within the HIV-1 positive group of 99 subjects, the ACD-A readings were,
on the average, 15% lower (0.07 logjo) than the readings using the K3 EDTA
tubes. This difference was consistent across the reportable range of the assay.
Because the volume of the acid-citrate-dextrose solution creates a 17.6% dilution
of the total blood volume, this decrease in signal was expected. Both EDTA and
ACD anticoagulants can be used in the VERSANT HIV-1 RNA 3.0 Assay
(bDNA).
HIV-1 positive plasma collected in K3 EDTA and ACD Solution A tubes was either
frozen immediately after centrifugation or held at 2 to 8°C for either 8, 24, or 48
hours, then frozen at -60 to -80°C. HIV-1 quantitations at all time points were
’ Department of Health and Human Services (DHHS) and the Henry J. Kaiser Family Foundation. Guidelines for the Use of Antiretroviral Agents in HIV-Infected Adults and Adolescents, Feb 4, 2002.
Page 13of41

statistically equivalent to those of the plasma specimens that were immediately
frozen.
Plasma collected in KS EDTA PPT was either frozen immediately at -60” to
-80” C (reference procedure) after centrifugation, held at room temperature for 24
hours, then frozen, or held at 2 to 8°C for 24 hours, then frozen. Storage at room
temperature for 24 hours had no effect on HIV-1 quantitation. However, storage
at 2-8°C resulted in a lower quantitation than the reference condition. _-
Table 4sumkarizes the results of the specimen collection and handling studies.
Page 14 of 41

Table 4 Summary Of Anticoagulant And Specimen Handling Studies
K2 EDTA PPT
5 2 hours Plasma- left on Room 24 hours after separator gel temperature collection
HIV Subtvoes
The following numbers of distinct isolates were used to evaluate assay
perfomrance with the HIV-1 Group M subtypes: Subtype A - 10; Subtype B - 12;
Subtype C - 10; Subtype D - 10; Subtype E - 12; Subtype F - 7; and
Subtype G - 7.
-. Two studies were performed that compared the quantitations obtained using the
VERSANT HIV-1 RNA 3.0 Assay (bDNA) to concentrations obtained by
independent methods. In the first study, transcripts were prepared from - HIV-1
Group M subtypes (A through G), from 2 isolates in Group 0 (01 and 02), and
from an HIV-2 isolate, using cloned pal gene sequences inserted into a
transcription vector (T7). The transcripts were purified and analyzed using
agarose gel electrophoresis. The concentration of each transcript was
detemined using phosphate analysis, and confirmed using hyperchromicity and
Page 15 of 41

OD2s0. Each Group M transcript was diluted to target concentrations of 3,000
and 300,000 HIV-1 RNA copies/ml. The two Group 0 transcripts and the HIV-2
transcripts were tested at a concentration of approximately 250,000 copies/mL.
The second study evaluated specimens derived from several different culture
isolates from each of HIV-1 Group M Subtypes A-G. These isolates had
concentrations assigned using viral partjcle counts by electron microscopy and
were diluted to 25,000 EM particles/mL. Additionally, 23 of these isolates were
serially diluted to 4 or 6 concentrations and tested.
Table 5 shows the efficiency of quantitation for Subtypes A, C-G, compared to
Subtype B, using these two sets of data:
Table 5 Relative EffiCi8ncy of Quanktion Estimates for Each Subtype
D 83.0% 35.3% 73.6% 45.3% ~>.,~+:‘,‘ ‘j,.’ ‘:’ +‘x .,. ) ” 55.9% ,, .,1’
E 57.8% 30.3% 46.8% 40.0% 46.4% 53.1% 51.8% 59.0% 65.4% 48.9%
F 46.8% 47.6% 71.8% 68.4% Yj,‘: :’ :“‘ ’ ” :, 57.5% /*,
G 33.3% ~1 36.5% :‘ . 34.9% II I I I
-.
The results show that Subtypes A, C-G had VERSANT HIV-1 RNA 3.0 Assay
(bDNA) quantitations that were within 3;fo!d of Subtype B.
Page 16 of 41
While there was some detection of the Group 0 trans&pts, the mean assay
results of both were less than 2% of the input concentrations. The HIV-2
transcript was not detected at the concentration tested.
Additional studies were performed to determine if reproducibility and linearity was
equivalent for the Group M Subtypes A-G. Analyses for reproducibility were
performed using specimens at four lev_els-high (> 50,000 copies/ml), medium-
low (2000-5000 copies/mL), low (200 copies/ml), and very low (100 copies/ml).
The number of specimens per subtype varied from 36 to 90. Statistical tests for
homogeneitji of variance across subtypes at each &el were not statistically
significant,indicating that there is no evidence for differences in assay
reproducibility due to subtype.
Analyses for linearii were performed at five ranges in different experiments-
300,000 to 3,000; 50,000 to 2,000; 5,000 to 200; 2,000 to 200; and 200 to 100.
There were no statistically significant differences seen across any of the five
ranges studied. Thus, there was no evidence that the assay is non-linear for
non-6 subtypes.
The VERSANT HIV-1 RNA 3.0 Assay (bDNA) has been validated for use with
HIV-1 Group M Subtypes A-G.
.- .
I
_ . Page 17 of 41

-
Clinical Studies
Testing for the clinical studies were carried out at 7 trial sites across the U.S. An
additional 8 sites provided specimens for use in the trial.
Clinical Sensitivity
The clinical sensitivity of the VERSANT-HIV-1 RNA 3.0 Assay (bDNA) was
evaluated in HIV-1 infected individuals, stratified by CD4+ cell count and by
gender: The CD4+ groups were:
l CD4+ ~200 cells/mm3
l CD4+ between 200 and 500 cells/mm3 inclusive
l CD4+ ~500 cells/mm3
Specimens from a total of 984 subjects were tested in this study. Table 6
summarizes the study population demographics and risk factors for acquiring HIV
infection.
_^ Page 18 of 41 1

Table 6 Study Population Characteristics
Gender Male
Female
698
286
Race
Asian -
African-American
Caucasian
Hispanic
Other
4
408
502
45
25
0.4
41.5
51 .o
4.6
2.6
Risk Factors
Homosexual Activity and IV Drug Use Homosexual Activity (No IV Drug Use)
IV Drug Use (No Homosexual Activity)
Blood Products Exposure
Occupational Exposure
None of the Above
64
487
201
13
6
213
6.5
49.5
20.4
1.3
0.6
21.7
Data were analyzed to determine if assay performance was different in males
and females. Because differences were not statistically significant, all data were
combined to establish performance in the 3 CD4+ T-cell categories. These data
are presented in Table 7.
. - Page 19 of 41

Table 7 - Percent of All Specimens with V&?SANT HIV-1 RNA 3.0 Assay (bDNA) Quantitations At or Above the LoQ, by CD4+ Category
A laboratory testing specimens from HIV- positive patients can expect to detect
virus in approximately 99% of patients with CD4+ counts of less than 200
cells/mm3, in approximately 89% of patients with CD4+ counts between 200 and
500 cells/mm3, and in approximately 65% of patients with CD4+ counts of greater
than 500 cells/mm3.
Clinical Specificitv: Specimens from Low Risk Populations
EDTA plasma specimens from 912 unlinked repeat volunteer male and female
blood donors were tested using - reagent lots of the VERSANT HIV-1 RNA
Assay (bDNA). All specimens were negative for HBsAg, HBcAb, HCV antibody,
HIV-l/HIV-2 antibody (Abbott HIV-l/HIV-2 EIA) and for. p24,antigen. The
collection centers were the Sacramento Center for Blood Research and the New
York Blood Center. Because these subjects were repeat donors, they had a very
low risk of being HIV-1 positive.
Data were analyzed to determine if assay performance was different in males
and females. Because performance was not statistically different, all data were
Page 20 of 41

combined for the analysis of assay specificity. Table 8’summarizes the assay
specificity and 95% confidence intervals for the combined data.
Table 8 Percent of Specimens with Non- Detectable Virus (Result e LoQ) by the VERSANT HIV-1 RNA 3.0 Assay (bDNA)
.
rsr .95% @&$& Confidence
~I,. Interval
I .
.x /: ._ ,_,
Combined 1 912 ] 97.6% 96.4% 98.5%
The assay-specificity of 97.6% is based.on an LoQ of 75 copies/ml
Clinical Specificitv: Soecimens from Individuals with Other Diseases
EDTA plasma specimens from HIV-negative patients diagnosed with the
following infections or having the following antibodies/antigens were tested using
the VERSANT HIV-1 RNA 3.0 Assay (bDNA):
l cytomegalovirus (CMV)
l hepatitis C virus (HCV)
l hepatitis B virus (HBV)
l human T-lymphotropic virus (HTLV)
l anti-nuclear antigen (ANA)
l rheumatoid factor (RF)
Ten subjects diagnosed with each of the 6 disease states were evaluated, for a
total of 60 HIV-negative clinical specimens. The RLU values of specimens
collected from volunteer repeat blood donors in the specificity study were used
as reference values. For each blood donor specimen and every “other disease”
specimen, the ratio of the specimen RLU to the RLU of the LoQ for that particular
assay run was calculated. Page 21 of 41

Table 9 summarizes the geometric mean ratio of the specimen RLUs to the
RLUs of the LoQ for the donors and disease states, the ratio between the 2
results, and the corresponding cOnfidenc8 interval.
Table 9 Geomean Specimen RLUs / RLU of the LoQ and the ; Comparison of RLUs from Donor Specimens and
Disease State Specimens
The specificity of the VERSANT HIV-1 RNA 3.0 Assay (bDNA) in specimens
from subjects with other diseases commonly encountered in HIV infection is
equivalent to the specificity in specimens from volunteer repeat blood donors.
Within Patient Variability
-.
The within patient variability of HIV-1 quantitation was evaluated in 24
presumably clinically stable men and 9 presumably stable women. EDTA
plasma samples and health status information were collected from each subject
weekly for 8 weeks.
Enrollment criteria for the study were:
l No initiation or change in retroviral therapy within 3 months of the start of
the study
l No clinical events within 3 months of the start of the study
l No initiation or changes in retroviral therapy during the 8-week study
period, Page 22 of 4 1
I I___-

l No clinical events during the 8-week study ’
Subjects were required to have had at least 6 of the 8 weekly draws to remain
eligible for the study.
Each successive specimen from a given subject was tested in a different run (but
within the same kit lot) to mimic the between run results that would_be obtained if
testing were done in real time.
The ultimate-objective of the study was to determine the minimum fold-change
between 2-successive measurements that would signal a potential change in a
subject’s clinical status. The data from this study were designed to provide
information on biological variability. The biological variability estimate was then
combined with the estimates of assay variability (site, operator, lot, between-run
and within-run) from the Reproducibility Study to estimate the minimum
fold-change number.
Five subjects were eliminated from the analysis because they had a 20-fold or
greater change in assay quantitation by both assays during the 8-week study
period. Four of these 5 subjects were intravenous drug users, so use of illicit
drugs or lack of compliance with medication might have caused these large
fluctuations in viral load. In addition, the results of all specimens from 3 subjects
were below the limit of quantitation in the VERSANT HIV-1 RNA 3.0 Assay
(bDNA); these results were not used in the calculations for assay variance.
Figure 2 shows the distribution of observed fold-changes for the serial
measurements by the VERSANT HIV-1 RNA 3.0 Assay (bDNA). All subjects are
included in these figures. The fold-changes represented by the horizontally
striped portion of the bars in the bar graphs are the ones excluded from the
estimation of variance.
Page 23 of 41

Figure 2 - - Distribution of Fold-Changes Beiween Serial Measurements in the VERSANT HIV-1 RNA 3.0 Assay (bDNA), Showing Fold-Changes Which Were Used and Not Used in the Variance Calculations
-.
‘OX%
10%
0%
0 Not Used L-- II Used
1.0-1.5 1.5-2.0 2.0-2.5 2.5-3.0 3.0-3.5 3.5-4.0 4.0-4.5 4.5-5.0 ~5.0
Fold-Change J
A total of 160 pairs of serial measurements were used in the variance
calculations for determining within patient variability. These measurements were
used to estimate the variance in quantitation due to biological, run, and within
sources of variation. The variance estimate was 0.05224 for the VERSANT
HIV-1 RNA 3.0.Assay (bDNA). This variance estimate was combined with
variance estimates for site, operator, and lot from the Reproducibility study
(Section 0) to estimate the total assay + biological variability for the assay.
These estimates were then used to calculate the maximum change between 2
successive measurements that could be attributed to chance. Larger changes in
viral load would then be used to signal potential changes clinical status..
Based on the combined variance estimates, the upper 95% confidence interval of
the minimum fold change between 2 successive measurements of HIV-1 using
the VERSANT HIV-1 RNA 3.0 Assay (bDNA) that is unlikely to have happened Page24 of41

by chance was estimated to be 3%fold (0.51 loglo) across the entire range-of the
assay. Therefore, the VERSANT HIV-1 RNA 3.0 Assay (bDNA) can be used in
accordance with the guidelines provided in the Report of the N/H Pane/ to Define
Principles of Therapy of HIV Infectiod, which states that “Changes greater than
0.5 loglo usually cannot be explained by inherent biological or assay variability
and probably reflect a biologically and clinically relevant change....” (A 0.5 logI
change = 3.16 fold-change.). _
Clinical Utilitv: Proanosis of Disease Proaressh
The relationship between HIV-1 quantitation and the prognosis of disease
progression was studied in a subset of the 1,485 subjects enrolled in the
Community Programs for Clinical Research on AIDS protocol 036 (CPCRA 036).
This cohort study was designed as a 2iyear study of HIV-1 infected subjects with
c 300 CD4+ cells/mm3and less than Stage 2 AIDS Dementia Complex.
Specimens for this protocol were collected between October 1995 and February
1997. Baseline specimens from 201 subjects who had disease progression
during follow-up and 201 matched controls (no disease progression during
follow-up) were selected for testing by the VERSANT HIV-1 RNA 3.0 Assay
(bDNA) and the Roche AMPLICOR Test (CPCRA Study Cohort). Selection and
matching was performed by the CPCRA statistical center and was based on
clinical enrollment site and randomization date.
-,
The characteristics of the study population are shown in Table 10.
'AnnIntMed1998,128:1057-1078.
Page 25 of 41

Table 10 - Characteristics of the CPCRA 036 Study Population
qace (%)
African-American
Caucasian
Latin0 _
Other
‘emale (%)
:D4+ (mean cells/mm3)
iverage log HIV-1 RNA
Iisk Factors
Homosexual activity history only (%)
IV drug use history only (%)
History of homosexual activity and IV drug use (%) Other risk factors
iistory of AIDS-defining event at baseline --
\lo baseline antiretroviral (%)
3aseline nucleoside use (%)
3aseline protease inhibitor use (%)
35.3%
56.2%
7.0%
1.5%
12.4%
61.0
60.2%
11.4%
7.0%
21.4%
58.7%
34.8%
55.7%
8.5%
1 .O%
10.0%
161.4
3.9
62.7%
15.4%
5.5%
16.4%
29.9%
9.5%
90.0%
10.4%
Two methods were used to analyze the data.
l Logistic regression analysis was used-to estimate the effect of baseline HIV-1
quantitations on disease progression, both unadjusted and adjusted for CD4+
Page 26 of 41

ceil count and other confounders. These effects we’re estimated as odds
ratios.
l The baseline HIV-1 quantitations, CD4+ cell counts and other confounders
were used in Cox proportional-hazards models to estimate the association of
baseline HIV-1 RNA with disease progression. Relative risks of viral load
measurements were calculated, both unadjusted and adjusted for CD4+ cell
count and other confounders.
Survival curves were obtained for each HIV-1 RNA tertile. These curves were
adjusted forthe bias induced by the case-control sampling scheme using weights
that are inversely proportional to the sampling probability.
In both of these models, the event of interest was the first AIDS defining event
during the study period (excluding CD4’c 200). The follow-up time (days) was
calculated from the date of the baseline measurement to the first study AIDS
event. The covariates were defined as follows:
l Baseline HIV-1 RNA was divided into 3 groups based on tertiles rounded up
to the nearest thousand. Grouping into tertiles facilitates the interpretation of
results as it pertains to the practical use of the assay. Tertiles were defined
separately for the VERSANT HIV-1 RNA 3.0 Assay (bDNA) and AMPLICOR
Test according to their respective test result distributions.
l Baseline CD4+ cell count was included in the models as a binary variable.
The CD4+ cell count median was used to define this variable taking a value of
zero when CD4+ cell count was lower than the median and a value of one
when CD4+ cell count was equal or higher than the median.
. Other confounders, such as gender, race and history of an AIDS-defining
event at baseline, were included as indicator variables.
. An additional analysis was performed using the VERSANT HIV-1 RNA 3.0
Assay (bDNA) baseline HIV-l RNA as a continuousvariable instead of using
tertiles. - Page 27 of 41

Table 11 shows the odds ratios of an AIDS-defining event or death, with
associated 95% confidence intervals, adjusted for differences in baseline CD4+
cells counts. Results are shown for the VERSANT HIV-1 RNA 3.0 Assay (bDNA)
and the AMPLICOR Test tertiles.
Table 11 Association of Basefine HfV-1 RNA Tertffe With Disease Progression, fncluding Death, Adjusted for Baseline CD4+ Cell Count (Odds Ratios)
Tertile Tertile (copies/mL) . (copies/mL)
< 25,000 1 .O (Ref) c 50,000 1 .o (Ref)
25,000- 2.1 1.1 , 3.9 0.03 50,000- 1.9 1.0, 3.6 0.04 150,000 250,000
>150,000 3.3 1.7 , 6.4 < 0.001 > 250,000 3.8 1.9 , 7.5 c 0.001 CD4+ CD4+ Cells/mm3 Cells/mm3
> 100 1 .O (Ref) > 100 1 .o (Ref)
< 100 5.6 3.2 , 9.5 < 0.001 < 100 5.4 3.2 , 9.3 e 0.001
The adjusted odds ratios represent the odds of an AIDS-defining event or death
for baseline HIV-1 RNA tertiles, controlling for the effect of baseline CD4+ cell
counts. The adjusted odds ratios for the VERSANT HIV-1 RNA 3.0 Assay
(bDNA) and the AMPLICOR test were both significantly higher than 1 .OO.
The odds ratios indicate that higher baseline HIV-1 RNA is associated with
increased risk of disease progression or death, independent of, baseline CD4+
cell counts, using either the VERSANT HIV-1 RNA 3.0 Assay (bDNA) or the
AMPLICOR Test to measure viral load. Baseline CD4+ cell counts were also
prognostic of disease progression, controlling for effect of baseline HIV-l RNA. - Page 28 of 41

-.
Table 12 shows the risk ratios based on the Cox Proportional Hazards analysis.
Table 12 Association of Baseline HIV-1 RNA Tertiles With Disease Progression, Including Death, Adjusted for Baseline CD4+ Cell Count (Risk Ratios)
The adjusted hazard for subjects with a high VERSANT HIV-1 RNA 3.0 Assay
(bDNA) result or AMPLICOR Test result at baseline was significantly higher than
the estimated hazard for subjects with a low HIV-1 RNA level at baseline. These
findings indicate that higher baseline viral load, as measured by either the
VERSANT HIV-1 RNA 3.0 Assay (bDNA) or the AMPLICOR Test, is associated
with increased risk of disease progression or death, independent of baseline
CD4+ cells counts. The Cox proportional hazards model yielded the same
conclusions as those from the logistic model presented above.
Table 13 shows the Cox relative hazards or risk ratios for disease progression,
as measured by continuous baseline HIV-1 RNA levels in the VERSANT HIV-1
3.0 Assay, adjusted for differences in baseline CD4+ cell counts. The risk ratio
represents the estimated risk associated with an increase of one loglo copies/ml.
Page 29 of 41

-.
Table 13 - Association (Risk Ratio) of Baseline HIV-1 RNA with Disease Progression, Including Death, Adjusted for Baseline CD4+ Cell Count Uslng the VERSANT HIV-1 RNA 3.0 Assay (bDNA)
These data show that, regardless of baseline level of HIV-1 RNA and baseline
CD4+ cell count, the risk of disease progression was increased by 45% for each
one loglo copies/ml. increase in viral load at baseline. The analysis using the
logistical regression model showed similar results, as shown in Table 14, with a
significance level of p = 0.02.
Table 14 Association of Baseline HIV-1 RNA with Disease Progression, Including Death, Adjusted for Baseline CD4+ Cell Count (Odds Ratios) Using the VERSANT HIV-1 RNA 3.0 Assay (bDNA)
To illustrate the association between baseline VERSANT HIV-1 RNA 3.0 Assay
(bDNA) results and baseline AMPLICOR Test results with disease progression,
Page 30 of 41

while controlling for baseline CD4+ counts, Figures 3 through 6 show the survival
curves by baseline HIV-1 RNA tertiles for subjects with baseline CD4+ counts
cl 00 cells/mm3 and with baseline CD4+ counts 2 100 cells/mm3, separately.
Figures 3 and 4 show the results using the VERSANT HIV-1 RNA 3.0 Assay
(bDNA), and Figures 5 and 6 show the same analysis using the AMPLICOR
Test.
Figure 3 Progression of Disease by Baseline HIV-1 RNA Tertile Using the VERSANT HIV-1 RNA 3.0 Assay (bDNA), in Subjects with < 100 CD4+ Celis/mm3
1.0
S ” 0.9
r Y 0.6 i
” 0.7 _ ------------ 0 ---------___________
r b----_ - --__ -__
0.6 F ” 0.5 n c t 0.4 i
0 0.3 n
E 0.2 * t 0.1 I
m a 0.0
I”“‘I”“‘I”~‘~I”“‘I”“““““‘“’ r- t 0 0 60
100 160 200 260 300 350 400
Time to event (days)
RNA: Bayor HIV-1 3.0 Torllk 1: RNcl c 2s.ooo _------ ,.,,,I. 2: WA 2s.o00-12o.ow
_------. Tmrlllm 3: CFU a 1so.ooo
_ - Page 31 of 41

Figure 4
s ” 0.9 r ” 0.8 I
” 0 0.7
r 0.6
F ” 0.5 n c t 0.4 I
0 0.3 ”
E 0.2
s t 0.1 i
Time to event (days) I
RNA: Bayer HIV-1 3.0 Tlrllh 1:Rw*<2%oDn -_--_ T.,lllm p: m4A 26.ooo-16O.ooo --m---s. ,.r,,lm 5: RN* > 160,ooa
-.
Page 32 of 41
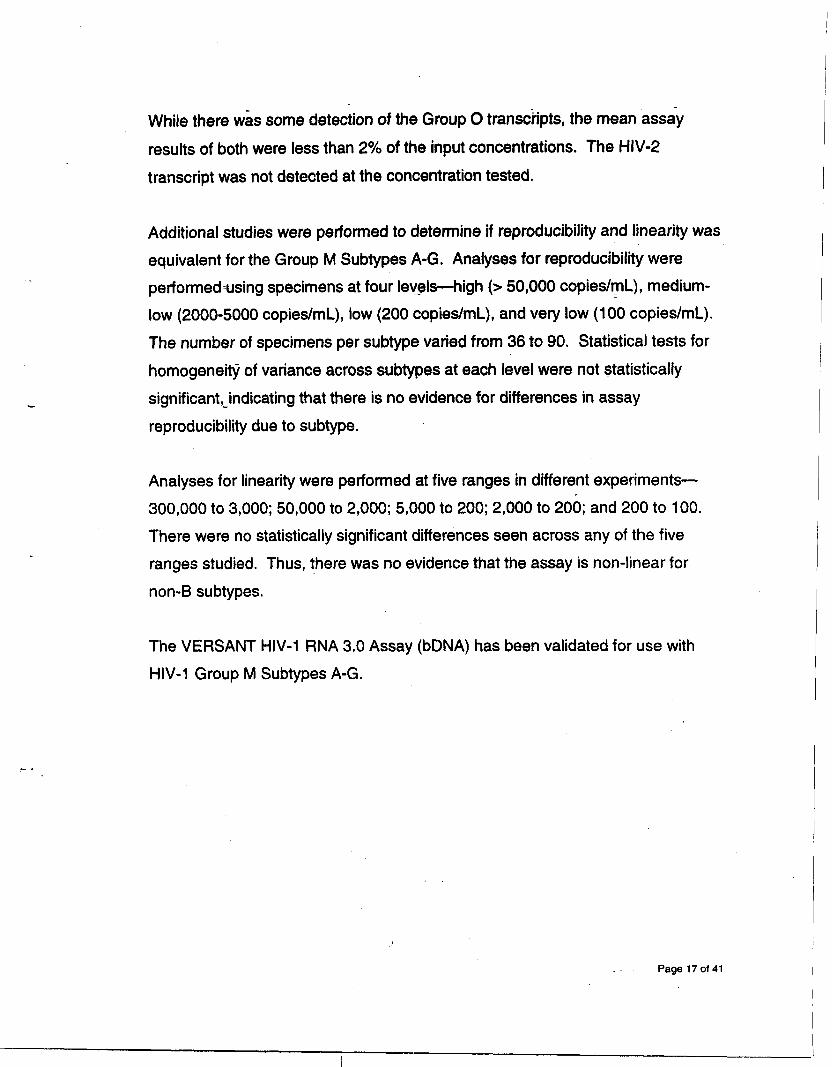
Figure 5 - Progression of Disease by Baseline HIV-1 RNA Tertile Using the AMPLICOR Test, in Subjects with cl00 CD4+ Cells/mm3
E 8 t i
nl a t
0 JO 100 1so 200 250 300 350 400 0
lime to event (days)
OS
0.4
0.3
0.2
0.1 i-
RNA: Amplkor TWllk 1: mu .x 50.ooo __---- Tortlk 2: mu so.ooo-2so.ooo __------ Twtlh 1: RN* z. 250,ooo
-.
- Page 33 of 41

-.
Figure 6 Progression of Disease by Baseline HIV-1 RNA Tertile Using the AMPLICOR Test, in Subjects with 2 100 CD4+ Cells/mm3
S ~______________-_------ ” 0.9 --------___
r ” 0.8 I
” 0 0.7
r 0.6
F ” 0.5 n 0 t 0.4 I
0 0.3 - n
E 0.2 0 t 0.1 i
In a 0.0
I “..’ I ” “’ I .“” I * 7 7” I ‘I -I’ 1.. ’ ” 1”‘. *I 1
0 0 50 100 150 200 250 300 350 400
RNA: Amplbor
lime to event (days)
TorII* 1: IFU ~60.ooo Twill. 2:M 60.000.250.ooO -------. Twtlb 2: RUI l. 2so.ooo
These figures show that the subjects with a higher baseline viral load measure
had a lower survival rate than subjects with a lower baseline, independent of their
baseline CD4+ cell count. This effect was more apparent among patients with a
low baseline CD4+ count.
Clinical Utilitv: Monitorinu Study
Retrospectively collected serial specimens from 60 HIV-l infected subjects were
tested by the VERSANT HIV-1 RNA 3.0 Assay (bDNA) and the AMPLICCR Test.
Data on clinical events, drug therapy and CD4+ cell counts were also collected
through chart review. Data from the serial specimens collected in the Within
Patient Variability Study were also used in the analyses. Sequential HIV-1 RNA _ - PageStot

-.
determinations from subjects who started antiretroviral therapy within the interval
of 2 sequential blood draws were compared to determinations from subjects with
no antiretroviral therapy or no change in antiretroviral therapy within the interval
between 2 blood draws. The mean loglo quantitation decrease between
sequential measures was significantly higher for sequential measures where
antiretroviral therapy was started than for sequential measures where there was
no antiretroviral therapy or continued therapy. These data are shown in Table
15. The Clinical Utility: Monitoring Study specimens used in the VERSANT
analysis were drawn from 93 subjects with a total of 5653 draws.
Table 15 - Mean Log,* Quantitation Decrease Between Sequential VERSANT Assay‘Measures With Lower and Upper 95% Confidence Limits, by Therapy
The log changes between sequential measurements by the VERSANT Assay
and AMPLICOR Test were evaluated, There was no evidence of statistically
significant differences in the measurement of log changes between the two
assays. Figure 7 is a scatter plot of all log changes as measured by the
VERSANT HIV-1 RNA 3.0 Assay (bDNA) and the AMPLICOR Test. The line
plotted is the 45degree line through 0.
3 The analysis is based on sequential results. The initial result for each patient cannot be used because it has no previous specimen with which to pair. Thus, the possible number of sequential
Page 35 of.41

Figure 7 Scatter Plot of VERSANT HIV-1 RNA 3.0 Assay (b6NA) Log Differences and AMPLICOR Test Log Differences with 45Degree Line
AMPLlCORfert Log Ufference (log Copies/m L)
-!
Comparison of the VERSANT HIV-1 RNA 3.0 Assav (bDNA) and the AMPLICOR Test in Clinical Specimens
Matched results from 936 clinical specimens were used to compare the HIV-1
RNA quantitations between the two assay methods. The scatter plot results are
shown in Figure 8.
measures is 565 - 93 or 472. One result was missing, so the total number used in the analysis was 471.
- Page 36 of 41

r
Figure 8 - Scatterplot of VERSANT HIV-1 R&A 3.0 Assay (bDNA) Results and AMPLICQR Test Results with Best Fitting Best-Fitting 45Degree Line
o ’ I 1 2 3 4 5 6 7
AMPLICOR lest
(Log CopiedW
Regression analysis showed that the VERSANT HIV-1 RNA 3.0 Assay (bDNA)
quantitated specimens 39% lower than the AMPLICOR Test across the common
reportable range of the two assays.
CONCLUSIONS DRAWN FROM STUDIES
Nonclinical Laboratory Studies
The nonclinical laboratory studies showed that the VERSANT HIV-1 RNA 3.0
Assay (bDNA) performance is consistent with the intended use for the assay.
l The quantitation limit was set appropriately, as shown in the Specificity and
Reproducibility Studies, and the assay is linear and reproducible throughout
the reportable range of 75 to 500,000 HIV-1 RNA copies/ml. _ - Page 37 of 41

l Specimens with levels of triglycerides up to 2000 mg/dL, bilirubin up to
20mgIdL or hemoglobin up to 200 mg/dL showed no clinically significant
interference with the HIV-1 RNA quantitation by this assay.
l Specimens undergoing up to 3 freeze-thaw cycles may be used in the assay.
l None of the therapeutic drugs tested interfered with assay performance, nor
did viruses (at 1 O3 PFU/mL or higher) or bacteria or fungi (at lo* CFU/mL).
l K2 and& EDTA and ACD Solution A anticoagulants can be used for
specimen collection for the VERSANT HIV-1 RNA 3.0 Assay (bDNA).
Plasma from EDTA and ACD Vacutainer tubes can be held at 2-8 “C for up to
48 hours before freezing. Plasma-in K2 Plasma Preparation Tubes can be
held at room temperature for 24 hours prior to freezing.
l HIV-1 subtypes A-G quantitated within 3-fold of subtype B.
Clinical Studies
The clinical studies also showed that the assay performance is consistent with its
intended use.
l The Assay is useful as an aid in the prognosis of disease progression. Using
baseline specimens from subjects enrolled in the CPCRA 036 protocol, there
was a statistically significant relationship between HIV-1 baseline quantitation
and disease progression using 2 statistical models (logistic regression and
Cox Proportional Hazards Analysis),
Page 38 of 41

-.
l The utility of HIV-1 RNA quantitations for monitoring patients was shown in 60 I
I case studies where HIV-1 infected subjects were followed over time. The
data showed how viral load determinations, when used with other clinical and
laboratory information, can be used to aid in the decision of whether and
when to initiate or change antiretroviral therapy.
a The Within Patient Variability data, when combined with estimates of variance
from the Reproducibility Study, showed that a fold change of 3.2 or greater
was unlikely to occur by chance and could be used as an indicator of potential
change-in clinical status. This number was consistent with the current
treatment guidelines reported in the Report of the /V/H Pane/ to Define
Principles of Therapy of HIV /nfe&on4, which states that “Changes greater
than 0.5 loglo usually cannot be explained by inherent biological or assay
variability and probably reflect a biologically and clinically relevant change.. . .”
(A 0.5 logI change = 3.16 fold-change.)
l The sensitivity, specificity, and nonspecificity study results all supported the I
safety and effectiveness of the assay. I
l Specimens in the two Clinical Utility Studies (Prognosis of Disease
Progression, Patient Monitoring), and a subset of the Clinical Sensitivity Study
were tested by both the VERSANT HIV-1 RNA 3.0 Assay (bDNA) and the
AMPLICOR Test.
o In the Prognosis of Disease Progression analysis, the AMPLICOR Test
provided statistically significant odds ratios and risk ratios for progression,
which were equivalent to those for the VERSANT HIV-1 RNA 3.0 Assay
(bDNA).
4 Guidelines for the Use of Antiretroviral Agents in HIV-Infected Adults and Adolescents. Department of Health & Human Services and the Henry J. Kaiser Foundation, 2001. Available at: htto:Nhivatis.oraltrtadlns.html#AdultAdolescent. .
- - Page 39 of 41

o In the Monitoring Study, the two assays consistently “tracked” with each
other; i.e., changes or lack of changes between serial determinations were
consistent between the two assays. Based on the average log changes,
the regression related to log changes and the concordance analysis, log
changes as measured between the two assays were not significantly
different.
o When matched results from all clinical specimens were combined into a
single analysis, the scatter plot results were similar to those reported in
the nonclinical Concordance and Precision Study. The VERSANT HIV-1
RNA 3.0 Assay (bDNA) quantitated specimens 39% lower than the
AMPLICOR Test across the common reportable range of the two assays.
The results of these studies show that the VERSANT HIV RNA Assay is safe and
effective for its intended use as an aid in the management of HIV-1 infected
individuals.
Safety and Benefit/Risk Analysis
The VERSANT@ HIV-1 RNA 3.0 Assay (bDNA) is an in vitro signal amplification
nucleic acid probe assay for the direct quantitation of human immunodeficiency
virus type 1 (HIV-l) RNA in plasma of HIV-1 infected individuals. This test is
intended for use in conjunction with clinical presentation and other laboratory
markers as an indicator of disease prognosis by measuring baseline HIV-1 RNA
levels and to monitor the effects of anti-retroviral therapy of HIV-1 RNA levels.
The VERSANT HIV-1 RNA 3.0 Assay (bDNA) is not intended for use as a
screening test for HIV infection or as a diagnostic test to confirm the presence of
HIV infection.
The ability to measure viral load is a valuable tool in the management of HIV-1
infected patients. An increase in viral load has been shown to correlate with
_ - Page 40 of 41

progression of HIV-1 disease. 5*6B7 Studies have shownthat viral load is useful in
predicting outcome or survival time ,in determining the need to initiate, change or
assess response to an antiretroviral regimen.516*7*Q The performance of the
product as described in the clinical and non-clinical studies above, indicate that
this assay is useful in measuring baseline HIV-1 RNA for disease progression
and to monitor the effects of anti-retroviral drug therapy, both of which would
significantly benefit patients and outweigh any probable risk of injury or illness to
the patient from its use.
5 Saag MS. Use of virologic markers in clinical pratice. J Acquir Immune Defic Syndr Hum Retrovirol. 1997;16(SuppLl):S3-S13. 6 Ho DD, Neumann AU, Peretson AS, et al. Rapid turnover of plasma virions and CD4 lymphocytes in HIV-l infection. Nature. 1995;373:123-6. 7 Killian AD. Measuring human immunodeficiency &us type 1 RNA viral load. Am J Health-Syst Pharm. 1997:54:1646&l. * de La Maza LM. Determining the number of copies of HIV-1 RNA in plasma: applying this new test to management of patients. West J Med. 1997;167:35. 9 Swanson B. HIV plasma viral load in the clinical setting: measurement and interpretation. J Assoc Nurses AIDS Care. 1997;8:21-2.
-- Page 41 of 41