
Summary of quantitative consumer research - Ofcom | Stakeholders
44
Summary of quantitative consumer research Annex 14 to pay TV market investigation consultation Research Document Publication date: 18 December 2007
Transcript of Summary of quantitative consumer research - Ofcom | Stakeholders

Summary of quantitative consumer research
Annex 14 to pay TV market investigation consultation
Research Document
Publication date: 18 December 2007


Annex 14 to pay TV market investigation consultation - summary of quantitative consumer research
Contents
Section Page 1 Research objectives and methodology 1 2 Consumer satisfaction and switching 3 3 Attitudes of terrestrial analogue TV consumers 21 4 Consumer preferences for MCTV services 23 5 Sports and film 31

Annex 14 to pay TV market investigation consultation - summary of quantitative consumer research
Section 1
1 Research objectives and methodology Objectives
1.1 Consumer research was commissioned to feed into Ofcom’s analysis of the market for multi-channel (MC) TV services. A series of research studies have sought to understand:
• general levels of satisfaction with TV services;
• key drivers of choice when choosing or switching platforms, and preferences for TV content; and
• reactions to price rises of key content and bundles of pay TV services.
Method
1.2 Four research studies were commissioned specifically for this project, which also draws on other Ofcom consumer research. The qualitative research is covered separately, in Annex 13.
Table 1: Summary of data sources Stage Fieldwork
date Method-ology
Sample details Research agency
Pay TV phase 1: Preferences for TV services and content
June/July 2006
Face-to-face
Representative sample of 2,008 multi-channel households
Ipsos MORI
Pay TV phase 2: Preferences for film content, identifying ‘must have’ content
November 2006 Telephone
812 multi-channel households, with robust samples of each platform
TNS
Pay TV phase 3: Preferences for specific elements of movies, sports and general TV content
September 2007 Face-to-face
Representative sample of 1,970 Freeview, Sky and Virgin Media households with boosts of low penetration subscriber groups
TNS
Pay TV qualitative: Exploring bundling, channels preferences, satisfaction with services
October 2007 Focus groups
Eight groups of Pay TV and Freeview consumers
Essential Research
Ofcom consumer decision-making survey August 2007 Telephone
1,600 communications decision makers
Saville Rossiter-Base
Ofcom communications tracking survey Monthly tracker Face-to-
face c.8,000 consumers per year Ipsos MORI
1

Annex 14 to pay TV market investigation consultation - summary of quantitative consumer research
1.3 Where appropriate, data have been weighted to the appropriate universe of consumers. The base sizes quoted in the survey are unweighted.
1.4 Throughout this annex we have referred to the following groups of consumers:
• ‘Basic tier consumers’ refers to those pay TV consumers who buy a basic tier bundle of channels (e.g. 2, 4 or 6 Mix on Sky; M, L or XL on Virgin Media; Base or Big packs on Tiscali TV, formally Homechoice; and (in Phases 1 and 2); Top Up TV customers who do not take any Sky Sports or Sky Movie Channels.
• ‘Premium tier consumers’ refers to those who buy Sky Sports and/or Sky Movies channels. Note that these consumers also receive the basic tier of channels as a precondition of receiving premium channels. We recognise that there are other types of channels that may be considered premium, such as Setanta.
• PSB channels refer to the analogue terrestrial broadcast channels (BBC One, BBC Two, ITV1, Channel 4 and Five).
2
Annex 14 to pay TV market investigation consultation - summary of quantitative consumer research
Section 2
2 Consumer satisfaction and switching 2.1 This section summarises consumer satisfaction with existing TV services and their
interest in, and experiences of, switching multi-channel TV (MCTV) providers and other communications services.
2.2 Understanding how much consumers know about MCTV, what drives their satisfaction with services, and their level of engagement in the market, helps us place consumer attitudes towards potential changes in MCTV services in context.
Knowledge of the MCTV market
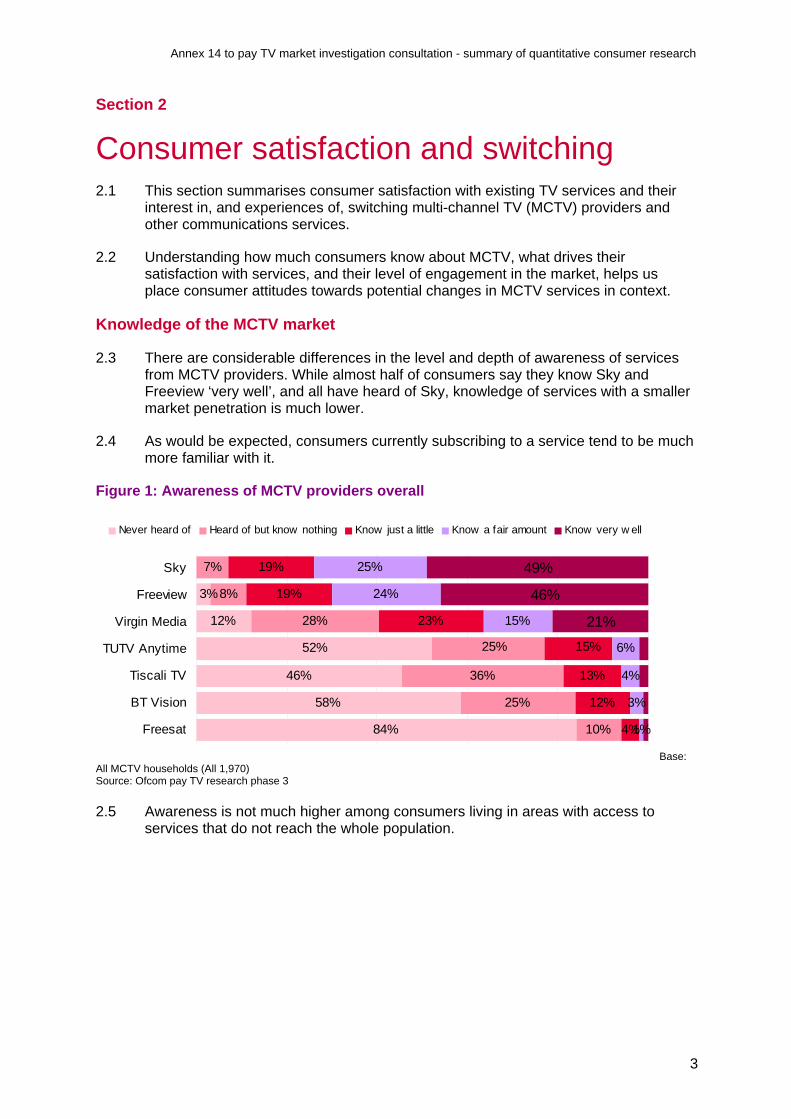
2.3 There are considerable differences in the level and depth of awareness of services from MCTV providers. While almost half of consumers say they know Sky and Freeview ‘very well’, and all have heard of Sky, knowledge of services with a smaller market penetration is much lower.
2.4 As would be expected, consumers currently subscribing to a service tend to be much more familiar with it.
Figure 1: Awareness of MCTV providers overall
12%
46%
58%
84%
7%
8%
28%
36%
25%
10%
19%
19%
23%
13%
12%
4%
25%
24%
15%
6%
4%
3%
1%
46%
21%
3%
52% 25% 15%
49%Sky
Freeview
Virgin Media
TUTV Anytime
Tiscali TV
BT Vision
Freesat
Never heard of Heard of but know nothing Know just a little Know a fair amount Know very w ell
Base: All MCTV households (All 1,970) Source: Ofcom pay TV research phase 3
2.5 Awareness is not much higher among consumers living in areas with access to services that do not reach the whole population.
3

Annex 14 to pay TV market investigation consultation - summary of quantitative consumer research
Figure 2: Awareness of MCTV providers among consumers living in areas that can receive the service
38%
7%
27%
35%
19%
23%
15%
25%
16%
9%
21%
3%
13%
84% 10% 4%
49%Sky
Virgin Media
Tiscali TV
Freesat
Never heard of Heard of but know nothing Know just a little Know a fair amount Know very well
Base: All MCTV households with access to each service (Sky 1,970, Virgin Media 1,296, Tiscali TV 578, Freesat 1,970) Note: Excludes Freeview, TUTV Anytime and BT Vision as access data not available Source: Ofcom pay TV research phase 3
2.6 Table 1 below shows where it is possible to calculate, no strong correlation between actual availability and perceived availability.
2.7 Because service availability does not correlate strongly with actual availability, significant proportions of the MCTV customers hold incorrect perceptions of service availability. For example, a third of those who think they can get TV services from Virgin Media in their home area are incorrect.
Table 1: accuracy of perceived awareness of MCTV providers available in area
% who
perceive service to be
available
% of those who perceive
service is available and
who live where it is available
% of those who perceive
service is available
when it is not available
% who do not think service is available
% of those who do not
think service is available and who live in an
area where it isn’t
available
% of those who do not
think service is available when in fact it is available
BT Vision 14%
Freeview* 84%
Sky** 94%
Tiscali TV/ HomeChoice*** 8% 37% 63% 92% 72% 28%
Virgin Media 51% 66% 34% 49% 35% 65%
*Analysis has not been conducted, as precise coverage area list not available. Approximately 73% of households can currently receive DTT services. ** Sky has close to 100% coverage, but in practice some homes cannot access (e.g. dishes not allowed on block of flats, conservation areas) *** The analysis is based on coverage data provided by Tiscali TV. Since this coverage data could not be exactly matched to the survey data this information should be treated as an approximation. Base: All MCTV households (All 1, 970) Source: Ofcom pay TV research phase 3
Perceived availability of Sky Sports
2.8 We asked MCTV consumers with an interest in sport which TV services they could use to access Sky Sports.
4

Annex 14 to pay TV market investigation consultation - summary of quantitative consumer research
2.9 Awareness of availability of Sky Sports is related to the consumer’s MCTV provider. Ninety per cent of Sky’s Digital Satellite (DSat) consumers know they could access Sky Sports through Sky, although only a minority of these (19%) thought that they could access Sky Sports through Virgin Media.
2.10 Awareness of Sky Sports availability is lower among users of other platforms. Sixty-eight per cent of Virgin Media customers thought they could access Sky Sports though Virgin Media. Just over half (55%) of Freeview customers thought they could access Sky Sports through Sky, while only 15% thought they could access the channels through Virgin Media.
Table 2: Awareness of availability of Sky Sports on different platforms Current platform
Awareness that Sky sports available on: Total Sky Virgin
Media Freeview
Base 1302 474 452 376 BT Vision 5% 5% 4% 5% Freesat 2% 2% 1% 1% Freeview WITH Top Up TV Anytime 8% 5% 10% 10% Freeview WITHOUT Top Up TV Anytime 13% 6% 6% 24% Sky 70% 90% 57% 55% Tiscali TV 3% 4% 3% 2% Virgin Media 26% 19% 68% 15%
None 8% 3% 8% 14% Don’t know 8% 4% 8% 12%
Base: All MCTV households with at least some interest in sport (Sky 474, Virgin Media 454, Freesat 376) Source: Ofcom pay TV research phase 3
Satisfaction with existing services
2.11 Figure 3 shows that over four in five consumers are satisfied with the overall service of their MCTV provider. However, these levels of satisfaction are significantly lower than for fixed-line and mobile telephony.
Figure 3: Overall satisfaction with communications services
45
40
50
48
49
46
38
43
0 20 40 60 80
Digital TV
Broadband
Mobile
Fixed line
100
Very satisfied Fairly satisfied
92%
93%
88%
86%
45
40
50
48
49
46
38
43
0 20 40 60 80
Digital TV
Broadband
Mobile
Fixed line
100
Very satisfied Fairly satisfied
45
40
50
48
49
46
38
43
0 20 40 60 80
Digital TV
Broadband
Mobile
Fixed line
100
Very satisfied Fairly satisfied
92%
93%
88%
86%
Base: All adults 15+ with fixed-line (Q2 2007, 1329), mobile (Q2 2007, 1273), broadband (Q1 2007, 727), Digital TV (Q1 2007, 1211) Source: Ofcom communications tracking survey
5

Annex 14 to pay TV market investigation consultation - summary of quantitative consumer research
2.12 Ofcom’s communications tracker asks respondents how satisfied they are with their main television provider. Although not designed to be a customer satisfaction survey, the figure below shows that satisfaction levels are higher among Sky customers than Virgin Media customers (86% overall satisfaction compared to 78% respectively). It should also be noted that the results are taken from a survey run in Q2 2007, shortly after Virgin Media stopped carrying Sky’s basic channels.
Figure 4: Satisfaction with MCTV providers
32%
48%
48%
46%
37%
41%
78%
86%
89%
Virgin Media
Sky
Freeview
Very satisf ied Fairly satisf ied
Base: All adults 15+ with MCTV who expressed an opinion their service, Q2 2007: Freeview 449, Sky 527, Virgin Media 206 Source: Ofcom communications tracking survey Q1 2007
Length of time with MCTV service
2.13 There is a broad spread of experience of digital MCTV services across the universe of consumers. As would be expected, the majority of Freeview households first received such services within the past three years, whereas more than half of Sky households have had digital TV for six or more years.
Figure 5: Length of time consumers have received MCTV services
19%
11%
26% 14%
13%
15%
14%
39%
53%
57%
16%27%
18%
42%
All
Virgin Media
Sky
Freeview
1 year or less 2 to 3 years 4 to 5 years 6 years or more
Base: All MCTV households (All 1,970, VIRGIN MEDIA 670, Sky 725, Freeview 575) Source: Ofcom pay TV research phase 3
6

Annex 14 to pay TV market investigation consultation - summary of quantitative consumer research
2.14 Indeed, around one in five consumers have switched provider at some point in the past, most commonly those currently with Virgin Media.
Figure 6: Proportion switching MCTV provider
18%
19%
81%
75%
80%
85%
24%
15%
All
Virgin Media
Sky
Freeview
Sw itched Not sw itched
Base: All MCTV households (All 1,970, Virgin Media 670, Sky 725, Freeview 575) Source: Ofcom pay TV research phase 3
Participation in the market
2.15 In our experience, however, actual levels of churn do not give a full picture of consumer participation in communications markets, since consumers may also have evaluated alternatives but decided that they already had the best deal, or they may have renegotiated terms with their existing supplier. Ofcom’s research into consumer decision-making1 therefore uses a series of measures, including actual switching behaviour and information searching, to assess levels of participation in the market2.
2.16 This approach affords the opportunity to make comparisons across individual services and bundled services. To reflect the different ways of buying MCTV services we have separated those with MCTV as a single service from those who buy it as a part of a bundle of other services (generally broadband and/or telephone). Here, we use the term ‘bundle’ to refer to two or more services which are charged to the consumer on a single bill and where the consumer receives a special price for a specific package of services. If these services are provided by the same supplier but with a separate bill, they are not considered to be bundled services.
1 Consumer decision-making in the telecoms and TV broadcast markets, November 2007 2 Each decision maker was allocated a total score out of 100 based on their previous behaviour (with a maximum score of 50) and their current behaviour (again with a maximum score of 50). The resulting Participation Index per service is therefore a maximum of one hundred and a minimum of zero. Once the Participation Index scores associated with the consumer’s previous and current behaviour for a given service have been calculated, the resulting total out of 100 falls into one of four participation categories, as follows: Inactive (Participation Index of 0 out of 100); Passive (Participation Index of 1-30 out of 100); Interested (Participation Index of 31-50 out of 100); Engaged (Participation Index of 51 or more out of 100). Full details of the calculations are given in the Consumer Decision Making report
7

Annex 14 to pay TV market investigation consultation - summary of quantitative consumer research
Table 3: Measuring consumer participation in communications markets
Previous behaviour MCTV
Bundles including
TV Fixed Mobile Broadband
Bundles not
including TV
Switched provider in last 4 years 4% 14% 21% 26% 22% 28%
Considered switching & shopped in last 4 years 3% 10% 3% 5% 9% 4%
Considered switching & did not shop in last 4 years 4% 13% 6% 3% 7% 6%
Not switched, but negotiated with current supplier
1% 3% 2% 4% 6% 7%
None of these 88% 60% 68% 62% 57% 55% Current behaviour
MCTV Bundles including
TV Fixed Mobile Broadband
Bundles not
including TV
Very active considerers (actively looking for an alternative provider)
3% 5% 3% 3% 6% 3%
Active considerers (open to the idea of a new provider) 16% 27% 16% 14% 25% 25%
Not considerers, but happy with current supplier and rate them as definitely the best provider in the market
25% 21% 25% 19% 14% 20%
Not considerers, but happy with current supplier and rate them as probably the best provider in the market
16% 16% 18% 16% 18% 17%
None of these 40% 31% 38% 49% 38% 35% Base: Consumers with each type of service (1018 Fixed, 1211 Mobile, 403 Broadband, 800 MCTV, 384 All bundles, Bundles including TV, 205, Bundles not including TV, 179)
2.17 As shown in MCTV consumers are considerably less active in the MCTV market than in markets for other communications services. Just one in ten of those buying MCTV as a single service are defined as engaged, compared with three in ten of those with bundled services. MCTV consumers are considerably less active in the MCTV market than in markets for other communications services. Just one in ten of those buying MCTV as a single service are defined as engaged, compared with three in ten of those with bundled services.
8

Annex 14 to pay TV market investigation consultation - summary of quantitative consumer research
Figure 7: Consumer participation across services
36%
36%
29%
39%
33%
21%
20%
30%
9%
30%16%
15%
16%
11%
15%
33%
25%
37%
21%
28%Fixed (1018)
Inactive Passive Interested Engaged
Mobile (1211)
Broadband (403)
Multichannel TV (800)
Bundled services (384)
Base: All decision makers Source: Ofcom consumer decision-making research
2.18 While nearly half of all consumers with MCTV as a single service fall into one of the top two participation categories, two in five are ‘inactive’. In addition, levels of ‘engaged’ customers are significantly lower for MCTV than for fixed, mobile, and broadband services.
Figure 8: Consumer participation among those with MCTV as a single service
39%
43%
52%
40%
48%
40%
33%
41%
37%
46%
42%
49%
9%
11%
8%
16%
11%
12%
4%
9%
9%
10%
11%
9%17%
17%
17%
17%
14%
14%
17%
14%
17%
15%
17%
15%
29%
25%
27%
28%
31%
49%
37%
37%
28%
30%
26%
37%ALL (800)
Inactive Passive Interested Engaged
Under £30 per month (123)
£30-£49 per month (219)
£50+ per month (68*)
Aged under 35 (117)
Aged 35-54 (357)
Aged 55+ (313)
ABC1 (466)
C2DE (299)
Average monthly bill (Pay TV)
Age of consumer
Social group
All Pay TV (484)
Basic package (169)
Additional channels (281)
Type of Pay TV package
*Please note, small base sizes are indicated with an asterisk (*) and findings should be treated with caution. Base: All decision makers with MCTV as a single service (800) Source: Ofcom consumer decision-making research
9

Annex 14 to pay TV market investigation consultation - summary of quantitative consumer research
2.19 The demographic variations in participation are much more evident within the MCTV consumer base than within the fixed-line consumer base. Significantly higher levels of participation within the MCTV consumer base are evident among higher-spending, younger consumers.
2.20 There is relatively little difference in levels of participation between those who have basic and premium packages.
Past switching behaviour
2.21 Within the MCTV market detailed in Figure 9, Freeview and pay TV (through satellite and cable) consumers are shown separately, as well as those who have pay TV as part of a bundle.
Figure 9: MCTV single service and bundled - past behaviour
6% 3%
14%4%
10%
2% 5%
13%
2%
3%
3%
Negotiated but not switched
Considered & not shopped
Considered & shopped
Switched in last 4 years
Freeview Bundled Pay TV service
Pay TV single
Base: Decision makers for TV (Freeview 330, Pay TV 470, in bundle 205) Source: Ofcom consumer decision making research
2.22 Participation through past behaviour is at very low levels for the two single service options of Freeview and pay TV (through satellite or cable). Very few of these consumers have switched provider in the past four years or considered doing so.
2.23 By contrast, those with pay TV as part of a bundle show much higher levels of participation, although this participation is more likely to be considering an alternative pay TV supplier (whether the consumer actually shopped for a supplier or not) than actually switching supplier.
Switching and consideration in the past 12 months
2.24 As discussed above, consideration of switching is as important as actual switching when assessing levels of consumer participation in a market.
2.25 Our analysis of communications services markets shows that a majority of consumers have neither switched, nor considered a new provider, in the past 12 months. Activity is, however, notably more common for those with broadband as a single service (35% involved in switching or considering) and those with a bundle of services (also 35%), and notably less common among those with pay TV as a single service (12% involved in switching or considering).
2.26 Those who have a MCTV bundled service are notably more active in the market, perhaps partly due to their greater emphasis on value for money, regularly cited as a key benefit of bundling.
10

Annex 14 to pay TV market investigation consultation - summary of quantitative consumer research
Figure 10: Cross-market comparison of behaviour in the past 12 months
9% 13% 11% 11% 13%
3% 6% 5% 3%4%6% 10%
3%
10% 7%4%
9% 13%8%
77% 74%65%
88%
63%69%
2%
3%3%
7%
4%
None
Considered without looking
Started looking, not switched
Actively looking now
Switched supplier
Fixed Bundle with TV
Mobile Broadband TV Bundle without TV
Base: All decision makers (fixed-line telecoms 1018, mobile telecoms 1211, broadband 403, MCTV as a single service 800, bundle with pay TV 205, bundle without pay TV 179) Source: Ofcom consumer decision-making research
Reasons for switching, and information sources used, in the past 12 months
2.27 The following Figure 11 illustrates spontaneously-mentioned reasons for participating in the market.
Figure 11: Cross-market comparison of reasons for switching or considering switching in the past 12 months
3%
5%
4%
4%
19%
59%
5%
15%
5%
1%
10%
17%
55%
4%
32%
13%
4%
8%
42%
2%
1%
5%
8%
12%
31%
53%
4%
2%
8%
5%
5%
10%
56%
4%
2%
3%
15%
11%
5%
70%
Terms & conditions
Billing
More choice
Better call/text allowance
To bundle services
Customer service
Quality of service
Charges/ affordability
Fixed
Mobile
Broadband
TV*
Bundle with TV*
Bundle w/o TV*
Note: small base sizes are indicated with an asterisk (*) and findings should be treated with caution. Base: All decision makers who changed/looked at changing in the last 12 months (fixed-line telecoms 163, mobile 238, broadband 106, MCTV as a single service 59, bundle with pay TV 51, bundle without pay TV 43) Source: Ofcom consumer decision-making research
11

Annex 14 to pay TV market investigation consultation - summary of quantitative consumer research
2.28 The key reason for switching provider across all services is charges/ affordability. This is most notable for those switching fixed-line provider, and while it is still the most common reason given by those switching, or looking to switch MCTV as a single service provider, mentions are at a lower level than for the other services.
2.29 This lower level of mentions of charges/ affordability from MCTV consumers is countered by much higher mentions (compared to other services) of ‘more choice’ being a factor in the decision to switch provider. In the context of MCTV, ‘choice’ relates to more channels or more digital TV features. Of those who bundle, consumers taking MCTV in their bundle place a much greater emphasis on choice than those without MCTV in their bundle.
Reasons for considering but not switching in the past 12 months
2.30 Three reasons stand out across all platforms among those considering but not switching provider in the past 12 months; satisfaction with existing provider, the perceived hassle of switching and the lack of cost benefit to justify switching.
2.31 Among MCTV customers the main reason given for not switching is the hassle and time involved (25%), followed by satisfaction with the existing provider (22%), and lack of cost benefit (16%). Not switching because of perceived lack of availability of an alternative service provider features for MCTV customers, but not particularly for the other services.
Reasons for not considering switching in the past 12 months
2.32 A majority of all consumers had not switched, and had not considered switching to an alternative provider, in the past 12 months. Figure 12 shows the spontaneous reasons why consumers had not considered switching in the past 12 months.
Figure 12: Cross-market comparison of reasons for not considering switching in the past 12 months
1%
10%
9%
17%
71%
11%
1%
6%
11%
73%
4%
11%
14%
75%
2%
4%
5%
15%
78%
1%
2%
14%
8%
79%
Service availability
Terms & conditions
Hassle
No cost benefit
Insufficiently dissatisfied toswtich
Fixed
Mobile
Broadband
TV
Bundle
Base: All decision who have not considered switching in the last 12 months (fixed-line 781, mobile 920, broadband 237, MCTV 705, bundled services 250) Source: Ofcom consumer decision-making research
12

Annex 14 to pay TV market investigation consultation - summary of quantitative consumer research
2.33 For each service, judging the current supplier to be good enough (or not bad enough) is the key reason for not considering switching provider.
2.34 Secondary reasons are a perceived lack of cost benefit (though less so for fixed-line consumers), and the perceived hassle and time involved (though less so for mobile and MCTV).
2.35 As with reasons for deciding against switching, terms and conditions of the current supplier are a factor for consumers with bundled services, and perceived lack of alternative providers for MCTV consumers.
Negotiating with current supplier
2.36 Clearly only a minority of consumers have experience of approaching and actively negotiating with their current supplier, and a higher proportion will have benefited from a better deal as a result of being proactively offered a new deal by the supplier. While those who have made an approach to their supplier can be judged to be participating, this cannot be said of those who have been approached by their supplier.
2.37 There are indications that those who have approached their supplier to negotiate tend to be younger and in the ABC1 social group, but overall levels of negotiation are very low in the pay TV market.
Table 4: Experience of negotiating with current supplier
5%2%6%4%2%2007
2%
Mobile
3%
Broadband
1%2006
BundlePay TVFixedNegotiated and not switched
5%2%6%4%2%2007
2%
Mobile
3%
Broadband
1%2006
BundlePay TVFixedNegotiated and not switched
Base: All decision makers (fixed-line telecoms 1018, mobile telecoms 1211, broadband 403, MCTV as a single service 800, bundled services 387) Source: Ofcom consumer decision-making research
Current attitudes and behaviour
2.38 As stated earlier, a consumer’s participation is measured both by past behaviour and by current attitudes and behaviour.
2.39 Among those with MCTV as a single service, pay TV customers are significantly more likely than Freeview customers to say that they are happy with their current provider. They are also more likely to be considering other providers.
13

Annex 14 to pay TV market investigation consultation - summary of quantitative consumer research
Figure 13: MCTV: single service and bundled - current behaviour
3% 3% 5%
19%27%
25%30%
21%
17% 16%
16%
16%Happy and probably best
Happy and definitely best
Active considerers
Very active considerers
Freeview Bundled Pay TV service
Pay TV single
Note: ‘best’ means best supplier of service under consideration Base: All decision makers for TV as a single service (Freeview 330, pay TV as a single service 470, as part of a bundle 205) Source: Ofcom consumer decision-making research
2.40 Those with pay TV as part of a bundle of services show significantly higher levels of participation through their current behaviour, as a result of being very active considerers: open to the idea of a new supplier for their MCTV service.
2.41 Overall participation through current behaviour (across all four components) is higher for the two groups of pay TV customers (single service and bundled services) than for Freeview customers.
Attitudes towards switching supplier
2.42 Across each of the services, those with previous experience of switching supplier (although not in the last year) are more open to the idea of a new supplier.
2.43 Among consumers with a bundle of services, those with the broader bundle of fixed-line, TV and broadband are a little more open to a new supplier than those with a bundle of fixed-line and broadband only. Consumers with a bundle of services show more interest in replacing the whole bundle than in replacing parts of the bundle.
14

Annex 14 to pay TV market investigation consultation - summary of quantitative consumer research
Figure 14: Consumers open to a new supplier
72%
24%
3%
69%
27%
5%
82%
16%
3%
69%
25%
6%
83%
14%
3%
81%
16%
3%
Not interested in anew supplier
Open to the idea of anew supplier
Actively looking for anew supplier at the
moment FixedMobileBroadbandMulti-channel TVBundle with TVBundle w/o TV
Base: All decision makers (fixed-line telecoms 1018, mobile telecoms 1211, broadband 403, MCTV as a single service 800, bundle with pay TV 205, bundle without pay TV 179) Source: Ofcom consumer decision-making research
2.44 Across each of the services, those not interested in a new supplier are more likely to be:
• lower spenders on communications services;
• aged 55 and over; and/or
• within the DE social group.
2.45 Participation is therefore generally lower among these consumers. For those with MCTV as a single service, consumers with digital terrestrial TV through Freeview are less interested in a new supplier than those with pay TV through satellite or cable.
Attitudes towards competitiveness of current supplier
2.46 Consumers might reasonably be expected to be more likely to stay with their current provider for a given service if they believe they are getting a good deal financially, and/ or if they believe their provider to be the best in the market.
2.47 Figure 15 compares the extent to which all consumers for each service agree or disagree with the statement ‘Their prices are competitive with other suppliers’.
15

Annex 14 to pay TV market investigation consultation - summary of quantitative consumer research
Figure 15: Attitudes towards the competitiveness of current supplier
30%
51%
35%
36%
42%
32%
45%
23%
38%
23%
30%
27%
4%
7%
5%
8%
5%
7%
9%
4%
7%
3%
6%
3%
6%
7%
3%
6%
8%
20%
17%
22%
6% 7%
9%
7%
Bundle w/o TV
Bundle with TV
Multichannel TV
Broadband
Mobile phone
Fixed line
Agree strongly Agree slightly Neither Disagree slightly Disagree strongly Don't know
Base: All decision makers (fixed-line telecoms 1018, mobile 1211, broadband 403, MCTV as a single service 800, bundled services 384) Source: Ofcom consumer decision-making research
2.48 The relatively high proportion of consumers for each service (in particular for fixed-line, mobile phone and broadband) who are unable to respond to this statement is a clear indication of the lack of participation among some consumers. Having an opinion about the competitiveness of the supplier is certainly higher (and more positive) among those who have ever switched supplier, and lower among those not interested in the idea of a new supplier for each service.
2.49 Despite having the lowest levels of participation in the market, consumers with MCTV as a single service have the greatest certainty that they are with the most competitive supplier, and those with bundled TV are particularly emphatic. This helps to explain the lower levels of reported switching in this market..
2.50 Figure 16 compares the extent to which all consumers for each service agree or disagree with the statement: ‘They are the best provider on the market’.
16

Annex 14 to pay TV market investigation consultation - summary of quantitative consumer research
Figure 16: Attitudes towards current supplier being the best on the market
22%
25%
16%
30%
21%
26%
28%
22%
25%
22%
20%
23%
9%
14%
14%
10%
18%
18%
13%
12%
16%
9%
10%
12%
12%
11%
4%
6%
15%
19%
29%
17%
11% 8%
14%
19%
Bundle w/o TV
Bundle with TV
Multichannel TV
Broadband
Mobile phone
Fixed line
Agree strongly Agree slightly Neither Disagree slightly Disagree strongly Don't know
Base: All decision makers (fixed-line telecoms 1018, mobile telecoms 1211, broadband 403, MCTV as a single service 800, bundled services 384) Source: Ofcom consumer decision-making research
2.51 In terms of being ‘best in market’, a similar, if not higher, proportion of consumers are unable to rate their current supplier; again indicating a lack of participation in the market concerned. This is most evident for mobile phone consumers, but accounts for a significant minority of consumers in each of the other markets.
2.52 While those who have switched provider in the last 12 months are significantly more likely to agree that their supplier’s prices are competitive, this is not the case in terms of their responses about their supplier being the best in the market. Those who have never switched supplier are as likely to agree that their supplier is the best on the market.
Attitudes towards switching supplier
2.53 Consumers were prompted with a series of statements regarding their MCTV services, to discover their attitudes towards switching suppliers.
17

Annex 14 to pay TV market investigation consultation - summary of quantitative consumer research
Figure 17: Attitudes towards switching suppliers – MCTV as a single service
19%
10%
21%
29%
27%
26%
19%
24%
23%
24%
3%
7%
7%
5%
4%
19%
18%
21%
16%
29%
22%
18%
19%
4%
6%
10%
16% 21%
9%
25%
I am willing to consider a brandthat I am unfamiliar with if they
offer a good deal
There is really no difference incosts between suppliers
There is a big risk thatsomething will go wrong in the
process of switching
I don't know enough to makethe right choice of supplier
It is difficult to makecomparisons between suppliers
Agree strongly Agree slightly Neither Disagree slightly Disagree strongly Don't know
Base: All decision makers for MCTV as a single service (800) Source: Ofcom consumer decision-making research
2.54 Responses to the first two statements detailed in Figure 17 indicate that a majority of consumers with MCTV as a single service perceive difficulty in comparing and choosing a MCTV service supplier, with levels of agreement on a par with those from mobile phone consumers.
Figure 18: Attitudes towards switching suppliers: MCTV as part of a bundle
25%
12%
20%
18%
16%
32%
23%
30%
24%
27%
5%
2%
6%
6%
4%
18%
32%
22%
26%
18%
20%
18%
23%
2%
4%
4%
23% 25%
4%
10%
I am willing to consider a brandthat I am unfamiliar with if they
offer a good deal
There is really no difference incosts between suppliers
There is a big risk thatsomething will go wrong in the
process of switching
I don't know enough to makethe right choice of supplier
It is difficult to makecomparisons between suppliers
Agree strongly Agree slightly Neither Disagree slightly Disagree strongly Don't know
Base: All decision-makers for MCTV as part of a bundle (205) Source: Ofcom consumer decision-making research
2.55 Those with a TV bundle, (see Figure 18), are notably more confident in making supplier comparisons, but both types of TV consumer have similar attitudes towards the standard of their supplier.
Likelihood of re-negotiating with current supplier in the next 12 months
2.56 All consumers for each of the services were given a series of possible actions they could take in the next 12 months and were asked to use a five-point scale to describe how likely they were to take each action in the next 12 months.
18

Annex 14 to pay TV market investigation consultation - summary of quantitative consumer research
2.57 Figure 19 shows responses in terms of stated likelihood of renegotiating with the current supplier, for each service, in the next 12 months.
Figure 19: Likelihood of renegotiating with current supplier in the next 12 months
16%
8%
11%
17%
11%
32%
32%
14%
29%
21%
23%
2%
2%
3%
4%
2%
3%
17%
17%
14%
13%
14%
33%
33%
58%
46%
44%
1%
2%
2%
5%
15% 38%
4%
1%
Bundle w/o TV
Bundle with TV
Multichannel TV
Broadband
Mobile phone
Fixed line
Very likely Fairly likely Neither Fairly unlikely Very unlikely Don't know
Base: All decision makers (fixed-line telecoms 1018, mobile telecoms 1211, broadband 403, MCTV as a single service 800, bundled services 384) Source: Ofcom consumer decision-making research
2.58 From Figure 19 it is evident that a significant proportion of consumers of each service see themselves as being likely to renegotiate with their current supplier in the next 12 months. By contrast, we have seen earlier that very few consumers have approached their supplier to match a better deal, and so these levels of claimed future behaviour seem likely to be exaggerated. Those with bundled MCTV are much more likely to renegotiate.
2.59 Across each of the services, those most likely to say they will take this action in the next 12 months are those consumers who are open to the idea of switching supplier, who tend to spend more on the service per month, are younger, and are categorised as ‘engaged’ through their previous and current behaviour.
Likelihood of switching current supplier in the next 12 months
2.60 Figure 20 shows responses in terms of stated likelihood of switching to a different provider for each service in the next 12 months.
19

Annex 14 to pay TV market investigation consultation - summary of quantitative consumer research
Figure 20: Likelihood of switching supplier in the next 12 months
10%
12%
4%
11%
7%
8%
15%
18%
10%
19%
11%
12%
3%
3%
3%
3%
3%
4%
19%
21%
14%
17%
14%
51%
44%
67%
61%
61%
1%
2%
1%
2%
19% 46%
3%
3%
Bundle w.o TV
Bundle with TV
Multichannel TV
Broadband
Mobile phone
Fixed line
Very likely Fairly likely Neither Fairly unlikely Very unlikely Don't know
Base: All decision-makers (fixed-line telecoms 1018, mobile 1211, broadband 403, MCTV as a single service 800, bundled services 384) Source: Ofcom consumer decision-making research
2.61 Compared to the responses shown in Figure 19 regarding likelihood of renegotiating with the current supplier in the next 12 months, fewer consumers state they are likely to switch provider in the next 12 months.
2.62 As with recent experience of switching, the intention to switch is highest among broadband and bundled service consumers, and lowest among consumers of MCTV as a single service.
2.63 Across each of the services, those most likely to say they will take this action in the next 12 months are those who are dissatisfied with their current supplier, open to the idea of switching supplier, tend to spend more on the service per month, are younger, and are categorised as ‘engaged’ through their previous and current behaviour.
20

Annex 14 to pay TV market investigation consultation - summary of quantitative consumer research
Section 3
3 Attitudes of terrestrial analogue TV consumers Switching attitudes
3.1 Thirteen per cent households are currently using a terrestrial analogue service and will need to switch to a digital TV service by 20123 if they are to continue receiving TV services.
3.2 The attitudes of current analogue consumers to MCTV are important, as they enable us to assess the competitive constraint they might place on the pricing of TV products in the lead-up to digital switchover.
3.3 Of the minority still watching only analogue TV, one in four intends to get a digital TV service within the next six months.
Figure 21: Likelihood of switching to digital in the next six months
24%
63%
12%
Yes
No
Don't know
Base: All without digital TV (485) Source: Ofcom communications tracking survey Q1 2007
3.4 Those who do not intend to switch from analogue to digital TV within the next 12 months are generally happy with their existing service and see no need to change. A minority are concerned about costs in general, or their ability to afford digital TV.
3 Earlier in many areas. For full details of the digital switchover timetable, see www.digitaluk.co.uk
21

Annex 14 to pay TV market investigation consultation - summary of quantitative consumer research
Figure 22: Reasons for not intending to switch to digital TV
6%
7%
9%
9%
28%
49%
Would neverwatch
Can't afford it
Too expensivegenerally
Happy to useterrestrial service
Happy to useexisting service
No need
Base: All without digital TV, who do not intend to switch in next 12 months (313) Source: Ofcom communications tracking survey Q1 2007
22

Annex 14 to pay TV market investigation consultation - summary of quantitative consumer research
Section 4
4 Consumer preferences for MCTV services 4.1 This section details the relative importance consumers attribute to elements of their
TV service. This information feeds into our understanding of how the market works and what drives consumer decision-making between MCTV providers.
Main reasons for taking up pay TV
4.2 For both Sky TV and cable subscribers, ‘more channels’ and ‘more sports’ were the top two reasons for subscribing to a pay TV service. Among cable subscribers there was a broadly even split of mentions of ‘more content’ and ‘more sports’, but Sky subscribers were significantly more likely to mention ‘more channels’.
Figure 23: Main reasons for subscribing to pay TV (2005) – spontaneous
17%
17%
4%
4%
2%
5%
6%
25%
23%
16%
16%
2%
2%
7%
10%
10%
22%
42%
Don't know
Other
Documentary channels
Live FAPL
Better picture/reception
Kids channels
Film channels
Sports channels
More channels
Sky TV subscribers
Cable TV subscribers
Base: All GB Pay TV subscribers (Sky 299, cable 93) Note: reasons given by cable TV subscribers include reasons given after the prompt “Are there any reasons why you chose cable TV instead of satellite TV” Source: Ofcom FAPL Omnibus research, March 2005
The importance of individual features and services
4.3 We described several elements of MCTV services to consumers and asked them to identify which of these were important for their household to have; and of those that were important, which:
• needed to be part of their household’s TV services to make them worth having;
• were ‘really good to have’ as part of the TV services; or
• were ‘nice to have’ as part of the TV services.
23

Annex 14 to pay TV market investigation consultation - summary of quantitative consumer research
4.4 Those services identified as ‘needing to be part of the services’, or ‘really good to have’, are considered to be ‘must have’ elements of a household’s TV service.
4.5 Content is most important, both on free-to-air TV and on pay TV, followed by price/cost and the electronic programme guide (EPG). Bundling is important for only 14% of pay TV consumers as a whole, but 48% of cable consumers. The lesser importance of DVRs and bundling compared with other features is likely to reflect the relatively low uptake at the time of the first stage of research in Summer 2006.
Figure 24: Proportion of consumers who cite elements of their TV service as ‘must have’
53%
9%
14%
15%
15%
44%
88%
41%
1%
11%
12%
35%
87%
Price/cost
DVR
Bundling (&DSL/cable)
Provider
Interactivity
EPG
Content
Free-to-AirPay TV
Base: All MCTV household decision-makers (670 FTA, 1338 Pay TV) Source: Ofcom pay TV research phase 1
4.6 Within pay TV EPG and a digital video recorder (DVR) are both cited as significantly more important by Sky subscribers than on other platforms users (49% and 13% respectively).
Preferences for types of content
4.7 Consumers who cited content as ‘must have’ to their TV services were asked which elements of content were most important.
4.8 Earlier qualitative research had revealed that consumers think of their TV content in several ways – sometimes by genres of channel (e.g. ‘comedy’) or specific channels (e.g. ‘E4’); or genres of programme (e.g. ‘Sports’) or specific programmes (e.g. ‘Coronation Street’).
4.9 This diversity was reflected in the quantitative survey results in which consumers selected elements of content from a prompted list. Specific and broad types of programme were a little more important than channels but no one element stands
24

Annex 14 to pay TV market investigation consultation - summary of quantitative consumer research
out. Range or variety of programmes is relatively unimportant, reinforcing the importance of particular content for individual consumers.
Figure 25: ‘Must have’ types of content
1%
26%
12%
52%
52%
72%
58%
1%
20%
19%
1%
41%
49%
73%
65%
<1%
<1%
<1%
No aspect is important
Only range/variety important
Range/variety important
Radio via TV important
PPV/VoD
Genres of channel important
Soecific channels important
Genres of prgramme important
Specific programmes important
Free-to-AirPay-TV
Base: All MCTV households where content is ‘must have’ (405 FTA, 947 Pay TV) Source: Ofcom pay TV research phase 1
4.10 Those who rated programmes or channels as important to their take-up of TV services were asked to spontaneously name what, specifically, was most important to them. Preferences were heterogeneous and tended to be spread over a wide range of content.
4.11 For example, Figure 26 shows that among those with a preference for specific channels, the traditional PSBs are generally the most cited by both Freeview and pay TV consumers, including those with premium pay TV packages. Among pay TV consumers Sky One and Sky Sports are particularly popular4.
4 This stage of the research was conducted whilst Sky One was still available to Virgin Media’s customers
25

Annex 14 to pay TV market investigation consultation - summary of quantitative consumer research
Figure 26: Spontaneous channel mentions amongst those for whom content is ‘must have’
2%
2%
2%
2%
2%
2%
5%
9%
4%
5%
9%
1%
1%
12%
0%
1%
2%
1%
4%
2%
3%
4%
4%
4%
5%
8%
11%
10%
15%
18%
0%
0%
0%
0%
0%
0%
0%
0%
1%
1%
1%
2%
2%
2%
3%
3%
3%
4%
4%
5%
7%
7%
8%
10%
10%
13%
15%
16%
18%
25%
Cartoon Netw ork
Sci-Fi
Hallmark
Sky Movies
Nickelodeon Jr
National Geo
Living
Discovery
MTV
UK Gold
Sky Sports
ITV4
Sky Sports New s
Sky1
TMF
More 4
CBBC
BBC New s 24
History
ITV3
BBC4
CBeebies
Five
ITV2
BBC3
Channel 4
ITV1
BBC2
E4
BBC1
Free-to-Air
Pay-TV
NB Mentions of ‘ITV’ reported with ‘ITV1’ Base: All MCTV household decision-makers for whom content is ‘must have’ (FTA 405, Pay TV 947) Source: Ofcom pay TV research phase 1
26

Annex 14 to pay TV market investigation consultation - summary of quantitative consumer research
4.12 Apart from the most popular soap operas, few specific programmes are consistently mentioned by those consumers for whom such content is ‘must have’. This list is likely to be partly influenced by what was on air when the research took place.
Figure 27: Spontaneous programme mentions among those for whom content is ‘must have’
1%
2%
2%
2%
2%
2%
2%
2%
2%
2%
2%
2%
4%
3%
4%
5%
8%
12%
23%
23%
4%
1%
3%
3%
2%
3%
4%
3%
3%
3%
3%
4%
2%
4%
5%
10%
9%
14%
20%
28%
Springw atch
Holby City
Tw eenies
The Bill
Doctor Who
Top Gear
Desperate Housew ives
Friends
Casualty
CSI
Hollyoaks
Match of the Day
The Simpsons
Neighbours
Lost
Planet Earth
Big Brother
Emmerdale
EastEnders
Coronation Street
Free-to-Air
Pay-TV
Base: All MCTV household decision-makers for whom content is ‘must have’ (FTA 405, Pay TV 947) Source: Ofcom pay TV research phase 1
4.13 Those focusing on genres of channel, especially pay TV consumers, placed greatest emphasis on sports in general. No other type of channel was mentioned by more than one in ten.
27

Annex 14 to pay TV market investigation consultation - summary of quantitative consumer research
Figure 28: Spontaneous mentions of channel genre among those who say content is ‘must have’
5%
6%
9%
6%
7%
12%
5%
11%
25%
4%
4%
5%
6%
8%
8%
9%
10%
12%
Comedy
Music
Documentaries
Drama
Soap Operas
Films
History/Geography
Childrens
Sports (general)
Free-to-Air
Pay-TV
Base: All MCTV household decision-makers for whom content is ‘must have’ (FTA 405, Pay TV 947) Source: Ofcom pay TV research phase 1
4.14 A similar pattern can be seen among those mentioning genres of programme. Sports are again most popular, while soap operas, films and comedy were also highly rated.
28

Annex 14 to pay TV market investigation consultation - summary of quantitative consumer research
Figure 29: Spontaneous mentions of programme genre among those for whom content is ‘must have’
7%
4%
9%
6%
5%
7%
16%
10%
13%
18%
27%
33%
6%
6%
7%
10%
10%
11%
14%
14%
18%
21%
31%
31%
Music
Reality
Childrens
Nature/Animal
News
History/Geography
Documentaries
Drama
Comedy
Films
Soap Operas
Sports (general)
Free-to-Air
Pay-TV
Base: All MCTV household decision-makers for whom content is ‘must have’ (FTA 405, Pay TV 947) Source: Ofcom pay TV research phase 1
4.15 Regardless of whether mentioning programmes or channels, specifically or in general, the heterogeneity of choice remains consistent, as does the relative importance of types of content.
4.16 This is reinforced when comparing stated consumer preferences against the revealed preferences of BARB data. As Figure 30 shows, there is no direct correlation between the most frequently mentioned channels and their audience share. Channels such as E4 and BBC3 are watched relatively infrequently but receive high ‘must have’ scores, while Channel 4 and ITV1 have low ‘must have’ scores compared to their audience share.
4.17 This seems to imply that it is often specific content on ‘must have’ channels, rather than the channel in general, that is important to consumers.
29

Annex 14 to pay TV market investigation consultation - summary of quantitative consumer research
Figure 30: Digital satellite audience share and viewing preferences
BBC1
ITV1
E4
Sky1
BBC2
Channel 4Discovery
FiveUKTV Gold
Sky Sports 1
MTVBBC3
Living
ITV2CBeebies
0%
2%
4%
6%
8%
10%
12%
14%
16%
18%
20%
0% 5% 10% 15% 20%
BARB audience share %
men
tione
d as
mus
t hav
e in
pha
se 1
rese
arch
Phase 1 data on most channels cited as key June / July 2007 for Freesat consumers and Sky subscribers from June July 2006. Base: 405u / 421w, expressed as percentage of consumers who thought content ‘must have’: 692w BARB: Q2 2006 audience share among DSat individuals. Figures based on main programme/channel, excludes repeat showing and Omnibus Note: Phase 1 data on channels cited as key to take-up of package, ITV1 includes ITV1 and ITV unspecified; Sky Sports 1 includes Sky Sports 1 and Sky Sports. Note BBC Three only broadcast after 7pm
Preferences for other elements of TV services
4.18 In the first phase of Ofcom’s research for the pay TV market investigation, conducted in summer 2006, we investigated the relative importance of DVRs and bundling of services in the decision-making process (see Figure 24, above). While the significantly greater penetration of these services by late 2007 means that the overall shape of the market has changed since the research took place, the implications for individual consumers remain relevant.
4.19 Although only 10% had a DVR, almost all of whom were with Sky, this group were very committed to their digital recorder. Seven in ten Sky+ consumers said it was a key part of their TV service, more than half of whom said it had to be part of their package to make the service worth having (69% and 38% respectively).
4.20 Cable companies have offered TV bundled with other services since 1991; Sky has sold a bundled broadband and phone call service since 2002. In the summer 2006 survey, most bundled consumers were with a cable platform; 51% of these stated that bundling was key to their service, including 27% who said it had to be part of their TV service to make the service worth having.
30

Annex 14 to pay TV market investigation consultation - summary of quantitative consumer research
Section 5
5 Sports and film 5.1 This section examines consumer interest in sports and film content in general, and
preferences for watching this content on TV.
Relative importance of premium content
5.2 To establish what drove the purchasing of packages combining Sky Movies and Sky Sports, on both the Sky and Virgin Media platforms, we asked those who subscribed to both to say whether:
• they subscribe to Sky Movies because they wanted Sky Sports, and Sky Movies did not cost much extra;
• films are important to them, and having Sky Movies is as important as having Sky Sports; or
• They subscribed to Sky Sports because they wanted Sky Movies, and Sky Sports did not cost much extra.
5.3 A diversity of attitudes emerged, with Sky Sports being most important for around half of consumers, and Sky Movies the dominant set of channels for a quarter. There was little difference between Sky and Virgin Media consumers.
Figure 31: Relative importance of Sky Sports and Sky Movies to subscribers
47% 23% 23%
Sky Sports important Equally important Sky Movies important
Base: All MCTV households subscribing to Sky Sports and Sky Movies (450) Source: Ofcom pay TV research phase 3
5.4 This is reflected in what consumers say they would do if some premium content were unavailable. While most of those with both sets of channels would keep Sky Sports if Sky Movies were withdrawn, fewer would stay with Sky Movies if the opposite occurred. Very few subscribing solely to Sky Movies saw it as a direct substitute for Sky Sports, and vice versa.
31

Annex 14 to pay TV market investigation consultation - summary of quantitative consumer research
Table 5: Reaction to withdrawal of premium channels
Take this action
Option Yes No
Continue subscribing to Sky Sports if Sky Movies not available Base: all subscribing to Sky Sports and Sky Movies (450)
80% 19%
Continue subscribing to Sky Movies if Sky Sports not available Base: all subscribing to Sky Sports and Sky Movies (450)
60% 38%
Switch to Sky Movies if Sky Sports not available Base: all subscribing to Sky Movies only (101)
7% 92%
Switch to Sky Sports if Sky Movies not available Base: all subscribing to Sky Sports only (160)
11% 87%
Source: Ofcom pay TV research phase 3
Interest in sports
5.5 Sport as a whole is of interest to two-thirds of consumers. Around one in six are passionate about sport, most commonly those with Sky TV. Across all pay TV platforms, 32% of Sky Sports subscribers describe themselves as passionate, rising to 34% of those who also subscribe to Setanta (not a significant difference).
5.6 The profile of those who subscribe only to Setanta, rather than to Sky Sports as well, is similar to the population as a whole, while Sky Movies-only consumers are considerably less interested in sport.
Figure 32: Interest in sport in general
33% 35%30% 34%
44%
61%
16% 19%29%
29%29%
21%
36%
29%
21%
19% 16%
27%
22% 20%
26%
19% 17%
9%
33% 32%
28%
16% 15%23%
10% 10%5%
32% 34%
14%
All VirginMedia
Sky Freeview BasicPay TV
SkyMovies
only
SkySports
SkySports +Setanta
Setantaonly
Passionate
Follow closely
Interested
No interest
Base: All MCTV households (All 1,970, Virgin Media 670, Sky 725, Freeview 575, basic pay 684, Sky Movies only 101, Sky Sports/Sky Sports + Sky Movies 610. Sky Sports + Setanta 218, Setanta only 112) Source: Ofcom pay TV research phase 3
32

Annex 14 to pay TV market investigation consultation - summary of quantitative consumer research
Watching sports on TV
5.7 Those who are interested in sport tend to watch fairly regularly, seven in ten doing so at least once a week. As would be expected, Sky Sports subscribers watch sport more often: 68% at least three times a week, compared with 42% overall and just 26% of Freeview consumers.
5.8 Those with Sky Sports and Setanta are the most frequent viewers, 71% watching at least three times a week, compared with 45% of those with Setanta only. But the difference between Sky Sports consumers with and without Setanta is not statistically significant, suggesting that adding the extra channels to their TV package does not lead to a notable increase in sports viewing on TV.
Figure 33: Watching sport on TV
42%
58%
30%
68%
71%
45%
31%
34%
27%
36%
24%
26%
38%
14%
16%
7%
18%
10%
13%
9%
8%
18%
16%
4%
3%
7%
41%
26% 35%
4%
21%
All
Virgin Media
Sky
Freeview
Basic Pay TV
Sky Sports
Sky Sports + Setanta
Setanta only
At least three times a week At least once a week At least once a month Less than once a month
Base: All MCTV households interested in sport (All 1,302, Virgin Media 452, Sky 474, Freeview 376, basic pay TV 381, Sky /Sports+Sky Movies 507, Sky Sports+Setanta 182, Setanta only 75 (caution – small base size) Source: Ofcom pay TV research phase 3
5.9 As the highlighted cells in Table 6 show, sports news programmes and live sporting events are most popular among regular viewers. While three in ten have never watched a near-live event, two in ten say they do so at least three times a week – predominantly those with Sky who make up the majority of regular sports viewers in the Ofcom research.
33

Annex 14 to pay TV market investigation consultation - summary of quantitative consumer research
Table 6: Types of sports programmes watched on TV
General sports
entertainment programmes
General sports news programmes
Sports highlights
programmes
Live sporting
events and fixtures
Near-live sporting
events and fixtures
At least three times a week
19% 49% 28% 47% 19%
At least once a week 39% 20% 55% 40% 30%
At least once a month
8% 7% 7% 8% 9%
Less than once a month
7% 4% 3% 3% 6%
Never 17% 18% 7% 2% 32%
Base: All regular sports viewers (at least three time a week) (All 559, Virgin Media 209, Sky 252, Freeview 98) Source: Ofcom pay TV research phase 3
5.10 Consumers cite a diverse set of reasons for watching sport on TV. For more than one in three it is to watch a specific sport, or sport generally, while a similar proportion are interested in a range of sports and teams (34% and 37% respectively). There are no significant differences in motivation between viewers of different platforms, or by package.
Figure 34: Main reasons for watching sport on TV (multi-coded)
2%
19%
29%
34%
37%
Interactive services
Specific competition or event
Specific team's games
Specific sport or sports
Range of sports and teams
Base: All regular sports viewers (559) Source: Ofcom pay TV research phase 3
34

Annex 14 to pay TV market investigation consultation - summary of quantitative consumer research
5.11 Generally there is little difference in the interests of regular sports viewers on different platforms and packages.
Figure 35: Main reasons for watching sport on TV (multi-coded) – by type of consumer
2%
19%
31%
32%
38%
1%
19%
27%
40%
36%
2%
20%
26%
33%
39%
Interactive services
Specific competitionor event
Specific team'sgames
Specific sport orsports
Range of sports andteams
Pay TV with Sky Sports Pay TV no Sky Sports Freeview
Base: All regular sports viewers (Freeview 98, Pay TV no Sky Sports 125, pay TV with Sky Sports 336) Source: Ofcom pay TV research phase 3
The appeal of types of content
5.12 Football is undeniably the most valued sport. Nearly six in ten of those who say that a specific sport is their main reason for watching sport on television spontaneously cite football as one that they must have to make their service worth having. This is three times higher than for any other sport.
35

Annex 14 to pay TV market investigation consultation - summary of quantitative consumer research
Figure 36: Relative importance of sports that are regularly watched on TV†
28%
15%
16%
13%
12%
17%
16%
59%
20%
17%
12%
9%
9%
6%
16% 12%
Football
Cricket
Rugby Union
Tennis
Rugby League
Athletics
Golf
Motor Racing
Not important Nice to have Must have
† Caution – small base sizes for all sports except football Base: All regular sports viewers who watch a specific sport or sports (190) Source: Ofcom pay TV research phase 3
5.13 Among consumers for whom a specific event is a main reason for watching sport on TV, no one competition stands out. Football events are the most popular, but tennis, rugby and cricket are also valued by a significant proportion of sports viewers.
Figure 37: Relative importance of specific sports events regularly watched†
33%
33%
46%
29%
32%
28%
30%
25%
21%
21%
19%
24%
12%
18%
55%
52%
35%
36%
33%
27%
29%
15%
22%
25%
20%
19%
17%
18%
11%
27%
Football - World Cup
Football - Premier League
Football - FA Cup
Football - Champions League
Football - European Championship
Football - England Matches
Tennis - Wimbledon
Football - Carling Cup
Rugby - Rugby World Cup
Rugby - Six Nations Championship
Cricket - One Day Internationals
Olympics
Cricket - Test Match Cricket
Cricket - World Cup
Motorsports - Formula 1
Not important Nice to have Must have
† Caution – small base sizes for all events Base: All regular sports viewers who watch a specific competition or event (106) Source: Ofcom pay TV research phase 3
5.14 The importance of sport as a driver of pay TV subscriptions is underlined by the spontaneous reasons cited by existing pay TV customers when explaining their
36

Annex 14 to pay TV market investigation consultation - summary of quantitative consumer research
decision to switch. More than two in five said that sports channels were a main reason, second only to more channels in general.
5.15 Figure 38 reinforces the importance of football as the most important element of sports content. A third of Sky Sports consumers spontaneously cited this as a reason for their subscription.
Figure 38: Main reasons for subscribing to Sky Sports (2005) – spontaneous
41%
35%
12%
5%
3%
3%
2%
6%
4%
Took whole package
Live FAPL matches
Sports (general)
Football (general)
Rugby
Other sport
Cricket
Other
Don't know
Base: All GB Sky Sports subscribers (162) Source: Ofcom FAPL Omnibus research, March 2005
Sports viewing by platform, channel type and type of sport
5.16 As Figure 38 shows, terrestrial channels have a significant share of sports viewing, even on pay TV platforms. On satellite, the Sky channels have a share of more than half of all viewing, significantly different from the pattern on cable.
5.17 This may reflect the different subscriber profiles, with the large majority of cable customers on a basic package, whereas many Sky subscribers pay for a premium package.
37

Annex 14 to pay TV market investigation consultation - summary of quantitative consumer research
Figure 39: Viewing of sport by platform and channel type
61%
71%
39%
31%
21%
29%
52%
8%
8%
18%
9%
100%
53%
All homes
Analogue terrestrial
Digital terrestrial
Digital cable
Digital satellite
Terrestrial channels Sky channels Other digital channels
Source: BARB Q3 2007/TNS Infosys. All programmes categorised as BARB sport genre shown in 4+ areas. Represents total time an average viewer spent watching in time period. Digital terrestrial covers all those with access to DTT, including households where DTT is the only MCTV service. Terrestrial channels refer to BBC1,BBC2, ITV1, Channel 4 and Five. Sky channels include Sky One, Sky Sports 1, Sky Sports 2, Sky Sports 3, Sky Sports Extra, Sky Sports News.
5.18 Football is by some margin the most popular sport on UK TV overall, with viewing particularly high (as might be expected) on the satellite platform. Note that the relative popularity of individual sports in Figure 40 is partly a reflection of what was in season when this BARB data was collected, between July and September 2007 – for example, this was the peak period for cricket internationals, but the off-season for domestic football.
38

Annex 14 to pay TV market investigation consultation - summary of quantitative consumer research
Figure 40: Viewing of sport by platform (total minutes viewed per person Q3 2007)
25
120
38
55
71
17
135
146
168
169
256
19
122
68
4
96
19
194
166
251
155
242
253
140
19
11
54
103
84
113
123
138
310
339
203
25
101
48
231
113
142
114
149
450
174
153
36
56
64
112
130
143
155
156
335
Miscellaneous
Other
Horse Racing
News
Athletics
Cricket
Golf
Motor Racing
Tennis
Rugby Union
Football
Digital terrestrial Analogue terrestrial Cable Satellite All platforms
Source: BARB Q3 2007/TNS Infosys. All programmes categorised as BARB sport genre shown in 4+ areas. Represents total time an average viewer spent watching sports in time period
39

Annex 14 to pay TV market investigation consultation - summary of quantitative consumer research
Interest in movies
5.19 We asked MCTV household decision-makers how often they watched films through a series of outlets. Bearing in mind service penetration and frequency of viewing, basic and free-to-air TV channels are by far the most popular way to watch films.
5.20 Sky Movies subscribers tend to be the most frequent viewers, one in five watching a movie through this set of premium channels every day. Interestingly, this group also claims a very similar level of film viewing, through each other option, to those without Sky Movies, implying that premium subscribers watch a greater number of films overall.
Figure 41: Frequency of watching films
7%
27%
71%
89%
11%
15%
39%
15%
18%
21%
25%
11%
43%
41%
8%
2%
2%
13%
36%
9%
5%
44%
3%
17%
20%Sky Movies channels*
Basic TV package
DVDs - bought
At the cinema
DVDs - rent in store
DVDs - rent by post
Never Less than once a month At least once a month At least once a week Every day
Base: All MCTV households (1970) except *Sky Movies subscribers (551) Note: Respondents from multiple-occupancy households answered regarding their personal behaviour rather than the household’s as a whole Source: Ofcom pay TV research phase 3.
5.21 Looking at Sky Movies consumers in more detail, it is clear that access to a greater range of movies is the most important element of their service. Four in ten consider this ‘must have’ –something that must be part of the service to make it worth having as shown in. Those who subscribe to Sky Movies only, rather than in conjunction with Sky Sports, are more likely to rate these features as ‘must have’, but the overall ratings are not significantly different between these two groups of consumers.
40

Annex 14 to pay TV market investigation consultation - summary of quantitative consumer research
Figure 42: Importance of aspects of Sky Movies channels
42%
31%
30%
30%
27%
41%
32%
42%
43%
14%
33%
26%
29%
35% 34%
Wide range
Can pay monthly
Access to new releases
Convenience of not renting a DVD
Films at all times
Must have Nice to have Not important
Base: All Sky Movies subscriber (202) Source: Ofcom pay TV research phase 2
5.22 Among those who have the option to subscribe to Sky Movies, but choose not to do so, there is broad agreement that this package of channels is too expensive.
Table 7: Non-subscribers’ perceptions of Sky Movies
Disagree Agree Net agree5
Sky Movies is too expensive 11% 77% +66
Like to watch films at my convenience, rather than watching them at a scheduled time
24% 73% +49
Prefer to watch the latest films sooner, when they come out at the cinema or on DVD
44% 50% +6
Sky Movies does not show movies I like to watch 45% 32% -13
Base: All MCTV households that have the option to subscribe to Sky Movies but do not subscribe (312) Source: Ofcom pay TV research phase 2
5 Net agree = % agree minus % disagree i.e. the ‘balance of opinion’
41