SUMMARY OF FINDINGS - National Sleep Foundation The National Sleep Foundation commissioned WB&A...
77
Prepared by: Job #05-638 National Sleep Foundation 1522 K Street NW, Suite 500 Washington, DC 20005 Ph: (202) 347-3471 Fax: (202) 347-3472 www.sleepfoundation.org SUMMARY OF FINDINGS © National Sleep Foundation 2006
Transcript of SUMMARY OF FINDINGS - National Sleep Foundation The National Sleep Foundation commissioned WB&A...

0
Prepared by:
Job #05-638
National Sleep Foundation1522 K Street NW, Suite 500
Washington, DC 20005Ph: (202) 347-3471Fax: (202) 347-3472
www.sleepfoundation.org
SUMMARY OF FINDINGS
©National Sleep Foundation 2006
1
Objectives ........................................................................................................................................ 2
Methodology..................................................................................................................................... 3
Summary of Findings
Sleep Behaviors/Habits............................................................................................................. 6
Sleep Problems......................................................................................................................... 33
Driving Drowsy.......................................................................................................................... 50
Characteristics of Respondents/Sleep Profiles......................................................................... 54
Appendix
Adolescent BMI Calculation...................................................................................................... 66
Questionnaire ........................................................................................................................... 67
Page
Table of Contents

2
The National Sleep Foundation commissioned WB&A Market Research to conduct a national survey of caregivers and their adolescent children (age 11-17 and in 6th to 12th grade) living within the United States – the NSF 2006 Sleep in America poll.
The primary objectives of this research were to answer the following questions:
1. What are the sleep habits of adolescents?
2. How many adolescents experience various types of sleep problems/disorders?
3. How often do adolescents experience sleep problems/disorders?
4. How does daytime sleepiness affect adolescents?
5. What are adolescents’ experiences with driving drowsy?
Objectives
NSF wishes to acknowledge the volunteer work of the members of its 2006 Poll Task Force. In appreciation of task force members:Mary A. Carskadon, PhD, Brown Medical School and E.P. Bradley Hospital, Providence RI; Jodi A. Mindell, PhD, Saint Joseph’s University and The Children’s Hospital of Philadelphia, Philadelphia, PA; and Christopher Drake, PhD, Henry Ford Health System, Detroit, MI.

3
Methodology
In order to collect the information, a total of 1,602 telephone interviews were conducted among a random sample of caregivers and their adolescent children between September 19, 2005 and November 29, 2005.
In order to qualify for this study, adult participants had to be the primary caregiver or someone who shares equally in the childcare of an adolescent in grades 6-12 (ages 11-17). Adolescent participants had to be in grades 6-12 and ages 11-17. All households surveyed were within the continental United States. The survey was administered in two parts. First, the caregivers were asked a series of questions about their adolescent’s sleep. Next, the adolescents were asked a series of separate questions about their sleep. The combined survey averaged 25 minutes in length.
A random sample of telephone numbers was purchased from SDR Consulting, Inc. and quotas were established by grade and race, with minority respondents being oversampled. In addition, quotas were established by region, based on U.S. Census household data. A similar number of males and females were interviewed. The data were weighted to reflect equal proportions of respondents by grade, as well as the actual distribution of race based on the U.S. Census. For Spanish-speaking households, respondents were given the option to complete either or both portions of the survey in English or Spanish.
Completed Interviews
1,602
312
562
409
319
14
59
292
263
974
803
799
(number of respondents)
100%
19%
35%
26%
20%
1%
4%
18%
16%
61%
50%
50%
(%)
TOTAL
West
South
Midwest
Northeast
Region
Refused
Other
Hispanic
African-American
White
Race
Females
Males
Gender
Quotas
Professional interviewers called from WB&A’s telephone interviewing facility located in Crofton, Maryland. Approximately 80% of the interviewing was conducted on weekdays between 5:00 pm and 9:00 pm, Saturdays between 10:00 am and 2:00 pm, and Sundays between 4:00 pm and 8:00 pm. The remaining interviews were conducted on weekdays between 9:00 am and5:00 pm. (All times are in Eastern Standard Time.)
In survey research, the entire population is typically not interviewed, but rather a sample of that population is polled. Therefore, the data are subject to sampling error. The maximum sampling error of the data for the total sample of 1,602 interviews is ±2.4 percentage points at the 95% confidence level. The sampling error will vary depending on the sample size and the percentages being examined in the sample.
The response rate for this study was 27% (number of completed interviews divided by the number of completed interviews plus the number of contacted households who refused participation or did not complete appointments, factored by the overall incidence of 22%).

4
Methodology (continued)
Geographic Distribution of Respondents
The following map illustrates the geographic distribution of the respondents in the NSF 2006 Sleep in America poll, which is generally representative of the distribution of the U.S. population.
5
Summary of Findings
6
Sleep Behaviors/Habits
7
Don't know /Refused
4%
Borderline31%
Insufficient45%
Optimal20%
Adolescent’s Reported Amount of Sleep on School Nights
Total 6th – 8th grade 6th grade 7th grade 8th grade
9th – 12th grade 9th grade 10th grade 11th grade 12th grade
B C D E F G H I J
n= (1,602) (710) (228) (238) (244) (892) (233) (239) (221) (199) Net: Less than 9 hours 75% 59% 49% 61%C 67%C 87%B 78%CDE 87%CDEG 89%CDEG 95%CDEGHI
Insufficient (Less than 8 hours) 45 21 16 22 27C 62B 43CDE 63CDEG 67CDEG 75CDEGH
Borderline (8 to less than 9 hours) 31 38F 33HIJ 39HIJ 40HIJ 25 35HIJ 24 23 20
Optimal (9 or more hours) 20 35F 41DEGHIJ 32GHIJ 30GHIJ 9 17IJ 11IJ 6 3
Mean (# of hours) 7.6 8.2F 8.4EGHIJ 8.1GHIJ 8.1GHIJ 7.2 7.6HIJ 7.3IJ 7.0 6.9
Don’t know/Refused 4 6F 9EHIJ 7HJ 3 3 5HJ 1 4 1
Adolescent’s Reported Amount of Sleep on School Nights
Base = Total AdolescentsLetters indicate significant differences at the 95% confidence level.C6
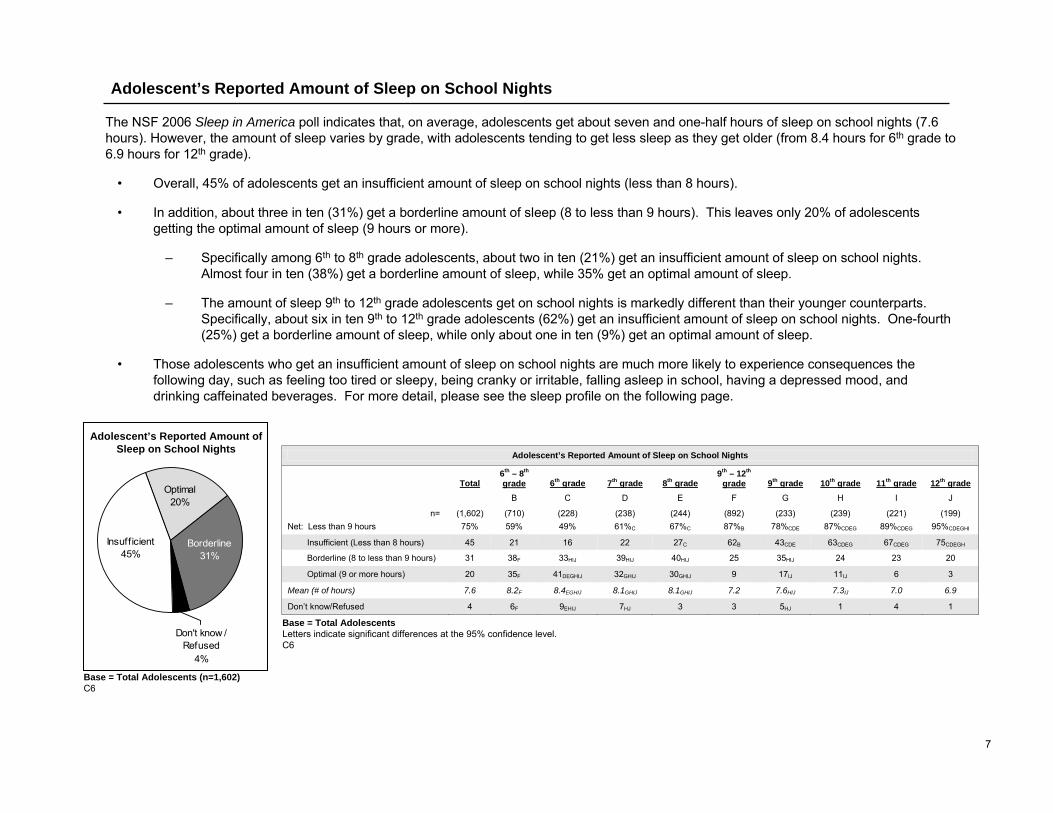
The NSF 2006 Sleep in America poll indicates that, on average, adolescents get about seven and one-half hours of sleep on school nights (7.6 hours). However, the amount of sleep varies by grade, with adolescents tending to get less sleep as they get older (from 8.4 hours for 6th grade to 6.9 hours for 12th grade).
• Overall, 45% of adolescents get an insufficient amount of sleep on school nights (less than 8 hours).
• In addition, about three in ten (31%) get a borderline amount of sleep (8 to less than 9 hours). This leaves only 20% of adolescents getting the optimal amount of sleep (9 hours or more).
– Specifically among 6th to 8th grade adolescents, about two in ten (21%) get an insufficient amount of sleep on school nights. Almost four in ten (38%) get a borderline amount of sleep, while 35% get an optimal amount of sleep.
– The amount of sleep 9th to 12th grade adolescents get on school nights is markedly different than their younger counterparts. Specifically, about six in ten 9th to 12th grade adolescents (62%) get an insufficient amount of sleep on school nights. One-fourth (25%) get a borderline amount of sleep, while only about one in ten (9%) get an optimal amount of sleep.
• Those adolescents who get an insufficient amount of sleep on school nights are much more likely to experience consequences the following day, such as feeling too tired or sleepy, being cranky or irritable, falling asleep in school, having a depressed mood, and drinking caffeinated beverages. For more detail, please see the sleep profile on the following page.
Adolescent’s Reported Amount of Sleep on School Nights
Base = Total Adolescents (n=1,602)C6

8
Amount of Sleep Reported on School Nights Insufficient
(< 8 hours) Borderline
(8 - < 9 hours) Optimal
(9 + hours) B C D
(699) (493) (336)
At least a few days/nights a week
Difficulty falling asleep 35%CD 26% 23%
Difficulty staying asleep 21D 18 13
Fallen asleep in school 18CD 8D 3
Had trouble getting along with family 24CD 16 17
Felt too tired or sleepy during the day 44CD 25D 19
Fallen asleep while doing homework/studying 13CD 4 5
Felt cranky or irritable during the day 28CD 20D 13
Arrived late or missed school because you overslept 6 4 4
Felt too tired to do exercise or other physical activity 21CD 13D 7
Snored 15 18D 12
At risk for RLS 10CD 6 5 Sleep problem
Parent thinks adolescent has (Yes) 9%C 5% 6% Adolescent thinks has (Yes/Maybe) 24CD 11 7
BMI Underweight/Normal 69% 66% 69% At risk for overweight 13 12 14 Overweight 14 14 11
Depressive mood score* 10-<15 37% 50%B 56%B 15-<20 40D 38D 30
20-30 22CD 11 13 5+ hours/week Sports/Exercise 48% 51% 48% Extracurricular activities 31CD 26 24 Work at paying job 10+ hours/week 18%CD 7%D 3% Drink caffeinated beverages 2+ cups/cans per day 36%CD 29%D 22% Grades As 25% 29% 34%B
As and Bs/Bs 49 48 46 Bs and Cs or worse 25D 23 18
Insufficient (< 8 hours)
Borderline (8 - < 9 hours)
Optimal (9 + hours)
B C D
(699) (493) (336)
Set bedtime on school nights
Yes 58% 78%B 89%BC
Adult involved in waking adolescent on school days
Yes 62% 70%B 74%B
Length of time taken to fall asleep on school nights
Less than 10 minutes 24% 24% 29% 10 to 29 minutes 43 55B 49 30 minutes or more 32CD 21 21
Hours slept on non-school nights
Insufficient (Less than 8 hours) 22%CD 16%D 7%
Borderline (8 to less than 9 hours) 28CD 16 15
Optimal (9 or more hours) 48 66B 75BC
Mean (# of hours) 8.5 9.0B 9.6BC
Parent believes adolescent gets enough sleep on school nights
Every night/Almost every night 60% 78%B 84%BC
Quality of adolescent’s sleep
Fair/Poor 13%CD 7% 4%
“I had a good night’s sleep” Every night or almost every night 25% 51%B 59%BC A few nights a month or less 32CD 15D 10
Actual vs. minimum hours of sleep needed (school nights)
Get less sleep than needed 80%CD 49%D 26%
Get the same amount of sleep as needed 11 37B 35B
Get more sleep than needed 8 12B 38BC Lark or owl
Lark (Morning person) 26% 41%B 44%B Owl (Evening person) 65CD 50 46
Sleep Profile – Amount of Sleep Reported on School Nights
* Please refer to page 44 of the Summary of Findings for an explanation of the depressive mood score.

9
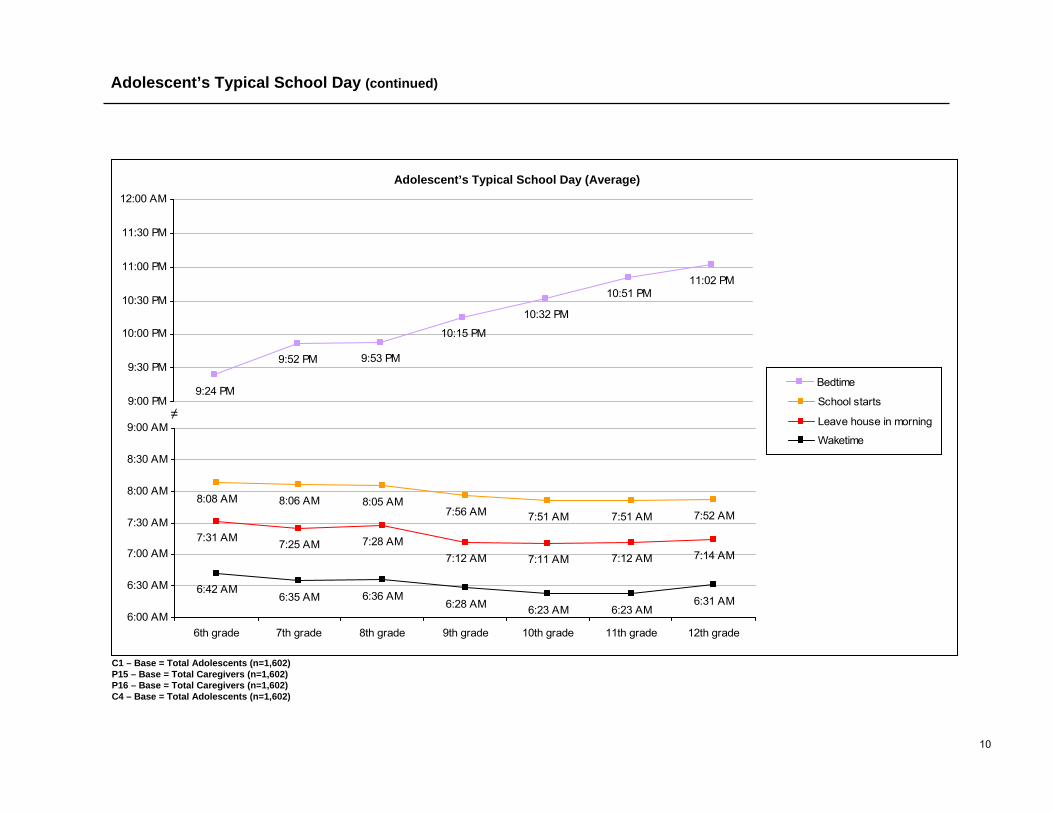
The chart on the following page outlines the typical school day of an adolescent.
• On a typical school day, adolescents generally wake up around 6:30 am, regardless of grade (average between 6:23 am and 6:42 am, median between 6:16 am and 6:40 am).
• Middle school (6th to 8th grade) adolescents generally leave the house in the morning around 7:30 am (average between 7:25 am and 7:31 am, median at 7:30 am), while 9th to 12th grade adolescents leave slightly earlier, around 7:10 am (average between 7:11 am and 7:14 am, median at 7:12 am).
• For most adolescents, school begins around 8:00 am, with 6th to 8th grade adolescents having a typical school start time slightly after 8:00 am (average between 8:05 am and 8:08 am, median at 8:00 am) and 9th to 12th grade adolescents having a typical school start time slightly before 8:00 am (average between 7:51 am and 7:56 am, median between 7:45 am and 8:00 am).
• Actual bedtimes, as reported by the adolescents themselves, get later as adolescents age. While middle school (6th to 8th grade) adolescents generally go to bed between 9:30 pm and 10:00 pm (average between 9:24 pm and 9:53 pm, median between 9:11 pm and 10:01 pm). High school (9th to 12th grade) adolescents typically go to bed between 10:00 pm and 11:00 pm (average between 10:15 pm and 11:02 pm, median between 10:08 pm and 10:33 pm).
– Among 6th to 8th grade adolescents, six in ten (60%) go to bed before 10:00 pm on school nights.
– Among 9th to 12th grade adolescents, about four in ten (43%) go to bed between 10:00 pm and 10:59 pm, and 38% go to bed after 11:00 pm. About one-half(54%) of the 12th grade adolescents surveyed go to bed after 11:00 pm on school nights.
Adolescent’s Typical School Day
10
8:06 AM 8:05 AM7:56 AM 7:51 AM 7:51 AM 7:52 AM
6:42 AM6:35 AM 6:36 AM
6:28 AM 6:23 AM 6:23 AM6:31 AM
8:08 AM
7:14 AM7:12 AM7:11 AM7:12 AM7:28 AM7:25 AM7:31 AM
6:00 AM
6:30 AM
7:00 AM
7:30 AM
8:00 AM
8:30 AM
9:00 AM
6th grade 7th grade 8th grade 9th grade 10th grade 11th grade 12th grade
School starts
Leave house in morning
Waketime
9:52 PM 9:53 PM
10:15 PM
10:32 PM
11:02 PM10:51 PM
9:24 PM9:00 PM
9:30 PM
10:00 PM
10:30 PM
11:00 PM
11:30 PM
12:00 AM
Bedtime
Adolescent’s Typical School Day (Average)
Adolescent’s Typical School Day (continued)
C1 – Base = Total Adolescents (n=1,602)P15 – Base = Total Caregivers (n=1,602)P16 – Base = Total Caregivers (n=1,602)C4 – Base = Total Adolescents (n=1,602)
≠
11
6.5
7.0
7.5
8.0
8.5
9.0
9.5
6th grade 7th grade 8th grade 9th grade 10th grade 11th grade 12th grade
(in h
ours
) Average hours slept onnon-school nights
Average hours slept onschool nights
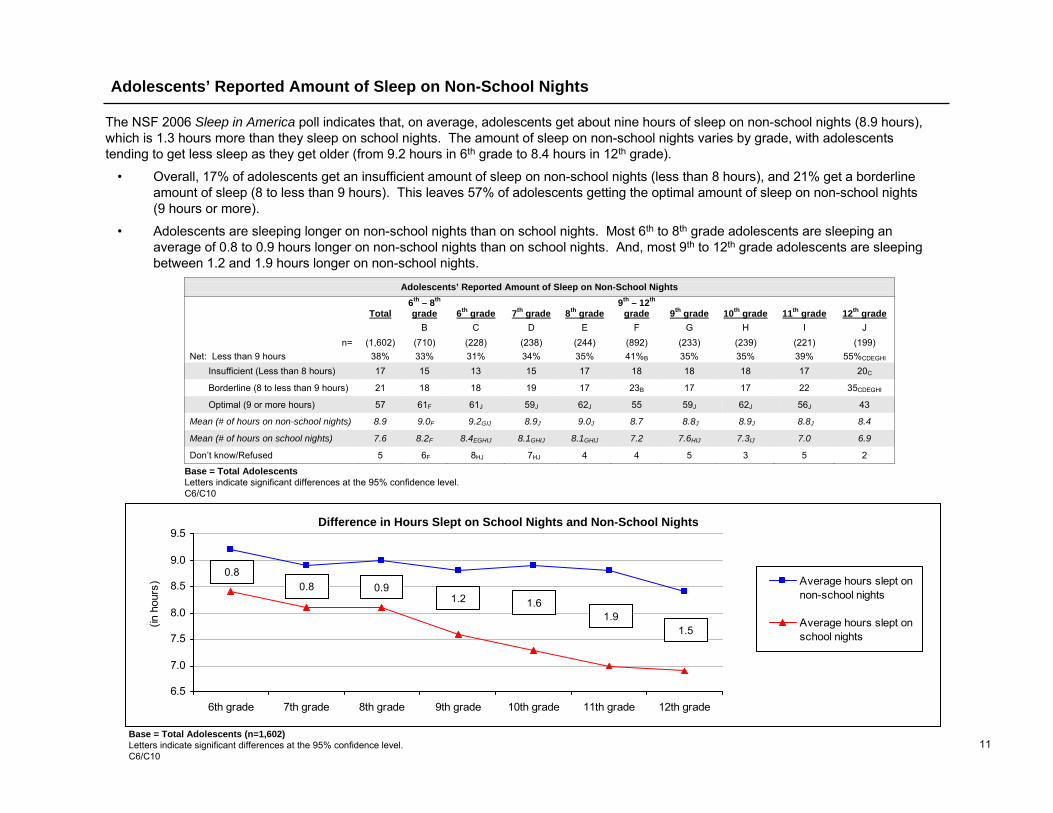
The NSF 2006 Sleep in America poll indicates that, on average, adolescents get about nine hours of sleep on non-school nights (8.9 hours), which is 1.3 hours more than they sleep on school nights. The amount of sleep on non-school nights varies by grade, with adolescents tending to get less sleep as they get older (from 9.2 hours in 6th grade to 8.4 hours in 12th grade).
• Overall, 17% of adolescents get an insufficient amount of sleep on non-school nights (less than 8 hours), and 21% get a borderline amount of sleep (8 to less than 9 hours). This leaves 57% of adolescents getting the optimal amount of sleep on non-school nights (9 hours or more).
• Adolescents are sleeping longer on non-school nights than on school nights. Most 6th to 8th grade adolescents are sleeping an average of 0.8 to 0.9 hours longer on non-school nights than on school nights. And, most 9th to 12th grade adolescents are sleeping between 1.2 and 1.9 hours longer on non-school nights.
Adolescents’ Reported Amount of Sleep on Non-School Nights
Total 6th – 8th grade 6th grade 7th grade 8th grade
9th – 12th grade 9th grade 10th grade 11th grade 12th grade
B C D E F G H I J n= (1,602) (710) (228) (238) (244) (892) (233) (239) (221) (199) Net: Less than 9 hours 38% 33% 31% 34% 35% 41%B 35% 35% 39% 55%CDEGHI
Insufficient (Less than 8 hours) 17 15 13 15 17 18 18 18 17 20C
Borderline (8 to less than 9 hours) 21 18 18 19 17 23B 17 17 22 35CDEGHI
Optimal (9 or more hours) 57 61F 61J 59J 62J 55 59J 62J 56J 43
Mean (# of hours on non-school nights) 8.9 9.0F 9.2GIJ 8.9J 9.0J 8.7 8.8J 8.9J 8.8J 8.4
Mean (# of hours on school nights) 7.6 8.2F 8.4EGHIJ 8.1GHIJ 8.1GHIJ 7.2 7.6HIJ 7.3IJ 7.0 6.9
Don’t know/Refused 5 6F 8HJ 7HJ 4 4 5 3 5 2
Adolescents’ Reported Amount of Sleep on Non-School Nights
0.80.8 0.9
1.2 1.61.9
1.5
Difference in Hours Slept on School Nights and Non-School Nights
Base = Total Adolescents (n=1,602)Letters indicate significant differences at the 95% confidence level.C6/C10
Base = Total AdolescentsLetters indicate significant differences at the 95% confidence level.C6/C10
12
10:31 PM
11:05 PM11:26 PM
11:53 PM 12:03 AM12:25 AM
12:45 AM
9:00 PM
10:00 PM
11:00 PM
12:00 AM
1:00 AM
Bedtime (Non-School days)
Bedtime (School days)
8:53 AM9:12 AM 9:21 AM
9:54 AM 9:52 AM 10:06 AM9:51 AM
6:00 AM
7:00 AM
8:00 AM
9:00 AM
10:00 AM
11:00 AM
6th grade 7th grade 8th grade 9th grade 10th grade 11th grade 12th grade
Waketime (Non-School days)
Waketime (School days)
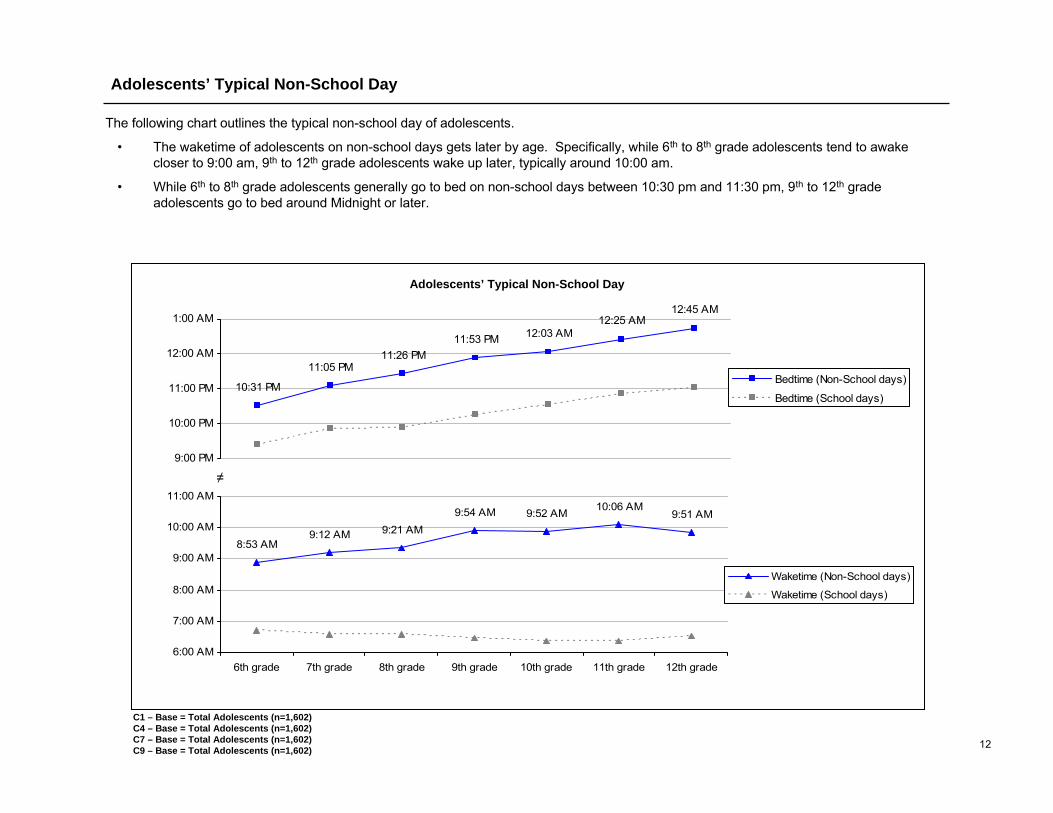
The following chart outlines the typical non-school day of adolescents.
• The waketime of adolescents on non-school days gets later by age. Specifically, while 6th to 8th grade adolescents tend to awake closer to 9:00 am, 9th to 12th grade adolescents wake up later, typically around 10:00 am.
• While 6th to 8th grade adolescents generally go to bed on non-school days between 10:30 pm and 11:30 pm, 9th to 12th grade adolescents go to bed around Midnight or later.
Adolescents’ Typical Non-School Day
Adolescents’ Typical Non-School Day
C1 – Base = Total Adolescents (n=1,602)C4 – Base = Total Adolescents (n=1,602)C7 – Base = Total Adolescents (n=1,602)C9 – Base = Total Adolescents (n=1,602)
≠
13
27%
48%
24%
25%
47%
26%
26%
48%
25%
0% 20% 40% 60% 80% 100%
30 minutes or more
10 up to 30 minutes
Less than 10 minutes
Total (mean = 24.8 min.)
6th-8th grade (B) (mean = 24.4 min.)
9th-12th grade (F) (mean = 25.1 min.)
Length of Time It Takes Adolescent to Fall Asleep on Most School Nights
Base = Total Adolescents (n=1,602)Don’t know/Not sure = <1%; Depends/Varies = 1%Letters indicate significant differences at the 95% confidence level.C3
Length of Time to Fall Asleep on School Nights
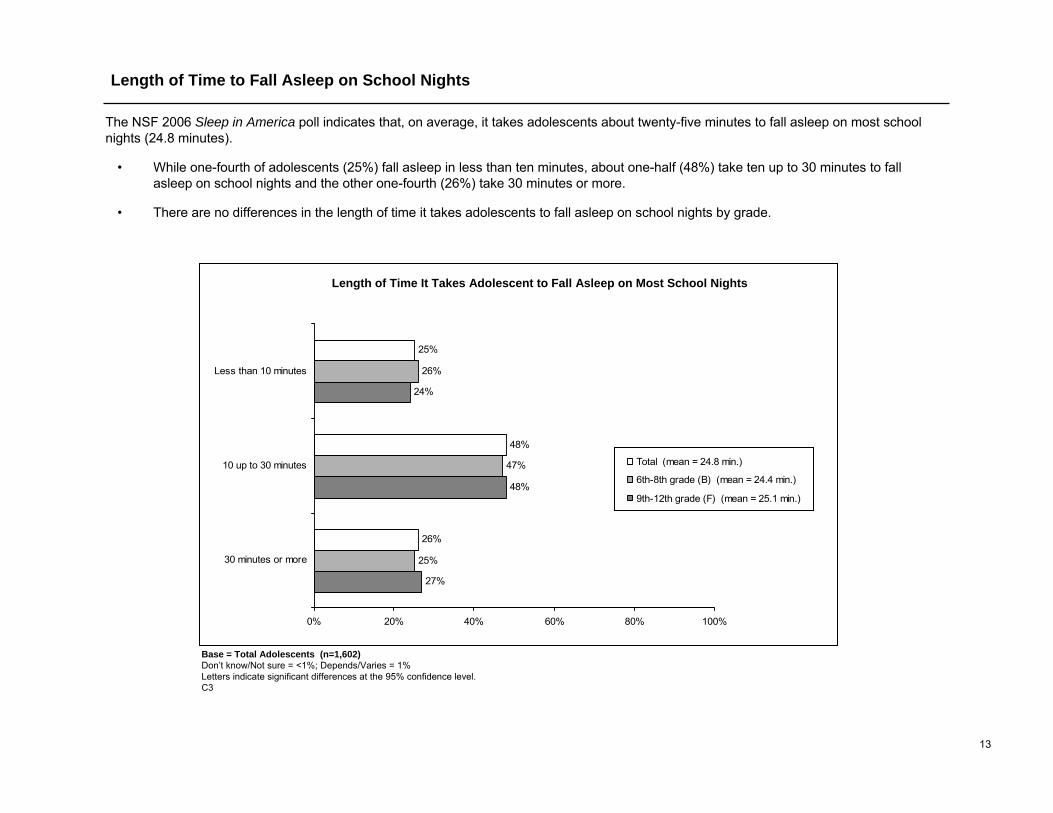
The NSF 2006 Sleep in America poll indicates that, on average, it takes adolescents about twenty-five minutes to fall asleep on most school nights (24.8 minutes).
• While one-fourth of adolescents (25%) fall asleep in less than ten minutes, about one-half (48%) take ten up to 30 minutes to fall asleep on school nights and the other one-fourth (26%) take 30 minutes or more.
• There are no differences in the length of time it takes adolescents to fall asleep on school nights by grade.

14
14%
14%
2%
4%
22%
23%
8%
8%
31%
18%
28%
6%
16%B
13%B
42%B
<1%
39%F
11%F
0% 20% 40% 60% 80% 100%
11:00 pm - 12:00 am
10:30 pm - 10:59 pm
10:00 pm - 10:29 pm
9:30 pm - 9:59 pm
9:00 pm - 9:29 pm
7:00 pm - 8:59 pm
Total (mean = 9:41 pm)6th-8th grade (B) (mean = 9:22 pm)9th-12th grade (F) (mean = 10:02 pm)
39%
71%
52%J
64%IJ
72%IJ
87%GHIJ
89%GHIJ
95%DEGHIJ
0% 20% 40% 60% 80% 100%
12th grade (J)
11th grade (I)
10th grade (H)
9th grade (G)
8th grade (E)
7th grade (D)
6th grade (C)
Total
Adolescent Has Set Bedtime on School Nights(% Yes)
Base = Total Caregivers (n=1,602)Don’t know/Refused = <1%Letters indicate significant differences at the 95% confidence level.P8
Set Bedtime on School Nights
Adolescent’s Set Bedtime on School Nights
Base = Those caregivers who set their adolescent’s bedtime on school nights (n=1,159)Don’t know = <1%Letters indicate significant differences at the 95% confidence level.P8A
B
The NSF 2006 Sleep in America poll indicates that about seven in ten caregivers of adolescents (71%) say that their adolescent has a set bedtime on school nights.
• The proportion of those having a set bedtime decreases as adolescents age (from 95% in 6th grade to 39% in 12th grade).
• While about one-half of those with a set bedtime have a bedtime before 10:00 pm (52%), a similar proportion report a set bedtime of 10:00 pm or later (48%).
• For the majority of 6th to 8th grade adolescents who have a set bedtime, it is before 10:00 pm (73%). For the majority of 9th to 12th grade adolescents who have a set bedtime, it is 10:00 pm or later (71%).
• Those adolescents who have a set bedtime, particularly one before 10:00 pm, have a much more positive sleep profile than those who do not have a set bedtime. Specifically, they get more sleep on school nights, they more often can say “I had a good night’s sleep,” and are less likely to experience problems related to sleepiness during their daily activities. For more detail, please see the sleep profile on the following page.
F

15
No Before 10pm
10pm or later
B C D
(435) (610) (548)
At least a few days/nights a week
Difficulty falling asleep 30% 29% 30%
Difficulty staying asleep 19 20 17
Fallen asleep in school 16C 6 14C
Had trouble getting along with family 19 22 21
Felt too tired or sleepy during the day 39C 24 36C
Fallen asleep while doing homework/studying 15CD 5 8C
Felt cranky or irritable during the day 28C 16 25C
Arrived late or missed school because you overslept 6 3 7C
Felt too tired to do exercise or other physical activity 21C 13 16
Snored 15 15 16
At risk for RLS 9 8 7 Sleep problem
Parent thinks adolescent has (Yes) 8% 6% 6% Adolescent thinks has (Yes/Maybe) 20C 13 16
BMI Underweight/Normal 71%C 65% 69% At risk for overweight 12 15 13 Overweight 11 14 14
Depressive mood score* 10-<15 40% 51%BD 45% 15-<20 40 34 36
20-30 20C 13 19C 5+ hours/week Sports/Exercise 49% 48% 49% Extracurricular activities 30C 24 31C Work at paying job 10+ hours/week 21%CD 3% 12%C Drink caffeinated beverages 2+ cups/cans per day 36%C 24% 35%C
Grades As 30%D 30%D 23%
As and Bs/Bs 49 46 49 Bs and Cs or worse 20 24 27B
Adolescent Has a Set Bedtime on School Nights No
Before 10pm
10pm or later
B C D
(435) (610) (548)
Adult involved in waking adolescent on school days
Yes 57% 75%BD 67%B
Length of time taken to fall asleep on school nights Less than 10 minutes 30%C 22% 24% 10 to 29 minutes 48 49 47 30 minutes or more 22 28B 28B
Hours slept on school nights
Insufficient (Less than 8 hours) 65%CD 24% 50%C
Borderline (8 to less than 9 hours) 23 34B 33B
Optimal (9 or more hours) 8 36BD 14B
Mean (# of hours) 7.1 8.2BD 7.5B
Hours slept on non-school nights
Insufficient (Less than 8 hours) 17% 14% 19%C
Borderline (8 to less than 9 hours) 24 20 19
Optimal (9 or more hours) 54 59 58
Mean (# of hours) 8.8 9.0D 8.8
Parent believes adolescent gets enough sleep on school nights
Every night/Almost every night 58% 84%BD 68%B
Quality of adolescent’s sleep
Fair/Poor 10% 8% 10%
“I had a good night’s sleep” Every night or almost every night 28% 54%BD 38%B A few nights a month or less 31CD 15 24C
Actual vs. minimum hours of sleep needed (school nights)
Get less sleep than needed 65%C 44% 61%C
Get the same amount of sleep as needed 16 29BD 22B
Get more sleep than needed 13 19BD 13 Lark or owl
Lark (Morning person) 25% 44%BD 33%B Owl (Evening person) 65CD 47 58C
Sleep Profile – Adolescent Has a Set Bedtime on School Nights
* Please refer to page 44 of the Summary of Findings for an explanation of the depressive mood score.

16
9:51 PM9:50 PM
10:40 PM10:43 PM
10:09 PM
9:25 PM
10:28 PM
10:14 PM10:11 PM10:02 PM
9:11 PM9:25 PM
9:48 PM
9:33 PM
8:30 PM
8:45 PM
9:00 PM9:15 PM
9:30 PM
9:45 PM
10:00 PM10:15 PM
10:30 PM
10:45 PM
11:00 PM11:15 PM
11:30 PM
6th grade 7th grade 8th grade 9th grade 10th grade 11th grade 12th grade
Actual bedtime
Set bedtime
Adolescent’s Average Actual Bedtime vs. Set Bedtime on School Nights
Average Actual Bedtime vs. Set Bedtime on School Nights
Set Bedtime Base = Those caregivers who set their adolescent’s bedtime on school nights (n=1,159)Don’t know = <1%Actual Bedtime Base = Those adolescents who have a set bedtime on school nights (n=1,159)Don’t know = <1%P8A/C1
When comparing when adolescents report going to bed to their set bedtime on school nights (as reported by their caregiver), adolescents are going to bed, on average, about thirty minutes later than their set bedtime.
17
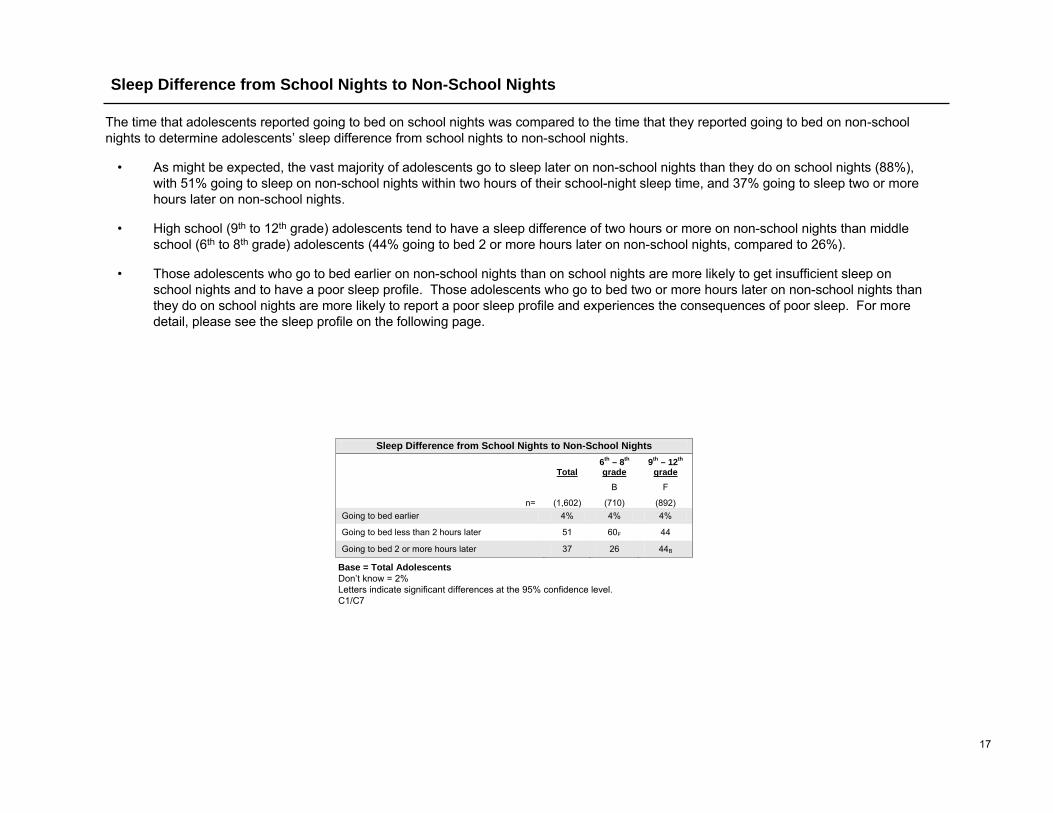
The time that adolescents reported going to bed on school nights was compared to the time that they reported going to bed on non-school nights to determine adolescents’ sleep difference from school nights to non-school nights.
• As might be expected, the vast majority of adolescents go to sleep later on non-school nights than they do on school nights (88%), with 51% going to sleep on non-school nights within two hours of their school-night sleep time, and 37% going to sleep two or more hours later on non-school nights.
• High school (9th to 12th grade) adolescents tend to have a sleep difference of two hours or more on non-school nights than middle school (6th to 8th grade) adolescents (44% going to bed 2 or more hours later on non-school nights, compared to 26%).
• Those adolescents who go to bed earlier on non-school nights than on school nights are more likely to get insufficient sleep on school nights and to have a poor sleep profile. Those adolescents who go to bed two or more hours later on non-school nights than they do on school nights are more likely to report a poor sleep profile and experiences the consequences of poor sleep. For more detail, please see the sleep profile on the following page.
Sleep Difference from School Nights to Non-School Nights
Total 6th – 8th grade
9th – 12th grade
B F
n= (1,602) (710) (892) Going to bed earlier 4% 4% 4%
Going to bed less than 2 hours later 51 60F 44
Going to bed 2 or more hours later 37 26 44B
Sleep Difference from School Nights to Non-School Nights
Base = Total AdolescentsDon’t know = 2%Letters indicate significant differences at the 95% confidence level.C1/C7

18
Go to bed earlier
Go to bed within
< 2 hours later Go to bed
2 + hours later B C D
(61) (814) (587)
At least a few days/nights a week
Difficulty falling asleep 36% 26% 34%C
Difficulty staying asleep 33CD 17 20
Fallen asleep in school 11 8 19C
Had trouble getting along with family 23 18 24C
Felt too tired or sleepy during the day 55CD 26 38C
Fallen asleep while doing homework/studying 22C 5 13C
Felt cranky or irritable during the day 36C 17 28C
Arrived late or missed school because you overslept 8 4 6
Felt too tired to do exercise or other physical activity 25C 13 19C
Snored 17 14 17
At risk for RLS 10 6 10C Sleep problem
Parent thinks adolescent has (Yes) 8% 6% 8% Adolescent thinks has (Yes/Maybe) 29C 12 20C
BMI Underweight/Normal 70% 71% 66% At risk for overweight 9 12 15 Overweight 15 13 14
Depressive mood score* 10-<15 36% 50%BD 39% 15-<20 37 35 41C
20-30 28C 15 19C 5+ hours/week Sports/Exercise 43% 50% 48% Extracurricular activities 31 29 26 Work at paying job 10+ hours/week 11% 9% 14%C Drink caffeinated beverages 2+ cups/cans per day 38% 27% 38%C Grades As 22% 31%D 22%
As and Bs/Bs 42 49 49 Bs and Cs or worse 36C 19 29C
Sleep Difference From School Nights to Non-School Nights
Go to bedearlier
Go to bed within
< 2 hours later Go to bed
2 + hours later B C D
(61) (814) (587)
Set bedtime on school nights
Yes 62% 72% 70%
Adult involved in waking adolescent on school days
Yes 75% 66% 66% Length of time taken to fall asleep on school nights
Less than 10 minutes 26% 26% 22% 10 to 29 minutes 30 52BD 45B 30 minutes or more 44C 21 33C
Hours slept on school nights
Insufficient (Less than 8 hours) 60%C 39% 51%C
Borderline (8 to less than 9 hours) 19 33B 29
Optimal (9 or more hours) 14 23BD 16
Mean (# of hours) 6.7 7.8BD 7.4B
Hours slept on non-school nights
Insufficient (Less than 8 hours) 16% 13% 24%C
Borderline (8 to less than 9 hours) 21 19 23
Optimal (9 or more hours) 52 63D 49
Mean (# of hours) 9.1D 9.1D 8.5
Parent believes adolescent gets enough sleep on school nights
Every night/Almost every night 56% 73%B 70%B
Quality of adolescent’s sleep
Fair/Poor 13% 7% 11%C
“I had a good night’s sleep” Every night or almost every night 26% 46%BD 36% A few nights a month or less 40C 17 28C
Actual vs. minimum hours of sleep needed (school nights)
Get less sleep than needed 67%C 52% 60%C
Get the same amount of sleep as needed 9 26B 22B
Get more sleep than needed 15 17D 13
Lark or owl Lark (Morning person) 37% 38%D 30% Owl (Evening person) 59 53 62C
Sleep Profile – Sleep Difference From School Nights to Non-School Nights
* Please refer to page 44 of the Summary of Findings for an explanation of the depressive mood score.

19
Go to bed earlier
Go to bed within
< 2 hours later Go to bed
2 + hours later B C D
(36) (444) (394)
At least a few days/nights a week
Difficulty falling asleep 48%C 27% 35%C
Difficulty staying asleep 33 18 20
Fallen asleep in school 16 14 23C
Had trouble getting along with family 31 18 23
Felt too tired or sleepy during the day 67CD 35 41
Fallen asleep while doing homework/studying 34CD 8 15C
Felt cranky or irritable during the day 49CD 22 31C
Arrived late or missed school because you overslept 9 5 6
Felt too tired to do exercise or other physical activity 27 19 19
Snored 9 12 17
At risk for RLS 14 7 10 Sleep problem
Parent thinks adolescent has (Yes) 5% 8% 9% Adolescent thinks has (Yes/Maybe) 36C 13 22C
BMI Underweight/Normal 76% 72% 70% At risk for overweight 11 11 13 Overweight 12 12 12
Depressive mood score* 10-<15 19% 43%BD 37%B 15-<20 36 38 41
20-30 45CD 19 22 5+ hours/week Sports/Exercise 38% 48% 49% Extracurricular activities 40 34 29 Work at paying job 10+ hours/week 16% 18% 20% Drink caffeinated beverages 2+ cups/cans per day 33% 30% 42%C Grades As 23% 28%D 21%
As and Bs/Bs 48 50 50 Bs and Cs or worse 30 21 28C
Sleep Difference From School Nights to Non-School Nights – 9th to 12th grade
Go to bedearlier
Go to bed within
< 2 hours later Go to bed
2 + hours later B C D
(36) (444) (394)
Set bedtime on school nights
Yes 41% 55% 60%B
Adult involved in waking adolescent on school days
Yes 69% 58% 61% Length of time taken to fall asleep on school nights
Less than 10 minutes 22% 27%D 21% 10 to 29 minutes 32 50B 48 30 minutes or more 45C 22 31C
Hours slept on school nights
Insufficient (Less than 8 hours) 81%CD 61% 62%
Borderline (8 to less than 9 hours) 11 26B 26B
Optimal (9 or more hours) 6 10 9
Mean (# of hours) 6.1 7.3BD 7.1B
Hours slept on non-school nights
Insufficient (Less than 8 hours) 13% 13% 25%C
Borderline (8 to less than 9 hours) 24 22 23
Optimal (9 or more hours) 56 59D 50
Mean (# of hours) 9.3D 9.0D 8.5
Parent believes adolescent gets enough sleep on school nights
Every night/Almost every night 40% 64%B 65%B
Quality of adolescent’s sleep
Fair/Poor 17% 10% 12%
“I had a good night’s sleep” Every night or almost every night 10% 34%B 32%B A few nights a month or less 54CD 24 31C
Actual vs. minimum hours of sleep needed (school nights)
Get less sleep than needed 84%CD 61% 66%
Get the same amount of sleep as needed - 21 19
Get more sleep than needed 10 13 11
Lark or owl
Lark (Morning person) 19% 30% 28% Owl (Evening person) 74 59 64
Sleep Profile – Sleep Difference From School Nights to Non-School Nights
* Please refer to page 44 of the Summary of Findings for an explanation of the depressive mood score.

20
The NSF 2006 Sleep in America poll indicates that, on average, adolescents believe that they need about eight hours of sleep (8.2 hours) to feel their best during the day.
• Specifically, 38% of the adolescents feel they need nine or more hours of sleep to feel their best, while 40% feel they need eight to less than nine hours, and 20% feel they need less than eight hours to feel their best.
• In fact, while 78% of adolescents said they need at least 8 hours of sleep to feel their best during the day, only 51% actually reported getting 8 hours or more of sleep on school nights.
– Middle school (6th to 8th grade) adolescents reported needing more sleep, on average, than 9th to 12th
grade adolescents (8.5 hours vs. 8.0 hours).
– In fact, one-half (50%) of 6th to 8th
grade adolescents reported needing nine or more hours of sleep to feel their best, while only about three in ten 9th to 12th grade adolescents (29%) reported needing nine or more hours.
Minimum Hours of Sleep Needed to Feel One’s Best
Base = Total Adolescents (n=1,602)Don’t know/Refused = 2%Letters indicate significant differences at the 95% confidence level.C13
29%
35%
12%
38%
40%
20%
25%B
44%B
50%F
0% 20% 40% 60% 80% 100%
9 or more hours
8 to less than 9
Less than 8 hours
Total (mean = 8.2 hours)
6th-8th grade (B) (mean = 8.5 hours)
9th-12th grade (F) (mean = 8.0 hours)
Minimum Hours of Sleep Adolescent Believes They Needto Feel Their Best During the Day
F
21
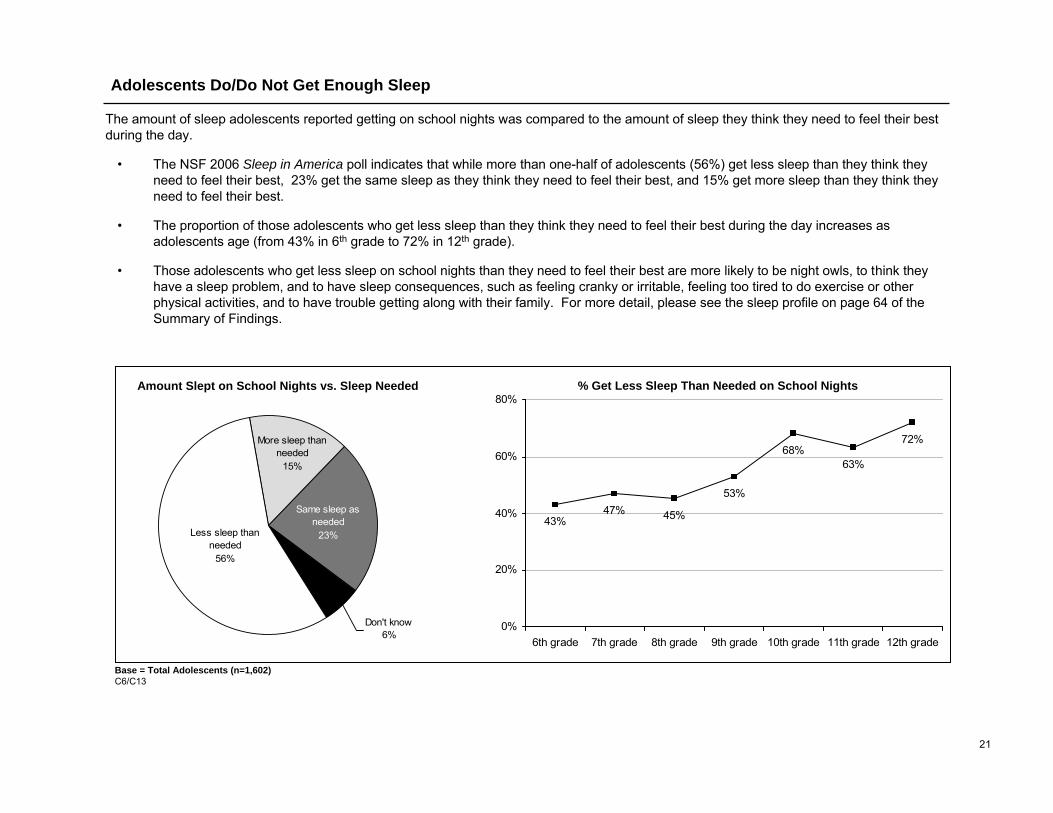
The amount of sleep adolescents reported getting on school nights was compared to the amount of sleep they think they need to feel their best during the day.
• The NSF 2006 Sleep in America poll indicates that while more than one-half of adolescents (56%) get less sleep than they think they need to feel their best, 23% get the same sleep as they think they need to feel their best, and 15% get more sleep than they think they need to feel their best.
• The proportion of those adolescents who get less sleep than they think they need to feel their best during the day increases as adolescents age (from 43% in 6th grade to 72% in 12th grade).
• Those adolescents who get less sleep on school nights than they need to feel their best are more likely to be night owls, to think they have a sleep problem, and to have sleep consequences, such as feeling cranky or irritable, feeling too tired to do exercise or other physical activities, and to have trouble getting along with their family. For more detail, please see the sleep profile on page 64 of the Summary of Findings.
Adolescents Do/Do Not Get Enough Sleep
Don't know6%
Same sleep as needed
23%
More sleep than needed
15%
Less sleep than needed
56%
Amount Slept on School Nights vs. Sleep Needed
43%47% 45%
53%
68%63%
72%
0%
20%
40%
60%
80%
6th grade 7th grade 8th grade 9th grade 10th grade 11th grade 12th grade
% Get Less Sleep Than Needed on School Nights
Base = Total Adolescents (n=1,602)C6/C13
22
62%
69%
15%
18%
7%
13%
77%F
20%B 18%B 1%
1%
1%
9th-12th grade (F)
6th-8th grade (B)
Total
None or 1 day 2 or 3 days 4 or more days Don't know /Refused
Frequency of Naps in the Past Two Weeks
Base = Total Adolescents (n=1,602)Letters indicate significant differences at the 95% confidence level.C11
Frequency of Naps in the Past Two Weeks
6%
11%
49%
7%
10%
25%
6%
11%
31%
52%
34%B
57%F
0% 20% 40% 60% 80% 100%
3 hours or more
2 to <3 hours
1 to <2 hours
Less than 1 hour
Total (mean = 1.2 hours)
6th-8th grade (B) (mean = 1.2 hours)
9th-12th grade (F) (mean = 1.3 hours)
Length of Adolescents’ Naps
Base = Those adolescents who took at least one nap in the past two weeks (n=694)Letters indicate significant differences at the 95% confidence level.C12
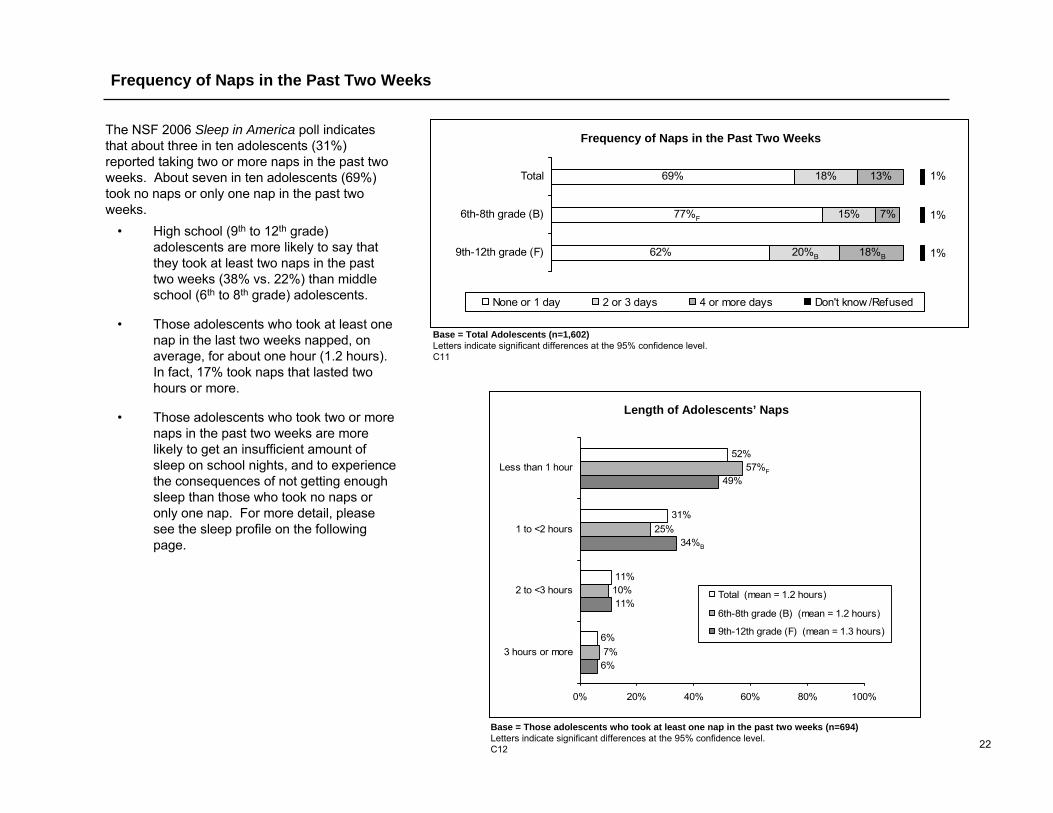
The NSF 2006 Sleep in America poll indicates that about three in ten adolescents (31%) reported taking two or more naps in the past two weeks. About seven in ten adolescents (69%) took no naps or only one nap in the past two weeks.
• High school (9th to 12th grade) adolescents are more likely to say that they took at least two naps in the past two weeks (38% vs. 22%) than middle school (6th to 8th grade) adolescents.
• Those adolescents who took at least one nap in the last two weeks napped, on average, for about one hour (1.2 hours). In fact, 17% took naps that lasted two hours or more.
• Those adolescents who took two or more naps in the past two weeks are more likely to get an insufficient amount of sleep on school nights, and to experience the consequences of not getting enough sleep than those who took no naps or only one nap. For more detail, please see the sleep profile on the following page.
23
None/One 2+ B C
(1097) (492)
At least a few days/nights a week
Difficulty falling asleep 30% 30%
Difficulty staying asleep 17 23B
Fallen asleep in school 7 22B
Had trouble getting along with family 18 25B
Felt too tired or sleepy during the day 29 40B
Fallen asleep while doing homework/studying 6 15B
Felt cranky or irritable during the day 19 29B
Arrived late or missed school because you overslept 4 7B
Felt too tired to do exercise or other physical activity 13 24B
Snored 15 16
At risk for RLS 6 12B
Sleep problem Parent thinks adolescent has (Yes) 6% 8% Adolescent thinks has (Yes/Maybe) 13 22B
BMI Underweight/Normal 68% 69% At risk for overweight 14 12 Overweight 13 14
Depressive mood score* 10-<15 51%C 35% 15-<20 34 42B
20-30 15 23B 5+ hours/week Sports/Exercise 49% 47% Extracurricular activities 26 31B Work at paying job 10+ hours/week 9% 15%B Drink caffeinated beverages 2+ cups/cans per day 29% 37%B Grades As 30%C 22%
As and Bs/Bs 48 48 Bs and Cs or worse 22 29B
Frequency of Naps None/One 2+ B C
(1097) (492)
Set bedtime on school nights
Yes 76%C 62%
Adult involved in waking adolescent on school days
Yes 68% 64% Length of time taken to fall asleep on school nights
Less than 10 minutes 25% 25% 10 to 29 minutes 48 47 30 minutes or more 27 26
Hours slept on school nights
Insufficient (Less than 8 hours) 40% 55%B
Borderline (8 to less than 9 hours) 32C 27
Optimal (9 or more hours) 23C 13
Mean (# of hours) 7.8C 7.3
Hours slept on non-school nights
Insufficient (Less than 8 hours) 16% 19%
Borderline (8 to less than 9 hours) 21 21
Optimal (9 or more hours) 59 55
Mean (# of hours) 8.9 8.8
Parent believes adolescent gets enough sleep on school nights
Every night/Almost every night 73%C 66%
Quality of adolescent’s sleep
Fair/Poor 9% 10%
“I had a good night’s sleep” Every night or almost every night 43%C 36% A few nights a month or less 21 25
Actual vs. minimum hours of sleep needed (school nights)
Get less sleep than needed 52% 66%B
Get the same amount of sleep as needed 26C 17
Get more sleep than needed 16C 12
Lark or owl
Lark (Morning person) 35% 33% Owl (Evening person) 55 60B
Sleep Profile – Frequency of Naps
* Please refer to page 44 of the Summary of Findings for an explanation of the depressive mood score.
24
25%
26%
6%
26%
31%
36%
6%
25%
34%
5%
35%B
40%F
0% 20% 40% 60% 80% 100%
Two or more
One
Less than one
None
Total (mean = 1.8 cups/cans)
6th-8th grade (B) (mean = 1.6 cups/cans)
9th-12th grade (F) (mean = 1.9 cups/cans)
Caffeine Intake Each Day
Base = Total Adolescents (n=1,602)1Base = Those adolescents who drink at least one cup/can of caffeinated beverage each dayDon’t know/Refused = 2%Letters indicate significant differences at the 95% confidence level.C25
Cups/Cans of Caffeinated Beverages Adolescent Drinks Each Day
1
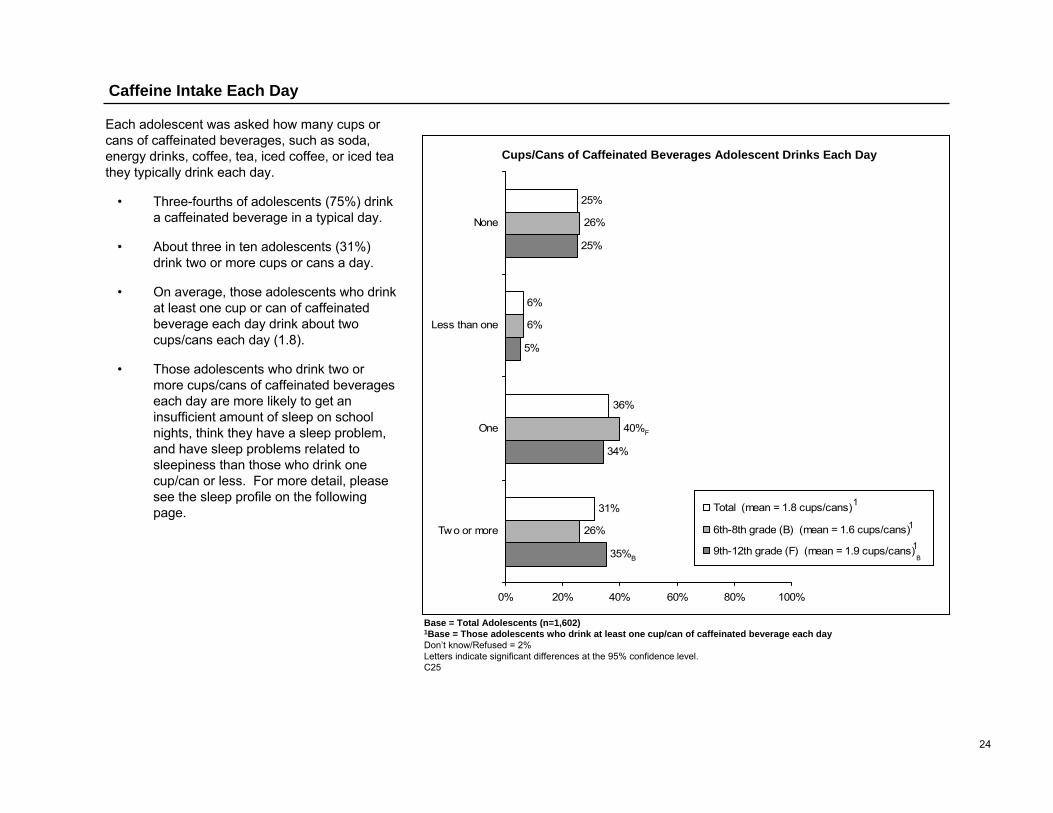
Each adolescent was asked how many cups or cans of caffeinated beverages, such as soda, energy drinks, coffee, tea, iced coffee, or iced tea they typically drink each day.
• Three-fourths of adolescents (75%) drink a caffeinated beverage in a typical day.
• About three in ten adolescents (31%) drink two or more cups or cans a day.
• On average, those adolescents who drink at least one cup or can of caffeinated beverage each day drink about two cups/cans each day (1.8).
• Those adolescents who drink two or more cups/cans of caffeinated beverages each day are more likely to get an insufficient amount of sleep on school nights, think they have a sleep problem, and have sleep problems related to sleepiness than those who drink one cup/can or less. For more detail, please see the sleep profile on the following page.
1
1B

25
0/Less than one One
Two or more
B C D
(486) (585) (503)
At least a few days/nights a week
Difficulty falling asleep 28% 30% 31%
Difficulty staying asleep 15 19 21B
Fallen asleep in school 8 12B 15B
Had trouble getting along with family 20 21 21
Felt too tired or sleepy during the day 31 31 36
Fallen asleep while doing homework/studying 9 7 11C
Felt cranky or irritable during the day 18 24B 25B
Arrived late or missed school because you overslept 4 6 5
Felt too tired to do exercise or other physical activity 17 15 17
Snored 12 14 19BC
At risk for RLS 7 7 10 Sleep problem
Parent thinks adolescent has (Yes) 6% 5% 9%C Adolescent thinks has (Yes/Maybe) 12 15 19B
BMI Underweight/Normal 73%CD 66% 66% At risk for overweight 11 15B 13 Overweight 11 13 16B
Depressive mood score* 10-<15 47% 47% 42% 15-<20 37 35 39
20-30 16 17 18 5+ hours/week Sports/Exercise 48% 50% 47% Extracurricular activities 33C 23 28 Work at paying job 10+ hours/week 9% 9% 15%BC Grades As 34%CD 28%D 21%
As and Bs/Bs 49 47 47 Bs and Cs or worse 15 24B 31BC
Cups/Cans of Caffeinated Beverages Consumed Each Day 0/Less
than one One Two
or more B C D
(486) (585) (503)
Set bedtime on school nights
Yes 72% 74%D 67%
Adult involved in waking adolescent on school days
Yes 64% 69% 67%
Length of time taken to fall asleep on school nights
Less than 10 minutes 26% 24% 25% 10 to 29 minutes 53D 49D 42 30 minutes or more 20 27B 32B
Hours slept on school nights
Insufficient (Less than 8 hours) 41% 42% 52%BC
Borderline (8 to less than 9 hours) 31 33 29
Optimal (9 or more hours) 24D 21D 14
Mean (# of hours) 7.8D 7.7D 7.3
Hours slept on non-school nights
Insufficient (Less than 8 hours) 15% 18% 19%
Borderline (8 to less than 9 hours) 21 22 20
Optimal (9 or more hours) 60 57 57
Mean (# of hours) 9.0 8.8 8.8
Parent believes adolescent gets enough sleep on school nights
Every night/Almost every night 73% 69% 70%
Quality of adolescent’s sleep
Fair/Poor 9% 7% 12%C
“I had a good night’s sleep” Every night or almost every night 45%D 40% 38% A few nights a month or less 22 22 24
Actual vs. minimum hours of sleep needed (school nights)
Get less sleep than needed 53% 57% 60%B
Get the same amount of sleep as needed 23 24 21
Get more sleep than needed 18CD 13 13
Lark or owl Lark (Morning person) 40%CD 32% 32% Owl (Evening person) 50 59B 60B
Sleep Profile – Cups/Cans of Caffeinated Beverages Consumed Each Day
* Please refer to page 44 of the Summary of Findings for an explanation of the depressive mood score.

26
Caregiver Believes Adolescent Gets Enough Sleep on School Nights
The majority of caregivers (90%) believe that their adolescent gets enough sleep at least a few nights a week on school nights, with caregivers of 6th to 8th grade adolescents more likely than those of 9th to 12th grade adolescents to believe this (94% vs. 87%).
• About seven in ten caregivers (71%) believe that their adolescent gets enough sleep every night or almost every night on school nights, with caregivers of 6th to 8th grade adolescents more likely than those of 9th to 12th grade adolescents to believe this (80% vs. 64%).
• These findings are in sharp contrast to the finding that only 20% of adolescents average the optimal 9 hours or more of sleep atnight, and 56% of adolescents believe that they get less sleep than they need.
64%
71%
14%
19%
2%
3% 4%
80%F
23%B 4%B
2%
6%B
2%
1%
2%B9th-12th grade
6th-8th grade
Total
Every night/Almost every night A few nights a w eek A few nights a month Rarely Never
Caregiver Believes Adolescent Gets Enough Sleep on School Nights
Base = Total Caregivers (n=1,602)Don’t know = <1%Letters indicate significant differences at the 95% confidence level.P10
At least afew nights
a week
87%
90%
94%F
27
43%
14%
22%
23%
21%
44%
85%
21%
28%
34%
42%
43%
57%
90%
26%B
32%B
43%B
57%B
60%B
94%B
53%
0% 20% 40% 60% 80% 100%
Internet access
Computer
Telephone
Cell phone
Television
Total
6th-8th grade (B)
9th-12th grade (F)
Base = Total Caregivers (n=1,602)Letters indicate significant differences at the 95% confidence level.P7
Items in Adolescent’s Bedroom(% Yes)
Items in Adolescent’s Bedroom
Electronic/Video games
Electronic music devices
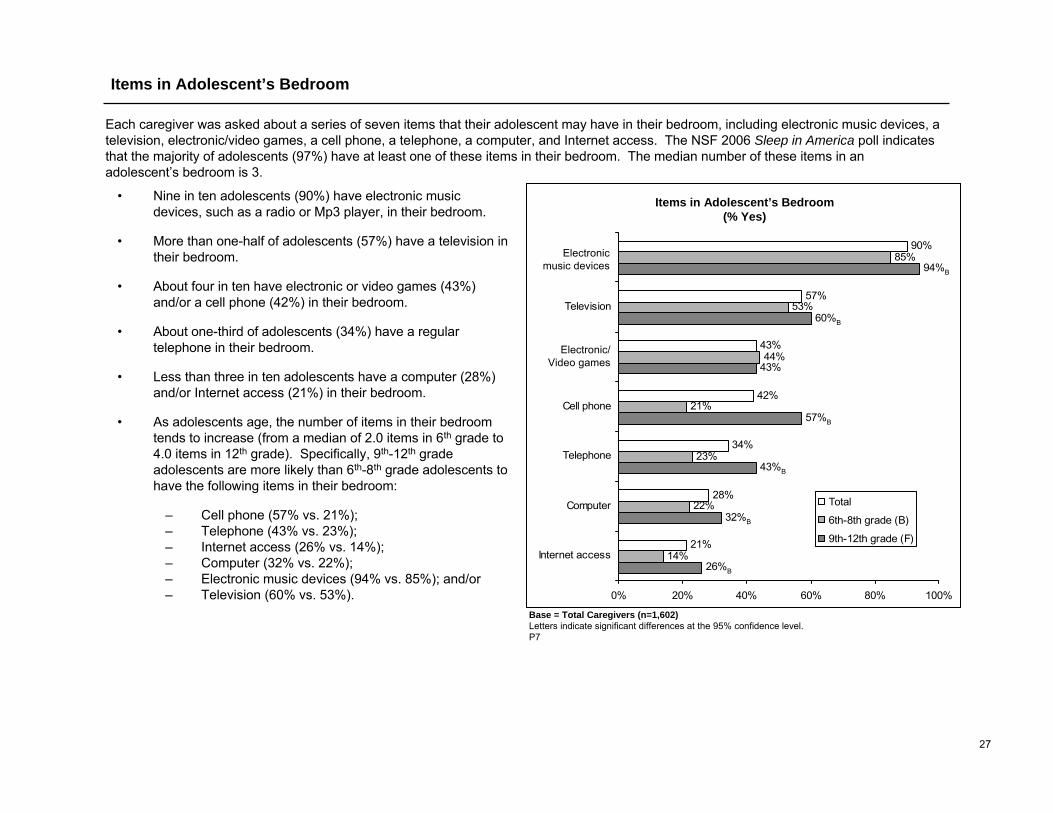
• Nine in ten adolescents (90%) have electronic music devices, such as a radio or Mp3 player, in their bedroom.
• More than one-half of adolescents (57%) have a television in their bedroom.
• About four in ten have electronic or video games (43%) and/or a cell phone (42%) in their bedroom.
• About one-third of adolescents (34%) have a regular telephone in their bedroom.
• Less than three in ten adolescents have a computer (28%) and/or Internet access (21%) in their bedroom.
• As adolescents age, the number of items in their bedroom tends to increase (from a median of 2.0 items in 6th grade to 4.0 items in 12th grade). Specifically, 9th-12th grade adolescents are more likely than 6th-8th grade adolescents to have the following items in their bedroom:
– Cell phone (57% vs. 21%);– Telephone (43% vs. 23%);– Internet access (26% vs. 14%);– Computer (32% vs. 22%);– Electronic music devices (94% vs. 85%); and/or– Television (60% vs. 53%).
Each caregiver was asked about a series of seven items that their adolescent may have in their bedroom, including electronic music devices, a television, electronic/video games, a cell phone, a telephone, a computer, and Internet access. The NSF 2006 Sleep in America poll indicates that the majority of adolescents (97%) have at least one of these items in their bedroom. The median number of these items in an adolescent’s bedroom is 3.
28
0-3 4+ B C
(975) (627)
At least a few days/nights a week
Difficulty falling asleep 29% 31%
Difficulty staying asleep 18 20
Fallen asleep in school 9 17B
Had trouble getting along with family 21 19
Felt too tired or sleepy during the day 30 36B
Fallen asleep while doing homework/studying 7 12B
Felt cranky or irritable during the day 21 24
Arrived late or missed school because you overslept 5 6
Felt too tired to do exercise or other physical activity 15 19B
Snored 13 18B
At risk for RLS 8 8
Sleep problem Parent thinks adolescent has (Yes) 6% 8% Adolescent thinks has (Yes/Maybe) 13 21B
BMI Underweight/Normal 70% 66% At risk for overweight 13 14 Overweight 12 15
Depressive mood score 10-<15 49%C 41% 15-<20 35 39
20-30 15 20B 5+ hours/week Sports/Exercise 50% 46% Extracurricular activities 28 28 Work at paying job 10+ hours/week 8% 16%B Drink caffeinated beverages 2+ cups/cans per day 25% 41%B Grades As 31%C 23%
As and Bs/Bs 47 49 Bs and Cs or worse 22 27B
Number of Items in Adolescent’s Bedroom 0-3 4+ B C
(975) (627)
Set bedtime on school nights
Yes 77%C 62%
Adult involved in waking adolescent on school days
Yes 71%C 62% Length of time taken to fall asleep on school nights
Less than 10 minutes 25% 25% 10 to 29 minutes 49 46 30 minutes or more 25 28
Hours slept on school nights
Insufficient (Less than 8 hours) 37% 56%B
Borderline (8 to less than 9 hours) 33C 26
Optimal (9 or more hours) 25C 13
Mean (# of hours) 7.8C 7.3
Hours slept on non-school nights
Insufficient (Less than 8 hours) 15% 19%B
Borderline (8 to less than 9 hours) 20 21
Optimal (9 or more hours) 60C 54
Mean (# of hours) 9.0C 8.7
Parent believes adolescent gets enough sleep on school nights
Every night/Almost every night 73%C 68%
Quality of adolescent’s sleep
Fair/Poor 9% 10% “I had a good night’s sleep”
Every night or almost every night 46%C 34 A few nights a month or less 18 29B
Actual vs. minimum hours of sleep needed (school nights)
Get less sleep than needed 53% 61%B
Get the same amount of sleep as needed 26C 20
Get more sleep than needed 16 13
Lark or owl Lark (Morning person) 37%C 31% Owl (Evening person) 53 61B
Sleep Profile – Number of Items in Adolescent’s Bedroom
* Please refer to page 44 of the Summary of Findings for an explanation of the depressive mood score.

29
Frequency of Performing Activities Within an Hour of Going to Bed on School Nights at Least a Few Nights a Week
Total 6th – 8th grade 9th – 12th grade B F
n = (1,602) (710) (892)
Net: Any 99% 98% 99%B
Watched television 76 76 76
Did homework or studied 65 58 70B
Instant messaged/Went on the Internet 44 30 54B
Read for fun 41 49F 35
Talked on the phone 40 27 50B
Exercised 32 33 32
Played electronic or video games 26 29F 24
Frequency of Performing Activities Within an Hour of Going to Bed on School Nights at Least a Few Nights a Week
Male Female P Q
n = (799) (803)
Net: Any 98% 99%P
Watched television 79Q 73
Did homework or studied 60 70P
Instant messaged/Went on the Internet 42 46
Played electronic or video games 40Q 12
Exercised 37Q 27
Read for fun 34 47P
Talked on the phone 29 51P
Base = Total AdolescentsLetters indicate significant differences at the 95% confidence level.C2
Base = Total AdolescentsLetters indicate significant differences at the 95% confidence level.C2
Activities Performed Within an Hour of Going to Bed on School Nights
All of the adolescents were asked how often they performed various activities within an hour of going to bed on school nights within the last two weeks, using a scale of every night/almost every night, a few nights a week, a few nights a month, rarely or never.
• Most frequently, adolescents watched television (76%), followed by doing homework or studying (65%).
• About two in five adolescents instant messaged or went on the Internet (44%), read for fun (41%), and/or talked on the phone (40%).
• About one-third of the adolescents surveyed exercised (32%) and about one-fourth played electronic or video games (26%).
• High school (9th to 12th grade) adolescents are more likely than 6th to 8th grade adolescents to have done the following activities: instant messaged/went on the Internet (54% vs. 30%), talked on the phone (50% vs. 27%), and/or did homework or studied (70% vs. 58%). Meanwhile, 6th to 8th grade adolescents are more likely than 9th to 12th grade adolescents to have read for fun (49% vs. 35%), and/or played electronic/video games (29% vs. 24%).
• Male adolescents are more likely than their female counterparts to have played electronic/video games (40% vs. 12%), exercised (37% vs. 27%), and/or watched television (79% vs. 73%), while females are more likely than males to have talked on the phone (51% vs. 29%), read for fun (47% vs. 34%), and/or done homework or studied (70% vs. 60%).
30
0-1 2+ B C
(597) (1005)
At least a few days/nights a week
Difficulty falling asleep 28% 31%
Difficulty staying asleep 17 20
Fallen asleep in school 8 14B
Had trouble getting along with family 18 22B
Felt too tired or sleepy during the day 28 35B
Fallen asleep while doing homework/studying 8 9
Felt cranky or irritable during the day 21 23
Arrived late or missed school because you overslept 4 6
Felt too tired to do exercise or other physical activity 13 18B
Snored 14 16
At risk for RLS 6 9B
Sleep problem Parent thinks adolescent has (Yes) 7% 6% Adolescent thinks has (Yes/Maybe) 15 16
BMI Underweight/Normal 68% 68% At risk for overweight 13 13 Overweight 12 14
Depressive mood score 10-<15 50%C 43% 15-<20 34 38
20-30 15 18 5+ hours/week Sports/Exercise 47% 50% Extracurricular activities 29 27 Work at paying job 10+ hours/week 11% 11% Drink caffeinated beverages 2+ cups/cans per day 27% 34%B Grades As 32%C 25%
As and Bs/Bs 44 50B Bs and Cs or worse 23 24
Number of Activities Done in Hour Before Bed 0-1 2+ B C
(597) (1005)
Set bedtime on school nights
Yes 76%C 69%
Adult involved in waking adolescent on school days
Yes 67% 67% Length of time taken to fall asleep on school nights
Less than 10 minutes 24% 25% 10 to 29 minutes 50 46 30 minutes or more 25 27
Hours slept on school nights
Insufficient (Less than 8 hours) 39% 48%B
Borderline (8 to less than 9 hours) 31 31
Optimal (9 or more hours) 26C 17
Mean (# of hours) 7.8C 7.5
Hours slept on non-school nights
Insufficient (Less than 8 hours) 16% 17%
Borderline (8 to less than 9 hours) 22 20
Optimal (9 or more hours) 56 58
Mean (# of hours) 8.8 8.9
Parent believes adolescent gets enough sleep on school nights
Every night/Almost every night 74%C 69%
Quality of adolescent’s sleep
Fair/Poor 11% 8% “I had a good night’s sleep”
Every night or almost every night 46%C 39% A few nights a month or less 21 23
Actual vs. minimum hours of sleep needed (school nights)
Get less sleep than needed 50% 60%B
Get the same amount of sleep as needed 27C 21
Get more sleep than needed 17C 13
Lark or owl Lark (Morning person) 36% 34% Owl (Evening person) 53 58B
Sleep Profile – Number of Activities Done in Hour Before Bed
* Please refer to page 44 of the Summary of Findings for an explanation of the depressive mood score.
31
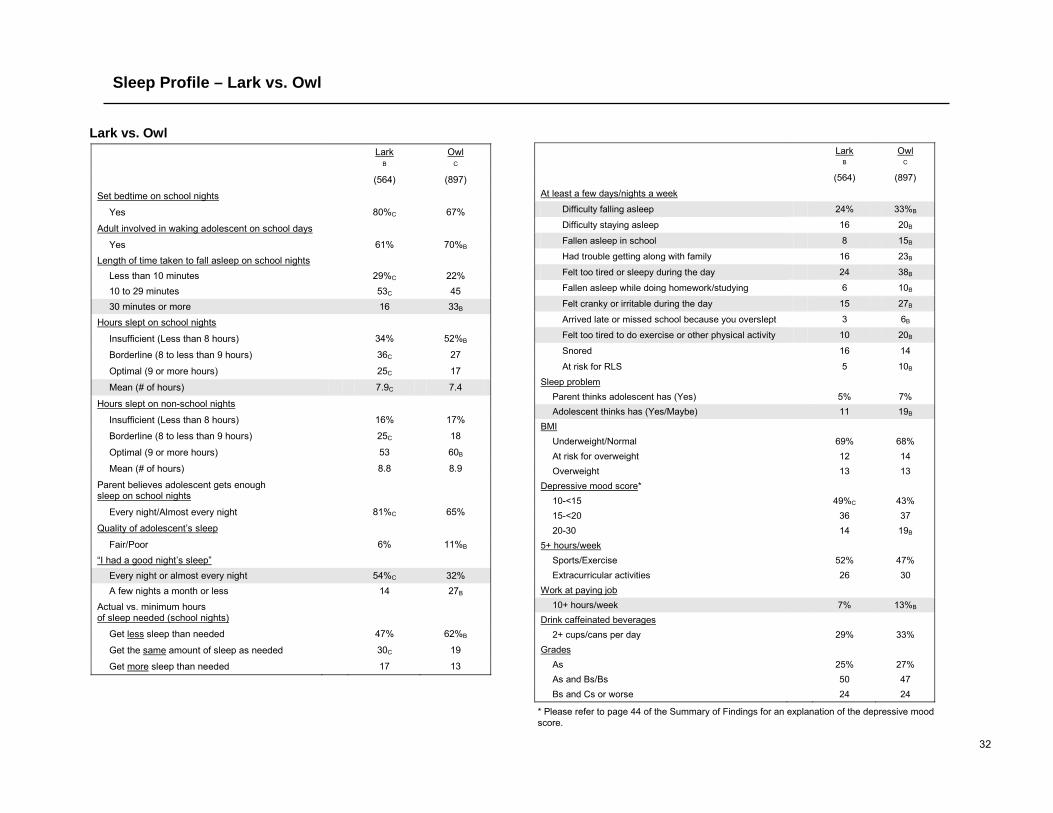
Lark vs. Owl
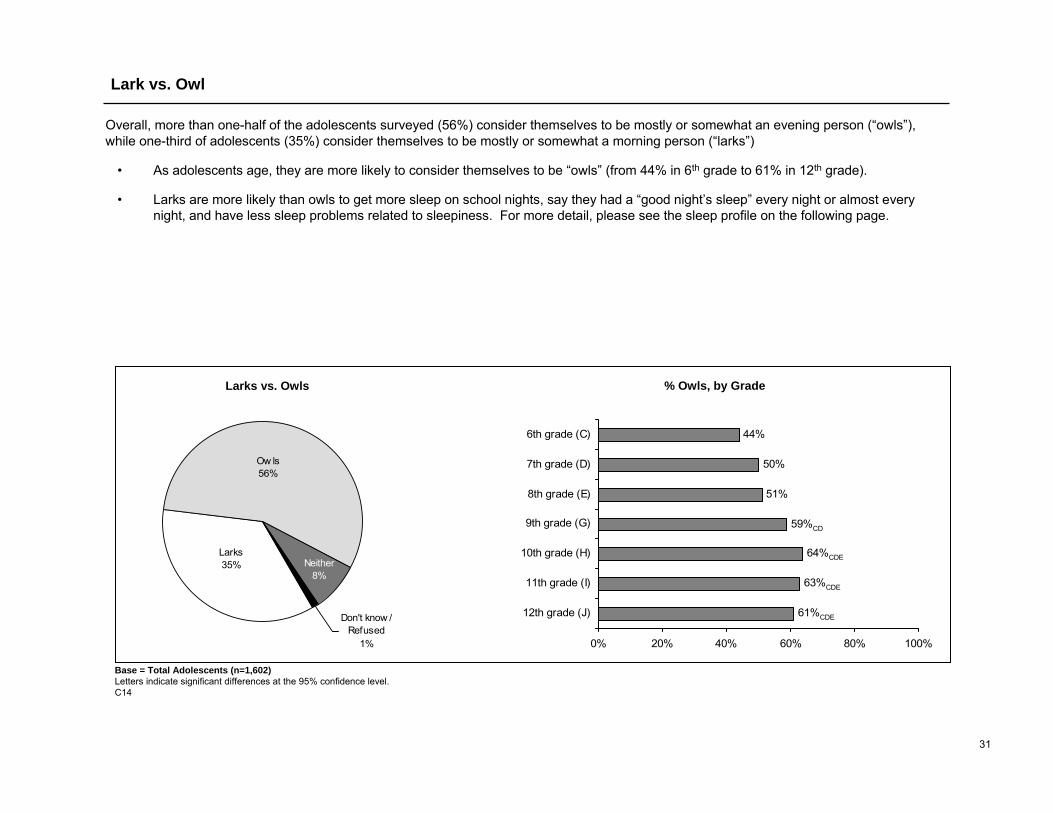
Overall, more than one-half of the adolescents surveyed (56%) consider themselves to be mostly or somewhat an evening person (“owls”), while one-third of adolescents (35%) consider themselves to be mostly or somewhat a morning person (“larks”)
• As adolescents age, they are more likely to consider themselves to be “owls” (from 44% in 6th grade to 61% in 12th grade).
• Larks are more likely than owls to get more sleep on school nights, say they had a “good night’s sleep” every night or almost every night, and have less sleep problems related to sleepiness. For more detail, please see the sleep profile on the following page.
Don't know /Refused
1%
Neither8%
Larks35%
Ow ls56%
Larks vs. Owls % Owls, by Grade
Base = Total Adolescents (n=1,602)Letters indicate significant differences at the 95% confidence level.C14
51%
50%
44%
61%CDE
63%CDE
64%CDE
59%CD
0% 20% 40% 60% 80% 100%
12th grade (J)
11th grade (I)
10th grade (H)
9th grade (G)
8th grade (E)
7th grade (D)
6th grade (C)
32
Lark vs. Owl Lark Owl
B C
(564) (897)
At least a few days/nights a week
Difficulty falling asleep 24% 33%B
Difficulty staying asleep 16 20B
Fallen asleep in school 8 15B
Had trouble getting along with family 16 23B
Felt too tired or sleepy during the day 24 38B
Fallen asleep while doing homework/studying 6 10B
Felt cranky or irritable during the day 15 27B
Arrived late or missed school because you overslept 3 6B
Felt too tired to do exercise or other physical activity 10 20B
Snored 16 14
At risk for RLS 5 10B
Sleep problem Parent thinks adolescent has (Yes) 5% 7% Adolescent thinks has (Yes/Maybe) 11 19B
BMI Underweight/Normal 69% 68% At risk for overweight 12 14 Overweight 13 13
Depressive mood score* 10-<15 49%C 43% 15-<20 36 37
20-30 14 19B 5+ hours/week Sports/Exercise 52% 47% Extracurricular activities 26 30 Work at paying job 10+ hours/week 7% 13%B Drink caffeinated beverages 2+ cups/cans per day 29% 33% Grades As 25% 27%
As and Bs/Bs 50 47 Bs and Cs or worse 24 24
Lark Owl B C
(564) (897)
Set bedtime on school nights
Yes 80%C 67%
Adult involved in waking adolescent on school days
Yes 61% 70%B
Length of time taken to fall asleep on school nights Less than 10 minutes 29%C 22% 10 to 29 minutes 53C 45 30 minutes or more 16 33B
Hours slept on school nights
Insufficient (Less than 8 hours) 34% 52%B
Borderline (8 to less than 9 hours) 36C 27
Optimal (9 or more hours) 25C 17
Mean (# of hours) 7.9C 7.4
Hours slept on non-school nights
Insufficient (Less than 8 hours) 16% 17%
Borderline (8 to less than 9 hours) 25C 18
Optimal (9 or more hours) 53 60B
Mean (# of hours) 8.8 8.9
Parent believes adolescent gets enough sleep on school nights
Every night/Almost every night 81%C 65%
Quality of adolescent’s sleep
Fair/Poor 6% 11%B
“I had a good night’s sleep” Every night or almost every night 54%C 32% A few nights a month or less 14 27B
Actual vs. minimum hours of sleep needed (school nights)
Get less sleep than needed 47% 62%B
Get the same amount of sleep as needed 30C 19
Get more sleep than needed 17 13
Sleep Profile – Lark vs. Owl
* Please refer to page 44 of the Summary of Findings for an explanation of the depressive mood score.

33
Sleep Problems

34
Frequency of Sleep Problems/Consequences
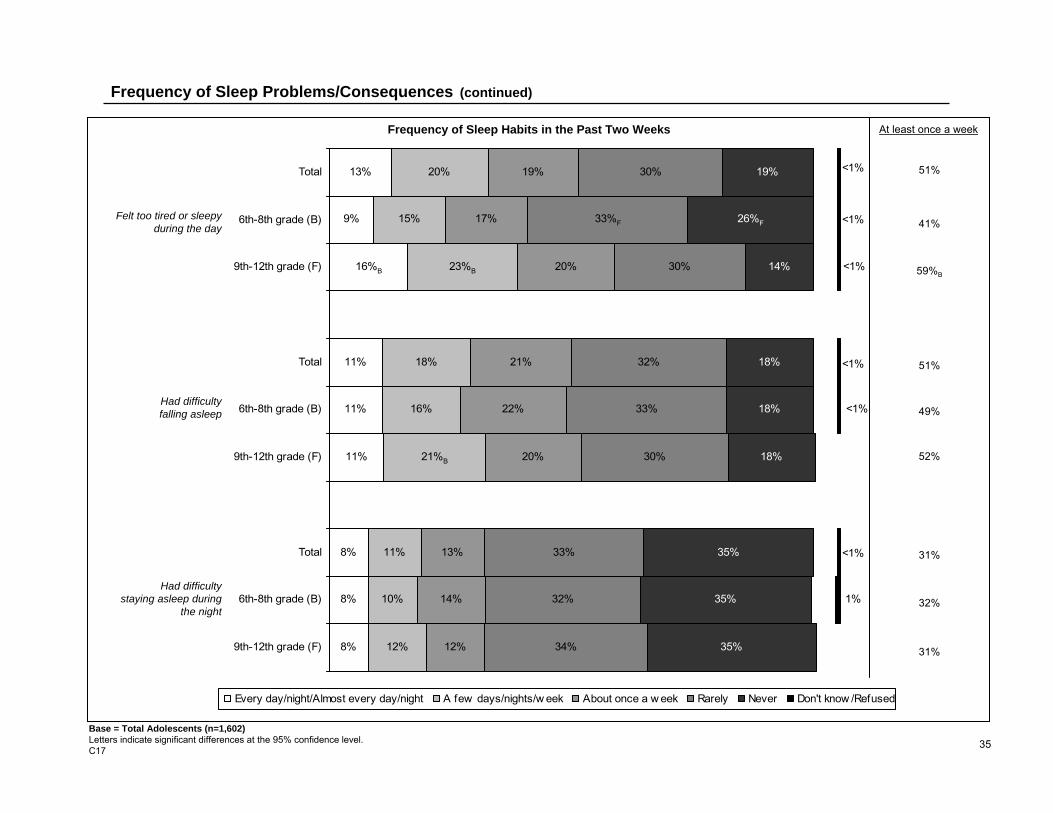
All of the adolescents were asked how often they experienced a series of sleep problems and consequences within the last two weeks.
• More than one-half of adolescents reported that they feel too tired or sleepy during the day (51%) and/or had difficulty falling asleep (51%) at least once a week within the past two weeks.
– High school (9th to 12th grade) adolescents were more likely than 6th to 8th grade adolescents to report that they felt too tired or sleepy during the day at least once a week within the past two weeks (59% vs. 41%).
• About three in ten adolescents (31%) said they had difficulty staying asleep during the night at least once a week in the past two weeks.
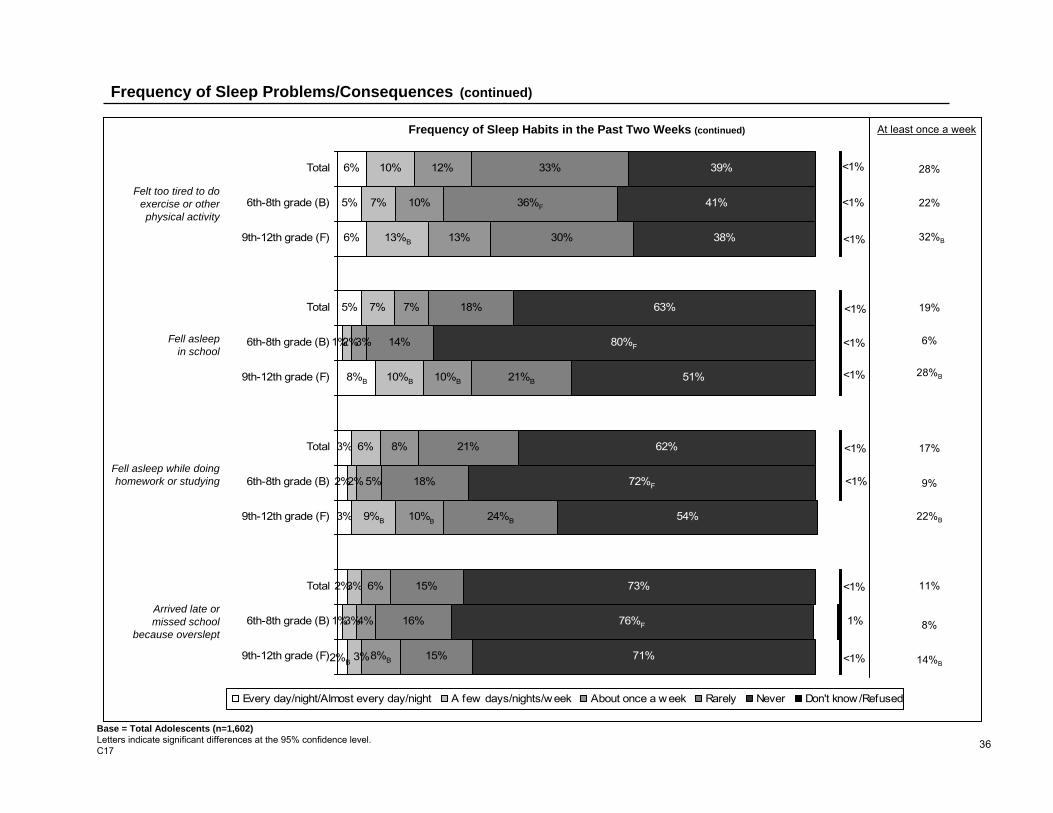
• About three in ten adolescents reported that they felt too tired to do exercise or other physical activity at least once a week in the past two weeks (28%), with 9th to 12th grade adolescents more likely than 6th to 8th grade adolescents to say this (32% vs. 22%).
• About two in ten adolescents said that they fell asleep in school (19%) and/or fell asleep while doing homework or studying (17%) at least once a week within the last two weeks.
– High school (9th to 12th grade) adolescents were more likely than middle school (6th to 8th grade) adolescents to report either of these habits (28% vs. 6%, and 22% vs. 9%, respectively).
• In addition, about one in ten adolescents (11%) said they had arrived late or had missed school because they overslept at least once a week within the last two weeks.
– High school (9th to 12th grade) adolescents were more likely than middle school (6th to 8th grade) adolescents to report that they had arrived late or had missed school because they overslept at least once a week within the past two weeks (14% vs. 8%).
35
8%
8%
11%
11%
11%
9%
13%
10%
11%
16%
18%
15%
20%
12%
13%
20%
22%
21%
17%
19%
34%
32%
33%
30%
32%
30%
35%
18%
14%
19%
16%B
8%
23%B
21%B
12%
20%
14%
33%F
33%
30%
18%
26%F
18%
35%
35% 1%
<1%
<1%
<1%
<1%
<1%
<1%
9th-12th grade (F)
6th-8th grade (B)
Total
9th-12th grade (F)
6th-8th grade (B)
Total
9th-12th grade (F)
6th-8th grade (B)
Total
Every day/night/Almost every day/night A few days/nights/w eek About once a w eek Rarely Never Don't know /Refused
Frequency of Sleep Problems/Consequences (continued)
Base = Total Adolescents (n=1,602)Letters indicate significant differences at the 95% confidence level.C17
Frequency of Sleep Habits in the Past Two Weeks
Felt too tired or sleepy during the day
Had difficultyfalling asleep
51%
41%
59%B
51%
49%
52%
At least once a week
Had difficulty staying asleep during
the night
31%
32%
31%
36
1%
2%
3%
2%
3%
1%
5%
6%
5%
6%
3%
6%
7%
7%
10%
6%
10%
8%
7%
13%
10%
12%
16%
15%
18%
21%
14%
18%
30%
33%
73%
54%
62%
51%
63%
41%
39%
2%B
8%B
3%
2%
2%
3%
13%B
10%B
9%B
5%
3%
8%B
10%B
4%
24%B
15%
21%B
36%F
76%F
38%
80%F
72%F
71% <1%
1%
<1%
<1%
<1%
<1%
<1%
<1%
<1%
<1%
<1%
9th-12th grade (F)
6th-8th grade (B)
Total
9th-12th grade (F)
6th-8th grade (B)
Total
9th-12th grade (F)
6th-8th grade (B)
Total
9th-12th grade (F)
6th-8th grade (B)
Total
Every day/night/Almost every day/night A few days/nights/week About once a week Rarely Never Don't know /Refused
Frequency of Sleep Problems/Consequences (continued)
Base = Total Adolescents (n=1,602)Letters indicate significant differences at the 95% confidence level.C17
Frequency of Sleep Habits in the Past Two Weeks (continued)
Felt too tired to do exercise or other physical activity
Fell asleepin school
Fell asleep while doing homework or studying
28%
22%
32%B
19%
6%
28%B
17%
9%
22%B
At least once a week
Arrived late or missed school
because overslept
11%
8%
14%B
B
37
6%4%
4%
3%
12%
24%
34%
5%
9%
12%
16%
32%
45%
12%B
18%B
19%B
39%B
54%B
0% 20% 40% 60% 80% 100%
h
p
i
j
o
comp
Total
6th-8th grade (B)
9th-12th grade (F)
Adolescent Had Problems with Sleepiness
(% at least a few days/week) (% every day/almost every day)
Base = Total adolescents (n=1,602)Don’t know = <1%Letters indicate significant differences at the 95% confidence level.C17h, i, j, o, p
Composite: Any problem
with sleepiness
Felt too tired or sleepy during the day
Fell asleepin school
Felt too tired to do exercise/activity
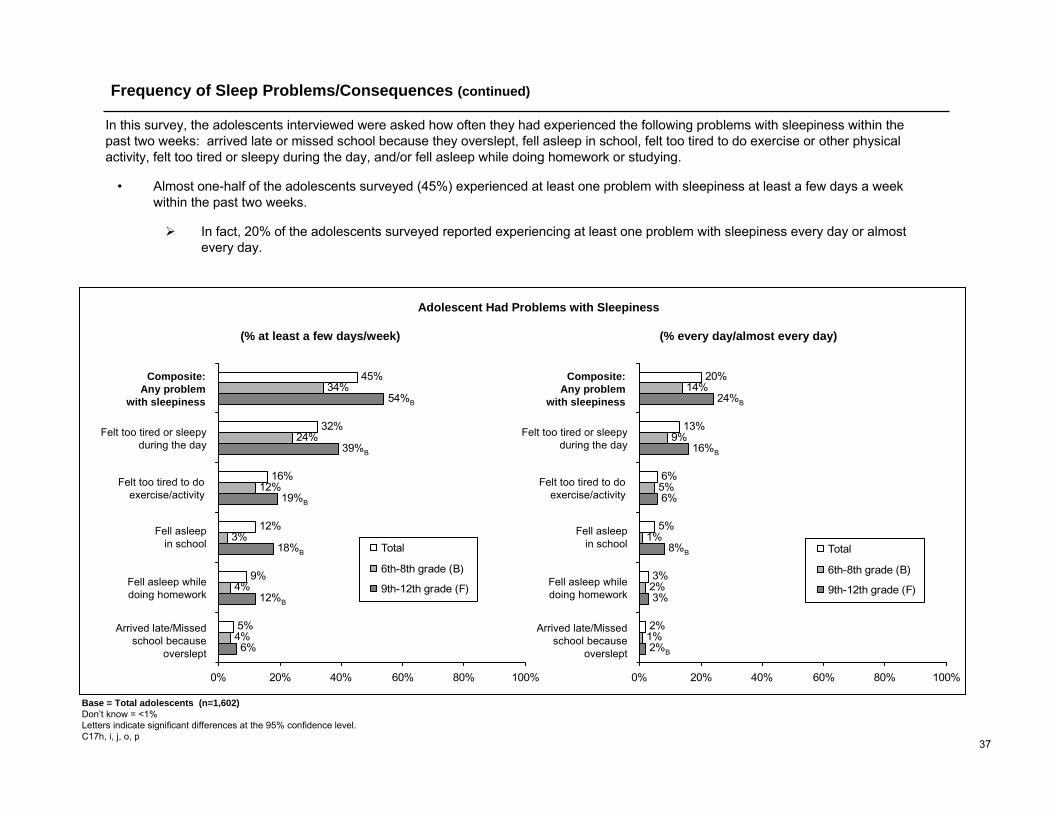
Frequency of Sleep Problems/Consequences (continued)
In this survey, the adolescents interviewed were asked how often they had experienced the following problems with sleepiness within the past two weeks: arrived late or missed school because they overslept, fell asleep in school, felt too tired to do exercise or other physical activity, felt too tired or sleepy during the day, and/or fell asleep while doing homework or studying.
• Almost one-half of the adolescents surveyed (45%) experienced at least one problem with sleepiness at least a few days a week within the past two weeks.
In fact, 20% of the adolescents surveyed reported experiencing at least one problem with sleepiness every day or almost every day.
Fell asleep while doing homework
Arrived late/Missed school because
overslept
3%
6%
1%
1%
5%
9%
14%
2%
3%
5%
6%
13%
20%
2%B
8%B
16%B
24%B
2%
0% 20% 40% 60% 80% 100%
h
p
i
j
o
comp
Total
6th-8th grade (B)
9th-12th grade (F)
Felt too tired or sleepy during the day
Fell asleepin school
Felt too tired to do exercise/activity
Fell asleep while doing homework
Arrived late/Missed school because
overslept
Composite: Any problem
with sleepiness
38
8%
9%
11%
20%
8%
8%
11%
21%
8%
9%
11%
20%
0% 20% 40% 60% 80% 100%
Difficulty stayingasleep
Woken up beforehad to
Difficulty fallingasleep
Total
6th-8th grade (B)
9th-12th grade (F)
20%
23%
46%
18%
23%
27%
45%
19%
23%
30%
45%
32%B
0% 20% 40% 60% 80% 100%
Difficulty stayingasleep
Woken up beforehad to
Difficulty fallingasleep
Total
6th-8th grade (B)
9th-12th grade (F)
Adolescent Had Difficulty Sleeping
(% at least a few nights/week) (% every night/almost every night)
Base = Total adolescents (n=1,602)Don’t know = <1%Letters indicate significant differences at the 95% confidence level.C17a-c
Composite:Any difficulty
falling/staying asleep
Difficultyfalling asleep
Difficultystaying asleep
Woken up before had to
Composite: Any problem with
sleepiness
Difficultyfalling asleep
Difficultystaying asleep
Woken up before had to
Frequency of Sleep Problems/Consequences (continued)
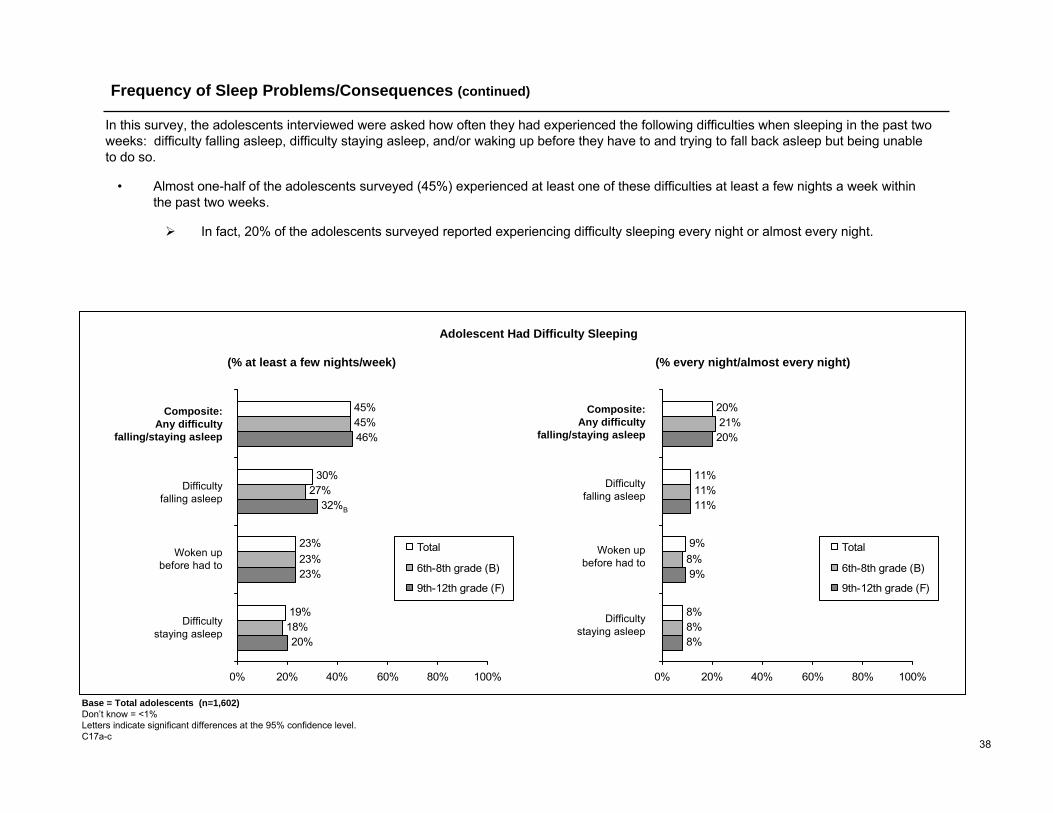
In this survey, the adolescents interviewed were asked how often they had experienced the following difficulties when sleeping in the past two weeks: difficulty falling asleep, difficulty staying asleep, and/or waking up before they have to and trying to fall back asleep but being unable to do so.
• Almost one-half of the adolescents surveyed (45%) experienced at least one of these difficulties at least a few nights a week within the past two weeks.
In fact, 20% of the adolescents surveyed reported experiencing difficulty sleeping every night or almost every night.
Composite: Any difficulty
falling/staying asleep
39
9%
7%
8%
0% 20% 40% 60% 80% 100%
9th-12th grade (F)
6th-8th grade (B)
Total
Adolescent Snoring/Restless Legs Syndrome
10%
10%
10%
7%
8%
8%
4%
5%
37%
35%
36%
42%
39%
41%
7%F
9th-12th grade (F)
6th-8th grade (B)
Total
Every night/Almost every night A few nights a w eek About once a w eek Rarely Never
How Often Caregiver Believes Adolescent Snored in the Past Two Weeks
Base = Those caregivers answering (n=1,349)Letters indicate significant differences at the 95% confidence level.P13
At least afew nights
a week
17%
18%
19%
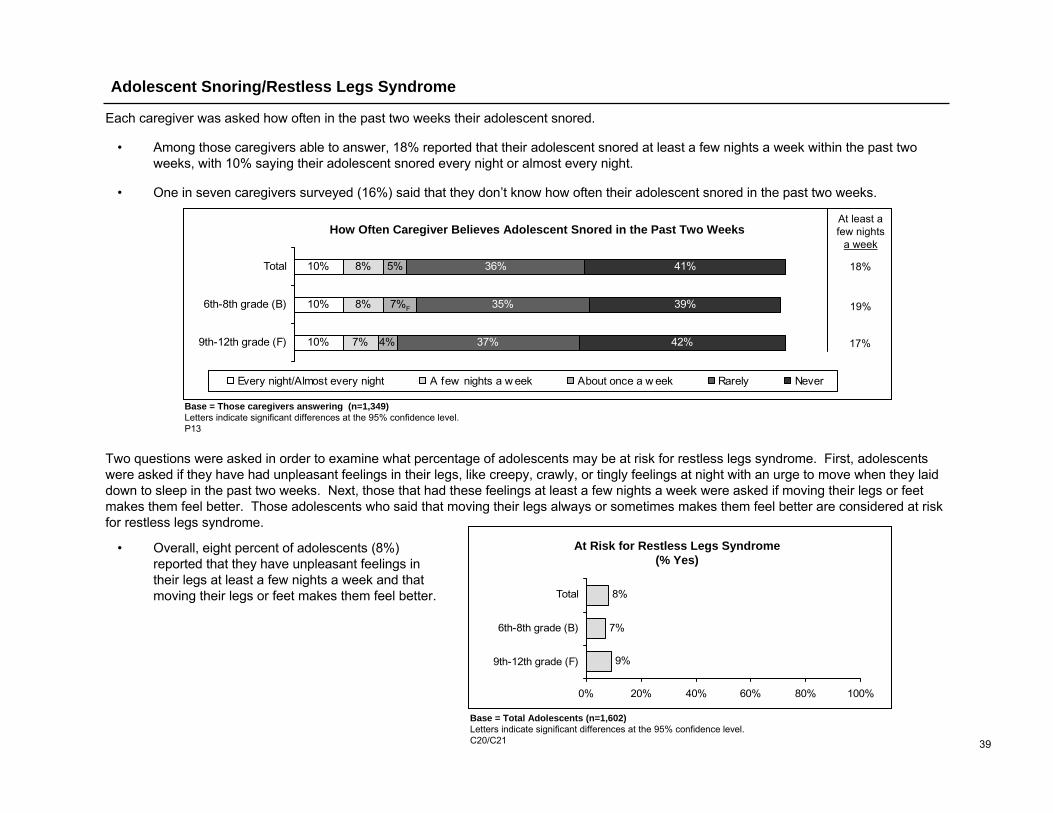
Each caregiver was asked how often in the past two weeks their adolescent snored.
• Among those caregivers able to answer, 18% reported that their adolescent snored at least a few nights a week within the past two weeks, with 10% saying their adolescent snored every night or almost every night.
• One in seven caregivers surveyed (16%) said that they don’t know how often their adolescent snored in the past two weeks.
Base = Total Adolescents (n=1,602)Letters indicate significant differences at the 95% confidence level.C20/C21
At Risk for Restless Legs Syndrome(% Yes)
Two questions were asked in order to examine what percentage of adolescents may be at risk for restless legs syndrome. First, adolescents were asked if they have had unpleasant feelings in their legs, like creepy, crawly, or tingly feelings at night with an urge to move when they laid down to sleep in the past two weeks. Next, those that had these feelings at least a few nights a week were asked if moving their legs or feet makes them feel better. Those adolescents who said that moving their legs always or sometimes makes them feel better are considered at risk for restless legs syndrome.
• Overall, eight percent of adolescents (8%) reported that they have unpleasant feelings in their legs at least a few nights a week and that moving their legs or feet makes them feel better.

40
At least a few nights/week
Rarely/ Never
B C
At least a few days/nights a week
Difficulty falling asleep 32% 29%
Difficulty staying asleep 22 17
Fallen asleep in school 14 10
Had trouble getting along with family 22 20
Felt too tired or sleepy during the day 33 32
Fallen asleep while doing homework/studying 9 8
Felt cranky or irritable during the day 24 22
Arrived late or missed school because you overslept 7 4
Felt too tired to do exercise or other physical activity 19 16
At risk for RLS 9 8 Sleep problem
Parent thinks adolescent has (Yes) 15%C 5% Adolescent thinks has (Yes/Maybe) 19 15
BMI Underweight/Normal 55% 73%B At risk for overweight 19C 12 Overweight 21C 10
Depressive mood score* 10-<15 47% 45% 15-<20 33 38
20-30 20 17 5+ hours/week Sports/Exercise 45% 51% Extracurricular activities 27 28 Work at paying job 10+ hours/week 8% 11% Drink caffeinated beverages 2+ cups/cans per day 40%C 29% Grades As 19% 29%B
As and Bs/Bs 40 49B Bs and Cs or worse 40C 21
Adolescent Snores
At least a few nights/week
Rarely/ Never
B C
Set bedtime on school nights
Yes 72% 73%
Adult involved in waking adolescent on school days
Yes 69% 67% Length of time taken to fall asleep on school nights
Less than 10 minutes 32%C 23% 10 to 29 minutes 39 50B 30 minutes or more 28 26
Hours slept on school nights
Insufficient (Less than 8 hours) 43% 44%
Borderline (8 to less than 9 hours) 36 31
Optimal (9 or more hours) 16 20
Mean (# of hours) 7.5 7.6
Hours slept on non-school nights
Insufficient (Less than 8 hours) 19% 16%
Borderline (8 to less than 9 hours) 26 20
Optimal (9 or more hours) 48 60B
Mean (# of hours) 8.6 8.9B
Parent believes adolescent gets enough sleep on school nights
Every night/Almost every night 63% 73%B
Quality of adolescent’s sleep
Fair/Poor 17%C 7% “I had a good night’s sleep”
Every night or almost every night 45% 42% A few nights a month or less 22 23
Actual vs. minimum hours of sleep needed (school nights)
Get less sleep than needed 55% 57%
Get the same amount of sleep as needed 24 24
Get more sleep than needed 14 14
Lark or owl Lark (Morning person) 37% 35% Owl (Evening person) 53 55
Sleep Profile – Adolescent Snores
* Please refer to page 44 of the Summary of Findings for an explanation of the depressive mood score.
41
32%
41%
32%
36%
7%
12%
6%
8%
2%
2%
2%
53%F
39%B 16%B 10%B
<1%
<1%
<1%9th-12th grade (F)
6th-8th grade (B)
Total
Every night/Almost every night A few nights/w eek A few nights/month Rarely Never Don't know
Adolescents Say “I Had a Good Night’s Sleep”
Base = Total Adolescents (n=1,602)Letters indicate significant differences at the 95% confidence level.C16
Number of Nights Adolescents Can Say “I Had a Good Night’s Sleep”
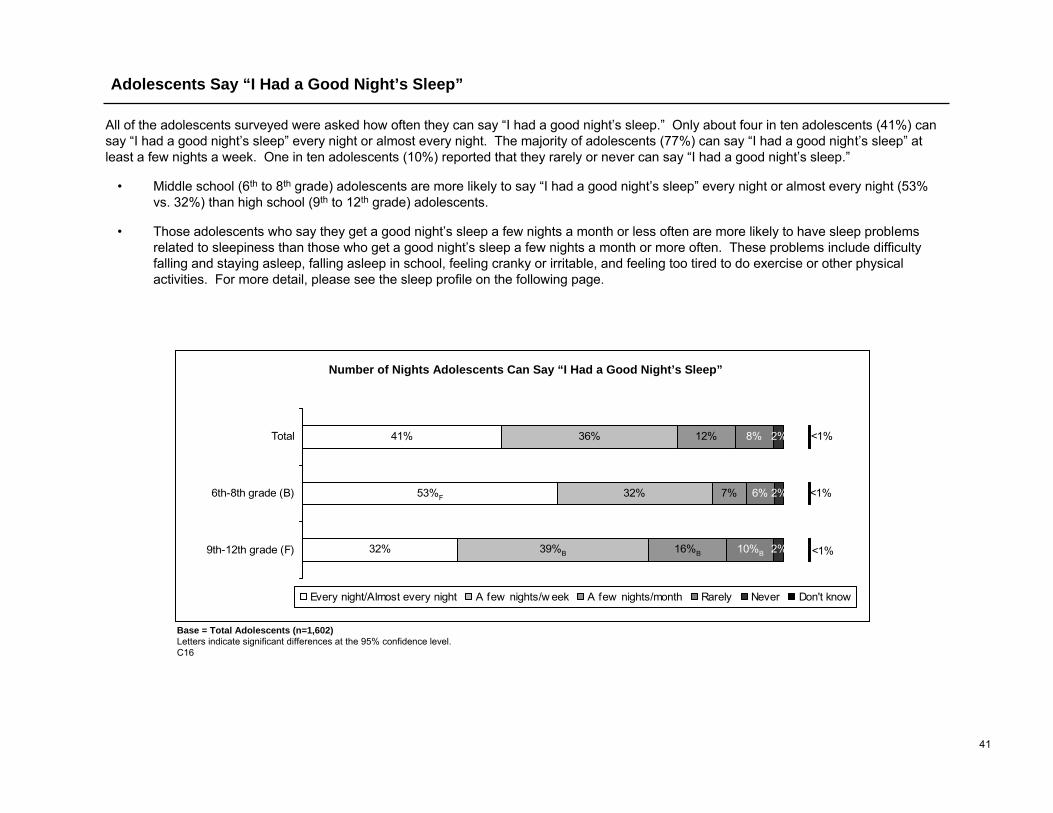
All of the adolescents surveyed were asked how often they can say “I had a good night’s sleep.” Only about four in ten adolescents (41%) can say “I had a good night’s sleep” every night or almost every night. The majority of adolescents (77%) can say “I had a good night’s sleep” at least a few nights a week. One in ten adolescents (10%) reported that they rarely or never can say “I had a good night’s sleep.”
• Middle school (6th to 8th grade) adolescents are more likely to say “I had a good night’s sleep” every night or almost every night (53% vs. 32%) than high school (9th to 12th grade) adolescents.
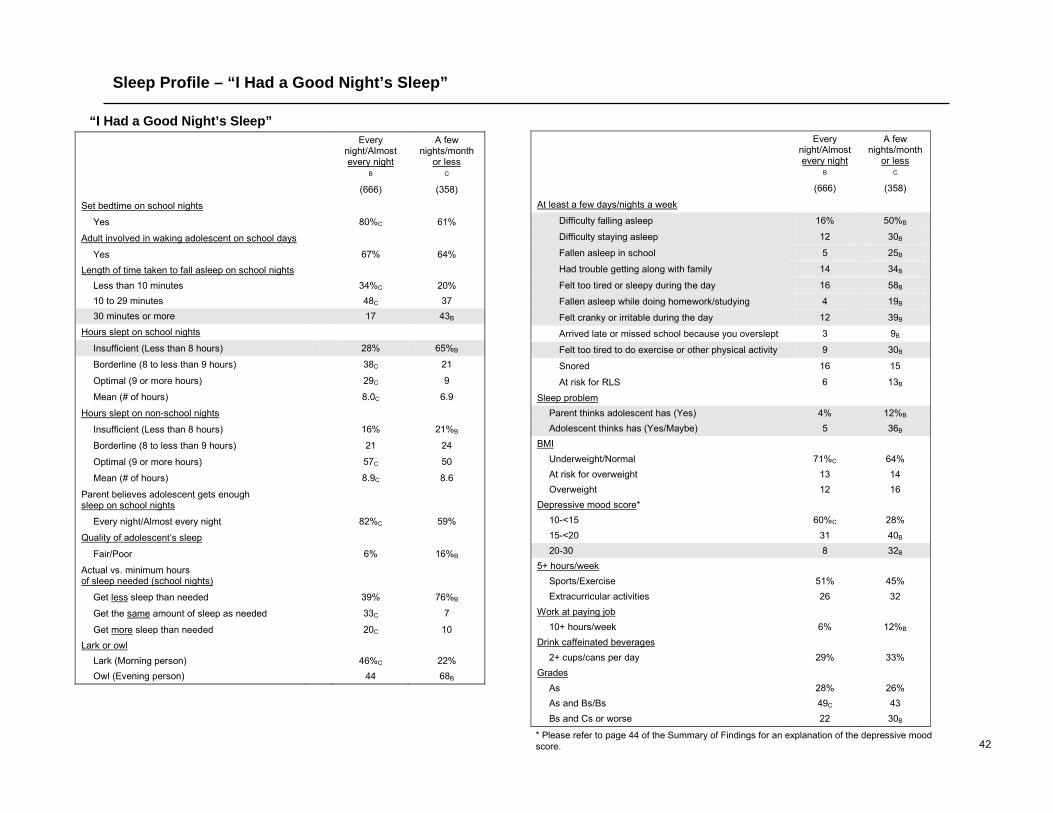
• Those adolescents who say they get a good night’s sleep a few nights a month or less often are more likely to have sleep problems related to sleepiness than those who get a good night’s sleep a few nights a month or more often. These problems include difficulty falling and staying asleep, falling asleep in school, feeling cranky or irritable, and feeling too tired to do exercise or other physical activities. For more detail, please see the sleep profile on the following page.
42
Every
night/Almost every night
A few nights/month
or less B C
(666) (358)
At least a few days/nights a week
Difficulty falling asleep 16% 50%B
Difficulty staying asleep 12 30B
Fallen asleep in school 5 25B
Had trouble getting along with family 14 34B
Felt too tired or sleepy during the day 16 58B
Fallen asleep while doing homework/studying 4 19B
Felt cranky or irritable during the day 12 39B
Arrived late or missed school because you overslept 3 9B
Felt too tired to do exercise or other physical activity 9 30B
Snored 16 15
At risk for RLS 6 13B
Sleep problem Parent thinks adolescent has (Yes) 4% 12%B Adolescent thinks has (Yes/Maybe) 5 36B
BMI Underweight/Normal 71%C 64% At risk for overweight 13 14 Overweight 12 16
Depressive mood score* 10-<15 60%C 28% 15-<20 31 40B
20-30 8 32B 5+ hours/week Sports/Exercise 51% 45% Extracurricular activities 26 32 Work at paying job 10+ hours/week 6% 12%B Drink caffeinated beverages 2+ cups/cans per day 29% 33% Grades As 28% 26%
As and Bs/Bs 49C 43 Bs and Cs or worse 22 30B
“I Had a Good Night’s Sleep”
Every
night/Almost every night
A few nights/month
or less B C
(666) (358)
Set bedtime on school nights
Yes 80%C 61%
Adult involved in waking adolescent on school days
Yes 67% 64%
Length of time taken to fall asleep on school nights Less than 10 minutes 34%C 20% 10 to 29 minutes 48C 37 30 minutes or more 17 43B
Hours slept on school nights
Insufficient (Less than 8 hours) 28% 65%B
Borderline (8 to less than 9 hours) 38C 21
Optimal (9 or more hours) 29C 9
Mean (# of hours) 8.0C 6.9
Hours slept on non-school nights
Insufficient (Less than 8 hours) 16% 21%B
Borderline (8 to less than 9 hours) 21 24
Optimal (9 or more hours) 57C 50
Mean (# of hours) 8.9C 8.6
Parent believes adolescent gets enough sleep on school nights
Every night/Almost every night 82%C 59%
Quality of adolescent’s sleep
Fair/Poor 6% 16%B
Actual vs. minimum hours of sleep needed (school nights)
Get less sleep than needed 39% 76%B
Get the same amount of sleep as needed 33C 7
Get more sleep than needed 20C 10 Lark or owl
Lark (Morning person) 46%C 22% Owl (Evening person) 44 68B
Sleep Profile – “I Had a Good Night’s Sleep”
* Please refer to page 44 of the Summary of Findings for an explanation of the depressive mood score.
43
13%
12%
8%
9%
9%
11%
10%CE
14%E
5%
4%
5%
3%
4%
6%
5%
8%E
0% 20% 40% 60% 80% 100%
12th grade (J)
11th grade (I)
10th grade (H)
9th grade (G)
8th grade (E)
7th grade (D)
6th grade (C)
Total
Yes
Maybe
8%
9%
6%
5%
6%
5%
7%
9%CE
0% 20% 40% 60% 80% 100%
12th grade (J)
11th grade (I)
10th grade (H)
9th grade (G)
8th grade (E)
7th grade (D)
6th grade (C)
Total
Caregiver Thinks Adolescent Has a Sleep Problem(% Yes)
Base = Total Caregivers (n=1,602)Don’t know = 2%Letters indicate significant differences at the 95% confidence level.P12
Adolescent Has a Sleep Problem
Adolescent Thinks They Have a Sleep Problem(% Yes/Maybe)
Base = Total Adolescents (n=1,602)Don’t know/Refused = 2%Letters indicate significant differences at the 95% confidence level.C18
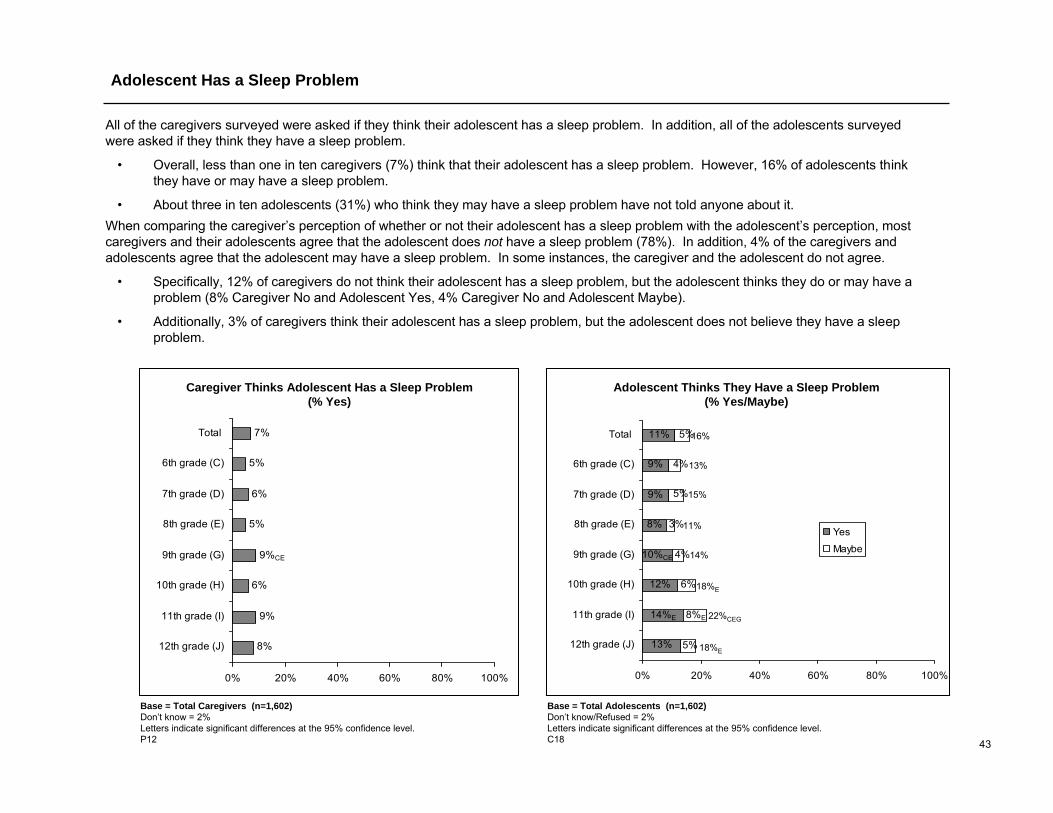
All of the caregivers surveyed were asked if they think their adolescent has a sleep problem. In addition, all of the adolescents surveyed were asked if they think they have a sleep problem.
• Overall, less than one in ten caregivers (7%) think that their adolescent has a sleep problem. However, 16% of adolescents think they have or may have a sleep problem.
• About three in ten adolescents (31%) who think they may have a sleep problem have not told anyone about it.
16%
13%
15%
11%
14%
18%E
22%CEG
18%E
When comparing the caregiver’s perception of whether or not their adolescent has a sleep problem with the adolescent’s perception, most caregivers and their adolescents agree that the adolescent does not have a sleep problem (78%). In addition, 4% of the caregivers and adolescents agree that the adolescent may have a sleep problem. In some instances, the caregiver and the adolescent do not agree.
• Specifically, 12% of caregivers do not think their adolescent has a sleep problem, but the adolescent thinks they do or may have a problem (8% Caregiver No and Adolescent Yes, 4% Caregiver No and Adolescent Maybe).
• Additionally, 3% of caregivers think their adolescent has a sleep problem, but the adolescent does not believe they have a sleepproblem.
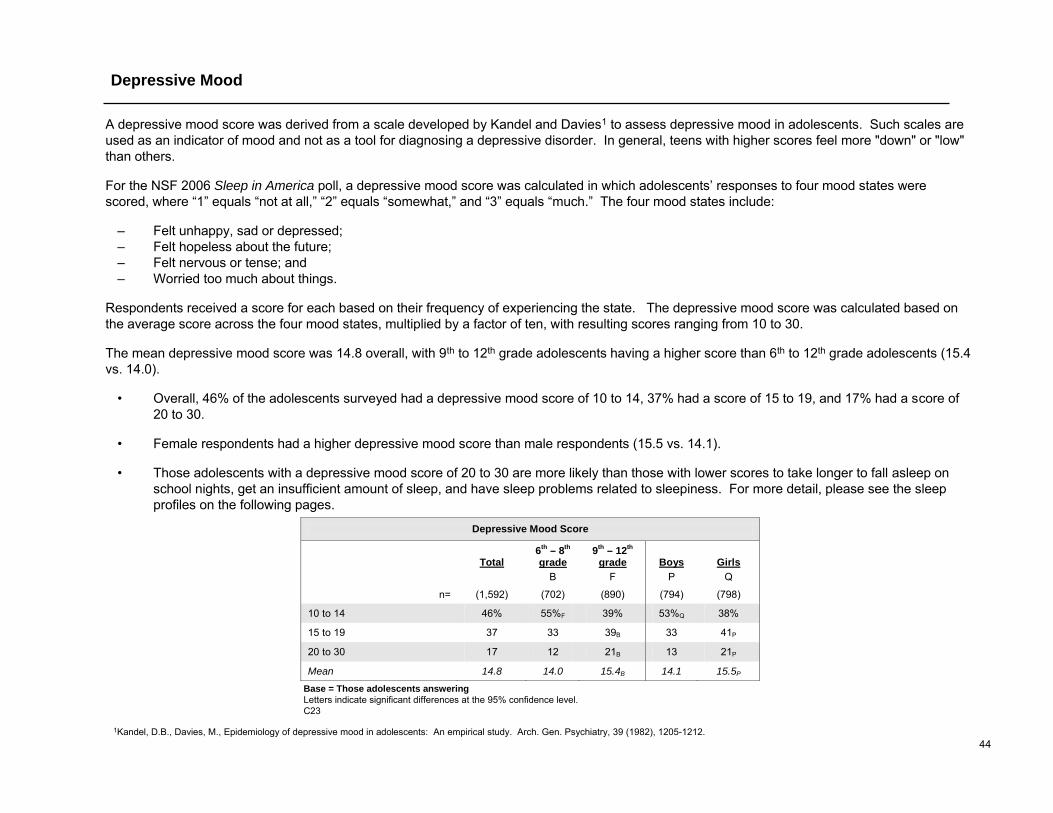
44
Depressive Mood Score
Total 6th – 8th grade
9th – 12th grade Boys Girls
B F P Q
n= (1,592) (702) (890) (794) (798)
10 to 14 46% 55%F 39% 53%Q 38%
15 to 19 37 33 39B 33 41P
20 to 30 17 12 21B 13 21P
Mean 14.8 14.0 15.4B 14.1 15.5P
Depressive Mood
Base = Those adolescents answeringLetters indicate significant differences at the 95% confidence level.C23
A depressive mood score was derived from a scale developed by Kandel and Davies1 to assess depressive mood in adolescents. Such scales are used as an indicator of mood and not as a tool for diagnosing a depressive disorder. In general, teens with higher scores feel more "down" or "low" than others.
For the NSF 2006 Sleep in America poll, a depressive mood score was calculated in which adolescents’ responses to four mood states were scored, where “1” equals “not at all,” “2” equals “somewhat,” and “3” equals “much.” The four mood states include:
– Felt unhappy, sad or depressed;– Felt hopeless about the future;– Felt nervous or tense; and– Worried too much about things.
Respondents received a score for each based on their frequency of experiencing the state. The depressive mood score was calculated based on the average score across the four mood states, multiplied by a factor of ten, with resulting scores ranging from 10 to 30.
The mean depressive mood score was 14.8 overall, with 9th to 12th grade adolescents having a higher score than 6th to 12th grade adolescents (15.4 vs. 14.0).
• Overall, 46% of the adolescents surveyed had a depressive mood score of 10 to 14, 37% had a score of 15 to 19, and 17% had a score of 20 to 30.
• Female respondents had a higher depressive mood score than male respondents (15.5 vs. 14.1).
• Those adolescents with a depressive mood score of 20 to 30 are more likely than those with lower scores to take longer to fall asleep on school nights, get an insufficient amount of sleep, and have sleep problems related to sleepiness. For more detail, please see the sleep profiles on the following pages.
1Kandel, D.B., Davies, M., Epidemiology of depressive mood in adolescents: An empirical study. Arch. Gen. Psychiatry, 39 (1982), 1205-1212.
45
Depressive Mood (continued)
All of the adolescents surveyed were asked how often they were bothered or troubled by a series of five mood states within the past two weeks, using a scale of much, somewhat, or not at all.
• Most often, the adolescents surveyed reported that they were bothered much or somewhat by worrying too much about things (58%) and/or being stressed out or anxious (56%).
• About one-half of adolescents (47%) were bothered by feeling nervous or tense much or somewhat within the past two weeks.
• About four in ten adolescents (39%) felt unhappy, sad or depressed much or somewhat within the past two weeks.
• About one-fourth of the adolescents surveyed (24%) reported that they were bothered much or somewhat in the past two weeks by feeling hopeless about the future.
• High school (9th to 12th grade) adolescents are more likely than middle school (6th to 8th grade) adolescents to report feeling each of these mood states much or somewhat within the past two weeks.
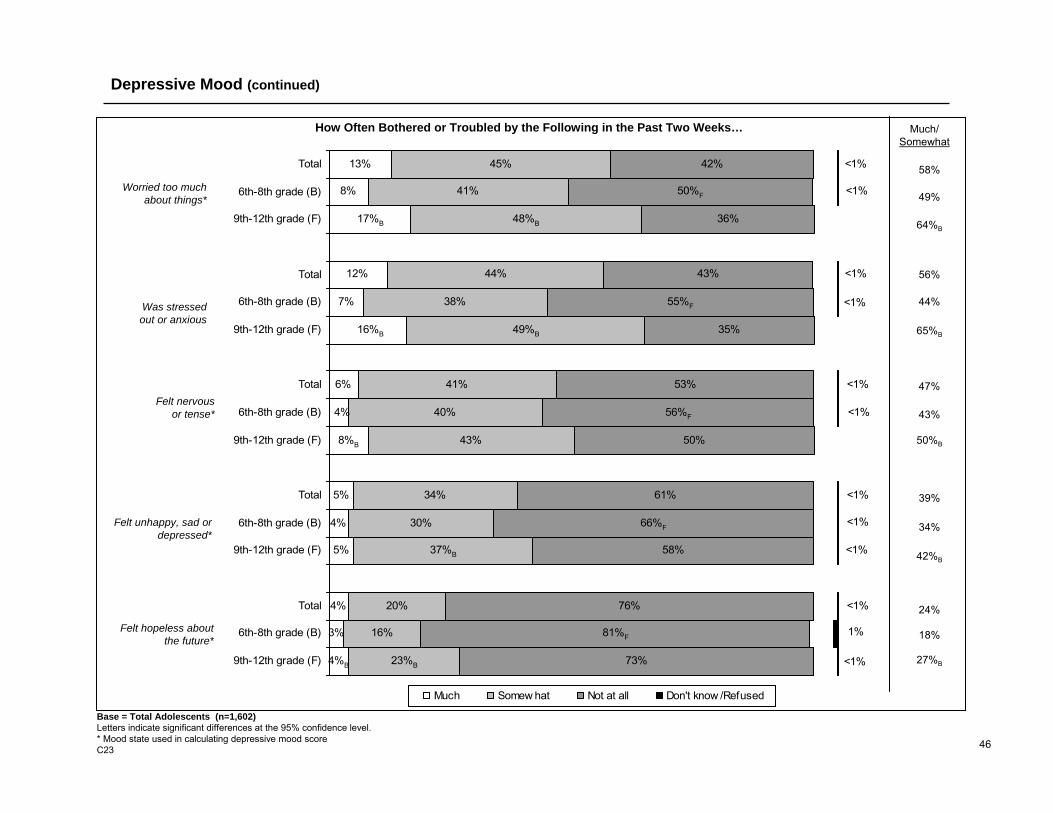
46
3%
4%
4%
5%
6%
8%
13%
16%
20%
30%
34%
43%
40%
41%
38%
44%
41%
45%
76%
58%
61%
50%
53%
35%
43%
36%
42%
4%B
16%B
8%B
5%
7%
4%
12%
17%B
23%B
48%B
49%B
37%B
81%F
50%F
55%F
56%F
66%F
73%
<1%
<1%
<1%
<1%
<1%
<1%
<1%
<1%
<1%
<1%
1%
<1%9th-12th grade (F)
6th-8th grade (B)
Total
9th-12th grade (F)
6th-8th grade (B)
Total
9th-12th grade (F)
6th-8th grade (B)
Total
9th-12th grade (F)
6th-8th grade (B)
Total
9th-12th grade (F)
6th-8th grade (B)
Total
Much Somew hat Not at all Don't know /Refused
Depressive Mood (continued)
Base = Total Adolescents (n=1,602)Letters indicate significant differences at the 95% confidence level.* Mood state used in calculating depressive mood scoreC23
How Often Bothered or Troubled by the Following in the Past Two Weeks…
Felt unhappy, sad or depressed*
Felt hopeless about the future*
Felt nervous or tense*
Worried too much about things*
Was stressed out or anxious
Much/Somewhat
58%
49%
64%B
56%
44%
65%B
47%
43%
50%B
39%
34%
42%B
24%
18%
27%B

47
10-<15 15-<20 20-30 B C D
(733) (587) (272)
At least a few days/nights a week
Difficulty falling asleep 18% 35%B 51%BC
Difficulty staying asleep 11 23B 32BC
Fallen asleep in school 7 13B 22BC
Had trouble getting along with family 12 21B 44BC
Felt too tired or sleepy during the day 19 37B 59BC
Fallen asleep while doing homework/studying 3 10B 21BC
Felt cranky or irritable during the day 10 26B 48BC
Arrived late or missed school because you overslept 4 5 8B
Felt too tired to do exercise or other physical activity 10 18B 29BC
Snored 15 13 18
At risk for RLS 4 10B 15BC
Sleep problem Parent thinks adolescent has (Yes) 5% 7% 11%B Adolescent thinks has (Yes/Maybe) 6 19B 34BC
BMI Underweight/Normal 67% 70% 69% At risk for overweight 15C 11 12 Overweight 12 14 15
5+ hours/week Sports/Exercise 49% 50% 46% Extracurricular activities 27 29 29 Work at paying job 10+ hours/week 9% 13% 13% Drink caffeinated beverages 2+ cups/cans per day 29% 34% 33% Grades As 28% 28% 26%
As and Bs/Bs 50 48 44 Bs and Cs or worse 22 23 29BC
Depressive Mood Score 10-<15 15-<20 20-30 B C D
(733) (587) (272)
Set bedtime on school nights
Yes 75%CD 69% 66%
Adult involved in waking adolescent on school days
Yes 68% 65% 66%
Length of time taken to fall asleep on school nights
Less than 10 minutes 29%CD 22% 20% 10 to 29 minutes 51D 47 40 30 minutes or more 18 30B 39BC
Hours slept on school nights
Insufficient (Less than 8 hours) 37% 49%B 59%BC
Borderline (8 to less than 9 hours) 34D 31D 20
Optimal (9 or more hours) 25CD 16 15
Mean (# of hours) 7.8CD 7.5D 7.2
Hours slept on non-school nights
Insufficient (Less than 8 hours) 16% 16% 21%
Borderline (8 to less than 9 hours) 19 22 21
Optimal (9 or more hours) 60D 57 51
Mean (# of hours) 8.9 8.8 8.7
Parent believes adolescent gets enough sleep on school nights
Every night/Almost every night 77%CD 70%D 57%
Quality of adolescent’s sleep
Fair/Poor 7% 9% 15%BC
“I had a good night’s sleep” Every night or almost every night 55%CD 34%D 20% A few nights a month or less 14 24B 42BC
Actual vs. minimum hours of sleep needed (school nights)
Get less sleep than needed 47% 60%B 73%BC
Get the same amount of sleep as needed 30CD 21D 10
Get more sleep than needed 17D 14 11 Lark or owl
Lark (Morning person) 37%D 34% 29% Owl (Evening person) 53 57 64B
Sleep Profile – Depressive Mood Score

48
10-<15 15-<20 20-30 B C D
(423) (265) (106)
At least a few days/nights a week
Difficulty falling asleep 17% 34%B 50%BC
Difficulty staying asleep 9 21B 26B
Fallen asleep in school 8 14B 23B
Had trouble getting along with family 10 17B 42BC
Felt too tired or sleepy during the day 19 36B 61BC
Fallen asleep while doing homework/studying 2 11B 20BC
Felt cranky or irritable during the day 8 23B 40BC
Arrived late or missed school because you overslept 2 5 10B
Felt too tired to do exercise or other physical activity 9 17B 23B
Snored 17 16 21
At risk for RLS 4 10B 15B
Sleep problem Parent thinks adolescent has (Yes) 6% 9% 9% Adolescent thinks has (Yes/Maybe) 5 20B 29B
BMI Underweight/Normal 63% 65% 64% At risk for overweight 16 11 14 Overweight 16 18 15
5+ hours/week Sports/Exercise 52% 52% 52% Extracurricular activities 26 29 24 Work at paying job 10+ hours/week 10% 10% 15% Drink caffeinated beverages 2+ cups/cans per day 34% 38% 32% Grades As 23% 23% 24%
As and Bs/Bs 49D 44 34 Bs and Cs or worse 28 31 41B
Depressive Mood Score – Boys 10-<15 15-<20 20-30 B C D
(423) (265) (106)
Set bedtime on school nights
Yes 75% 74% 71%
Adult involved in waking adolescent on school days
Yes 71% 71% 70%
Length of time taken to fall asleep on school nights
Less than 10 minutes 29%D 24% 20% 10 to 29 minutes 52CD 43 34 30 minutes or more 18 33B 46BC
Hours slept on school nights
Insufficient (Less than 8 hours) 37% 46%B 57%B
Borderline (8 to less than 9 hours) 34D 33D 19
Optimal (9 or more hours) 23 17 19
Mean (# of hours) 7.8CD 7.6 7.5
Hours slept on non-school nights
Insufficient (Less than 8 hours) 18% 17% 19%
Borderline (8 to less than 9 hours) 21 19 22
Optimal (9 or more hours) 56 59 52
Mean (# of hours) 8.8 8.9 8.7
Parent believes adolescent gets enough sleep on school nights
Every night/Almost every night 76%D 72%D 60%
Quality of adolescent’s sleep
Fair/Poor 9% 11% 14%
“I had a good night’s sleep” Every night or almost every night 52%CD 35%D 20% A few nights a month or less 14 25B 38BC
Actual vs. minimum hours of sleep needed (school nights)
Get less sleep than needed 44% 61%B 67%B
Get the same amount of sleep as needed 29CD 20D 10
Get more sleep than needed 19 14 17 Lark or owl
Lark (Morning person) 36% 33% 30% Owl (Evening person) 54 56 62
Sleep Profile – Depressive Mood Score
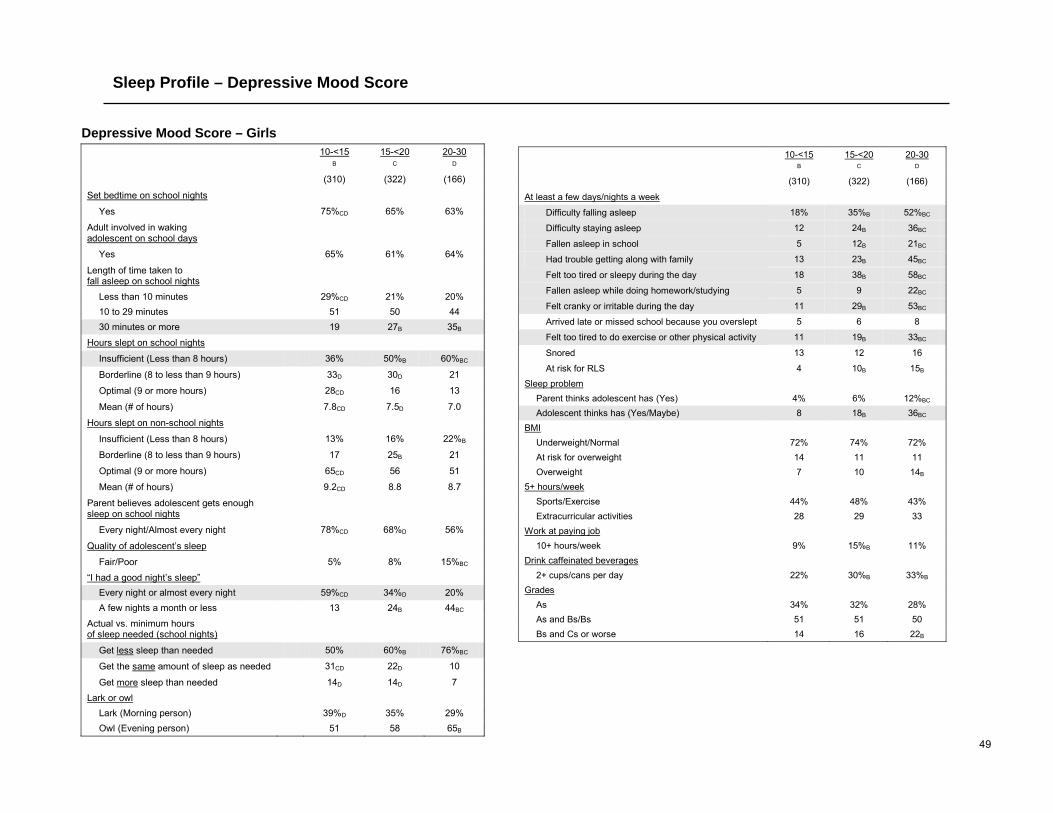
49
10-<15 15-<20 20-30 B C D
(310) (322) (166)
At least a few days/nights a week
Difficulty falling asleep 18% 35%B 52%BC
Difficulty staying asleep 12 24B 36BC
Fallen asleep in school 5 12B 21BC
Had trouble getting along with family 13 23B 45BC
Felt too tired or sleepy during the day 18 38B 58BC
Fallen asleep while doing homework/studying 5 9 22BC
Felt cranky or irritable during the day 11 29B 53BC
Arrived late or missed school because you overslept 5 6 8
Felt too tired to do exercise or other physical activity 11 19B 33BC
Snored 13 12 16
At risk for RLS 4 10B 15B
Sleep problem Parent thinks adolescent has (Yes) 4% 6% 12%BC Adolescent thinks has (Yes/Maybe) 8 18B 36BC
BMI Underweight/Normal 72% 74% 72% At risk for overweight 14 11 11 Overweight 7 10 14B
5+ hours/week Sports/Exercise 44% 48% 43% Extracurricular activities 28 29 33 Work at paying job 10+ hours/week 9% 15%B 11% Drink caffeinated beverages 2+ cups/cans per day 22% 30%B 33%B Grades As 34% 32% 28%
As and Bs/Bs 51 51 50 Bs and Cs or worse 14 16 22B
Depressive Mood Score – Girls 10-<15 15-<20 20-30 B C D
(310) (322) (166)
Set bedtime on school nights
Yes 75%CD 65% 63%
Adult involved in waking adolescent on school days
Yes 65% 61% 64%
Length of time taken to fall asleep on school nights
Less than 10 minutes 29%CD 21% 20% 10 to 29 minutes 51 50 44 30 minutes or more 19 27B 35B
Hours slept on school nights
Insufficient (Less than 8 hours) 36% 50%B 60%BC
Borderline (8 to less than 9 hours) 33D 30D 21
Optimal (9 or more hours) 28CD 16 13
Mean (# of hours) 7.8CD 7.5D 7.0
Hours slept on non-school nights
Insufficient (Less than 8 hours) 13% 16% 22%B
Borderline (8 to less than 9 hours) 17 25B 21
Optimal (9 or more hours) 65CD 56 51
Mean (# of hours) 9.2CD 8.8 8.7
Parent believes adolescent gets enough sleep on school nights
Every night/Almost every night 78%CD 68%D 56%
Quality of adolescent’s sleep
Fair/Poor 5% 8% 15%BC
“I had a good night’s sleep” Every night or almost every night 59%CD 34%D 20% A few nights a month or less 13 24B 44BC
Actual vs. minimum hours of sleep needed (school nights)
Get less sleep than needed 50% 60%B 76%BC
Get the same amount of sleep as needed 31CD 22D 10
Get more sleep than needed 14D 14D 7
Lark or owl Lark (Morning person) 39%D 35% 29% Owl (Evening person) 51 58 65B
Sleep Profile – Depressive Mood Score
50
Driving Drowsy
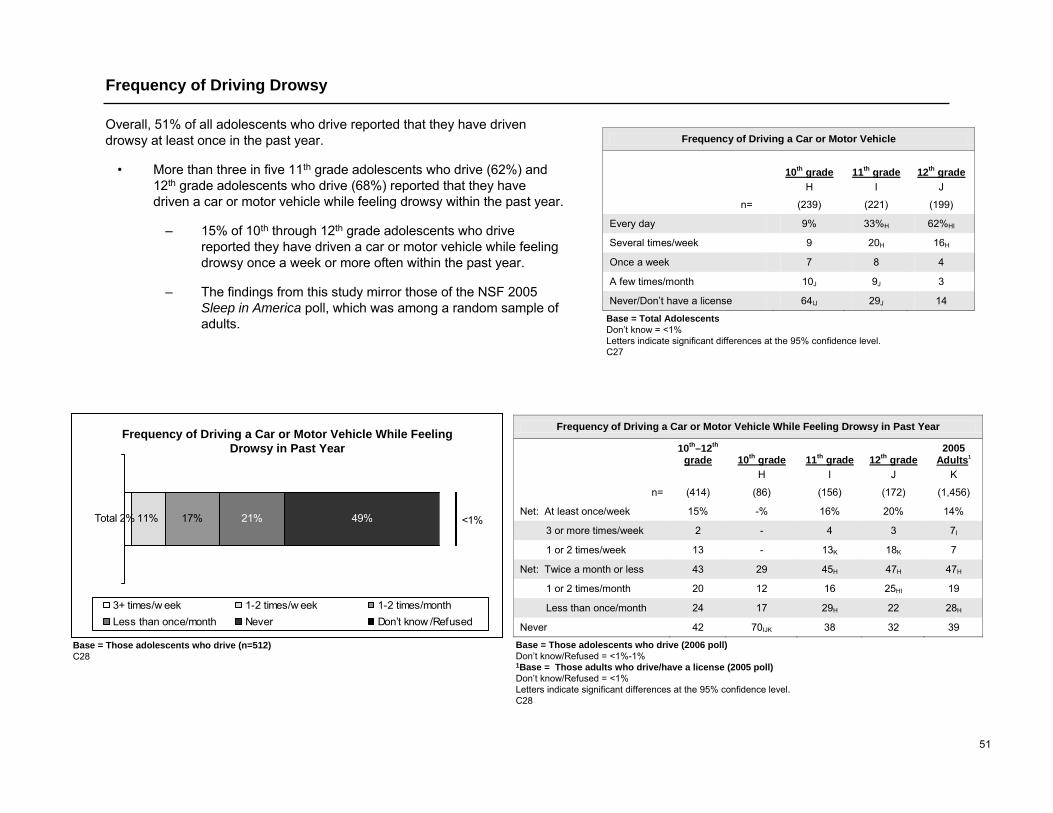
51
Frequency of Driving a Car or Motor Vehicle
10th grade 11th grade 12th grade H I J
n= (239) (221) (199)
Every day 9% 33%H 62%HI
Several times/week 9 20H 16H
Once a week 7 8 4
A few times/month 10J 9J 3
Never/Don’t have a license 64IJ 29J 14
Frequency of Driving Drowsy
Base = Total Adolescents Don’t know = <1%Letters indicate significant differences at the 95% confidence level.C27
Frequency of Driving a Car or Motor Vehicle While Feeling Drowsy in Past Year
10th–12th
grade 10th grade 11th grade 12th grade 2005
Adults1 H I J K
n= (414) (86) (156) (172) (1,456)
Net: At least once/week 15% -% 16% 20% 14%
3 or more times/week 2 - 4 3 7I
1 or 2 times/week 13 - 13K 18K 7
Net: Twice a month or less 43 29 45H 47H 47H
1 or 2 times/month 20 12 16 25HI 19
Less than once/month 24 17 29H 22 28H
Never 42 70IJK 38 32 39
Base = Those adolescents who drive (2006 poll)Don’t know/Refused = <1%-1%1Base = Those adults who drive/have a license (2005 poll)Don’t know/Refused = <1%Letters indicate significant differences at the 95% confidence level.C28
Overall, 51% of all adolescents who drive reported that they have driven drowsy at least once in the past year.
• More than three in five 11th grade adolescents who drive (62%) and 12th grade adolescents who drive (68%) reported that they have driven a car or motor vehicle while feeling drowsy within the past year.
– 15% of 10th through 12th grade adolescents who drive reported they have driven a car or motor vehicle while feeling drowsy once a week or more often within the past year.
– The findings from this study mirror those of the NSF 2005 Sleep in America poll, which was among a random sample of adults.
2% 11% 17% 21% 49% <1%Total
3+ times/w eek 1-2 times/w eek 1-2 times/monthLess than once/month Never Don’t know /Refused
Base = Those adolescents who drive (n=512)C28
Frequency of Driving a Car or Motor Vehicle While Feeling Drowsy in Past Year
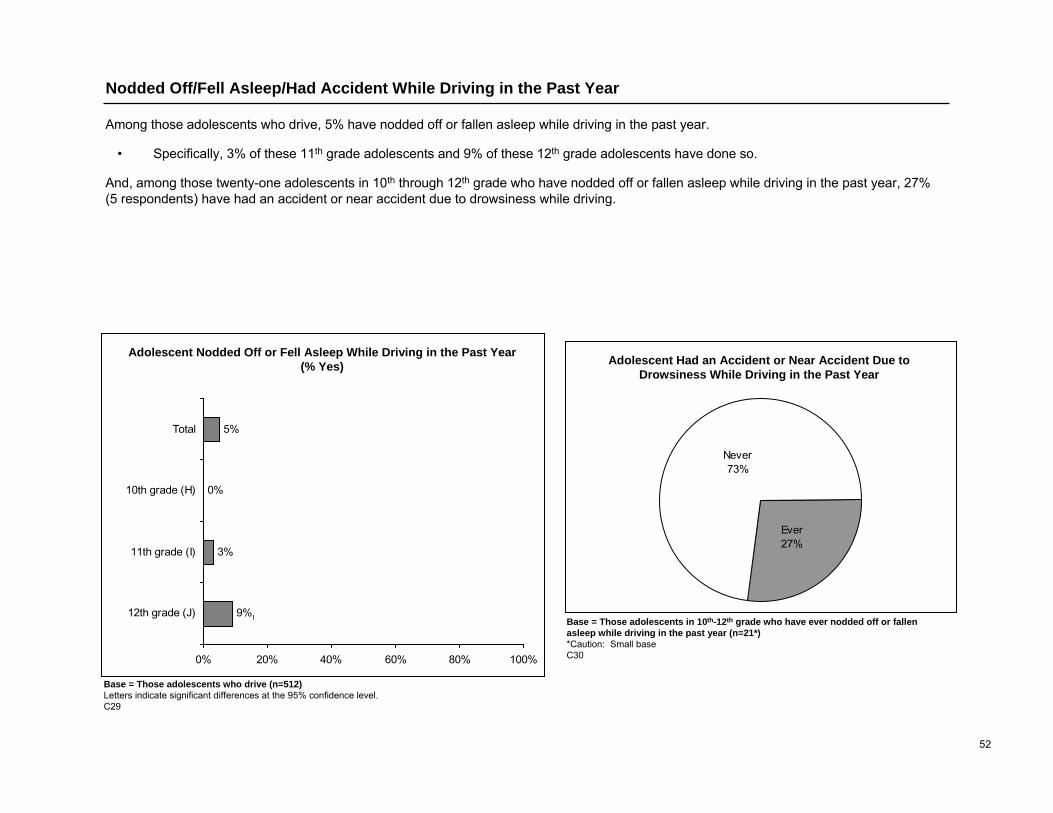
52
0%
5%
9%I
3%
0% 20% 40% 60% 80% 100%
12th grade (J)
11th grade (I)
10th grade (H)
Total
Nodded Off/Fell Asleep/Had Accident While Driving in the Past Year
Base = Those adolescents who drive (n=512)Letters indicate significant differences at the 95% confidence level.C29
Adolescent Nodded Off or Fell Asleep While Driving in the Past Year(% Yes)
Never73%
Ever27%
Base = Those adolescents in 10th-12th grade who have ever nodded off or fallen asleep while driving in the past year (n=21*)*Caution: Small baseC30
Adolescent Had an Accident or Near Accident Due to Drowsiness While Driving in the Past Year
Among those adolescents who drive, 5% have nodded off or fallen asleep while driving in the past year.
• Specifically, 3% of these 11th grade adolescents and 9% of these 12th grade adolescents have done so.
And, among those twenty-one adolescents in 10th through 12th grade who have nodded off or fallen asleep while driving in the past year, 27% (5 respondents) have had an accident or near accident due to drowsiness while driving.
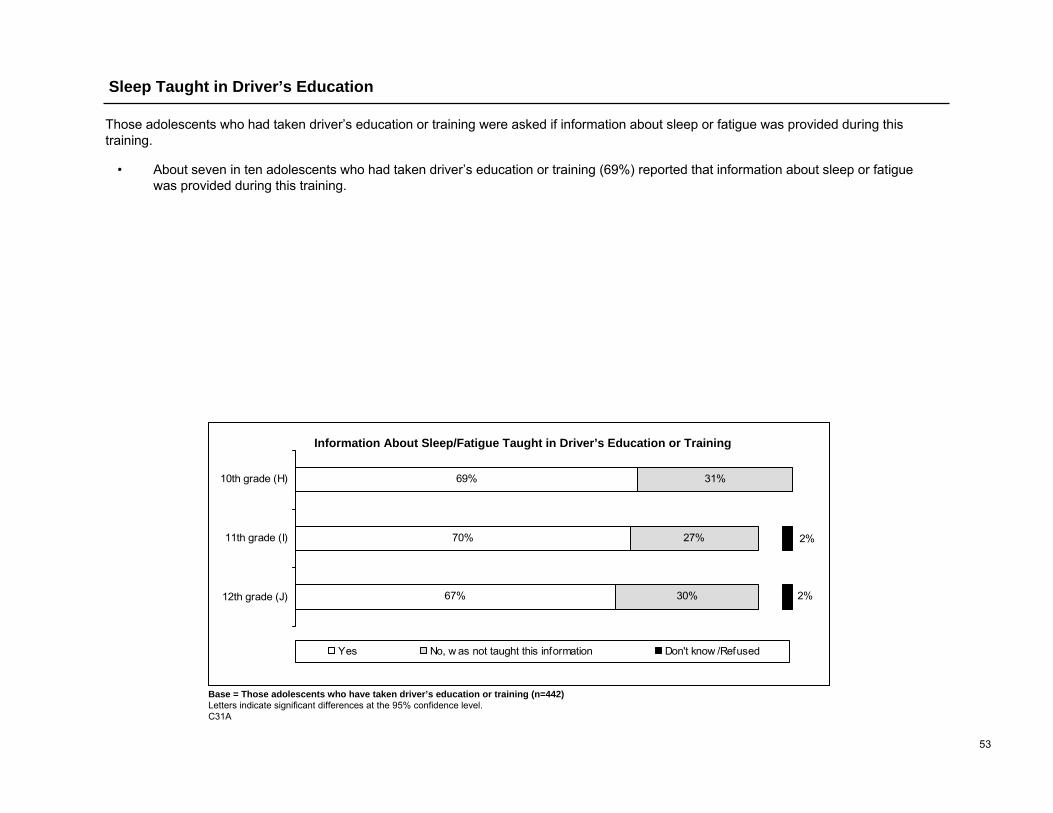
53
30%
27%
31%
67%
70%
69%
2%
2%
12th grade (J)
11th grade (I)
10th grade (H)
Yes No, w as not taught this information Don't know /Refused
Sleep Taught in Driver’s Education
Information About Sleep/Fatigue Taught in Driver’s Education or Training
Base = Those adolescents who have taken driver’s education or training (n=442)Letters indicate significant differences at the 95% confidence level.C31A
Those adolescents who had taken driver’s education or training were asked if information about sleep or fatigue was provided during this training.
• About seven in ten adolescents who had taken driver’s education or training (69%) reported that information about sleep or fatigue was provided during this training.

54
Characteristics of Respondents/Sleep Profiles

55
Body Mass Index (BMI) was calculated for each adolescent surveyed, based on reported height and weight (as defined by the CDC). These calculations were corrected for age and gender. (Additional detail on how BMI was calculated can be found in the Appendix.) The NSF 2006 Sleep in America poll indicates that the majority of the adolescents surveyed are of normal weight (68%), while 4% are underweight, 14% are at risk for being overweight, and 14% are overweight.
• Female adolescents are more likely than male adolescents to be of normal weight (73% vs. 62%), while males are more likely than females to be overweight (18% vs. 11%).
Adolescent’s BMI (continued)
Adolescent’s BMI (Body Mass Index) Total 6th grade 7th grade 8th grade 9th grade 10th grade 11th grade 12th grade
C D E G H I J n = (1,514) (212) (219) (233) (221) (230) (209) (190)
Net: Underweight/Normal 72% 68% 64% 74%D 70% 77%D 71% 81%CDGI
Underweight 4 10DGHIJ 4 6H 2 2 4 3
Normal 68 59 60 68C 68 75CD 67 78CDEGI
Net: At risk/Overweight 28 32J 36EHJ 26 30J 23 29J 19
At risk for overweight 14 14 20HJ 14 13 11 16 10
Overweight 14 18J 16 12 17J 12 13 10
Base = Those caregivers answeringLetters indicate significant differences at the 95% confidence level.P4
Adolescent’s BMI (Body Mass Index)
Base = Those caregivers answering (n=1,514)Letters indicate significant differences at the 95% confidence level.P4
72% 28%
69% 31%F
74%B 26%
68% 32%Q
77%P 23%
3%
5%
3%
4%
62%
62%
68%
13%
15%
12%
16%
14%
11%
13%
15%
14%
6%F
72%B
73%P
18%Q
0% 20% 40% 60% 80% 100%
Female (Q)
Male (P)
9th-12th grade (F)
6th-8th grade (B)
Total
Underw eight Normal At risk for overw eight Overw eight
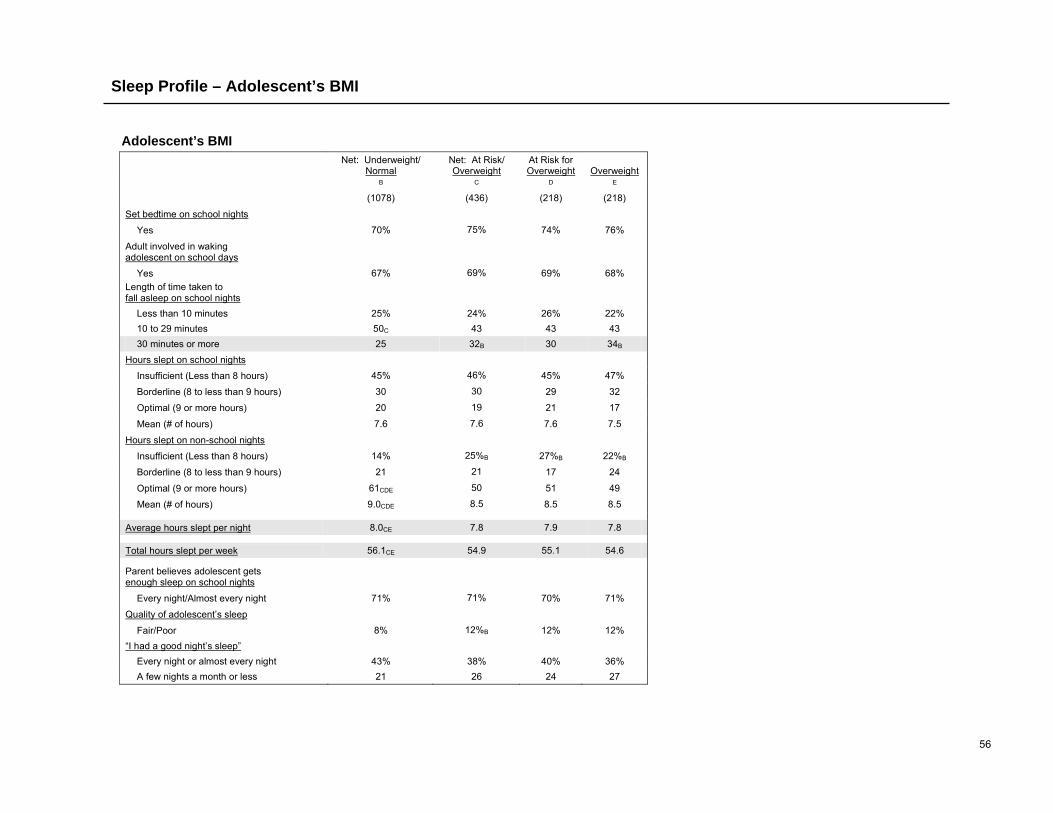
56
Adolescent’s BMI
Net: Underweight/ Normal
Net: At Risk/ Overweight
At Risk for Overweight Overweight
B C D E
(1078) (436) (218) (218)
Set bedtime on school nights
Yes 70% 75% 74% 76%
Adult involved in waking adolescent on school days
Yes 67% 69% 69% 68% Length of time taken to fall asleep on school nights
Less than 10 minutes 25% 24% 26% 22% 10 to 29 minutes 50C 43 43 43 30 minutes or more 25 32B 30 34B
Hours slept on school nights
Insufficient (Less than 8 hours) 45% 46% 45% 47%
Borderline (8 to less than 9 hours) 30 30 29 32
Optimal (9 or more hours) 20 19 21 17
Mean (# of hours) 7.6 7.6 7.6 7.5
Hours slept on non-school nights
Insufficient (Less than 8 hours) 14% 25%B 27%B 22%B
Borderline (8 to less than 9 hours) 21 21 17 24
Optimal (9 or more hours) 61CDE 50 51 49
Mean (# of hours) 9.0CDE 8.5 8.5 8.5
Average hours slept per night 8.0CE 7.8 7.9 7.8
Total hours slept per week 56.1CE 54.9 55.1 54.6
Parent believes adolescent gets enough sleep on school nights
Every night/Almost every night 71% 71% 70% 71%
Quality of adolescent’s sleep
Fair/Poor 8% 12%B 12% 12% “I had a good night’s sleep”
Every night or almost every night 43% 38% 40% 36% A few nights a month or less 21 26 24 27
Sleep Profile – Adolescent’s BMI
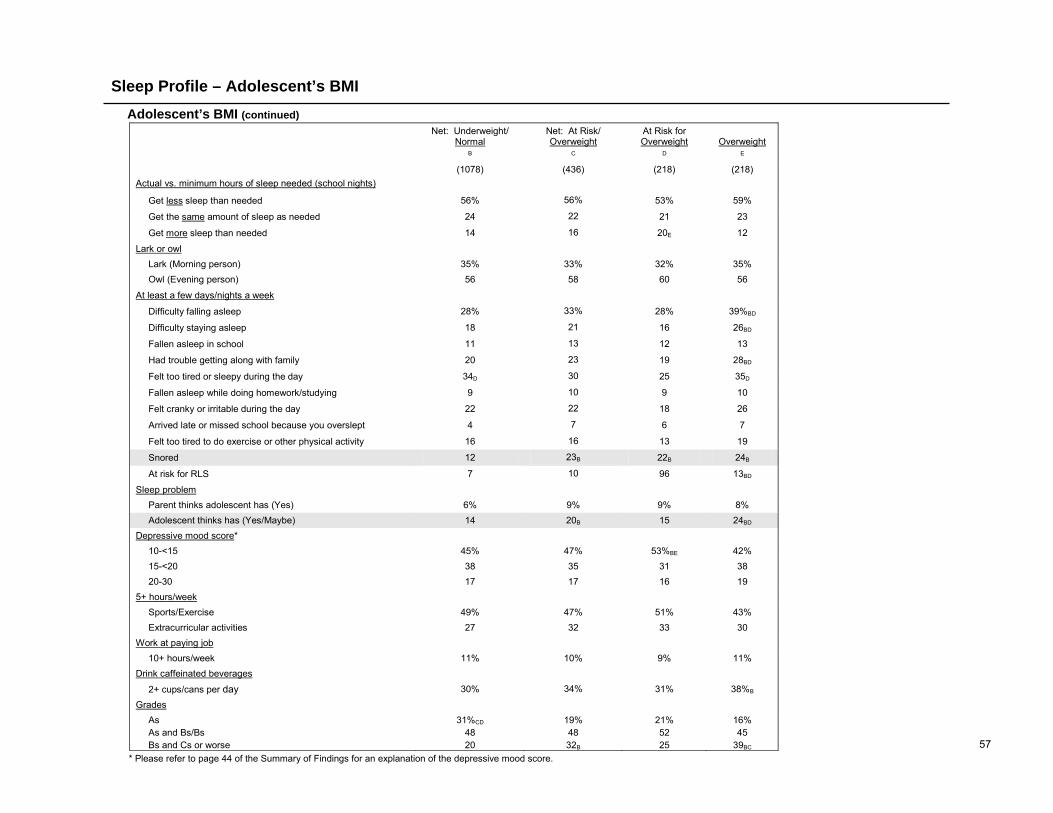
57
Net: Underweight/ Normal
Net: At Risk/ Overweight
At Risk for Overweight Overweight
B C D E
(1078) (436) (218) (218) Actual vs. minimum hours of sleep needed (school nights)
Get less sleep than needed 56% 56% 53% 59%
Get the same amount of sleep as needed 24 22 21 23
Get more sleep than needed 14 16 20E 12
Lark or owl Lark (Morning person) 35% 33% 32% 35% Owl (Evening person) 56 58 60 56
At least a few days/nights a week
Difficulty falling asleep 28% 33% 28% 39%BD
Difficulty staying asleep 18 21 16 26BD
Fallen asleep in school 11 13 12 13
Had trouble getting along with family 20 23 19 28BD
Felt too tired or sleepy during the day 34D 30 25 35D
Fallen asleep while doing homework/studying 9 10 9 10
Felt cranky or irritable during the day 22 22 18 26
Arrived late or missed school because you overslept 4 7 6 7
Felt too tired to do exercise or other physical activity 16 16 13 19
Snored 12 23B 22B 24B
At risk for RLS 7 10 96 13BD
Sleep problem Parent thinks adolescent has (Yes) 6% 9% 9% 8% Adolescent thinks has (Yes/Maybe) 14 20B 15 24BD
Depressive mood score* 10-<15 45% 47% 53%BE 42% 15-<20 38 35 31 38
20-30 17 17 16 19 5+ hours/week Sports/Exercise 49% 47% 51% 43% Extracurricular activities 27 32 33 30 Work at paying job 10+ hours/week 11% 10% 9% 11% Drink caffeinated beverages
2+ cups/cans per day 30% 34% 31% 38%B
Grades As 31%CD 19% 21% 16%As and Bs/Bs 48 48 52 45Bs and Cs or worse 20 32B 25 39BC
Adolescent’s BMI (continued)
Sleep Profile – Adolescent’s BMI
* Please refer to page 44 of the Summary of Findings for an explanation of the depressive mood score.

58
Characteristics of Caregivers
Characteristics of Caregivers
Total 6th – 8th grade 6th grade 7th grade 8th grade
9th – 12th grade 9th grade 10th grade 11th grade 12th grade
B C D E F G H I J Marital Status n = (1,602) (710) (228) (238) (244) (892) (233) (239) (221) (199) Married or Partnered 87% 87% 87% 87% 86% 87% 87% 87% 87% 86% Divorced/Separated/Widowed 9 8 8 8 9 9 6 10 10 11 Single 4 5 4 5 6 4 7HIJ 3 3 2 Education of Parent/Caregiver n = (1,600) (709) (228) (237) (244) (891) (232) (239) (221) (199) High school or less 24% 23% 18% 27%C 26%C 25% 29%C 24% 23% 23% Technical school/Some college 30 30 31 32G 28 30 24 30 33G 32 College graduate 31 32 34 29 34 30 31 31 30 29 Advanced degree 15 14 18 12 12 15 16 16 14 16 Education of Partner of Caregiver1 n = (1,376) (609) (199) (202) (208) (767) (201) (205) (189) (172) High school or less 33% 32% 28% 35% 35% 34% 39%C 32% 32% 32% Technical school/Some college 24 22 23 26E 18 25 21 26E 32CEGJ 21 College graduate 28 31F 36DGI 22 35DI 25 26 28 20 27 Advanced degree 19 17 17 19 15 20 16 21 20 22 Total Annual Household Income n = (1,474) (663) (212) (219) (232) (811) (213) (221) (199) (178) Less than $50,000 34% 35% 33% 36% 35% 34% 34% 36% 34% 31% $50,000 to less than $100,000 42 45 44 47 44 40 40 38 42 42 $100,000 or more 23 20 23 17 21 26B 27D 26D 24 27D Mean $75,700 $72,800 $76,000D $67,600 $74,800 $78,000B $77,800D $76,700D $77,300D $80,100D Median $66,300 $64,300 $71,100 $60,900 $63,300 $68,200 $68,300 $65,300 $65,600 $75,500
Base = Those caregivers answering1Base = Those caregivers who are married or partnered and answeringLetters indicate significant differences at the 95% confidence level.P23, P24, P25, P26
The following chart outlines the demographic characteristics of the caregivers interviewed for the NSF 2006 Sleep in America poll.
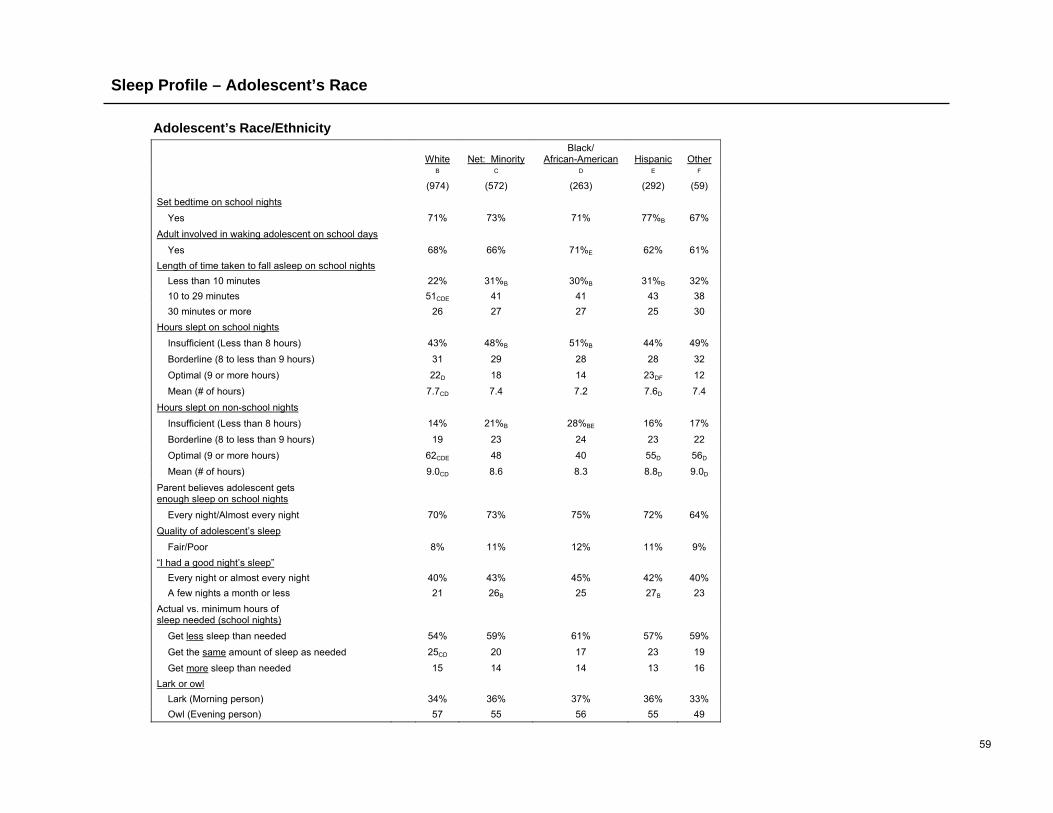
59
Adolescent’s Race/Ethnicity
White Net: Minority Black/
African-American Hispanic Other B C D E F
(974) (572) (263) (292) (59)
Set bedtime on school nights
Yes 71% 73% 71% 77%B 67%
Adult involved in waking adolescent on school days
Yes 68% 66% 71%E 62% 61% Length of time taken to fall asleep on school nights
Less than 10 minutes 22% 31%B 30%B 31%B 32% 10 to 29 minutes 51CDE 41 41 43 38 30 minutes or more 26 27 27 25 30
Hours slept on school nights
Insufficient (Less than 8 hours) 43% 48%B 51%B 44% 49%
Borderline (8 to less than 9 hours) 31 29 28 28 32
Optimal (9 or more hours) 22D 18 14 23DF 12
Mean (# of hours) 7.7CD 7.4 7.2 7.6D 7.4
Hours slept on non-school nights
Insufficient (Less than 8 hours) 14% 21%B 28%BE 16% 17%
Borderline (8 to less than 9 hours) 19 23 24 23 22
Optimal (9 or more hours) 62CDE 48 40 55D 56D
Mean (# of hours) 9.0CD 8.6 8.3 8.8D 9.0D
Parent believes adolescent gets enough sleep on school nights
Every night/Almost every night 70% 73% 75% 72% 64%
Quality of adolescent’s sleep
Fair/Poor 8% 11% 12% 11% 9% “I had a good night’s sleep”
Every night or almost every night 40% 43% 45% 42% 40% A few nights a month or less 21 26B 25 27B 23
Actual vs. minimum hours of sleep needed (school nights)
Get less sleep than needed 54% 59% 61% 57% 59%
Get the same amount of sleep as needed 25CD 20 17 23 19
Get more sleep than needed 15 14 14 13 16 Lark or owl
Lark (Morning person) 34% 36% 37% 36% 33% Owl (Evening person) 57 55 56 55 49
Sleep Profile – Adolescent’s Race
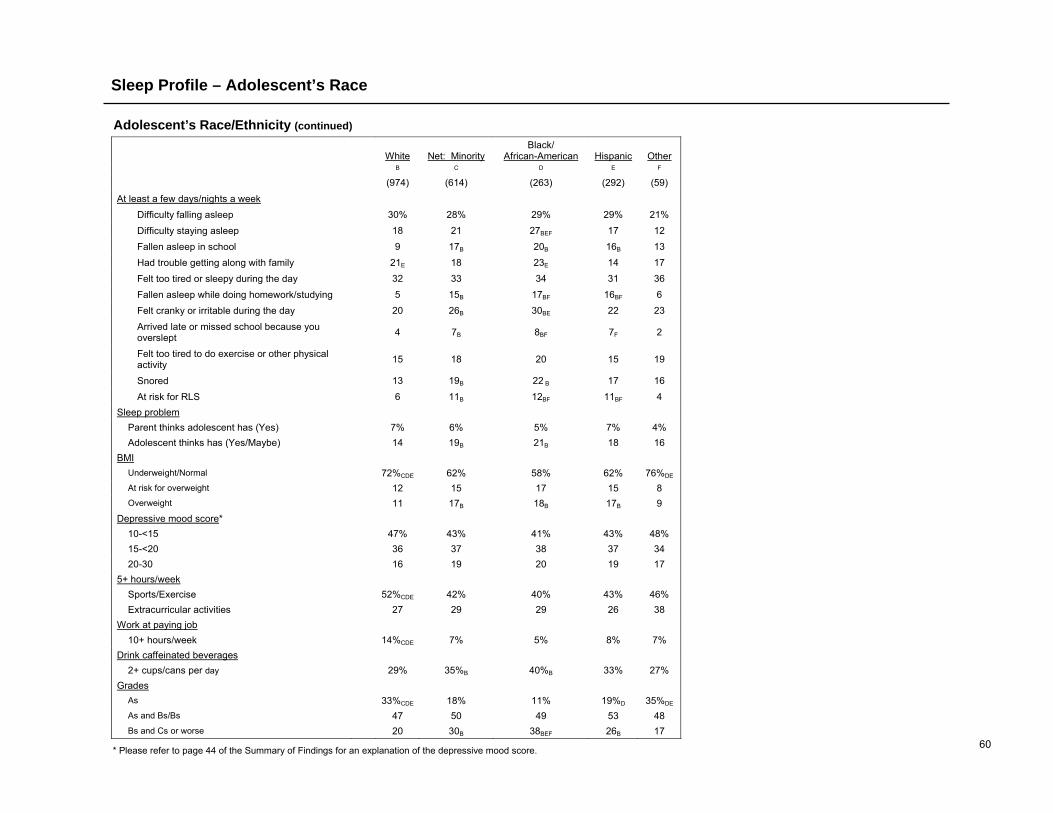
60
Adolescent’s Race/Ethnicity (continued)
White Net: Minority Black/
African-American Hispanic Other B C D E F
(974) (614) (263) (292) (59)
At least a few days/nights a week Difficulty falling asleep 30% 28% 29% 29% 21%
Difficulty staying asleep 18 21 27BEF 17 12
Fallen asleep in school 9 17B 20B 16B 13 Had trouble getting along with family 21E 18 23E 14 17
Felt too tired or sleepy during the day 32 33 34 31 36
Fallen asleep while doing homework/studying 5 15B 17BF 16BF 6 Felt cranky or irritable during the day 20 26B 30BE 22 23
Arrived late or missed school because you overslept 4 7B 8BF 7F 2
Felt too tired to do exercise or other physical activity 15 18 20 15 19
Snored 13 19B 22 B 17 16
At risk for RLS 6 11B 12BF 11BF 4 Sleep problem
Parent thinks adolescent has (Yes) 7% 6% 5% 7% 4% Adolescent thinks has (Yes/Maybe) 14 19B 21B 18 16
BMI Underweight/Normal 72%CDE 62% 58% 62% 76%DE At risk for overweight 12 15 17 15 8 Overweight 11 17B 18B 17B 9
Depressive mood score* 10-<15 47% 43% 41% 43% 48% 15-<20 36 37 38 37 34
20-30 16 19 20 19 17 5+ hours/week Sports/Exercise 52%CDE 42% 40% 43% 46% Extracurricular activities 27 29 29 26 38 Work at paying job 10+ hours/week 14%CDE 7% 5% 8% 7% Drink caffeinated beverages 2+ cups/cans per day 29% 35%B 40%B 33% 27% Grades As 33%CDE 18% 11% 19%D 35%DE
As and Bs/Bs 47 50 49 53 48 Bs and Cs or worse 20 30B 38BEF 26B 17
Sleep Profile – Adolescent’s Race
* Please refer to page 44 of the Summary of Findings for an explanation of the depressive mood score.
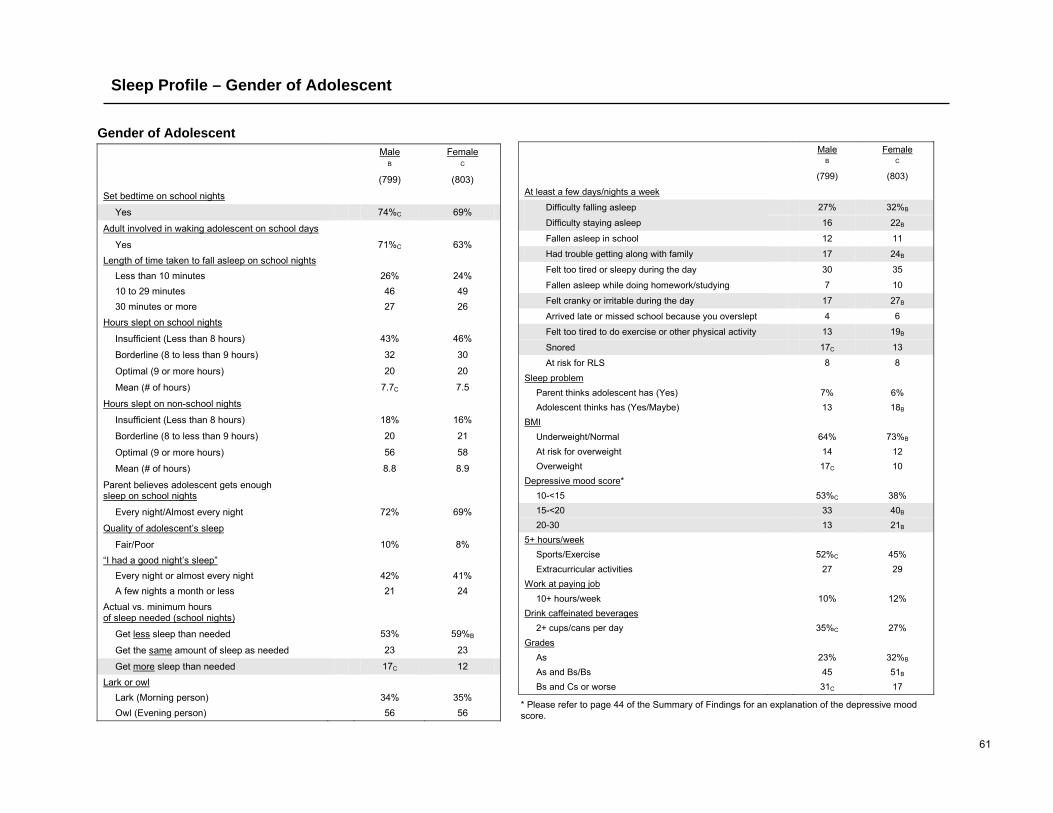
61
Male Female B C
(799) (803)
At least a few days/nights a week
Difficulty falling asleep 27% 32%B
Difficulty staying asleep 16 22B
Fallen asleep in school 12 11
Had trouble getting along with family 17 24B
Felt too tired or sleepy during the day 30 35
Fallen asleep while doing homework/studying 7 10
Felt cranky or irritable during the day 17 27B
Arrived late or missed school because you overslept 4 6
Felt too tired to do exercise or other physical activity 13 19B
Snored 17C 13
At risk for RLS 8 8
Sleep problem Parent thinks adolescent has (Yes) 7% 6% Adolescent thinks has (Yes/Maybe) 13 18B
BMI Underweight/Normal 64% 73%B At risk for overweight 14 12 Overweight 17C 10
Depressive mood score* 10-<15 53%C 38% 15-<20 33 40B
20-30 13 21B 5+ hours/week Sports/Exercise 52%C 45% Extracurricular activities 27 29 Work at paying job 10+ hours/week 10% 12% Drink caffeinated beverages 2+ cups/cans per day 35%C 27% Grades
As 23% 32%B As and Bs/Bs 45 51B Bs and Cs or worse 31C 17
Gender of Adolescent Male Female B C
(799) (803)
Set bedtime on school nights
Yes 74%C 69%
Adult involved in waking adolescent on school days
Yes 71%C 63% Length of time taken to fall asleep on school nights
Less than 10 minutes 26% 24% 10 to 29 minutes 46 49 30 minutes or more 27 26
Hours slept on school nights
Insufficient (Less than 8 hours) 43% 46%
Borderline (8 to less than 9 hours) 32 30
Optimal (9 or more hours) 20 20
Mean (# of hours) 7.7C 7.5
Hours slept on non-school nights
Insufficient (Less than 8 hours) 18% 16%
Borderline (8 to less than 9 hours) 20 21
Optimal (9 or more hours) 56 58
Mean (# of hours) 8.8 8.9
Parent believes adolescent gets enough sleep on school nights
Every night/Almost every night 72% 69%
Quality of adolescent’s sleep
Fair/Poor 10% 8% “I had a good night’s sleep”
Every night or almost every night 42% 41% A few nights a month or less 21 24
Actual vs. minimum hours of sleep needed (school nights)
Get less sleep than needed 53% 59%B
Get the same amount of sleep as needed 23 23
Get more sleep than needed 17C 12
Lark or owl Lark (Morning person) 34% 35% Owl (Evening person) 56 56
Sleep Profile – Gender of Adolescent
* Please refer to page 44 of the Summary of Findings for an explanation of the depressive mood score.
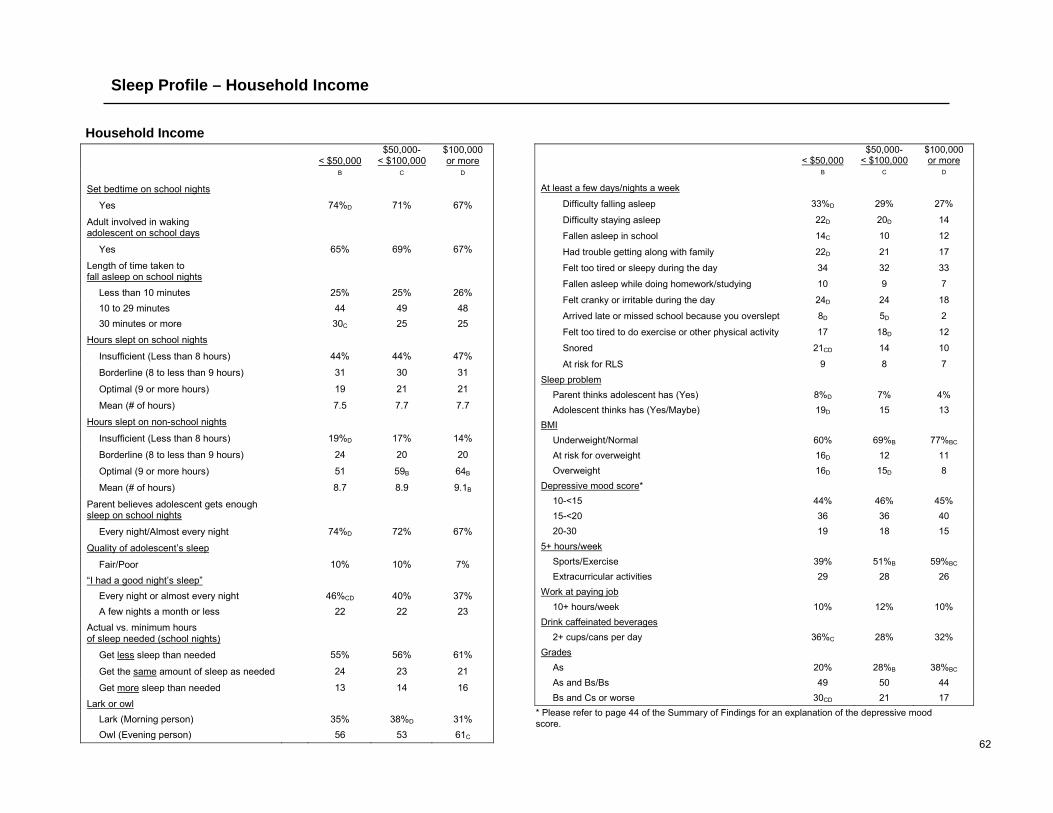
62
< $50,000 $50,000-
< $100,000 $100,000 or more
B C D
At least a few days/nights a week
Difficulty falling asleep 33%D 29% 27%
Difficulty staying asleep 22D 20D 14
Fallen asleep in school 14C 10 12
Had trouble getting along with family 22D 21 17
Felt too tired or sleepy during the day 34 32 33
Fallen asleep while doing homework/studying 10 9 7
Felt cranky or irritable during the day 24D 24 18
Arrived late or missed school because you overslept 8D 5D 2
Felt too tired to do exercise or other physical activity 17 18D 12
Snored 21CD 14 10
At risk for RLS 9 8 7 Sleep problem
Parent thinks adolescent has (Yes) 8%D 7% 4% Adolescent thinks has (Yes/Maybe) 19D 15 13
BMI Underweight/Normal 60% 69%B 77%BC At risk for overweight 16D 12 11 Overweight 16D 15D 8
Depressive mood score* 10-<15 44% 46% 45% 15-<20 36 36 40
20-30 19 18 15 5+ hours/week Sports/Exercise 39% 51%B 59%BC Extracurricular activities 29 28 26 Work at paying job 10+ hours/week 10% 12% 10% Drink caffeinated beverages 2+ cups/cans per day 36%C 28% 32% Grades As 20% 28%B 38%BC
As and Bs/Bs 49 50 44 Bs and Cs or worse 30CD 21 17
Household Income < $50,000
$50,000- < $100,000
$100,000 or more
B C D
Set bedtime on school nights
Yes 74%D 71% 67%
Adult involved in waking adolescent on school days
Yes 65% 69% 67%
Length of time taken to fall asleep on school nights
Less than 10 minutes 25% 25% 26% 10 to 29 minutes 44 49 48 30 minutes or more 30C 25 25
Hours slept on school nights
Insufficient (Less than 8 hours) 44% 44% 47%
Borderline (8 to less than 9 hours) 31 30 31
Optimal (9 or more hours) 19 21 21
Mean (# of hours) 7.5 7.7 7.7
Hours slept on non-school nights
Insufficient (Less than 8 hours) 19%D 17% 14%
Borderline (8 to less than 9 hours) 24 20 20
Optimal (9 or more hours) 51 59B 64B
Mean (# of hours) 8.7 8.9 9.1B
Parent believes adolescent gets enough sleep on school nights
Every night/Almost every night 74%D 72% 67%
Quality of adolescent’s sleep
Fair/Poor 10% 10% 7% “I had a good night’s sleep”
Every night or almost every night 46%CD 40% 37% A few nights a month or less 22 22 23
Actual vs. minimum hours of sleep needed (school nights)
Get less sleep than needed 55% 56% 61%
Get the same amount of sleep as needed 24 23 21
Get more sleep than needed 13 14 16
Lark or owl Lark (Morning person) 35% 38%D 31% Owl (Evening person) 56 53 61C
Sleep Profile – Household Income
* Please refer to page 44 of the Summary of Findings for an explanation of the depressive mood score.
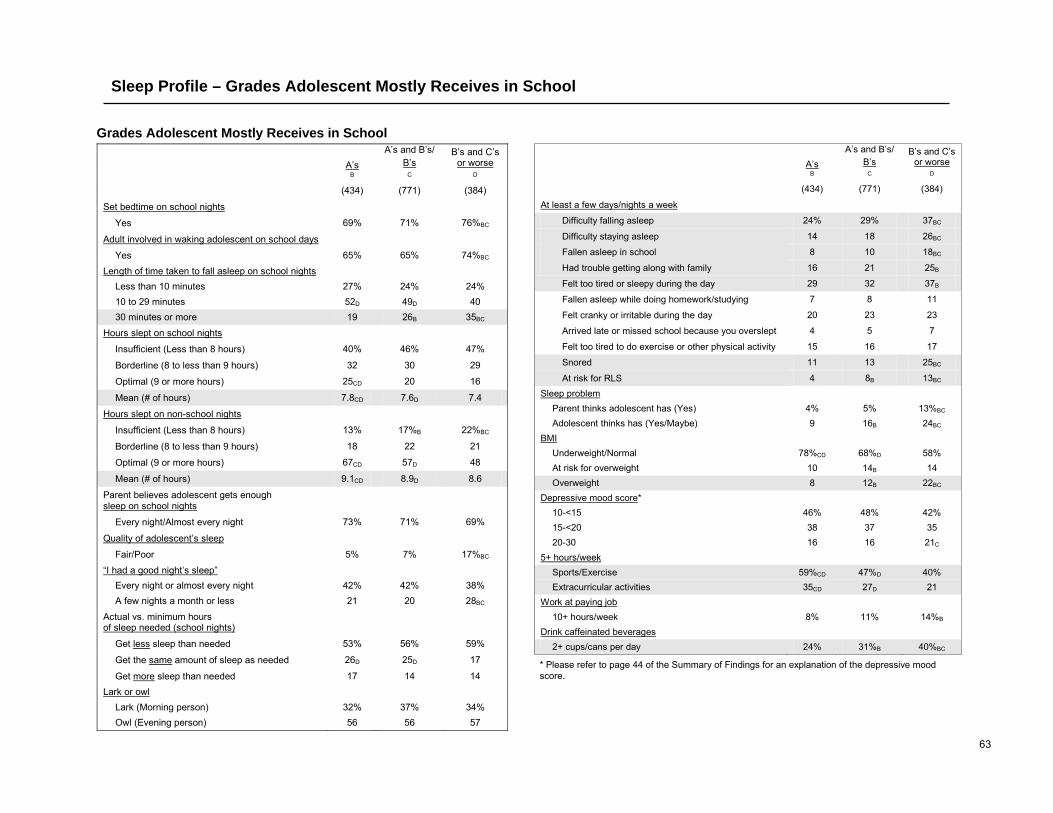
63
A’s
A’s and B’s/ B’s
B’s and C’s or worse
B C D
(434) (771) (384)
At least a few days/nights a week
Difficulty falling asleep 24% 29% 37BC
Difficulty staying asleep 14 18 26BC
Fallen asleep in school 8 10 18BC
Had trouble getting along with family 16 21 25B
Felt too tired or sleepy during the day 29 32 37B
Fallen asleep while doing homework/studying 7 8 11
Felt cranky or irritable during the day 20 23 23
Arrived late or missed school because you overslept 4 5 7
Felt too tired to do exercise or other physical activity 15 16 17
Snored 11 13 25BC
At risk for RLS 4 8B 13BC Sleep problem
Parent thinks adolescent has (Yes) 4% 5% 13%BC Adolescent thinks has (Yes/Maybe) 9 16B 24BC
BMI Underweight/Normal 78%CD 68%D 58% At risk for overweight 10 14B 14 Overweight 8 12B 22BC
Depressive mood score* 10-<15 46% 48% 42% 15-<20 38 37 35
20-30 16 16 21C 5+ hours/week Sports/Exercise 59%CD 47%D 40% Extracurricular activities 35CD 27D 21 Work at paying job 10+ hours/week 8% 11% 14%B Drink caffeinated beverages 2+ cups/cans per day 24% 31%B 40%BC
Grades Adolescent Mostly Receives in School
A’s A’s and B’s/
B’s B’s and C’s
or worse B C D
(434) (771) (384)
Set bedtime on school nights
Yes 69% 71% 76%BC
Adult involved in waking adolescent on school days
Yes 65% 65% 74%BC
Length of time taken to fall asleep on school nights Less than 10 minutes 27% 24% 24% 10 to 29 minutes 52D 49D 40 30 minutes or more 19 26B 35BC
Hours slept on school nights
Insufficient (Less than 8 hours) 40% 46% 47%
Borderline (8 to less than 9 hours) 32 30 29
Optimal (9 or more hours) 25CD 20 16
Mean (# of hours) 7.8CD 7.6D 7.4
Hours slept on non-school nights
Insufficient (Less than 8 hours) 13% 17%B 22%BC
Borderline (8 to less than 9 hours) 18 22 21
Optimal (9 or more hours) 67CD 57D 48
Mean (# of hours) 9.1CD 8.9D 8.6
Parent believes adolescent gets enough sleep on school nights
Every night/Almost every night 73% 71% 69%
Quality of adolescent’s sleep
Fair/Poor 5% 7% 17%BC
“I had a good night’s sleep” Every night or almost every night 42% 42% 38% A few nights a month or less 21 20 28BC
Actual vs. minimum hours of sleep needed (school nights)
Get less sleep than needed 53% 56% 59%
Get the same amount of sleep as needed 26D 25D 17
Get more sleep than needed 17 14 14 Lark or owl
Lark (Morning person) 32% 37% 34% Owl (Evening person) 56 56 57
Sleep Profile – Grades Adolescent Mostly Receives in School
* Please refer to page 44 of the Summary of Findings for an explanation of the depressive mood score.

64
Get less
than needed
Get same as
needed
Get more than
needed B C D
(890) (377) (239)
At least a few days/nights a week
Difficulty falling asleep 35%CD 22% 20%
Difficulty staying asleep 22CD 12 15
Fallen asleep in school 16CD 5 5
Had trouble getting along with family 24CD 13 16
Felt too tired or sleepy during the day 43CD 17 19
Fallen asleep while doing homework/studying 12CD 2 5
Felt cranky or irritable during the day 30CD 11 12
Arrived late or missed school because you overslept 6D 3 2
Felt too tired to do exercise or other physical activity 21CD 7 8
Snored 15 15 15
At risk for RLS 11CD 4 3
Sleep problem Parent thinks adolescent has (Yes) 8%CD 5% 5% Adolescent thinks has (Yes/Maybe) 22CD 7 7
BMI Underweight/Normal 68% 69% 66% At risk for overweight 12 12 18 Overweight 14 13 11
Depressive mood score* 10-<15 38% 58%B 53%B 15-<20 39 34 34
20-30 22CD 7 12C 5+ hours/week Sports/Exercise 47% 51% 54% Extracurricular activities 28 31 25 Work at paying job 10+ hours/week 14%CD 8% 6% Drink caffeinated beverages 2+ cups/cans per day 33% 29% 27% Grades As 26% 31% 31%
As and Bs/Bs 48 51 44 Bs and Cs or worse 25C 17 23
Actual vs. Minimum Hours of Sleep Needed on School Nights
Get less
than needed
Get same as
needed
Get more than
needed B C D
(890) (377) (239)
Set bedtime on school nights
Yes 67% 80%B 75%B
Adult involved in waking adolescent on school days
Yes 66% 66% 72%
Length of time taken to fall asleep on school nights
Less than 10 minutes 23% 27% 29% 10 to 29 minutes 46 54B 47 30 minutes or more 30CD 19 23
Hours slept on school nights
Insufficient (Less than 8 hours) 64%CD 21% 24%
Borderline (8 to less than 9 hours) 27 49BD 25
Optimal (9 or more hours) 9 30B 52BC
Mean (# of hours) 7.2 8.1B 8.5BC
Hours slept on non-school nights
Insufficient (Less than 8 hours) 16% 19% 19%
Borderline (8 to less than 9 hours) 23 20 19
Optimal (9 or more hours) 59 60 60
Mean (# of hours) 8.9 8.9 8.9
Parent believes adolescent gets enough sleep on school nights
Every night/Almost every night 63% 83%B 80%B
Quality of adolescent’s sleep
Fair/Poor 11%CD 7% 6%
“I had a good night’s sleep” Every night or almost every night 28% 59%B 56%B A few nights a month or less 30CD 7 15C
Lark or owl Lark (Morning person) 29% 45%B 39%B Owl (Evening person) 62CD 47 50
Sleep Profile – Actual vs. Minimum Hours of Sleep Needed on School Nights
* Please refer to page 44 of the Summary of Findings for an explanation of the depressive mood score.

65
Appendix
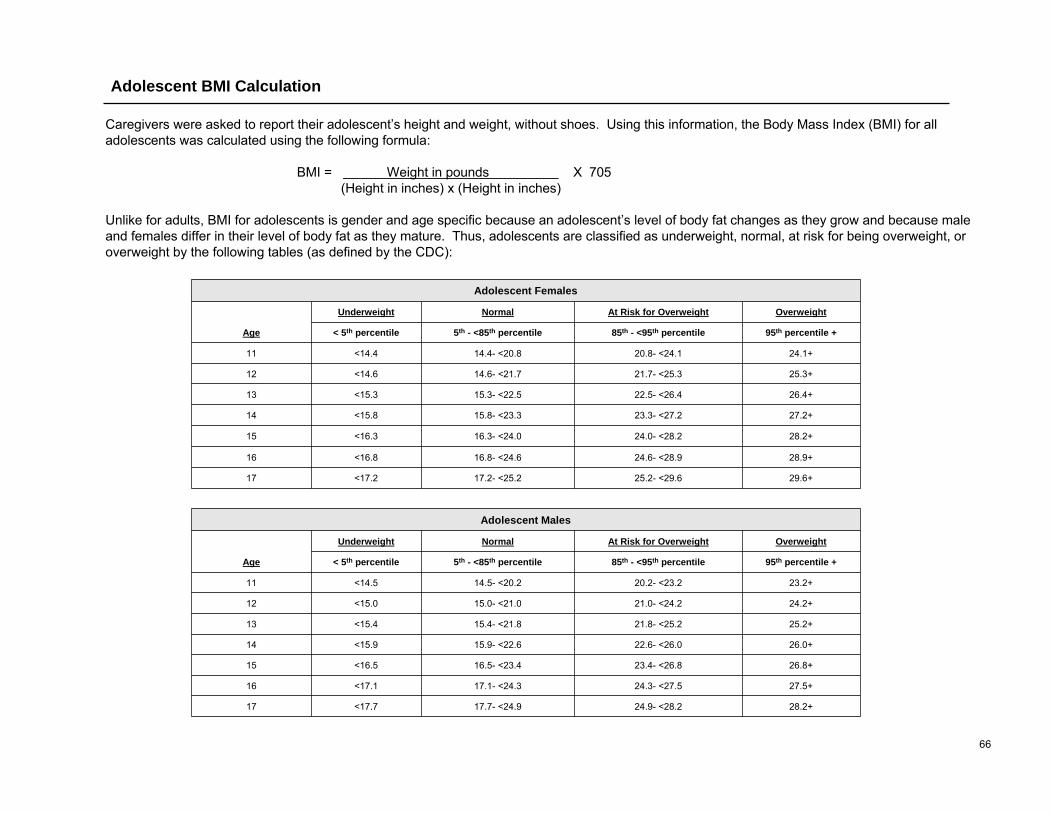
66
Adolescent BMI Calculation
Caregivers were asked to report their adolescent’s height and weight, without shoes. Using this information, the Body Mass Index (BMI) for all adolescents was calculated using the following formula:
BMI = Weight in pounds X 705(Height in inches) x (Height in inches)
Unlike for adults, BMI for adolescents is gender and age specific because an adolescent’s level of body fat changes as they grow and because male and females differ in their level of body fat as they mature. Thus, adolescents are classified as underweight, normal, at risk for being overweight, or overweight by the following tables (as defined by the CDC):
28.2+24.9- <28.217.7- <24.9<17.717
27.5+24.3- <27.517.1- <24.3<17.116
26.8+23.4- <26.816.5- <23.4<16.515
26.0+22.6- <26.015.9- <22.6<15.914
25.2+21.8- <25.215.4- <21.8<15.413
24.2+21.0- <24.215.0- <21.0<15.012
23.2+20.2- <23.214.5- <20.2<14.511
95th percentile +85th - <95th percentile5th - <85th percentile< 5th percentile
OverweightAt Risk for OverweightNormalUnderweight
Age
Adolescent Males
29.6+25.2- <29.617.2- <25.2<17.217
28.9+24.6- <28.916.8- <24.6<16.816
28.2+24.0- <28.216.3- <24.0<16.315
27.2+23.3- <27.215.8- <23.3<15.814
26.4+22.5- <26.415.3- <22.5<15.313
25.3+21.7- <25.314.6- <21.7<14.612
24.1+20.8- <24.114.4- <20.8<14.411
95th percentile +85th - <95th percentile5th - <85th percentile< 5th percentile
OverweightAt Risk for OverweightNormalUnderweight
Age
Adolescent Females

67
Questionnaire
WB&A Time Started: Job #05-638 Time Ended: August 2005 Call Length:
Sample Page: ID#: _____________________
NATIONAL SLEEP FOUNDATION 2006 SLEEP IN AMERICA POLL SCREENING QUESTIONNAIRE
Respondent Name:
Telephone Number:
Interviewer: Date: Day of week:
Hello, I am with WB&A, a national research firm. I am calling on behalf of the National Sleep Foundation to conduct a survey about children’s sleep habits. This is not a sales call; it is a research survey, and your responses will be kept strictly confidential. S1. First, are there any children living in your home in grades 6-12?
01 Yes CONTINUE 02 No THANK AND TERMINATE 98 Refused THANK AND TERMINATE
S2. For these children, are you…(READ LIST.)
01 The primary caregiver, CONTINUE 02 Someone who shares equally in the childcare, or CONTINUE 03 Is someone else the primary caregiver? ASK TO SPEAK TO THE PRIMARY CAREGIVER AND RESCREEN
98 DO NOT READ: Refused THANK AND TERMINATE S2a. For how many of these children in grades 6-12 are you the caregiver?
(RECORD NUMBER OF CHILDREN BELOW. DO NOT ACCEPT RANGES. RECORD 99 FOR “DON’T KNOW” AND 98 FOR “REFUSED.” IF NONE, THANK AND TERMINATE)
# of Children: _____________
IF RESPONDENT IS NOT A CAREGIVER FOR CHILDREN IN GRADES 6-12, THANK AND TERMINATE. SAY: Today, we are only interviewing people with children in grades 6 through 12. Those are all the questions I have. S3. Thinking about these children in grades 6-12, starting with your youngest child, what is this child’s age? S4. Is this child male or female? QUOTA (n=____) EACH
S5. Would you consider this child to be White, Black, Hispanic, Asian, or of some other racial or ethnic background?
S6. What grade is he or she in? (DO NOT READ LIST.) ASK S4 – S6 FOR EACH CHILD IN GRADES 6-12 BEFORE GOING TO THE NEXT CHILD. ALLOW UP TOSIX CHILDREN. ONLY RECORD FOR THOSE CHILDREN IN GRADES 6-12. S3_1. ASK: What is the age of the next youngest child?
Child 1 (Youngest) Child 2 Child 3 Child 4 Child 5 Child 6
S3. Age ___ Years 98 Refused
___ Years 98 Refused
___ Years 98 Refused
___ Years 98 Refused
___ Years 98 Refused
___ Years 98 Refused
S4. Gender
01 Male 02 Female 98 Refused
01 Male 02 Female 98 Refused
01 Male 02 Female 98 Refused
01 Male 02 Female 98 Refused
01 Male 02 Female 98 Refused
01 Male 02 Female 98 Refused
S5. Racial Background
01 White 02 Black/AA 03 Hispanic 04 Asian 05 Native
American 95 Other (specify:)___ 98 Refused
01 White 02 Black/AA 03 Hispanic 04 Asian 05 Native
American 95 Other (specify:)___ 98 Refused
01 White 02 Black/AA 03 Hispanic 04 Asian 05 Native
American 95 Other (specify:)___ 98 Refused
01 White 02 Black/AA 03 Hispanic 04 Asian 05 Native
American 95 Other (specify:)___ 98 Refused
01 White 02 Black/AA 03 Hispanic 04 Asian 05 Native
American 95 Other (specify:)___ 98 Refused
01 White 02 Black/AA 03 Hispanic 04 Asian 05 Native
American 95 Other (specify:)___ 98 Refused
S6. Grade
06 6th grade 07 7th grade 08 8th grade 09 9th grade 10 10th grade 11 11th grade 12 12th grade 98 Refused 99 Don’t know
06 6th grade 07 7th grade 08 8th grade 09 9th grade 10 10th grade 11 11th grade 12 12th grade 98 Refused 99 Don’t know
06 6th grade 07 7th grade 08 8th grade 09 9th grade 10 10th grade 11 11th grade 12 12th grade 98 Refused 99 Don’t know
06 6th grade 07 7th grade 08 8th grade 09 9th grade 10 10th grade 11 11th grade 12 12th grade 98 Refused 99 Don’t know
06 6th grade 07 7th grade 08 8th grade 09 9th grade 10 10th grade 11 11th grade 12 12th grade 98 Refused 99 Don’t know
06 6th grade 07 7th grade 08 8th grade 09 9th grade 10 10th grade 11 11th grade 12 12th grade 98 Refused 99 Don’t know
DO NOT INTERVIEW ANY CHILD WHO IS 10 YEARS OLD OR YOUNGER, OR WHO IS 18 YEARS OR
OLDER. WE ARE ONLY IN TERVIWEWING CHILDREN AGE 11-17.
IF ONLY ONE CHILD IN HOUSEHOLD AND AGE=10/18, THANK AND TERMINATE.
IF MULTIPLE CHILDREN IN HOUSEOLD AND ONE AGE=10/18 AND OTHERS AGES=11-17, RANDOMOLY SELECT ONE TO INTERVIEW WHO IS AGE 11-17.
IF REFUSED AGE, GRADE, GENDER OF CHILD, THANK AND TERMINATE.
IF REFUSED RACE, CONTINUE, BUT TALLY.
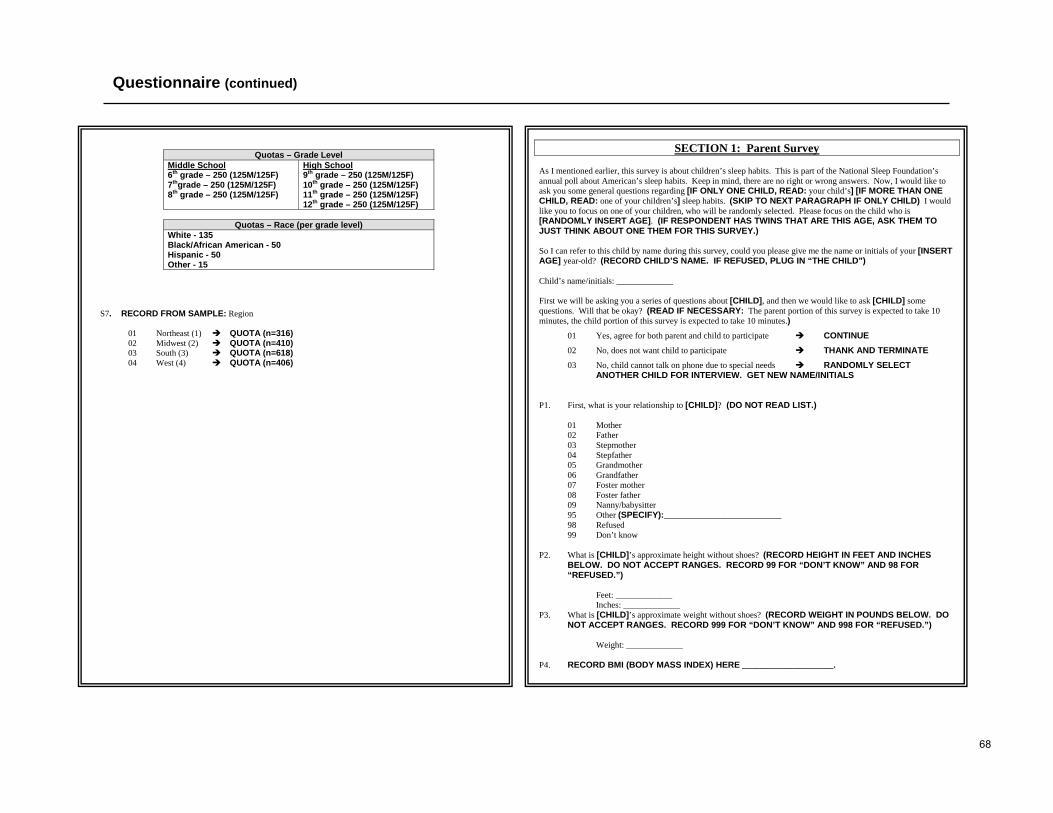
68
Questionnaire (continued)
Quotas – Grade Level
Middle School 6th grade – 250 (125M/125F) 7thgrade – 250 (125M/125F) 8th grade – 250 (125M/125F)
High School 9th grade – 250 (125M/125F) 10th grade – 250 (125M/125F) 11th grade – 250 (125M/125F) 12th grade – 250 (125M/125F)
Quotas – Race (per grade level)
White - 135 Black/African American - 50 Hispanic - 50 Other - 15
S7. RECORD FROM SAMPLE: Region
01 Northeast (1) QUOTA (n=316) 02 Midwest (2) QUOTA (n=410) 03 South (3) QUOTA (n=618) 04 West (4) QUOTA (n=406)
SECTION 1: Parent Survey As I mentioned earlier, this survey is about children’s sleep habits. This is part of the National Sleep Foundation’s annual poll about American’s sleep habits. Keep in mind, there are no right or wrong answers. Now, I would like to ask you some general questions regarding [IF ONLY ONE CHILD, READ: your child’s] [IF MORE THAN ONE CHILD, READ: one of your children’s] sleep habits. (SKIP TO NEXT PARAGRAPH IF ONLY CHILD) I would like you to focus on one of your children, who will be randomly selected. Please focus on the child who is [RANDOMLY INSERT AGE]. (IF RESPONDENT HAS TWINS THAT ARE THIS AGE, ASK THEM TO JUST THINK ABOUT ONE THEM FOR THIS SURVEY.) So I can refer to this child by name during this survey, could you please give me the name or initials of your [INSERT AGE] year-old? (RECORD CHILD’S NAME. IF REFUSED, PLUG IN “THE CHILD”) Child’s name/initials: _____________ First we will be asking you a series of questions about [CHILD], and then we would like to ask [CHILD] some questions. Will that be okay? (READ IF NECESSARY: The parent portion of this survey is expected to take 10 minutes, the child portion of this survey is expected to take 10 minutes.)
01 Yes, agree for both parent and child to participate CONTINUE
02 No, does not want child to participate THANK AND TERMINATE
03 No, child cannot talk on phone due to special needs RANDOMLY SELECT ANOTHER CHILD FOR INTERVIEW. GET NEW NAME/INITIALS
P1. First, what is your relationship to [CHILD]? (DO NOT READ LIST.)
01 Mother 02 Father 03 Stepmother 04 Stepfather 05 Grandmother 06 Grandfather 07 Foster mother 08 Foster father 09 Nanny/babysitter 95 Other (SPECIFY):___________________________ 98 Refused 99 Don’t know
P2. What is [CHILD]’s approximate height without shoes? (RECORD HEIGHT IN FEET AND INCHES BELOW. DO NOT ACCEPT RANGES. RECORD 99 FOR “DON’T KNOW” AND 98 FOR “REFUSED.”)
Feet: _____________ Inches: _____________ P3. What is [CHILD]’s approximate weight without shoes? (RECORD WEIGHT IN POUNDS BELOW. DO
NOT ACCEPT RANGES. RECORD 999 FOR “DON’T KNOW” AND 998 FOR “REFUSED.”)
Weight: _____________ P4. RECORD BMI (BODY MASS INDEX) HERE _____________________.

69
Questionnaire (continued)
P5. Does [CHILD] have his or her own bed?
01 Yes 02 No 98 DO NOT READ: Refused 99 DO NOT READ: Don’t know
P6. How many people does [CHILD] share a bedroom with? (DO NOT READ LIST.)
01 1 person 02 2 people 03 3 people 04 4 people 05 More than 4 people 96 None 98 Refused 99 Don’t know
P7. Does [CHILD] have any of the following in his or her bedroom? (READ LIST. RANDOMIZE.)
Yes No Don’t Know Refused
a. Television 01 02 99 98 b. Computer 01 02 99 98 c. Telephone 01 02 99 98 d. Cell phone 01 02 99 98 e. Internet access 01 02 99 98 f. Electronic or video games 01 02 99 98 g. Electronic music devices such as a radio or Mp3 player 01 02 99 98
P8. Do you set [CHILD]’s bedtime on school nights? 01 Yes CONTINUE 02 No 98 Refused SKIP TO P9 99 Don’t know IF “01” IN P8, ASK P8A. OTHERWISE SKIP TO P9 P8A. What is [CHILD]’s set bedtime on school nights? (RECORD TIME BELOW. DO NOT ACCEPT
RANGES. RECORD 99:99 FOR “DON’T KNOW” AND 99:98 FOR “REFUSED”.)
__ __:__ __ HOUR:MINUTE
ASK EVERYONE: P9. Are you or another adult in the household involved in waking [CHILD] in the morning on school days?
01 Yes 02 No
98 DO NOT READ: Refused 99 DO NOT READ: Don’t know
P10. How often would you say [CHILD] gets enough sleep on school nights? (READ LIST.) 05 Every night or almost every night, 04 A few nights a week, 03 A few nights a month, 02 Rarely, or 01 Never 98 DO NOT READ: Refused 99 DO NOT READ: Don’t know P11. In general, do you consider [CHILD] to be an excellent, very good, good, fair or poor sleeper?
05 Excellent, 04 Very good, 03 Good, 02 Fair, or 01 Poor
98 DO NOT READ: Refused 99 DO NOT READ: Don’t know
P12. Do you think that [CHILD] has a sleep problem? 01 Yes 02 No 98 DO NOT READ: Refused 99 DO NOT READ: Don’t know/Not sure
P13. During the past two weeks, how often did [CHILD] snore? Would you say…?
05 Every night or almost every night, 04 A few nights a week, 03 About once a week, 02 Rarely, or 01 Never 98 DO NOT READ: Refused 99 DO NOT READ: Don’t know
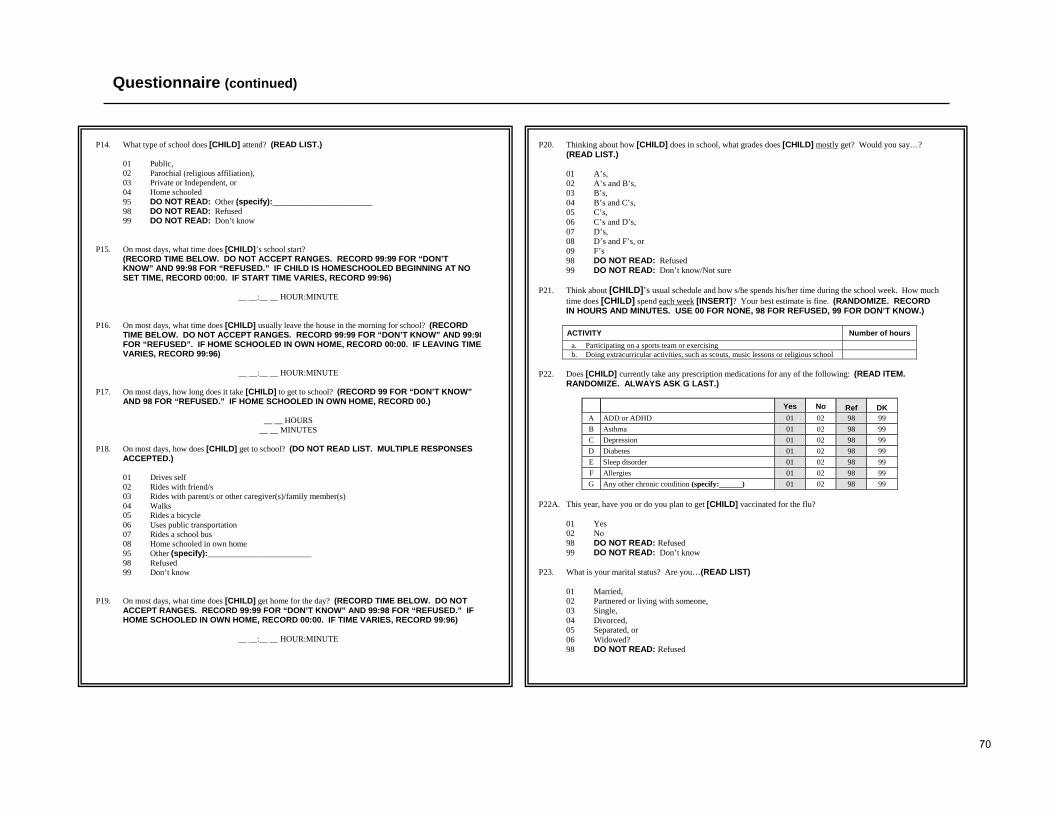
70
Questionnaire (continued)
P14. What type of school does [CHILD] attend? (READ LIST.) 01 Public, 02 Parochial (religious affiliation), 03 Private or Independent, or
04 Home schooled 95 DO NOT READ: Other (specify):________________________ 98 DO NOT READ: Refused 99 DO NOT READ: Don’t know
P15. On most days, what time does [CHILD]’s school start?
(RECORD TIME BELOW. DO NOT ACCEPT RANGES. RECORD 99:99 FOR “DON’T KNOW” AND 99:98 FOR “REFUSED.” IF CHILD IS HOMESCHOOLED BEGINNING AT NO SET TIME, RECORD 00:00. IF START TIME VARIES, RECORD 99:96)
__ __:__ __ HOUR:MINUTE
P16. On most days, what time does [CHILD] usually leave the house in the morning for school? (RECORD TIME BELOW. DO NOT ACCEPT RANGES. RECORD 99:99 FOR “DON’T KNOW” AND 99:98FOR “REFUSED”. IF HOME SCHOOLED IN OWN HOME, RECORD 00:00. IF LEAVING TIMEVARIES, RECORD 99:96)
__ __:__ __ HOUR:MINUTE
P17. On most days, how long does it take [CHILD] to get to school? (RECORD 99 FOR “DON’T KNOW”
AND 98 FOR “REFUSED.” IF HOME SCHOOLED IN OWN HOME, RECORD 00.)
__ __ HOURS __ __ MINUTES
P18. On most days, how does [CHILD] get to school? (DO NOT READ LIST. MULTIPLE RESPONSES
ACCEPTED.)
01 Drives self 02 Rides with friend/s 03 Rides with parent/s or other caregiver(s)/family member(s) 04 Walks 05 Rides a bicycle 06 Uses public transportation 07 Rides a school bus 08 Home schooled in own home 95 Other (specify):_________________________
98 Refused 99 Don’t know P19. On most days, what time does [CHILD] get home for the day? (RECORD TIME BELOW. DO NOT
ACCEPT RANGES. RECORD 99:99 FOR “DON’T KNOW” AND 99:98 FOR “REFUSED.” IF HOME SCHOOLED IN OWN HOME, RECORD 00:00. IF TIME VARIES, RECORD 99:96)
__ __:__ __ HOUR:MINUTE
P20. Thinking about how [CHILD] does in school, what grades does [CHILD] mostly get? Would you say…? (READ LIST.)
01 A’s, 02 A’s and B’s, 03 B’s, 04 B’s and C’s, 05 C’s, 06 C’s and D’s, 07 D’s, 08 D’s and F’s, or 09 F’s 98 DO NOT READ: Refused
99 DO NOT READ: Don’t know/Not sure P21. Think about [CHILD]’s usual schedule and how s/he spends his/her time during the school week. How much
time does [CHILD] spend each week [INSERT]? Your best estimate is fine. (RANDOMIZE. RECORD IN HOURS AND MINUTES. USE 00 FOR NONE, 98 FOR REFUSED, 99 FOR DON’T KNOW.)
ACTIVITY Number of hours
a. Participating on a sports team or exercising b. Doing extracurricular activities, such as scouts, music lessons or religious school
P22. Does [CHILD] currently take any prescription medications for any of the following: (READ ITEM.
RANDOMIZE. ALWAYS ASK G LAST.)
Yes No Ref DK A ADD or ADHD 01 02 98 99 B Asthma 01 02 98 99 C Depression 01 02 98 99 D Diabetes 01 02 98 99 E Sleep disorder 01 02 98 99 F Allergies 01 02 98 99 G Any other chronic condition (specify:______) 01 02 98 99
P22A. This year, have you or do you plan to get [CHILD] vaccinated for the flu?
01 Yes 02 No 98 DO NOT READ: Refused 99 DO NOT READ: Don’t know
P23. What is your marital status? Are you…(READ LIST) 01 Married, 02 Partnered or living with someone, 03 Single, 04 Divorced, 05 Separated, or 06 Widowed? 98 DO NOT READ: Refused

71
Questionnaire (continued)
READ TO EVERYONE: Those are all the questions I have for you today. Now we would like to ask [CHILD] some questions. Can you please put [CHILD] on the phone. IF NECESSARY: We will simply be asking your child about their sleep habits, including what time they wake in the morning, if they think they get enough sleep, how often they feel tired, etc. NOTE: IF PARENT IS CONCERNED ABOUT INTERVIEW, THEY MAY LISTEN IN WHILE CHILD IS INTERVIEWED, BUT THEY MAY NOT COACH CHILD WITH RESPONSES. IF RESPONDENT ASKS FOR MORE INFORMATION ON THE NATIONAL SLEEP FOUNDATION, SAY: For more information on the National Sleep Foundation, you can visit their Web site at www.sleepfoundation.org.
01 Child available now CONTINUE WITH CHILD PART OF SURVEY 02 Child NOT available now SCHEDULE CALLBACK TO CONDUCT CHILD
PART OF SURVEY 98 Refused to let child do survey THANK AND TERMINATE
SECTION 2: Child Survey READ: Hi, I’m ________, calling with a national research firm on behalf of the National Sleep Foundation. I’ve just asked your [INSERT RESPONSE FROM P1] some questions and now I’d like to ask you some questions about your sleep habits. First, I’d like to ask you several questions about school nights. C1. On a typical school night in the past two weeks, what was the usual time that you tried to go to sleep for the
night? (DO NOT READ LIST.)
01 12:00 AM (Midnight) 02 12:01 AM – 12:14 AM 03 12:15 AM – 12:29 AM 04 12:30 AM – 12:44 AM 05 12:45 AM – 12:59 AM 06 1:00 AM – 1:14 AM 07 1:15 AM – 1:29 AM 08 1:30 AM – 1:44 AM 09 1:45 AM – 1:59 AM 10 2:00 AM – 2:14 AM 11 2:15 AM – 2:29 AM 12 2:30 AM – 2:44 AM 13 2:45 AM – 2:59 AM 14 3:00 AM – 3:59 AM 15 4:00 AM – 4:59 AM 16 5:00 AM – 8:59 AM 17 9:00 AM – 11:59 AM 18 12:00 PM (Noon) – 6:59 PM 19 7:00 PM – 7:59 PM
20 8:00 PM – 8:14 PM 21 8:15 PM – 8:29 PM 22 8:30 PM – 8:44 PM 23 8:45 PM – 8:59 PM 24 9:00 PM – 9:14 PM 25 9:15 PM – 9:29 PM 26 9:30 PM – 9:44 PM 27 9:45 PM – 9:59 PM 28 10:00 PM – 10:14 PM 29 10:15 PM – 10:29 PM 30 10:30 PM – 10:44 PM 31 10:45 PM – 10:59 PM 32 11:00 PM – 11:14 PM 33 11:15 PM – 11:29 PM 34 11:30 PM – 11:44 PM 35 11:45 PM – 11:59 PM 98 Refused 99 Don’t know
P24. What was the last grade or highest level of school that you have completed? (DO NOT READ LIST.)
01 8th grade or less 02 Some high school 03 Graduated high school/GED 04 Vocational/Technical school 05 Some college 06 Graduated college 07 Advanced degree (M.A., Ph.D., etc.) 98 Refused IF “01-02” IN P23, ASK: P25. What was the last grade or highest level of school that your partner has completed? (DO NOT READ
LIST.) 01 8th grade or less 02 Some high school 03 Graduated high school/GED 04 Vocational/Technical school 05 Some college 06 Graduated college 07 Advanced degree (M.A., Ph.D., etc.) 98 Refused ASK EVERYONE: P26. Please stop me when I reach the category that includes your total annual household income. (READ LIST.
IF SINGLE, ASK FOR PERSONAL INCOME.) 01 Under $15,000, 02 $15,000 to less than $25,000, 03 $25,000 to less than $35,000, 04 $35,000 to less than $50,000, 05 $50,000 to less than $75,000, 06 $75,000 to less than $100,000, 07 $100,000 to less than $150,000, 08 $150,000 to less than $200,000, or 09 $200,000 or more 98 DO NOT READ: Refused 99 DO NOT READ: Don’t know
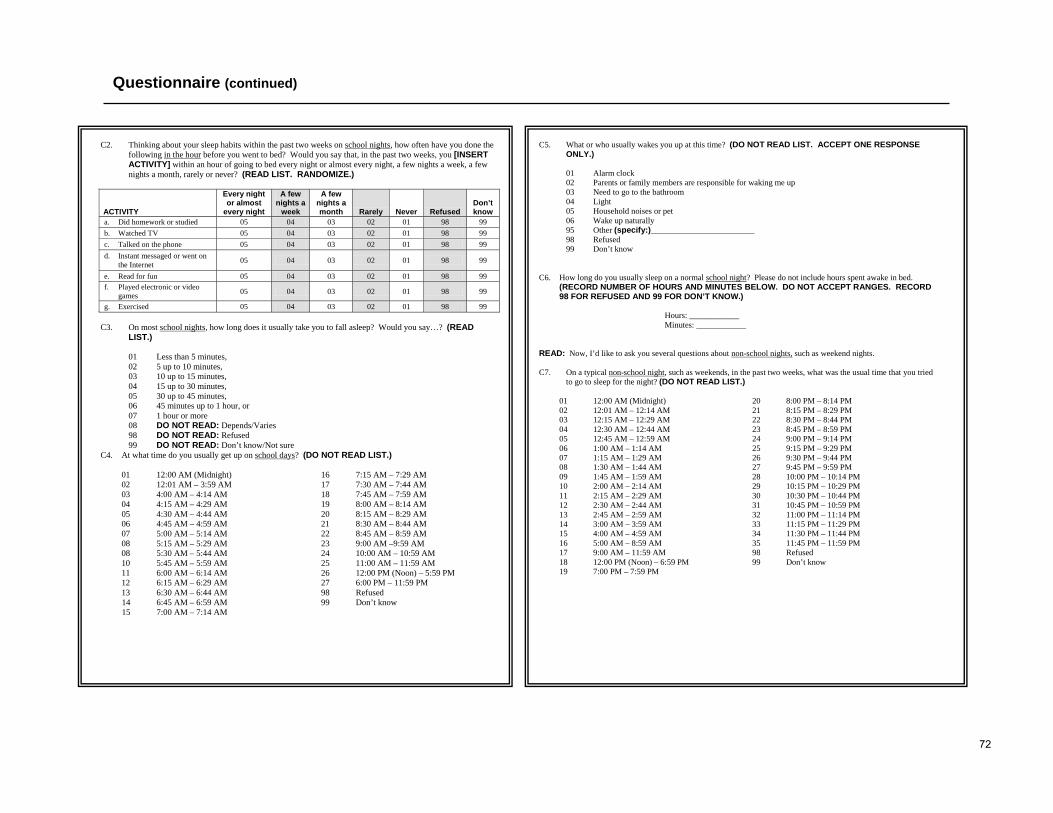
72
Questionnaire (continued)
C5. What or who usually wakes you up at this time? (DO NOT READ LIST. ACCEPT ONE RESPONSE ONLY.)
01 Alarm clock 02 Parents or family members are responsible for waking me up 03 Need to go to the bathroom 04 Light 05 Household noises or pet 06 Wake up naturally 95 Other (specify:)_________________________ 98 Refused 99 Don’t know
C6. How long do you usually sleep on a normal school night? Please do not include hours spent awake in bed. (RECORD NUMBER OF HOURS AND MINUTES BELOW. DO NOT ACCEPT RANGES. RECORD 98 FOR REFUSED AND 99 FOR DON’T KNOW.)
Hours: ____________ Minutes: ____________
READ: Now, I’d like to ask you several questions about non-school nights, such as weekend nights. C7. On a typical non-school night, such as weekends, in the past two weeks, what was the usual time that you tried
to go to sleep for the night? (DO NOT READ LIST.)
01 12:00 AM (Midnight) 02 12:01 AM – 12:14 AM 03 12:15 AM – 12:29 AM 04 12:30 AM – 12:44 AM 05 12:45 AM – 12:59 AM 06 1:00 AM – 1:14 AM 07 1:15 AM – 1:29 AM 08 1:30 AM – 1:44 AM 09 1:45 AM – 1:59 AM 10 2:00 AM – 2:14 AM 11 2:15 AM – 2:29 AM 12 2:30 AM – 2:44 AM 13 2:45 AM – 2:59 AM 14 3:00 AM – 3:59 AM 15 4:00 AM – 4:59 AM 16 5:00 AM – 8:59 AM 17 9:00 AM – 11:59 AM 18 12:00 PM (Noon) – 6:59 PM 19 7:00 PM – 7:59 PM
20 8:00 PM – 8:14 PM 21 8:15 PM – 8:29 PM 22 8:30 PM – 8:44 PM 23 8:45 PM – 8:59 PM 24 9:00 PM – 9:14 PM 25 9:15 PM – 9:29 PM 26 9:30 PM – 9:44 PM 27 9:45 PM – 9:59 PM 28 10:00 PM – 10:14 PM 29 10:15 PM – 10:29 PM 30 10:30 PM – 10:44 PM 31 10:45 PM – 10:59 PM 32 11:00 PM – 11:14 PM 33 11:15 PM – 11:29 PM 34 11:30 PM – 11:44 PM 35 11:45 PM – 11:59 PM 98 Refused 99 Don’t know
C2. Thinking about your sleep habits within the past two weeks on school nights, how often have you done the following in the hour before you went to bed? Would you say that, in the past two weeks, you [INSERT ACTIVITY] within an hour of going to bed every night or almost every night, a few nights a week, a few nights a month, rarely or never? (READ LIST. RANDOMIZE.)
ACTIVITY
Every night or almost
every night
A few nights a
week
A few nights a month Rarely Never Refused
Don’t know
a. Did homework or studied 05 04 03 02 01 98 99 b. Watched TV 05 04 03 02 01 98 99 c. Talked on the phone 05 04 03 02 01 98 99 d. Instant messaged or went on
the Internet 05 04 03 02 01 98 99
e. Read for fun 05 04 03 02 01 98 99 f. Played electronic or video
games 05 04 03 02 01 98 99
g. Exercised 05 04 03 02 01 98 99 C3. On most school nights, how long does it usually take you to fall asleep? Would you say…? (READ
LIST.) 01 Less than 5 minutes, 02 5 up to 10 minutes, 03 10 up to 15 minutes, 04 15 up to 30 minutes, 05 30 up to 45 minutes, 06 45 minutes up to 1 hour, or 07 1 hour or more 08 DO NOT READ: Depends/Varies 98 DO NOT READ: Refused 99 DO NOT READ: Don’t know/Not sure C4. At what time do you usually get up on school days? (DO NOT READ LIST.)
01 12:00 AM (Midnight) 02 12:01 AM – 3:59 AM 03 4:00 AM – 4:14 AM 04 4:15 AM – 4:29 AM 05 4:30 AM – 4:44 AM 06 4:45 AM – 4:59 AM 07 5:00 AM – 5:14 AM 08 5:15 AM – 5:29 AM 08 5:30 AM – 5:44 AM 10 5:45 AM – 5:59 AM 11 6:00 AM – 6:14 AM 12 6:15 AM – 6:29 AM 13 6:30 AM – 6:44 AM 14 6:45 AM – 6:59 AM 15 7:00 AM – 7:14 AM
16 7:15 AM – 7:29 AM 17 7:30 AM – 7:44 AM 18 7:45 AM – 7:59 AM 19 8:00 AM – 8:14 AM 20 8:15 AM – 8:29 AM 21 8:30 AM – 8:44 AM 22 8:45 AM – 8:59 AM 23 9:00 AM –9:59 AM 24 10:00 AM – 10:59 AM 25 11:00 AM – 11:59 AM 26 12:00 PM (Noon) – 5:59 PM 27 6:00 PM – 11:59 PM 98 Refused 99 Don’t know

73
Questionnaire (continued)
IF “01-14” IN C11, ASK C12. OTHERWISE SKIP TO C13. C12. On average, how long would you say you usually nap? Would you say…? (READ LIST.) 01 Less than 30 minutes, 02 30 minutes to less than 1 hour, 03 1 to less than 2 hours, 04 2 to less than 3 hours, or 05 3 hours or more 98 DO NOT READ: Refused 99 DO NOT READ: Don’t know ASK EVERYONE: C13. How much sleep do you think you need each night to feel your best?
(RECORD NUMBER OF HOURS AND MINUTES BELOW. DO NOT ACCEPT RANGES. RECORD 99 FOR “DON’T KNOW” AND 98 FOR “REFUSED”.)
Hours: _____________ Minutes: _____________
C14. Would you say you are…? (READ LIST.) 01 Mostly a morning person, 02 Somewhat a morning person, 03 Neither a morning nor an evening person, 04 Somewhat an evening person, or 05 Mostly an evening person 98 DO NOT READ: Refused 99 DO NOT READ: Don’t know C15. How often do your parents or the people who take care of you talk to you about getting enough sleep? Would
you say…? (READ LIST.)
05 Every day or almost every day, 04 A few days a week, 03 A few days a month, 02 Rarely, or 01 Never 98 DO NOT READ: Refused 99 DO NOT READ: Don’t know
C16. On how many nights can you say “I had a good night’s sleep.” Would you say…? (READ LIST.)
05 Every night or almost every night, 04 A few nights a week, 03 A few nights a month, 02 Rarely, or 01 Never 98 DO NOT READ: Refused 99 DO NOT READ: Don’t know
C8. On most non-school nights, how long does it usually take you to fall asleep? Would you say…? (READ LIST.)
01 Less than 5 minutes, 02 5 up to 10 minutes, 03 10 up to 15 minutes, 04 15 up to 30 minutes, 05 30 up to 45 minutes, 06 45 minutes up to 1 hour, or 07 1 hour or more 08 DO NOT READ: Depends/Varies 98 DO NOT READ: Refused 99 DO NOT READ: Don’t know/Not sure C9. At what time do you usually get up on non-school days? (DO NOT READ LIST.)
01 12:00 AM (Midnight) 02 12:01 AM – 4:59 AM 03 5:00 AM – 5:59 AM 04 6:00 AM – 6:59 AM 05 7:00 AM – 7:59 AM 06 8:00 AM – 8:14 AM 07 8:15 AM – 8:29 AM 08 8:30 AM – 8:44 AM 09 8:45 AM – 8:59 AM 10 9:00 AM – 9:14 AM 11 9:15 AM – 9:29 AM 12 9:30 AM – 9:44 AM 13 9:45 AM – 9:59 AM 14 10:00 AM – 10:14 AM 15 10:15 AM – 10:29 AM 16 10:30 AM – 10:44 AM 17 10:45 AM – 10:59 AM 18 11:00 AM – 11:14 AM
19 11:15 AM – 11:29 AM 20 11:30 AM – 11:44 AM 21 11:45 AM – 11:59 AM 22 12:00 PM (Noon) – 12:14 PM 23 12:15 PM – 12:29 PM 24 12:30 PM – 12:44 PM 25 12:45 PM – 12:59 PM 26 1:00 PM – 1:14 PM 27 1:15 PM – 1:29 PM 28 1:30 PM – 1:44 PM 29 1:45 PM – 1:59 PM 30 2:00 PM – 2:14 PM 31 2:15 PM – 2:29 PM 32 2:30 PM – 2:44 PM 33 2:45 PM – 2:59 PM 34 3:00 PM – 5:59 PM 35 6:00 PM – 11:59 PM 98 Refused 99 Don’t know
C10. How long do you usually sleep on non-school nights, not including hours spent awake in bed?
(RECORD NUMBER OF HOURS AND MINUTES BELOW. DO NOT ACCEPT RANGES. RECORD 98 FOR REFUSED AND 99 FOR DON’T KNOW.)
Hours: ____________ Minutes: ____________
READ: Now I’d like to ask you some more general questions about your sleep habits. C11. In the past two weeks, on how many days did you take a nap? (RECORD NUMBER OF DAYS
BELOW. DO NOT ACCEPT RANGES. RECORD 98 FOR REFUSED AND 99 FOR DON’T KNOW.)
Days: ____________

74
Questionnaire (continued)
C18. Do you think you have a sleep problem? 01 Yes 02 No 03 Maybe 98 DO NOT READ: Refused 99 DO NOT READ: Don’t know/Not sure IF “01 OR 03” IN C18, ASK C19. OTHERWISE SKIP TO C20. C19. Who have you told that you think you have a sleep problem? (READ LIST. MULTIPLE RESPONSES
ACCEPTED.) 01 Your parent(s) 02 A doctor, or 95 Someone else (SPECIFY) ___________________ 03 DO NOT READ: School nurse 04 DO NOT READ: Teacher 05 DO NOT READ: Coach 06 DO NOT READ: Friend 96 DO NOT READ: No one 98 DO NOT READ: Refused 99 DO NOT READ: Don’t know ASK EVERYONE: C20. In the past two weeks, how often did you have unpleasant feelings in your legs like creepy, crawly or tingly
feelings at night with an urge to move when you lie down to sleep? Would you say…? (READ LIST.)
01 Never, 02 Rarely, 03 About once a week,, 04 A few nights a week, or 05 Every night or almost every night 98 DO NOT READ: Refused
99 DO NOT READ: Don’t know/Not sure
IF “02-05” IN C20, ASK C21. OTHERWISE SKIP TO C22A C21. Does moving your legs or feet make them feel better? 01 Yes 02 No 98 DO NOT READ: Refused 99 DO NOT READ: Don’t know/Not sure
C17. In the last two weeks, how often have you…? (READ LIST. DO NOT RANDOMIZE.)
Every night or almost
every night
A few nights a
week
About once a week Rarely Never Refused
Don’t know
a. Had difficulty falling asleep 05 04 03 02 01 98 99
b. Had difficulty staying asleep during the night 05 04 03 02 01 98 99
c. Woken up before you have to and tried to fall back to sleep but could not
05 04 03 02 01 98 99
d. Stayed up until at least 3:00am 05 04 03 02 01 98 99
e. Stayed up all night 05 04 03 02 01 98 99
f. Had nightmares or bad dreams 05 04 03 02 01 98 99
Every day or almost every day
A few days a week
About once a week Rarely Never Refused
Don’t know
g. Needed more than one reminder to get up in the morning
05 04 03 02 01 98 99
h. Arrived late or missed school because you overslept
05 04 03 02 01 98 99
i. Fallen asleep in school 05 04 03 02 01 98 99
j. Felt too tired to do exercise or other physical activity 05 04 03 02 01 98 99
k. Had trouble concentrating or paying attention in school or while doing homework
05 04 03 02 01 98 99
l. Had trouble getting along with family 05 04 03 02 01 98 99
m. Had trouble getting along with friends 05 04 03 02 01 98 99
n. Had trouble getting along with teachers 05 04 03 02 01 98 99
o. Felt too tired or sleepy during the day 05 04 03 02 01 98 99
p. Fallen asleep while doing homework or studying 05 04 03 02 01 98 99
q. Felt cranky or irritable during the day 05 04 03 02 01 98 99
-

75
Questionnaire (continued)
C23. In the last two weeks, how often were you bothered or troubled by [INSERT]? Would you say…? (READ LIST. RANDOMIZE.)
Not at all Somewhat Much Refused Don’t know
a. Feeling unhappy, sad or depressed 01 02 03 98 99 b. Feeling hopeless about the future 01 02 03 98 99 c. Feeling nervous or tense 01 02 03 98 99 d. Worrying too much about things 01 02 03 98 99 e. Being stressed out or anxious 01 02 03 98 99
C24. Has a doctor ever asked you about your sleep? 01 Yes 02 No 98 DO NOT READ: Refused 99 DO NOT READ: Don’t know/Not sure C25. How many cups or cans of caffeinated beverages, such as soda, energy drinks, coffee, tea, iced coffee, or iced
tea do you typically drink each day? (RECORD NUMBER BELOW. DO NOT ACCEPT RANGES. RECORD 99 FOR “DON’T KNOW,” 98 FOR “REFUSED,” 00 FOR “NONE” AND 97 FOR “LESS THAN ONE.”)
Caffeinated beverages: _____________
C26. Think about your usual schedule and how you spend your time each school day. How much time do you
spend each day [INSERT]? Your best estimate is fine. (RANDOMIZE. RECORD IN HOURS AND MINUTES. USE 00 IF DO NOT DO ACTIVITY AT ALL, 98 FOR REFUSED, 99 FOR DON’T KNOW.)
ACTIVITY Number of hours a. Studying and doing homework b. Watching TV c. Playing electronic or video games d. Surfing the Internet e. Talking on the phone or Instant Messaging f. Reading for fun g. Engaging in sports or exercising
C26A. How many hours do you spend each week working at a paying job? Your best estimate is fine. (USE 00 IF
DO NOT WORK, 97 IF LESS THAN ONE HOUR, 98 FOR REFUSED, 99 FOR DON’T KNOW.) Hours: _____________
ASK EVERYONE: C22A. Think about a time when it is easy for you to fall asleep; with that in mind, what time would you go to bed?
(DO NOT READ LIST.)
01 12:00 AM (Midnight) 02 12:01 AM – 12:14 AM 03 12:15 AM – 12:29 AM 04 12:30 AM – 12:44 AM 05 12:45 AM – 12:59 AM 06 1:00 AM – 1:14 AM 07 1:15 AM – 1:29 AM 08 1:30 AM – 1:44 AM 09 1:45 AM – 1:59 AM 10 2:00 AM – 2:14 AM 11 2:15 AM – 2:29 AM 12 2:30 AM – 2:44 AM 13 2:45 AM – 2:59 AM 14 3:00 AM – 3:59 AM 15 4:00 AM – 4:59 AM 16 5:00 AM – 8:59 AM 17 9:00 AM – 11:59 AM 18 12:00 PM (Noon) – 6:59 PM 19 7:00 PM – 7:59 PM
20 8:00 PM – 8:14 PM 21 8:15 PM – 8:29 PM 22 8:30 PM – 8:44 PM 23 8:45 PM – 8:59 PM 24 9:00 PM – 9:14 PM 25 9:15 PM – 9:29 PM 26 9:30 PM – 9:44 PM 27 9:45 PM – 9:59 PM 28 10:00 PM – 10:14 PM 29 10:15 PM – 10:29 PM 30 10:30 PM – 10:44 PM 31 10:45 PM – 10:59 PM 32 11:00 PM – 11:14 PM 33 11:15 PM – 11:29 PM 34 11:30 PM – 11:44 PM 35 11:45 PM – 11:59 PM 96 It depends 97 There is never an easy time for me to fall asleep 98 Refused 99 Don’t know
C22B. Think about a time when it is easy for you to wake up; with that in mind, what time would you get up? (DO
NOT READ LIST.)
01 12:00 AM (Midnight) 02 12:01 AM – 4:59 AM 03 5:00 AM – 5:59 AM 04 6:00 AM – 6:59 AM 05 7:00 AM – 7:59 AM 06 8:00 AM – 8:14 AM 07 8:15 AM – 8:29 AM 08 8:30 AM – 8:44 AM 09 8:45 AM – 8:59 AM 10 9:00 AM – 9:14 AM 11 9:15 AM – 9:29 AM 12 9:30 AM – 9:44 AM 13 9:45 AM – 9:59 AM 14 10:00 AM – 10:14 AM 15 10:15 AM – 10:29 AM 16 10:30 AM – 10:44 AM 17 10:45 AM – 10:59 AM 18 11:00 AM – 11:14 AM
19 11:15 AM – 11:29 AM 20 11:30 AM – 11:44 AM 21 11:45 AM – 11:59 AM 22 12:00 PM (Noon) – 12:14 PM 23 12:15 PM – 12:29 PM 24 12:30 PM – 12:44 PM 25 12:45 PM – 12:59 PM 26 1:00 PM – 1:14 PM 27 1:15 PM – 1:29 PM 28 1:30 PM – 1:44 PM 29 1:45 PM – 1:59 PM 30 2:00 PM – 2:14 PM 31 2:15 PM – 2:29 PM 32 2:30 PM – 2:44 PM 33 2:45 PM – 2:59 PM 34 3:00 PM – 5:59 PM 35 6:00 PM – 11:59 PM 96 It depends 97 There is never an easy time for me to wake up 98 Refused 99 Don’t know
76
Questionnaire (continued)
ASK EVERYONE: C31. Has information about sleep or fatigue been taught to you in…? (READ LIST. RANDOMIZE. CLARIFY
ALL NO REPSONSES: Was this information not taught to you, or have you not taken driver’s education or training?)
ACTIVITY
Yes
No, Was not
taught this
information
No, Have not taken driver’s
education/ training Refused Don’t know
a. Driver’s education or training 01 02 96 98 99 b. Health class or other classes in school 01 02 n/a 98 99
READ TO EVERYONE Those are all the questions I have. On behalf of the National Sleep Foundation, we would like to thank you very much for your cooperation. For quality control purposes, you may receive a follow-up phone call from my supervisor to verify that I have completed this interview. IF RESPONDENT ASKS FOR MORE INFORMATION ON THE NATIONAL SLEEP FOUNDATION, SAY: For more information on the National Sleep Foundation, you can visit their Web site at www.sleepfoundation.org. RECORD NAME AND CONFIRM PHONE NUMBER FOR SUPERVISOR VERIFICATION
C27. How often do you drive a car or motor vehicle? Would you say…? (READ LIST.)
05 Every day, 04 Several times a week, 03 Once a week, CONTINUE 02 A few times a month, or 01 Never SKIP TO C31 96 DO NOT READ: Don’t drive/Don’t have a license SKIP TO C31 98 DO NOT READ: Refused CONTINUE
99 DO NOT READ: Don’t know/Not sure CONTINUE
IF “02-05, 98, 99” IN C27, ASK C28. OTHERWISE SKIP TO C31. C28. In the past year, how often have you driven a car or motor vehicle while feeling drowsy? Would you
say…? (READ LIST.) 05 3 or more times a week, 04 1 to 2 times a week, 03 1 to 2 times a month, 02 Less than once a month, or 01 Never 98 DO NOT READ: Refused 99 DO NOT READ: Don’t know IF “02-05, 98, 99” IN C28, ASK C29. OTHERWISE SKIP TO C31. C29. In the past year, have you ever nodded off or fallen asleep, even just for a brief moment, while driving?
(DO NOT READ LIST.) 01 Yes CONTINUE
02 No 96 Don’t drive/Don’t have a license 98 Refused SKIP TO C31 99 Don’t know IF “01” IN C29, ASK C30. OTHERWISE SKIP TO C31. C30. In the past year, how often have you had an accident or a near accident because you dozed off or were too
tired while driving? Would you say…? (READ LIST.) 05 3 or more times a week, 04 1 to 2 times a week, 03 1 to 2 times a month, 02 Less than once a month, or 01 Never 98 DO NOT READ: Refused 99 DO NOT READ: Don’t know