Summary of Consolidated Financial Results for the Third ......1st quarter-end 2nd quarter-end 3rd...
19
Translation Notice: This document is an excerpt translation of the original Japanese document and is only for reference purposes. In the event of any discrepancy between this translated document and the original Japanese document, the latter shall prevail. Summary of Consolidated Financial Results for the Third Quarter of the Fiscal Year Ending March 31, 2016 (Based on Japanese GAAP) February 4, 2016 Company name: Azbil Corporation Stock exchange listing: Tokyo Stock Exchange 1st Section (CODE 6845) URL: http://www.azbil.com/ Representative: Hirozumi Sone, President and Chief Executive Officer Contact: Takayuki Yokota, Executive Officer, Head of Group Management Headquarters TEL: +81-3-6810-1009 Scheduled date to file Quarterly Securities Report: February 12, 2016 Scheduled date to commence dividend payments: - Preparation of supplementary material on quarterly financial results: Yes Holding of quarterly financial results meeting: No (Amounts less than one million yen are rounded down) 1. Consolidated financial results for the nine months ended December 31, 2015 (from April 1, 2015 to December 31, 2015) (1) Consolidated financial results (Cumulative) Percentages indicate year-on-year changes Net sales Operating income Ordinary income Net income attributable to owners of parent Millions of yen % Millions of yen % Millions of yen % Millions of yen % Nine months ended December 31, 2015 176,493 (0.0) 6,998 6.3 7,089 (18.3) 3,451 (14.5) Nine months ended December 31, 2014 176,566 4.1 6,586 62.8 8,674 72.2 4,036 53.4 Note: Comprehensive income As of December 31, 2015 2,745 million yen (55.0)% As of December 31, 2014 6,103 million yen 8.9% Net income per share Diluted net income per share Yen Yen Nine months ended December 31, 2015 47.04 - Nine months ended December 31, 2014 54.66 - (2) Consolidated financial position Total assets Net assets Shareholders’ equity ratio Millions of yen Millions of yen % As of December 31, 2015 246,078 154,528 62.0 As of March 31, 2015 265,718 160,294 59.6 Note : Shareholders’ equity As of December 31, 2015 152,626 million yen As of March 31, 2015 158,273 million yen 2. Dividends Dividends per share 1st quarter-end 2nd quarter-end 3rd quarter-end Fiscal year-end Total Yen Yen Yen Yen Yen Year ended March 31, 2015 - 31.50 - 31.50 63.00 Year ending March 31, 2016 - 33.50 - Year ending March 31, 2016 (Forecast) 33.50 67.00 Note: Revision of dividends forecast for during this period: No
Transcript of Summary of Consolidated Financial Results for the Third ......1st quarter-end 2nd quarter-end 3rd...

Translation
Notice: This document is an excerpt translation of the original Japanese document and is only for reference purposes. In the event of any discrepancy between this translated document and the original Japanese document, the latter shall prevail.
Summary of Consolidated Financial Results
for the Third Quarter of the Fiscal Year Ending March 31, 2016
(Based on Japanese GAAP) February 4, 2016 Company name: Azbil Corporation
Stock exchange listing: Tokyo Stock Exchange 1st Section (CODE 6845) URL: http://www.azbil.com/ Representative: Hirozumi Sone, President and Chief Executive Officer Contact: Takayuki Yokota, Executive Officer,
Head of Group Management Headquarters TEL: +81-3-6810-1009
Scheduled date to file Quarterly Securities Report: February 12, 2016 Scheduled date to commence dividend payments: -
Preparation of supplementary material on quarterly financial results:
Yes
Holding of quarterly financial results meeting: No
(Amounts less than one million yen are rounded down) 1. Consolidated financial results for the nine months ended December 31, 2015 (from April 1, 2015 to December 31, 2015)
(1) Consolidated financial results (Cumulative) Percentages indicate year-on-year changes
Net sales Operating income Ordinary income Net income attributable to owners of parent
Millions of yen % Millions of yen % Millions of yen % Millions of yen %
Nine months ended December 31, 2015 176,493 (0.0) 6,998 6.3 7,089 (18.3) 3,451 (14.5) Nine months ended December 31, 2014 176,566 4.1 6,586 62.8 8,674 72.2 4,036 53.4 Note: Comprehensive income As of December 31, 2015 2,745 million yen (55.0)%
As of December 31, 2014 6,103 million yen 8.9% Net income per share Diluted net income per share Yen Yen Nine months ended December 31, 2015 47.04 -
Nine months ended December 31, 2014 54.66 -
(2) Consolidated financial position
Total assets Net assets Shareholders’ equity ratio
Millions of yen Millions of yen %
As of December 31, 2015 246,078 154,528 62.0 As of March 31, 2015 265,718 160,294 59.6 Note : Shareholders’ equity As of December 31, 2015 152,626 million yen
As of March 31, 2015 158,273 million yen 2. Dividends
Dividends per share
1st quarter-end 2nd quarter-end 3rd quarter-end Fiscal year-end Total Yen Yen Yen Yen Yen Year ended March 31, 2015 - 31.50 - 31.50 63.00 Year ending March 31, 2016 - 33.50 -
Year ending March 31, 2016 (Forecast) 33.50 67.00
Note: Revision of dividends forecast for during this period: No

3. Forecast of consolidated financial results for the fiscal year ending March 31, 2016 (from April 1, 2015 to March 31, 2016) Percentages indicate year-on-year changes
Net sales Operating income Ordinary income Net income attributable to owners of parent
Net income per share
Millions of yen % Millions of yen % Millions of yen % Millions of yen % Yen Fiscal year 2015 256,000 0.6 17,000 10.8 16,600 (3.2) 9,500 32.5 129.69
Note: Revision of consolidated financial results forecast for during this period : No
* Notes (1) Changes in significant subsidiaries during the period
(Changes in specified subsidiaries due to changes in the scope of consolidation): New consolidation : None (Company name: -) Exclusion : None (Company name: -)
No
(2) Application of special accounting methods for preparing quarterly consolidated financial statements: No
(3) Changes in accounting policies, changes in accounting estimates, and retrospective restatements 1. Changes associated with revision in accounting standards: Yes 2. Other changes: Yes 3. Changes in accounting estimates: No 4. Retrospective restatements: No Note: For details, please refer to “2. Matters concerning summary information (notes) (2) Changes in accounting policies, accounting estimates, and retrospective restatements” on page 10 of the financial results (appendix).
(4) Number of issued shares (Common stock) 1. Total number of issued shares at the end of the period (Including treasury shares)
As of December 31, 2015 75,116,101 shares As of March 31, 2015 75,116,101 shares 2. Number of treasury shares at the end of the period
As of December 31, 2015 1,865,100 shares As of March 31, 2015 1,263,924 shares 3. Average number of shares during the period (Cumulative from the beginning of the fiscal year)
Nine months ended December 31, 2015
73,380,124 shares Nine months ended December 31, 2014
73,852,673 shares
* Description of the situation of the procedures for reviewing quarterly results This quarterly financial results is not subject to the procedures for reviewing quarterly reports specified in the Financial Instruments and Exchange Act. As of the disclosure of this quarterly financial results, the procedures for reviewing consolidated quarterly financial statements are in progress.
* Regarding the appropriate use of forecast and other special matters (Attention to the description of the future) Sales for the azbil Group tend to be concentrated in the second quarter and the fourth quarter consolidated accounting periods. Since fixed costs are generated constantly through the year, in a typical year profits in the first quarter and the third quarter consolidated accounting periods tend to be lower than those in the other two quarters. Conversely, profits in the second quarter and, especially, the fourth quarter, in which sales are concentrated, tend to be higher than those in the other two quarters.
The projections of azbil Group are based on currently available information and some reasonable assumptions. Due to various factors, actual results may differ from those discussed in this document. Please see “1. Qualitative information on consolidated quarterly financial results (3) Qualitative information on forecast of consolidated financial results” on page 8 of the appendix for preconditions underlying these projections and precautions to follow in using these projections.
(How to obtain supplementary material on quarterly financial results) Supplementary material on quarterly financial results will be published on the company’s website on the same day.
Accompanying Materials Contents
1. Qualitative information on consolidated quarterly financial results ················································· 2
(1) Qualitative information on consolidated quarterly business performance ···································· 2
(2) Qualitative information on consolidated quarterly financial position ········································· 8
(3) Qualitative information on forecast of consolidated financial results ········································· 8
2. Matters concerning summary information (notes) ···································································· 10
(1) Changes in significant subsidiaries during the period ························································· 10
(2) Changes in accounting policies, accounting estimates, and retrospective
restatements ········································································································ 10
3. Consolidated quarterly financial statements ··········································································· 11
(1) Consolidated quarterly balance sheets ··········································································· 11
(2) Consolidated quarterly statements of income and Consolidated quarterly
statements of comprehensive income ··········································································· 13
Consolidated quarterly statements of income
The third quarter of the current consolidated cumulative period ··········································· 13
Consolidated quarterly statements of comprehensive income
The third quarter of the current consolidated cumulative period ··········································· 14
(3) Notes to the consolidated quarterly financial statements ····················································· 15
(Notes regarding assumptions of continuing operations) ····················································· 15
(Notes regarding significant change in shareholders’ equity) ················································ 15
(Segment information) ····························································································· 15
4. Supplementary information ······························································································ 17
Orders received condition ····························································································· 17
- 1 -
1. Qualitative information on consolidated quarterly financial results
(1) Qualitative information on consolidated quarterly business performance
In the third quarter of the current consolidated cumulative period, Japan’s economy continued to
demonstrate an improvement in employment and employee compensation as well as in corporate
earnings. However, the picture was not uniform: weakness was discernible in certain sectors,
although overall the gradual recovery continued. As for capital investment, owing to the
economic slowdown in emerging economies, exports to China and Asia were sluggish.
Manufacturing companies thus grew more cautious and evidently some investments were put on
hold.
Turning overseas, the US economy was marked by lackluster capital investment due to such
factors as the slowdown in foreign economies, the fall in the price of crude oil and the high
dollar. However, the recovery continued against the backdrop of a robust household sector.
Europe too continued its gentle recovery, despite the economic impact of the terrorist attacks. In
contrast, because of an impending Fed rate hike in the US, there has been a rapidly
strengthening impression of a slowdown in China and the other emerging economies.
Amid this business environment, guided by the philosophy of “human-centered automation”, the
azbil Group is focused on achieving the targets of the medium-term plan and has set out three key
initiatives Note 1 and three growth fields Note 2 for this purpose. We are currently developing our
business with unique solutions – only available from the azbil Group – based on products,
technologies and services.
We have been keeping abreast of new technological innovations – such as IoT Note 3, big data and AI
– while further strengthening our capabilities for supplying solutions that combine the knowhow we
have acquired through many years of on-site experience with the sort of service that is unique to the
azbil Group. We have also implemented initiatives to expand sales. Progress has been made, in Japan
and abroad, with reinforcing the corporate structure while implementing radical business structure
reforms and production structure enhancement so as to achieve medium- to long-term growth.
In the current consolidated fiscal year too, we have launched new products and services to meet
customer needs and to lead to future business expansion. Progress has also been made with
reorganizing domestic production bases Note 4 so as to adapt to changes in the business environment
and improve efficiency, while enhancing our sales/service system to ensure close links with
customers and the region (enhancing our network of offices in the Tokyo metropolitan area) Note 5 in
order to make sure of tapping into the active construction demand being generated by redevelopment
projects in and around the capital as well as by the upcoming 2020 Summer Olympic and Paralympic
Games in Tokyo.
Note 1: Three Key Initiatives
・Becoming a long-term partner for the customer and the community by offering
solutions based on our technologies and products
・Taking global operations to the next level, with global expansion by moving into new
regions and making a qualitative change of focus
・Becoming a corporate organization that never stops learning, so that it can
continuously strengthen its corporate structure
- 2 -

Note 2: Three Growth Fields
・Next-generation solutions for the indoor spaces of factories, offices, and homes
・Energy management solutions
・Safety solutions
Note 3: IoT (Internet of Things)
IoT involves imparting communications functions to all sorts of “things” around us,
not just computers and other IT equipment. These things are then connected to the
Internet. The resulting exchange of vast amounts of information enables automatic
recognition, automatic control, telemetry, etc. Systems are now being developed to
enable manufacturers to monitor in real-time how their products (equipment fitted
with sensors and communications functions) are operating, and to check whether a
component is malfunctioning, requires replacement, etc.
Note 4: Reorganizing domestic production bases
Progress has been made with the reorganization of domestic production bases,
including the Azbil Corporation’s Shonan and Isehara factories, and also the
factories operated by Azbil Kimmon Co., Ltd., one of the Group companies. The
expenses incurred by closing 2 of Azbil Kimmon’s factories that produced town gas
meters have been recorded as extraordinary losses of 284 million yen (including
impairment loss) in the third quarter of the current consolidated cumulative period.
Note 5: Reinforcing the sales/service system
(enhancing our network of offices in the Tokyo metropolitan area)
To reinforce Azbil Corporation’s sales/service system, sales/service offices have
been established or relocated in Osaki, Toranomon and Kasumigaseki (all within
Tokyo). So the 129 million yen expenses for this have been recorded as
non-operating expenses in the third quarter of the current consolidated cumulative
period.
As can be seen from the financial results for the third quarter of the current consolidated
cumulative period, orders were 214,646 million yen, up 3.1% on the same period last year,
thanks especially to the Building Automation (BA) business which benefitted from not only a
favorable domestic business environment but also a revision made to the way orders for
multi-year contracts are recorded Note 6. As regards sales, the BA business achieved growth
thanks to the aforesaid favorable domestic business environment. However, the effect of the
economic slowdown meant that capital investment in China was stagnant, hitting Japanese
exports and thus domestic industries. These and other factors led to a slight decrease in sales for
the Advanced Automation (AA) business. In addition, the Life Automation (LA) business saw a
fall in sales as a result of the impact of transferring its business in the health, welfare, and
nursing care field in the previous consolidated fiscal year (note that the impact of this on profits
was minor). Consequently, overall sales were 176,493 million yen, on a par with sales for the
same period last year, when sales was 176,566 million yen.
- 3 -

Turning to profits, there was an increase in expenses associated with R&D activities aimed at
future business expansion, and with operating the new core information system, a previously
established initiative designed to strengthen the business infrastructure. Additionally, to coincide
with the introduction of this new system the procedures for job profit-and-loss management
were unified, leading temporarily to a fall in sales and increased expenses for provision for loss
on orders received. Nevertheless, LA business profits improved as a result of reduced goodwill
amortization expenses and the effect of business structure reforms made in the previous
consolidated fiscal year. Overall, operating income increased to 6,998 million yen, up by 6.3%
on 6,586 million yen recorded for the same period last year. However, ordinary income fell to
7,089 million yen, down by 18.3% on 8,674 million yen recorded for the same period last year,
owing mainly to the fact that foreign exchange gains in the same period last year switched to
foreign exchange losses in this quarter. Whereas impairment loss and restructuring loss were
recorded as extraordinary losses in the same period last year, in the third quarter of the current
consolidated cumulative period extraordinary losses were significantly reduced. Yet, since there
was an increase in income taxes-deferred, net income attributable to owners of parent Note 7 was
3,451 million yen, down by 14.5% compared to the same period last year, when it was 4,036
million yen.
Sales for the azbil Group tend to be concentrated in the second quarter and the fourth quarter
consolidated accounting periods. Since fixed costs are generated constantly through the year, in
a typical year profits in the first quarter and the third quarter consolidated accounting periods
tend to be lower than those in the other two quarters. Conversely, profits in the second quarter
and, especially, the fourth quarter, in which sales are concentrated, tend to be higher than those
in the other two quarters.
Note 6: A revision made to the way orders for multi-year contracts are recorded
From the first quarter of the consolidated accounting period, a revision has been made to
the domestic way orders for multi-year contracts are recorded. Previously, large-scale
service projects – such as multi-year contracts awarded under “market testing” – were
recorded, but recently there has been an increase in smaller service contracts that
similarly span several years. Considering the increasing impact of these other contracts
on orders, it has been decided to apply the same parameters for recording all multi-year
contracts, to coincide with the introduction of the new core information system.
In the third quarter of the current consolidated cumulative period, the figure recorded for
large-scale service contracts related to market testing, etc. (approximately 7,600 million
yen in the same period last year) decreased approximately 1,400 million yen in the third
quarter of the current consolidated cumulative period, but as a result of this revision an
additional approximately 3,900 million yen was recorded. Moreover, approximately
4,500 million yen in multi-year contracts were additionally recorded in the current fiscal
year. Note 7: Net income attributable to owners of parent
Since the first quarter of the consolidated cumulative period, “Accounting Standard for
Business Combinations” (ASBJ Statement No. 21, issued on September 13, 2013) etc.,
- 4 -

have been applied, and “net income” is now termed “net income attributable to owners
of parent”.
The results for the individual reportable segments are as follows.
Building Automation (BA) Business In the domestic market, in addition to the urban redevelopment plans for the Tokyo metropolitan
area, there has been continuing demand for energy/cost-saving solutions, so overall investment
in construction has continued to be active. Against this backdrop, the market for new buildings
has generated considerable sales growth, and while the market for existing buildings fell slightly
and service was virtually unchanged from the same period last year, overall a high level of sales
performance was maintained. As a result, domestic market sales were higher than for the same
period last year.
In overseas markets, steady progress has been made with the development of local markets.
Although performance varied depending on the country, there was overall growth in China and
other parts of Asia, and thus overseas market sales too were up on the same period last year.
As a result, BA business sales for the third quarter of the current consolidated cumulative
period were 77,668 million yen, up 3.6% on the same period last year. Segment profit was
impacted by several factors, including the effect of measures and system development
undertaken in anticipation of the future business opportunities afforded throughout the life cycle
of a building. Also, extra expenses were incurred by R&D activities aimed at future business
expansion, and there were also increased expenses associated with operating the new core
information system. Profit was further impacted as a result of unifying job profit-and-loss
management procedures to coincide with the introduction of the aforesaid system. As a result
segment profit was 4,460 million yen, down 16.7% on the same period last year, when segment
profit was 5,351 million yen.
Advanced Automation (AA) Business
In the domestic market, customers have been postponing capital investment, mainly in the
markets for industrial furnaces and semiconductor manufacturing equipment, leading to a
downturn in sales of control products to equipment manufacturers. Also, in chemicals and other
materials industries, uncertainty regarding the future outlook has meant that companies have
stuck to their wait-and-see posture, and as a result capital investment remained low key. In such
an environment, targeting advanced industries such as electrical/electronics and pharmaceuticals,
as well as domestic demand-oriented industries Note 8, and industries connected with the gas
energy supply chain, including LNG carriers, we have striven to expand business by, for
example, offering solutions – unique to the azbil Group – distinguished in terms of safety,
security, and energy saving. However, the business environment has been challenging. Added to
this, large-scale projects boosted sales figures for the same period last year, so overall sales for
this period were relatively lower.
In overseas markets, business has remained robust in the US and the Asian region, leading to
increased revenue overall. It should be noted, though, that because of such factors as slowing
economic growth in China, the business environment continues to be difficult, especially in
- 5 -

fields related to the materials industries.
Consequently, for the third quarter of the current consolidated cumulative period the AA
business recorded sales of 66,040 million yen, down just 0.7% on the same period last year.
Owing to the increase in expenses incurred by R&D activities and by operating the new core
information system, segment profit was 2,464 million yen, down 16.3% compared to the same
period last year, when segment profit was 2,944 million yen.
Note 8: Advanced industries such as electrical/electronics and pharmaceuticals, as well as
domestic demand-oriented industries
The azbil Group has identified as a growth area such advanced industries as
electrical/electronics, semiconductors, automobiles, and chemicals (downstream) as well
as domestic demand-oriented industries such as food and pharmaceuticals, together with
companies that produce manufacturing equipment for the aforesaid industries. These are
referred to collectively as HA/FA (Hybrid Automation and Factory Automation) and the
azbil Group is actively engaged in growing its business in this HA/FA field.
Life Automation (LA) Business
The LA business saw a fall in revenue compared to the same period last year, principally due to
transferring its business in the health, welfare, and nursing care field in the previous
consolidated fiscal year Note 9. Nevertheless, mainly as a result of the business structure reforms
carried out in the Life Science Engineering (LSE) field, but also thanks to steady progress made
with reforms in other business fields, an improvement was achieved in profits.
In the field of gas and water meters, sales were on a par with the same period last year despite
an improvement in profits achieved mainly thanks to actively selecting more profitable orders in
the water meter business. In the LSE field, large-scale jobs were won and orders improved.
Sales also grew. Orders increased in the field of residential air-conditioning systems as a result
of sales system reforms as well as improvements to marketing and development systems.
Furthermore, progress was made with strengthening the profit structure, but sales were largely
unchanged from the same period last year.
Consequently, for the third quarter of the current consolidated cumulative period the LA
business recorded sales of 33,586 million yen, down 5.9% on the same period last year. Profit
improved as a result of reduced goodwill amortization expenses and the effect of structural
reforms undertaken throughout the LA business during the previous consolidated fiscal year.
Segment profit was 62 million yen (a segment loss of 1,722 million yen was recorded in the
same period last year).
Note 9: Transferring its business in the health, welfare, and nursing care field in the previous
consolidated fiscal year
Azbil Corporation transferred all of its shares in Azbil Care & Support Co., Ltd., a
provider of health, welfare, and nursing care services, to SOHGO SECURITY
SERVICES CO., LTD. as of February 4, 2015. In the third quarter of the current
consolidated cumulative period, due to this transferring, sales decreased by
approximately 3,400 million yen, but the effect of it on segment profit is slight.
- 6 -

Other In Other business, sales in the third quarter of the current consolidated cumulative period were
54 million yen (compared with 53 million yen for the same period last year). Segment profit was
17 million yen; for comparison, in the same period last year segment profit was 17 million yen.
- 7 -

(2) Qualitative information on consolidated quarterly financial position
(Assets)
Total assets at the end of the third quarter of fiscal year 2015 stood at 246,078 million yen, a
decrease of 19,639 million yen from the previous fiscal year-end. This was mainly due to a
decrease of 13,461 million yen in cash and deposits as well as a decrease of 7,602 million yen
in notes and accounts receivable-trade.
(Liabilities)
Total liabilities at the end of the third quarter of fiscal year 2015 stood at 91,549 million yen, a
decrease of 13,874 million yen from the previous fiscal year-end. This was mainly due to a
decrease of 4,206 million yen in provision for bonuses as well as a decrease of 4,152 million
yen in notes and accounts payable-trade, a decrease of 3,309 million yen in income taxes
payable, and a decrease of 2,242 million yen in short-term loans payable.
(Net assets)
Net assets at the end of the third quarter of fiscal year 2015 stood at 154,528 million yen, a
decrease of 5,765 million yen from the previous fiscal year-end. This reduction was mainly
attributed to a decrease of 4,780 million yen as the payment of a dividend, a decrease of 2,002
million yen as a result of the purchasing of own shares, a decrease of 1,448 million yen as a
result of applying the revised “Accounting Standard for Business Combinations”, etc., despite
an increase of 3,451 million yen by the recording of net income attributable to owners of
parent.
As a result, the shareholders’ equity ratio was 62.0% compared with 59.6% at the previous
fiscal year-end.
(3) Qualitative information on forecast of consolidated financial results Despite there being some variance by business and region, the azbil Group’s consolidated
financial results for the third quarter of the current consolidated cumulative period were broadly
in line with the forecast published on October 30, 2015. It is true that there are heightened
uncertainties concerning the outlook overseas, with the slowdown in the Chinese economy, the
fall in the price of crude oil, and the potential impact of a Fed rate hike in the US on the
emerging economies. These concerns will mean that some domestic capital investment continues
to be postponed, and the business environment does not encourage optimism. Nevertheless,
Japan’s construction market, which is the main focus for the BA business, continues to be robust.
Taking these factors into account, and our commitment to continue implementing measures
designed to ensure profits, we have decided that no changes will be made to the forecast
previously published (October 30, 2015) for the full year.
In addition to realizing initiatives aimed at achieving forecast performance, focusing on the
previously mentioned three key initiatives, the azbil Group will continue to implement business
structure reforms and measures to enhance the business infrastructure so as to achieve medium-
to long-term growth. While closely tracking changes in the business environment, we will
- 8 -

continuously review the business plan and, where necessary, adopt appropriate measures in a
timely manner.
These projections are based on management’s assumptions, intent, and expectations in light of
the information currently available to it, and therefore these statements are not guarantees of
future performance. Due to various factors, actual results may differ from those discussed in this
document.
- 9 -

2. Matters concerning summary information (notes) (1) Changes in significant subsidiaries during the period:
Non applicable
(2) Changes in accounting policies, accounting estimates, and retrospective restatements: (Application of the Accounting Standard for Business Combinations, etc.) The “Accounting Standard for Business Combinations” (ASBJ Statement No.21 issued on September 13, 2013), the “Accounting Standard for Consolidated Financial Statements” (ASBJ Statement No.22 issued on September 13, 2013) and the “Accounting Standard for Business Divestitures” (ASBJ Statement No.7 issued on September 13, 2013) have been applied since the first quarter of the consolidated accounting period. The balance generated from the changes of ownership ratio over the affiliates under control was started to be included in capital surplus, and the expenses related to acquisition were registered as the expenses when they are generated. Furthermore, with regards to business combinations conducted on or after the beginning of the first quarter of the consolidated accounting period, the accounting method has been changed to reflect the revised allocation of acquisition costs arising from settlement of tentative accounting treatment in the quarterly consolidated financial statement in which the business combination occurs. In addition, the way to present net income, etc. and the method to present from minority interests to non-controlling interests were altered. In order to reflect the above changes, the quarterly consolidated financial statements and consolidated financial statements were rearranged for the third quarter of the previous consolidated cumulative period and the previous consolidated fiscal year. The application of the “Accounting Standard for Business Combinations” has been followed by the transitional handling procedure in accordance with Paragraph 58-2 (3) of the “Accounting Standard for Business Combinations”, Paragraph 44-5 (3) of the “Accounting Standard for Consolidated Financial Statement” and Paragraph 57-4 (3) of the “Accounting Standard for Business Divestitures”. The cumulative effect of accounting change as of the beginning of the first quarter of the consolidated accounting period in case that new accounting standards have been applied to all the past financial statements is deleted from/added to capital surplus or retained earnings. As a result, as of the beginning of the first quarter of the consolidated accounting period, capital surplus decreased by 4,863 million yen, goodwill decreased by 1,448 million yen, and retained earnings increased by 3,415 million yen. This produces minor effects on operating income, ordinary income, and income before income taxes for the third quarter of the current consolidated cumulative period.
(Change in revenue recognition standard)
Concerning the sales of goods within Japan, the Company had been recognizing the revenue at shipment on delivery basis;
however, from the first quarter of the consolidated accounting period, it altered the method to recognize the revenue on
the date when the goods are delivered to and arrive at the customer site.
While the azbil Group companies had been recognizing the revenue for sales of goods within Japan at shipment on delivery
basis, it had been recognizing the revenue for that for overseas countries on shipment basis based on the Free on board (FOB)
contracts and the revenue for that by overseas consolidated subsidiaries and affiliates as a general rule, based on the International
Financial Reporting Standards (IFRS). In recent years, however, the importance of sales of goods overseas and sales by overseas
consolidated subsidiaries and affiliates is increasing, as more and more customers expand their businesses overseas. Under this
circumstance, the Company reviewed the revenue recognition standards. As a result, concerning revenue recognition, the
Company deemed it more appropriate to alter the method to recognize the revenue concerning the sales of goods within Japan
from delivery basis to the date of the receipt of customer to emphasize more the objectivity of “transferring important risks and
economic values associated with possession of goods to the buyers” and also to promote integration of processing method
concerning goods sales among the azbil Group. And thus, it decided to alter the method accordingly upon introduction of a new
core information system and the improvement of its management structure from the first quarter of the consolidated accounting
period.
Because the effect of this change on sales, operating income, ordinary income, and income before income taxes for the third
quarter of the current consolidated cumulative period is slight, retroactive adjustment has not been carried out. The effect on the
segment information is also small. Therefore, the statement is omitted.
- 10 -

3. Consolidated quarterly financial statements (1) Consolidated quarterly balance sheets
(Millions of yen)
As of March 31, 2015 As of December 31, 2015
Assets Current assets
Cash and deposits 58,837 45,376Notes and accounts receivable - trade 88,960 81,358Securities 13,605 14,605Merchandise and finished goods 5,353 5,172Work in process 7,009 10,361Raw materials 9,320 10,105Other 15,474 14,256Allowance for doubtful accounts (565) (495)Total current assets 197,995 180,741
Non-current assets Property, plant and equipment
Buildings and structures, net 13,605 12,944Other, net 12,092 11,680Total property, plant and equipment 25,698 24,624
Intangible assets Goodwill 5,601 3,313Other 5,923 5,750Total intangible assets 11,524 9,064
Investments and other assets Investment securities 22,551 21,449Net defined benefit asset 7 1,596Other 8,314 8,954Allowance for doubtful accounts (373) (353)Total investments and other assets 30,499 31,647
Total non-current assets 67,722 65,336Total assets 265,718 246,078
Liabilities Current liabilities
Notes and accounts payable - trade 42,687 38,535Short-term loans payable 15,776 13,533Income taxes payable 3,829 520Provision for bonuses 8,759 4,552Provision for directors' bonuses 116 57Provision for product warranties 484 588Provision for loss on orders received 616 830Provision for loss on plants reorganization - 131Provision for loss on litigation 441 -
Other 16,981 18,732Total current liabilities 89,694 77,483
- 11 -

(Millions of yen)
As of March 31, 2015 As of December 31, 2015
Non-current liabilities Bonds payable 10 -
Long-term loans payable 856 700Net defined benefit liability 8,164 5,242Provision for directors' retirement benefits 125 124Other 6,572 7,999Total non-current liabilities 15,729 14,066
Total liabilities 105,424 91,549Net assets
Shareholders' equity Capital stock 10,522 10,522Capital surplus 17,197 12,333Retained earnings 121,573 123,659Treasury shares (2,648) (4,650)Total shareholders' equity 146,645 141,865
Accumulated other comprehensive income Valuation difference on available-for-sale securities
9,524 8,812
Deferred gains or losses on hedges - 0Foreign currency translation adjustment 2,505 2,039Remeasurements of defined benefit plans (402) (91)Total accumulated other comprehensive income 11,628 10,760
Non-controlling interests 2,020 1,902Total net assets 160,294 154,528
Total liabilities and net assets 265,718 246,078
- 12 -

(2) Consolidated quarterly statements of income and Consolidated quarterly statements of comprehensive income (Consolidated quarterly statements of income) (The third quarter of the current consolidated cumulative period)
(Millions of yen)
Nine months ended December 31, 2014
(April 1, 2014 to December 31, 2014)
Nine months ended December 31, 2015
(April 1, 2015 to December 31, 2015)
Net sales 176,566 176,493Cost of sales 115,275 115,046Gross profit 61,291 61,446Selling, general and administrative expenses 54,705 54,447Operating income 6,586 6,998Non-operating income
Interest income 111 90Dividend income 329 346Foreign exchange gains 1,912 -
Real estate rent 41 33Reversal of allowance for doubtful accounts - 20Gain on reversal of environmental expenses - 302Other 201 208Total non-operating income 2,596 1,002
Non-operating expenses Interest expenses 328 260Foreign exchange losses - 332Commitment fee 15 15Rent expenses on real estates 44 40Office transfer expenses 39 186Provision of allowance for doubtful accounts 5 -
Share of loss of entities accounted for using equity method
4 2
Other 69 73Total non-operating expenses 508 911
Ordinary income 8,674 7,089Extraordinary income
Gain on sales of non-current assets 71 34Gain on sales of investment securities 53 188Total extraordinary income 124 223
Extraordinary losses Loss on sales and retirement of non-current assets 80 53Impairment loss 1,784 335Loss on plants reorganization - 248Loss on valuation of investment securities - 1Restructuring loss 438 -
Provision for loss on litigation 436 -
Loss on sales of investment securities 0 -
Total extraordinary losses 2,739 638Income before income taxes 6,059 6,673Income taxes - current 1,017 1,122Income taxes - deferred 824 1,904Total income taxes 1,841 3,027Net income 4,217 3,646Net income attributable to non-controlling interests 181 194Net income attributable to owners of parent 4,036 3,451
- 13 -
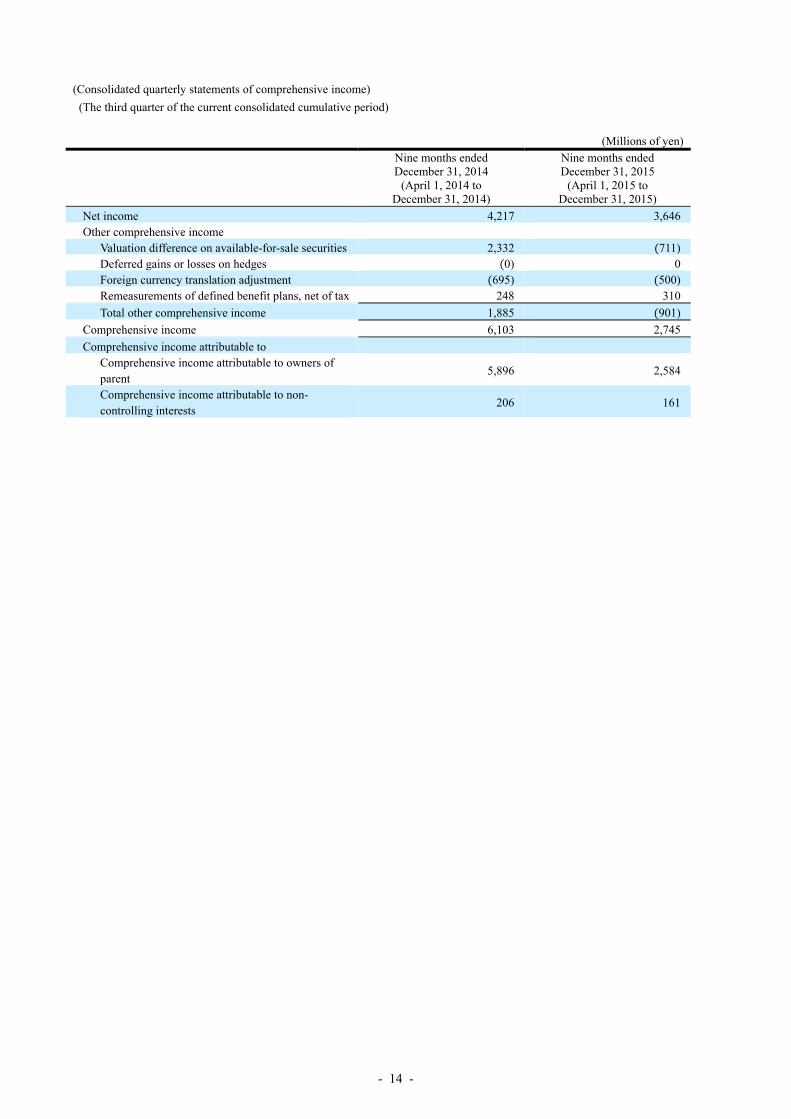
(Consolidated quarterly statements of comprehensive income) (The third quarter of the current consolidated cumulative period)
(Millions of yen)
Nine months ended December 31, 2014
(April 1, 2014 to December 31, 2014)
Nine months ended December 31, 2015
(April 1, 2015 to December 31, 2015)
Net income 4,217 3,646Other comprehensive income
Valuation difference on available-for-sale securities 2,332 (711)Deferred gains or losses on hedges (0) 0Foreign currency translation adjustment (695) (500)Remeasurements of defined benefit plans, net of tax 248 310Total other comprehensive income 1,885 (901)
Comprehensive income 6,103 2,745Comprehensive income attributable to
Comprehensive income attributable to owners of parent
5,896 2,584
Comprehensive income attributable to non-controlling interests
206 161
- 14 -

(3) Notes to the consolidated quarterly financial statements (Notes regarding assumptions of continuing operations)
Non applicable
(Notes regarding significant change in shareholders’ equity) From the first quarter of the consolidated accounting period, the azbil Group has applied the “Accounting Standard for Business Combinations”, etc. As a result, the capital surplus decreased by 4,863 million yen, and retained earnings increased by 3,415 million yen. The Company repurchased its own shares to aim not only to improve capital efficiency but also to enhance the return of profits to shareholders and develop capital policies in response to changes in the corporate environment, taking into consideration the future business performance forecast, based on the resolutions at the Board of Directors meetings held on May 13, 2015. The number of its own shares repurchased was 600,000 shares for 1,998 million yen in the first quarter of the consolidated accounting period. As a result, treasury shares amounted to 4,650 million yen at the end of the third quarter of the current consolidated accounting period.
(Segment information) Nine months ended December 31, 2014 (from April 1, 2014 to December 31, 2014) 1.Sales and profit (loss) information about each segment
(Millions of yen)
Reportable Segment
Other* Total Building Automation
Advanced Automation
Life Automation Total
Sales
Customers 74,839 66,090 35,587 176,518 48 176,566
Inter-segment 110 393 106 610 4 615
Total 74,950 66,484 35,693 177,128 53 177,182
Segment Profit (loss) 5,351 2,944 (1,722) 6,573 17 6,590
* “Other” includes insurance agent business.
2.The main contents of the difference between reportable segment profit (loss) and operating income (Millions of yen)
Income Amount
Total of reportable segments 6,573
Profit in Other 17
Elimination (4)
Operating income 6,586
3. Information on the impairment loss of non-current assets, goodwill, etc. for each reportable segment (Material changes in goodwill amount)
In the “Life Automation business,” goodwill increased by 1,637 million yen, as the company acquired additional investments in capital of the consolidated subsidiary Azbil Telstar, S.L. during the third quarter of the current consolidated accounting period. In addition, the future revenue expectations were revised following the process of business reevaluation and restructuring, consequently goodwill was reduced to a recoverable amount. The decrease of 1,784 million yen is recorded in the section of extraordinary losses as impairment loss.
- 15 -

Nine months ended December 31, 2015 (from April 1, 2015 to December 31, 2015) 1.Sales and profit information about each segment
(Millions of yen)
Reportable Segment
Other* Total Building Automation
Advanced Automation
Life Automation Total
Sales
Customers 77,430 65,627 33,386 176,443 49 176,493
Inter-segment 238 412 200 851 5 856
Total 77,668 66,040 33,586 177,295 54 177,350
Segment Profit 4,460 2,464 62 6,988 17 7,005
* “Other” includes insurance agent business.
2.The main contents of the difference between reportable segment profit and operating income (Millions of yen)
Income Amount
Total of reportable segments 6,988
Profit in Other 17
Elimination (7)
Operating income 6,998
3. Notice on the changes of the reportable segments (Application of the Accounting Standard for Business Combinations, etc.) The “Accounting Standard for Business Combinations”, etc., have been applied since the first quarter of the consolidated accounting period. The balance generated from the changes of ownership ratio over the affiliates under control was started to be included in capital surplus, and the expenses related to acquisition were registered as the expenses when they are generated. Furthermore, with regards to business combinations conducted on or after the beginning of the first quarter of the consolidated accounting period, the accounting method has been changed to reflect the revised allocation of acquisition costs arising from settlement of tentative accounting treatment in the quarterly consolidated financial statement in which the business combination occurs. As a result, unamortized balance of goodwill decreased by 199 million yen for the “Advanced Automation Business” and 1,249 million yen for the “Life Automation Business”.
(Changes in the methods to measure internal sales or transfer amount between segments) From the first quarter of the consolidated accounting period, the Company reviewed the performance assessment method upon introduction of our new core information system and changed the methods to measure internal sales or transfer amount between segments. As a result, this produces minor effects on internal sales or transfer amount between segments and segment profit during the third quarter of the current consolidated cumulative period. The third quarter of the previous consolidated cumulative period was developed based on the new methods to measure internal sales or transfer amount between segments and described in “1. Sales and profit (loss) information about each segment”.
4. Information on the impairment loss of non-current assets, goodwill, etc. for each reportable segment (Material changes in goodwill amount) In the “Advanced Automation business,” during the third quarter of the current consolidated accounting period, goodwill of the consolidated subsidiary Azbil VorTek, LLC was reduced to a recoverable amount as a result of revising future revenue expectations. The decrease of 299 million yen is recorded in the section of extraordinary losses as impairment loss.
- 16 -

4.Supplementary information
Orders received condition (Millions of yen)
Reportable segment
Nine months ended December 31, 2014
(April 1, 2014 to December 31, 2014)
Nine months ended December 31, 2015
(April 1, 2015 to December 31, 2015)
Change
Orders received
Orders received
Orders received
Amount Ratio (%)
Building Automation 100,425 108,009 7,583 7.6
Advanced Automation 72,537 72,115 (422) (0.6)
Life Automation 35,925 35,199 (725) (2.0)
Total of reportable segments 208,888 215,324 6,435 3.1
Other 53 54 1 2.4
Elimination (717) (732) (15) -
Consolidated 208,224 214,646 6,421 3.1
*From the first quarter of the consolidated accounting period, the Company reviewed the performance assessment method upon introduction of our new core information system and changed the method to measure orders received between segments. Concerning increase/decrease as compared with the same quarter of last year, the figures are calculated using the method after the change. As a result, this produces minor effects on orders received between segments during the third quarter of the current consolidated cumulative period.
- 17 -