Summary jpx-wpenno2
28
Satoshi Hayakawa SPARX Asset Management Co. Ltd. The University of Tokyo Tokyo Stock Exchange, Inc. The University of Tokyo CREST, JST University of Tokyo Kiyoshi IZUMI Takanobu MIZUTA* Shinobu YOSHIMURA Investigation of Relationship between Tick Size and Trading Volume of Markets using Artificial Market Simulations JPX Working Paper 【Summary】 Vol. 2, 30 th January 2013 1
-
Upload
takanobu-mizuta -
Category
Economy & Finance
-
view
92 -
download
0
Transcript of Summary jpx-wpenno2

Satoshi Hayakawa
SPARX Asset Management Co. Ltd.
The University of Tokyo
Tokyo Stock Exchange, Inc.
The University of Tokyo
CREST, JST
University of Tokyo
Kiyoshi IZUMI
Takanobu MIZUTA*
Shinobu YOSHIMURA
Investigation of Relationship between
Tick Size and Trading Volume of Markets
using Artificial Market Simulations
JPX Working Paper 【Summary】
Vol. 2, 30th January 2013
1
This material was compiled based on the results of research and studies by directors, officers,
and/or employees of Japan Exchange Group, Inc., its subsidiaries, and affiliates (hereafter
collectively “the JPX group”) with the intention of seeking comments from a wide range of
persons from academia, research institutions, and market users. The views and opinions in this
material are the writer‘s own and do not constitute the official view of the JPX group. This
material was prepared solely for the purpose of providing information, and was not intended to
solicit investment or recommend specific issues or securities companies. The JPX group shall
not be responsible or liable for any damages or losses arising from use of this material. This
English translation is intended for reference purposes only. In cases where any differences
occur between the English version and its Japanese original, the Japanese version shall prevail. This translation includes different values on figures and tables from the Japanese original
because methods of analysis and/or calculation are different. This translation do not includes
some paragraphs which Japanese original includes. This translation is subject to change without
notice. The JPX group shall accept no responsibility or liability for damages or losses caused by
any error, inaccuracy, misunderstanding, or changes with regard to this translation.
2
Mechanism of
Moving Share
Artificial Market Model
(Multi-Agent Simulation)
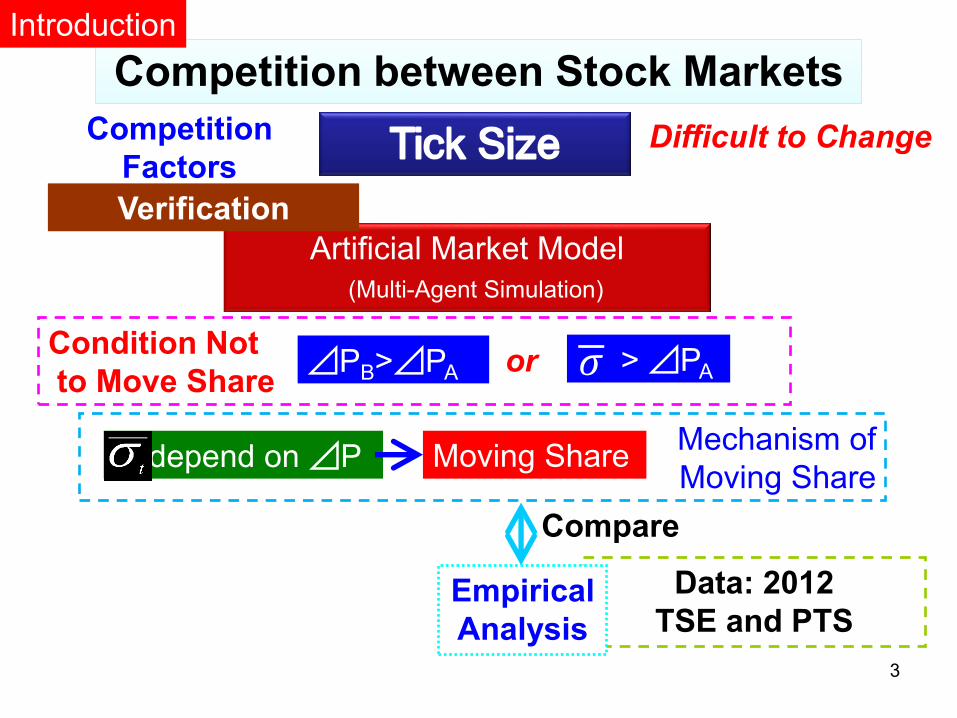
Competition between Stock Markets Competition between Stock Markets
Difficult to Change Competition
Factors
Verification
Compare
Condition Not
to Move Share
Data: 2012
TSE and PTS Empirical
Analysis
Introduction
or
depend on ⊿P Moving Share
⊿PB>⊿PA > ⊿PA 𝜎
3

What is Tick Size?
Difference of 1% Return is Serious Problem for some Investors
⇒ They prefer Stock Market has Smaller Tick Size ⊿P
Here, we define Tick Size ⊿P = Minimum Increment / Price
89.0
90.0
91.0
92.0
93.0
94.0
95.0
09:0
0
10:0
0
11:0
0
13:0
0
14:0
0
15:0
0
time (hh:mm)
Mar
ket
Price
Minimum Increment: \1 ⇒ Tick Size: 1%
Minimum Increment: \0.1 ⇒ Tick Size: 0.1%
4

Mechanism of
Moving Share
Artificial Market Model
(Multi-Agent Simulation)
Competition between Stock Markets Competition between Stock Markets
Difficult to Change Tick Size Competition
Factors
Verification
Compare
Data: 2012
TSE and PTS Empirical
Analysis
depend on ⊿P Moving Share
Condition Not
to Move Share or ⊿PB>⊿PA > ⊿PA 𝜎
5

● Continuous Double Auction
● Agent model is Simple
Chiarella et. al. [2009]
Artificial Market Model (Multi Agent Simulation)
t
jj
t
jhjt
f
j
i ji
t
je wrwP
Pw
wr ,3
1
,,21,13
1 ,
, log1
Fundamental Technical noise
Expected Return ,i jw
Strategy
Weight
↑ Different
for each agent
heterogeneous 1000 agents
+ Trade number, Cancel rate, 1 day Volatility, and so on.
Replicate Micro Structures
Simulation Time ⇔ Real Time convertible
We interested in how long do markets need get shares.
(Original)
6

* Fundamental Strategy Term
Fundamental Price > Market Price ⇒ expects + return
Fundamental Price < Market Price ⇒ expects - return
* Technical Strategy Term
Historical Return > 0 ⇒ expects + return
Historical Return < 0 ⇒ expects - return
Terms of Fundamental Strategy, Technical Strategy
Fundamental
Price Market
Price
Technical
(Momentum)
Strategy
Fundamental
Strategy
7

Order Price and Buy or Sell
Order Price Gauss
Distribution
price
Sell (one unit)
Buy (one unit) (stdev±0.3%)
tP
,
t
o jP
d
t
je PP ,
d
t
je PP ,
t
je
t
jo PP ,,
t
je
t
jo PP ,,
Expected Price t
jeP ,
To Stabilize simulation for continuous double mechanism,
Order Prices must be covered widely in Order Book. 8
t
jj
t
jhjt
f
j
i ji
t
je wrwP
Pw
wr ,3
1
,,21,13
1 ,
, log1
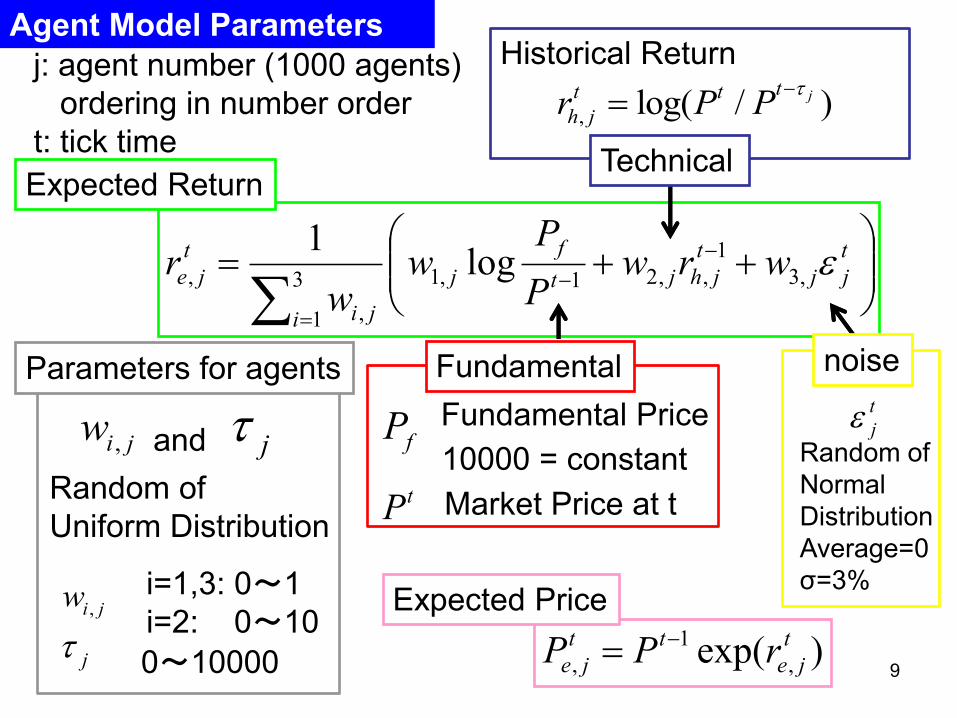
Agent Model Parameters
Fundamental
Market Price at t
Fundamental Price Random of
Normal
Distribution
Average=0
σ=3%
Technical
Historical Return
noise
Random of
Uniform Distribution
Parameters for agents
10000 = constant
j: agent number (1000 agents)
ordering in number order
t: tick time
0~10000
i=1,3: 0~1
i=2: 0~10
, log( / )jtt t
h jr P P
j
j
,i jw
,i jw
fP
tP
t
j
Expected Return
and
)exp( ,
1
,
t
je
tt
je rPP
Expected Price
9

Initial Trading
Volume Share: 10%
Tick Size: Small
Initial Trading
Volume Share: 90%
Tick Size: Large
Agents
Market Order: Choose the
market list best price
Limit Order: Allocate on basis
of Historical Trading Volume
Share of each market
Maket A Market B
Market Selection Model
Market Order: buy or sell at the best available price, immediately
Limit Order: buy or sell at a specific price or better,
waiting opposite Market Orders 10

Market
A
Sell Price Buy
84 101
176 100
99 204
98 77
Market
B
Sell Price Buy
1 99.2
2 99.1
99.0 3
98.8 1
(1) Buy ¥98: Allocate on basis of Historical Trading Volume
Share of each market
(2) Buy ¥99.1: Market B
↑can buy ¥99.1 at Market B, immediately
(3) Buy ¥100: Market B
↑can buy ¥99.1 at Market B, best price
Market B will take Trading Volume share because of (2), (3)
Market Selection Model (example)
Order
Book
Limit
Orders
11

: Probability an agent choose Market A
TbTa
TaWa
Ta Tb,
Wa
Allocate on basis of Historical Trading Volume Share
tAB=5 days
: Trading Volume of Market A or B within last tAB
12

Mechanism of
Moving Share
Artificial Market Model
(Multi-Agent Simulation)
Competition between Stock Markets Competition between Stock Markets
Difficult to Change Tick Size Competition
Factors
Verification
Compare
Data: 2012
TSE and PTS Empirical
Analysis
depend on ⊿P Moving Share
Verification
Condition Not
to Move Share or ⊿PB>⊿PA > ⊿PA 𝜎
13

Stylized Facts
Replicate Fat-Tail and Volatility-Clustering %05.0t
+ Trade rate, Cancel rate, 1 tick and 1 day volatility
Replicate Micro Structures (Original) Volatility at
tick size small
Simulation Time ⇔ Real Time convertible
We interested in how long do markets need get shares.
tick size(%) 0.0001% 0.001% 0.01% 0.1% 1%
about trading
trade rate 23.5% 23.5% 23.4% 23.1% 22.1%
cancel rate 26.2% 26.2% 26.3% 26.6% 27.6%
number of trades / 1 day 6,361 6,358 6,345 6,279 6,081
standard deviations
for 1 tick 0.05% 0.05% 0.05% 0.06% 0.16% for 1 day (20000 ticks) 0.59% 0.56% 0.57% 0.57% 1.15%
kurtosis 1.50 1.48 1.45 1.10 1.81
autocorrelation coefficient for square return
lag
1 0.229 0.228 0.228 0.210 0.025
2 0.141 0.141 0.141 0.120 0.013
3 0.109 0.108 0.108 0.090 0.008 4 0.091 0.091 0.091 0.075 0.006
5 0.078 0.078 0.078 0.064 0.004
14

Mechanism of
Moving Share
Artificial Market Model
(Multi-Agent Simulation)
Competition between Stock Markets Competition between Stock Markets
Difficult to Change Tick Size Competition
Factors
Verification
Compare
Data: 2012
TSE and PTS Empirical
Analysis
depend on ⊿P Moving Share
Condition Not
to Move Share or ⊿PB>⊿PA > ⊿PA 𝜎
15

Tick Size of Market A, ⊿PA is larger,
Market A is taken trading volume share faster
Tick Size of Market B ⊿PB=0.01%, Tick Size is not small
0%
10%
20%
30%
40%
50%
60%
70%
80%
90%
100%0 25 50 75 100
125
150
175
200
225
250
275
300
325
350
375
400
425
450
475
500
Tra
ding
sha
re o
f M
arke
t A
days
Trading share of Market A for various ⊿PA
(tAB=5 days, ⊿PB=0.01%)
0.01%
0.05%
0.10%
0.20%
16
17
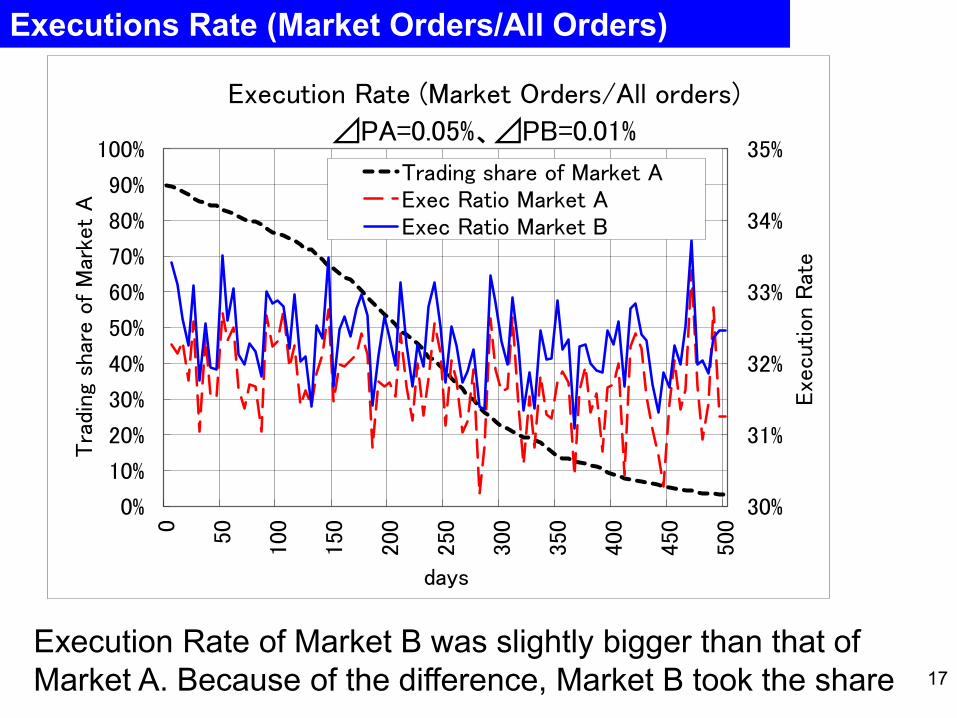
Executions Rate (Market Orders/All Orders)
Execution Rate of Market B was slightly bigger than that of
Market A. Because of the difference, Market B took the share
30%
31%
32%
33%
34%
35%
0%
10%
20%
30%
40%
50%
60%
70%
80%
90%
100%0
50
100
150
200
250
300
350
400
450
500
Exe
cution
Rat
e
Tra
ding
sha
re o
f M
arke
t A
days
Execution Rate (Market Orders/All orders)
⊿PA=0.05%、⊿PB=0.01%
Trading share of Market AExec Ratio Market AExec Ratio Market B

Market B can hardly take the share in spite that
⊿PA is very larger than ⊿PB
⊿PB=0.0001%, Tick Size is enough small
0%
10%
20%
30%
40%
50%
60%
70%
80%
90%
100%0 25 50 75 100
125
150
175
200
225
250
275
300
325
350
375
400
425
450
475
500
Tra
ding
sha
re o
f M
arke
t A
days
Trading share of Market A for various ⊿PA
(tAB=5 days, ⊿PB=0.0001%)
0.0001%
0.0005%
0.0010%
0.0020%
18

Tick Size Condition Not to Move Share
%05.0t
Trading share of Market A at 500 days
⊿PB
0.0001% 0.0002% 0.0005% 0.001% 0.002% 0.005% 0.01% 0.02% 0.05% 0.1% 0.2%
⊿PA
0.0001% 90% 90% 91% 91% 92% 94% 97% 99% 100% 100% 100%
0.0002% 90% 90% 90% 91% 91% 94% 97% 99% 100% 100% 100%
0.0005% 89% 90% 91% 91% 92% 94% 96% 99% 100% 100% 100%
0.001% 89% 89% 90% 90% 92% 94% 97% 99% 100% 100% 100%
0.002% 87% 88% 89% 89% 91% 93% 97% 99% 100% 100% 100%
0.005% 84% 85% 85% 84% 87% 92% 96% 99% 100% 100% 100%
0.01% 75% 76% 76% 77% 78% 83% 92% 98% 100% 100% 100%
0.02% 53% 52% 53% 54% 54% 59% 70% 93% 100% 100% 100%
0.05% 5% 5% 4% 5% 5% 5% 6% 23% 93% 100% 100%
0.1% 0% 0% 0% 0% 0% 0% 0% 0% 0% 94% 100%
0.2% 0% 0% 0% 0% 0% 0% 0% 0% 0% 0% 96%
Condition Not
to Move Share or ⊿PB>⊿PA > ⊿PA 𝜎
19

Mechanism of
Moving Share
Artificial Market Model
(Multi-Agent Simulation)
Competition between Stock Markets Competition between Stock Markets
Difficult to Change Tick Size Competition
Factors
Verification
Compare
Data: 2012
TSE and PTS Empirical
Analysis
depend on ⊿P Moving Share Mechanism of
Moving Share depend on ⊿P Moving Share
Condition Not
to Move Share or ⊿PB>⊿PA > ⊿PA 𝜎
20

Relationship between σt and Share (⊿PB is enough small)
When σt depends on ⊿PA, Market A is taken share very Rapidly
0%
20%
40%
60%
80%
100%
0.01%
0.10%
1.00%
0.000
1%
0.001
0%
0.010
0%
0.100
0%
1.000
0%
Tra
ding
shar
e o
f
Mar
ket
A a
t 500 d
ays
σt
⊿PA
Relationship between ⊿PA,σt and Trading share
(⊿PB=0.0001%)
σt (left axis) Trading share of Market A at 500 days (right axis)0.0
500%
21

time
unable
trading in
Market A
price
σt < ⊿PA
unable trading in Market A
→ many trading in Market B ⇒ trading share moving to Market B
time
price
needless
Market B
⇒ trading share not moving
σt > ⊿PA
⊿PA
⊿PA
22

Mechanism of
Moving Share
Artificial Market Model
(Multi-Agent Simulation)
Competition between Stock Markets Competition between Stock Markets
Difficult to Change Tick Size Competition
Factors
Verification
Condition Not
to Move Share
Empirical
Analysis
1/10 > ⊿PA tor
depend on ⊿P Moving Share
⊿PB>⊿PA
Mechanism of
Moving Share depend on ⊿P Moving Share
Compare
Data: 2012
TSE and PTS Empirical
Analysis 23

Data
Data Period: All business days in calendar year 2012
Universe: 439 stocks
Selected by TOPIX 500 index whole data period
they had same tick size for every month ends
they were traded every business days at least once
Horizontal Axis: Tick Size of TSE ⊿P for each stock
▲: standard deviation of 10 seconds return for each stock, σt
●: trading volume share in PTS for each stock
Summarize Markets:
Traditional Stock Exchanges:
Tokyo Stock Exchange,Osaka SE,
Nagoya,Fukuoka, Sapporo, and JASDAQ
PTS (Proprietary Trading System):
Japan Next PTS J-Market,Japan Next PTS X-Market,
and Chi-X Japan PTS
Empirical Study
24
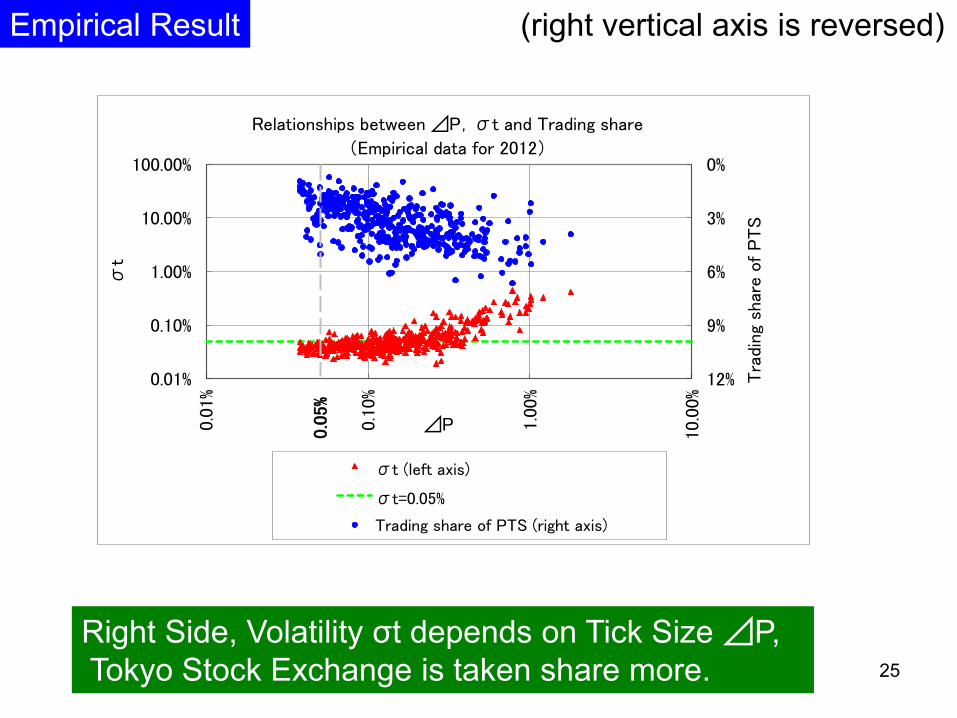
(right vertical axis is reversed)
Right Side, Volatility σt depends on Tick Size ⊿P,
Tokyo Stock Exchange is taken share more.
Empirical Result
0%
3%
6%
9%
12%0.01%
0.10%
1.00%
10.00%
100.00%
0.01%
0.10%
1.00
%
10.0
0%
Tra
ding
shar
e o
f P
TS
σt
⊿P
Relationships between ⊿P,σt and Trading share
(Empirical data for 2012)
σt (left axis)
σt=0.05%
Trading share of PTS (right axis)
0.0
5%
25
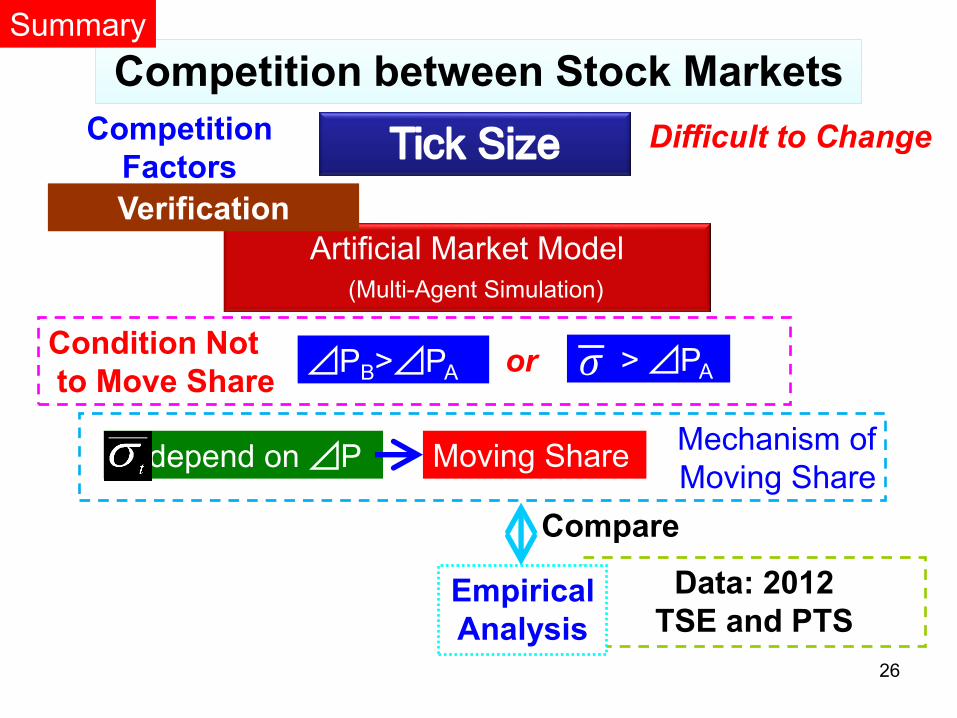
Mechanism of
Moving Share
Artificial Market Model
(Multi-Agent Simulation)
Competition between Stock Markets Competition between Stock Markets
Difficult to Change Competition
Factors
Verification
Compare
Data: 2012
TSE and PTS Empirical
Analysis
depend on ⊿P Moving Share
Summary
Condition Not
to Move Share or ⊿PB>⊿PA > ⊿PA 𝜎
26

Appendix
27
order
book
sell price buy
84 101
176 100
99 2
98 77
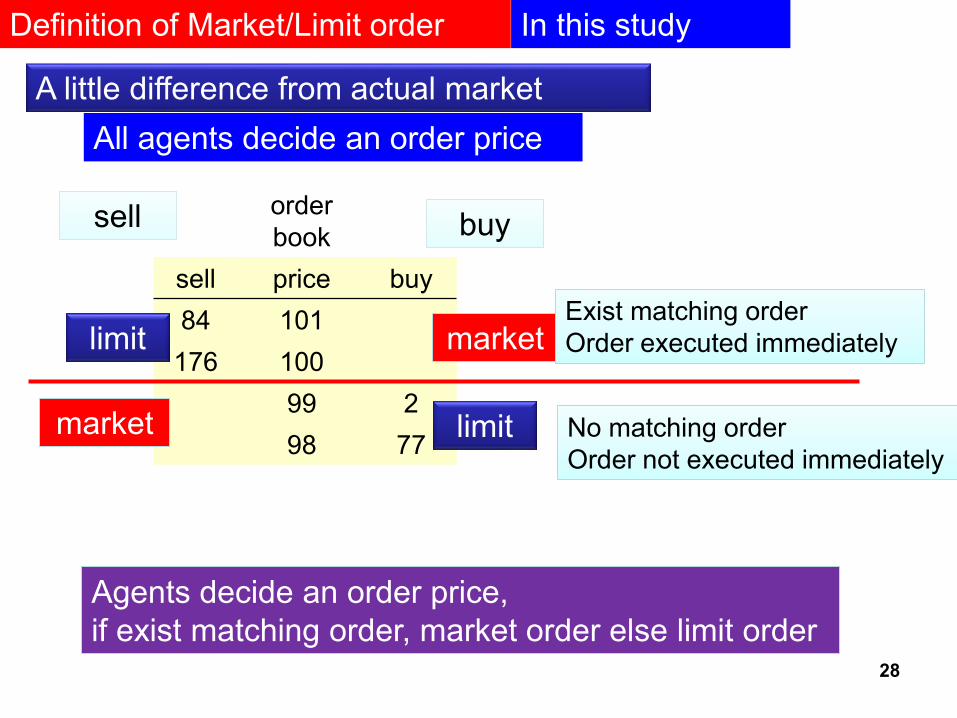
Definition of Market/Limit order In this study
A little difference from actual market
limit
market market limit
market market Exist matching order
Order executed immediately
Exist matching order
Order executed immediately
No matching order
Order not executed immediately
No matching order
Order not executed immediately
buy buy sell sell
Agents decide an order price,
if exist matching order, market order else limit order
Agents decide an order price,
if exist matching order, market order else limit order
All agents decide an order price
28


![T tit TAD aniz X- ent dev Tsix Xist · NATURE GENETICS ARTICLES 70-kb [Xite-Jpx]Jpx Xist Tsix Xite 5 YX a 0 25 0 25 −15 0 15 0 25 0 25 −15 0 15 Delta Interactions per 10 Wild](https://static.fdocuments.net/doc/165x107/5e9d5f2aef68d210144a251c/t-tit-tad-aniz-x-ent-dev-tsix-xist-nature-genetics-articles-70-kb-xite-jpxjpx.jpg)