
Summary Information Packages1.q4cdn.com/308575831/files/doc_presentations/CHP - Q2 2014 Su… ·...
27
Summary Information Package Q2 Quarter ended June 30, 2014
Transcript of Summary Information Packages1.q4cdn.com/308575831/files/doc_presentations/CHP - Q2 2014 Su… ·...

Summary Information Package
Q2 Quarter ended June 30, 2014
2
Table of Contents
Note:This document is to be read in conjunction with the 2014 Second Quarter Report to Unitholders of Choice Properties Real Estate Investment Trust (“Choice Properties”)
Item Slide Number
Forward-Looking Statements 3
Q2 2014 Conference Call – at July 22, 2014 10:00AM
Highlights 4
Financial Results 5
Capital Structure 6
Operational Performance 7
Acquisition Activity 8
Summary 9
Q2 2014 Summary Information
Financial Statements 10
Portfolio Highlights 13
GLA and Revenue by Province 14
Third-Party GLA by Business Sector 15
Lease Expiration Schedule 16
Debt Maturity Profile 17
Financial Covenants 18
Individual Property Summary 19

This document contains forward-looking statements about Choice Properties’ objectives, plans, goals, aspirations, strategies, financial condition, results of operations, cash flows, performance, prospects and opportunities. Forward-looking statements are typically identified by words such as “expect”, “anticipate”, “believe”, “foresee”, “could”, “estimate”, “goal”, “intend”, “plan”, “seek”, “strive”, “will”, “may”, “should” and similar expressions, as they relate to Choice Properties and its management.
Forward-looking statements reflect Choice Properties’ current estimates, beliefs and assumptions, which are based on management’s perception of historic trends, current conditions and expected future developments, as well as other factors it believes are appropriate in the circumstances. Choice Properties’ expectation of operating and financial performance is based on certain assumptions, including assumptions about future growth potential, prospects and opportunities, industry trends, future levels of indebtedness, current tax laws, current economic conditions and no new competition in the market that leads to reduced revenues and profitability. Management’s estimates, beliefs and assumptions are inherently subject to significant business, economic, competitive and other uncertainties and contingencies regarding future events and as such, are subject to change. Choice Properties can give no assurance that such estimates, beliefs and assumptions will prove to be correct.
Numerous risks and uncertainties could cause Choice Properties’ actual results to differ materially from those expressed, implied or projected in the forward-looking statements, including, but not limited to:
• changes in economic conditions, including changes in interest rates, and the rates of inflation or deflation;
• the inability of Choice Properties to maintain and leverage its relationship with Loblaw Companies Limited (“Loblaw”), including in respect of: (i) Loblaw’s retained interest in Choice Properties and its current intention with respect thereto; (ii) the services to be provided to Choice Properties (whether directly or indirectly) by Loblaw; (iii) expected transactions to be entered into between Loblaw and Choice Properties (including Choice Properties’ acquisition of certain interests in properties held by Loblaw); and (iv) the Strategic Alliance Agreement as presented in the Prospectus;
• changes in Loblaw’s business, activities or circumstances which may impact Choice Properties, including Loblaw’s inability to make rent payments or perform its obligations under the Loblaw leases;
• failure to manage its growth effectively in accordance with its growth strategy or acquire assets on an accretive basis;
• changes in Choice Properties’ capital expenditure and fixed cost requirements;• the inability of the Partnership to make distributions or other payments or advances;• the inability of Choice Properties to obtain financing;• changes in Choice Properties’ degree of financial leverage;• changes in laws or regulatory regimes, which may affect Choice Properties, including changes in the
tax treatment of the Trust and its distributions to Unitholders or the inability of the Trust to continue to qualify as a “mutual fund trust” and as a “real estate investment trust”, as such terms are defined in the Income Tax Act (Canada); and
• changes in Choice Properties’ competitiveness in the real estate market or the unavailability of desirable commercial real estate assets.
This is not an exhaustive list of the factors that may affect Choice Properties’ forward-looking statements. Other risks and uncertainties not presently known to Choice Properties could also cause actual results or events to differ materially from those expressed in its forward-looking statements. Additional risks and uncertainties are discussed in Choice Properties’ materials filed with the Canadian securities regulatory authorities from time to time, including the “Enterprise Risks and Risk Management” section of the Management’s Discussion and Analysis of the Trust’s 2014 Second Quarter Report to Unitholders. Readers are cautioned not to place undue reliance on these forward-looking statements, which reflect Choice Properties’ expectations only as of the date of this document. Except as required by applicable law, Choice Properties does not undertake to update or revise any forward-looking statements, whether as a result of new information, future events or otherwise.
3
Forward-Looking Statements

Financials in-line with expectations– FFO and FFO/unit, in-line with the forecast for Q2
Operations on-plan– Maintained high occupancy rate – unchanged from Q1
2014 at 97.7%
Capital structure provides capacity for growth
Acquisition– Acquired a portfolio of 20 retail properties from Loblaw
for approximately $200 million, excluding transaction costs
– Immediately accretive at an implied weighted average cap rate of 6.5%
Development– Development project in Toronto was completed in the
current quarter and the tenants are expected to open for business toward the end of the summer.
– The Stoney Creek project in-process and tracking on schedule for completion later this summer.
– Construction of a Real Canadian Superstore Development in Surrey, BC continued as planned, with completion expected in the first half of 2015.
4
Q2 2014 Conference Call – Jul. 22/14
Highlights
5
Q2 2014 Conference Call – Jul. 22/14
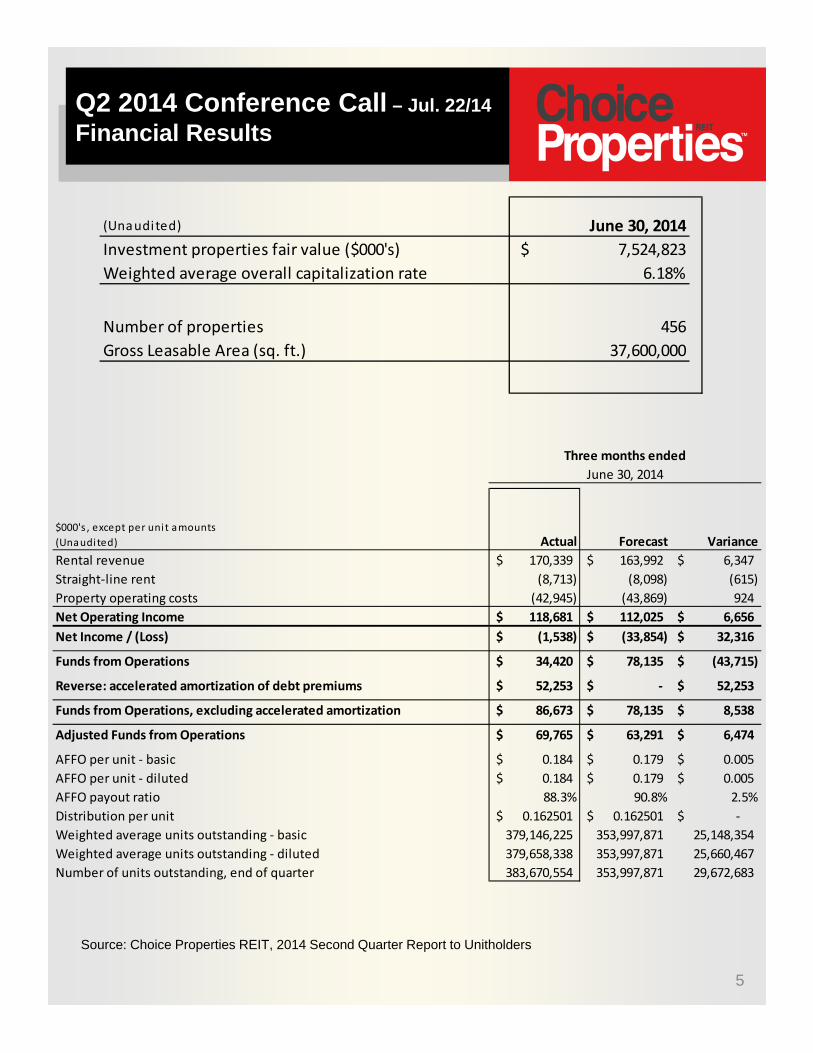
Financial Results
Source: Choice Properties REIT, 2014 Second Quarter Report to Unitholders
(Unaudited) June 30, 2014
Investment properties fair value ($000's) $ 7,524,823
Weighted average overall capitalization rate 6.18%
Number of properties 456
Gross Leasable Area (sq. ft.) 37,600,000
Actual Forecast Variance
Rental revenue 170,339$ 163,992$ 6,347$
Straight‐line rent (8,713) (8,098) (615)
Property operating costs (42,945) (43,869) 924
Net Operating Income 118,681$ 112,025$ 6,656$
Net Income / (Loss) (1,538)$ (33,854)$ 32,316$
Funds from Operations 34,420$ 78,135$ (43,715)$
Reverse: accelerated amortization of debt premiums 52,253$ ‐$ 52,253$
Funds from Operations, excluding accelerated amortization 86,673$ 78,135$ 8,538$
Adjusted Funds from Operations 69,765$ 63,291$ 6,474$
AFFO per unit ‐ basic 0.184$ 0.179$ 0.005$
AFFO per unit ‐ diluted 0.184$ 0.179$ 0.005$
AFFO payout ratio 88.3% 90.8% 2.5%
Distribution per unit 0.162501$ 0.162501$ ‐$
Weighted average units outstanding ‐ basic 379,146,225 353,997,871 25,148,354
Weighted average units outstanding ‐ diluted 379,658,338 353,997,871 25,660,467
Number of units outstanding, end of quarter 383,670,554 353,997,871 29,672,683
$000's , except per unit amounts
(Unaudited)
June 30, 2014
Three months ended
6
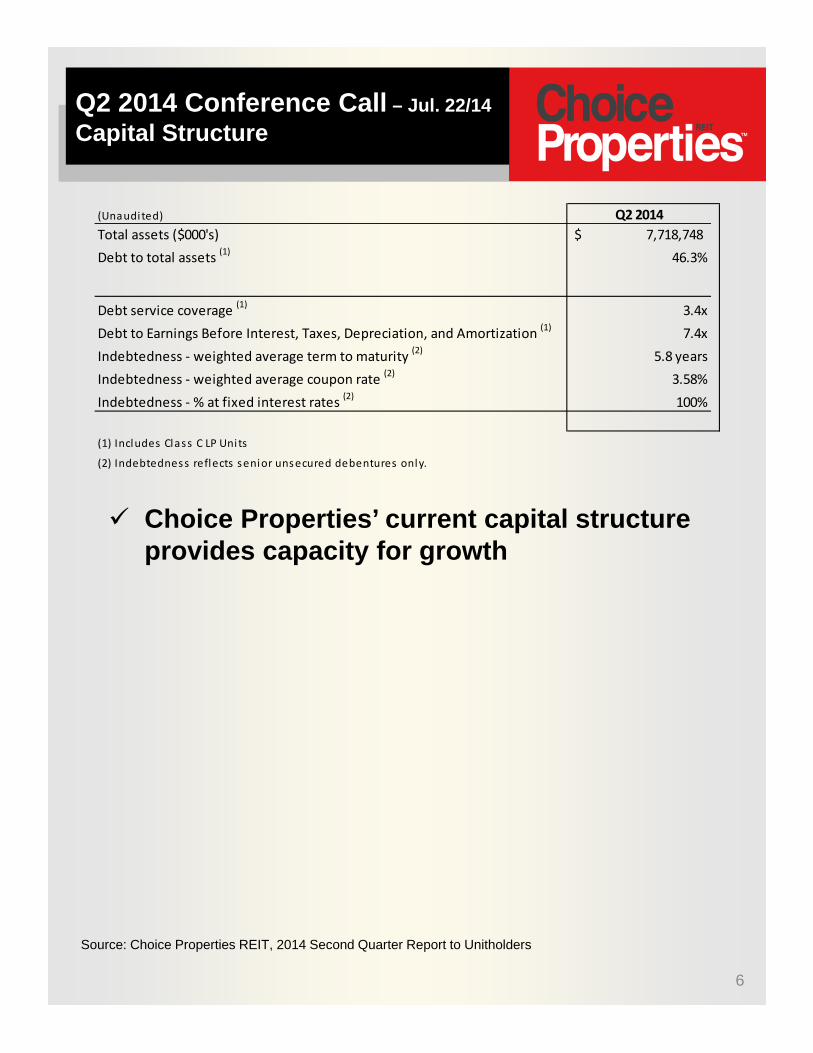
Q2 2014 Conference Call – Jul. 22/14
Capital Structure
Choice Properties’ current capital structure provides capacity for growth
Source: Choice Properties REIT, 2014 Second Quarter Report to Unitholders
(Unaudited) Q2 2014
Total assets ($000's) 7,718,748$
Debt to total assets (1)
46.3%
Debt service coverage (1)
3.4x
Debt to Earnings Before Interest, Taxes, Depreciation, and Amortization (1)
7.4x
Indebtedness ‐ weighted average term to maturity (2)
5.8 years
Indebtedness ‐ weighted average coupon rate (2)
3.58%
Indebtedness ‐ % at fixed interest rates (2)
100%
(1) Includes Class C LP Units
(2) Indebtedness reflects senior unsecured debentures only.

Management continues to maximize the return on ancillary space by renewing tenants at rental rates higher than the in-place rates
7
Q2 2014 Conference Call – Jul. 22/14
Operational Performance
Source: Choice Properties REIT, 2014 Second Quarter Report to Unitholders
Expiring GLA (sq ft) 80,982
Renewals % 96.4%
Weighted average base rent ‐ renewals (per sq ft) 12.36$
7.4%
This table excludes hold‐over tenants
Increase compared to original weighted
average base rent (per sq ft)
Q2 2014

8
Q2 2014 Conference Call – Jul. 22/14
Acquisition Activity
Location Banner Property Type GLA
62 Prince Rupert St., Stephenville, NF Dominion Multi-tenant retail 45,673
1160 Boul Louis-XIV, Charlesbourg, QC Maxi Retail 36,422
10455 Boul. Saint-Laurent, Montreal, QC Provigo Retail 17,841
227 Main St., Delhi, ON Your Independent Grocer Retail 18,344
177 Highway #108 N., Elliot Lake, ON no frills Retail 32,644
160 Main St., Hagersville, ON no frills Retail 12,213
1521 Highway 11 W., Hearst, ON Your Independent Grocer Retail 50,369
960 Hamilton Rd., London, ON no frills Retail 20,260
55 Scott St., New Liskeard, ON Your Independent Grocer Multi-tenant retail 56,642
230 George St. N., Peterborough, ON no frills Retail 35,325
780 Queen St. E., St. Mary’s, ON Your Independent Grocer Retail 38,759
10 Lower Jarvis St., Toronto, ON Loblaws and Joe Fresh Retail 78,425
5335 – 55th St., Cold Lake, AB no frills Retail 28,561
6904 – 99th St., Edmonton, AB Real Canadian Wholesale Club Multi-tenant retail and industrial 112,378
1502 Columbia Ave., Castlegar, BC no frills Multi-tenant retail 57,036
1401 Alaska Ave., Dawson Creek, BC no frills Multi-tenant retail 39,923
2155 Ferry Ave., Prince George, BC Real Canadian Superstore Retail 139,265
14650 – 104th Ave., Surrey, BC Real Canadian Superstore Retail 147,420
1578 Regent Ave. W., Winnipeg, MB Real Canadian Superstore Retail 139,695
1725 Ellice Ave., Winnipeg, MB Real Canadian Wholesale Club Multi-tenant retail 74,011
1,181,206
Purchase price of approximately $200 million
Immediately accretive at an implied cap rate of 6.50%
Development potential of approximately 20,000 –40,000 square feet
Source: Choice Properties REIT, 2014 Second Quarter Report to Unitholders

Another solid and productive quarter
2014 remainder Focus:• Development
– Three projects underway, with 2 expected to be complete in 2014
– Commence additional development projects before the end of the year
• Acquisitions– Dedicated pipeline of properties from Loblaw– Other vendors
• Shoppers Drug Mart– Opportunity to benefit from Loblaw/Shoppers Drug Mart
transaction– Potential to incorporate Shoppers Drug Mart into strategic
leasing initiatives
• Active management– Build business platform– Establish dedicated leasing and property management
functions
9
Q2 2014 Conference Call – Jul. 22/14
Summary

10
Summary Information – Q2 2014
Financial Statements
Choice Properties Real Estate Investment TrustCondensed Consolidated Balance Sheet
Source: Choice Properties REIT, 2014 Second Quarter Report to Unitholders
(in thousands of Canadian dollars) (unaudited) As at June
30, 2014 As at December
31, 2013
Assets
Non-current Assets
Investment properties (note 4) $ 7,524,823 $ 7,287,759
Accounts receivable and other assets (note 5) 6,255 7,693
7,531,078 7,295,452
Current Assets
Accounts receivable and other assets (note 5) 159,322 100,885
Assets held for sale (note 6) 13,480 —
Cash and cash equivalents 14,868 51,405
187,670 152,290
Total Assets $ 7,718,748 $ 7,447,742
Liabilities and Unitholders' Equity
Non-current Liabilities
Long term debt and Class C LP Units (note 7) $ 3,434,244 $ 3,286,442
Credit facility (note 8) 89,981 —
Exchangeable Units (note 10) 3,145,306 2,988,466
Trade payables and other liabilities (note 9) 976 379
6,670,507 6,275,287
Current Liabilities
Long term debt due within one year (note 7) — 89,725
Trade payables and other liabilities (note 9) 207,482 211,078
207,482 300,803
Total Liabilities 6,877,989 6,576,090
Unitholders’ Equity 840,759 871,652
Total Liabilities and Unitholders’ Equity $ 7,718,748 $ 7,447,742
11
Summary Information – Q2 2014
Financial Statements
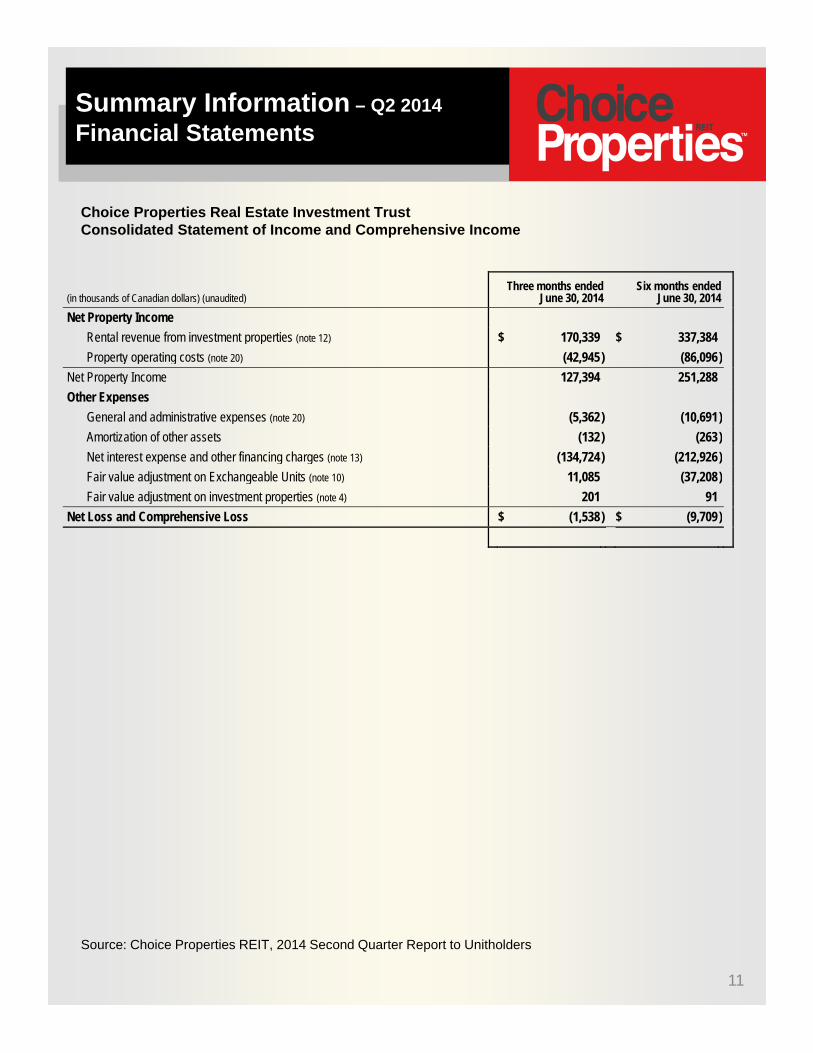
Choice Properties Real Estate Investment TrustConsolidated Statement of Income and Comprehensive Income
Source: Choice Properties REIT, 2014 Second Quarter Report to Unitholders
(in thousands of Canadian dollars) (unaudited) Three months ended
June 30, 2014 Six months ended
June 30, 2014
Net Property Income
Rental revenue from investment properties (note 12) $ 170,339 $ 337,384
Property operating costs (note 20) (42,945 ) (86,096 )
Net Property Income 127,394 251,288
Other Expenses
General and administrative expenses (note 20) (5,362 ) (10,691 )
Amortization of other assets (132 ) (263 )
Net interest expense and other financing charges (note 13) (134,724 ) (212,926 )
Fair value adjustment on Exchangeable Units (note 10) 11,085 (37,208 )
Fair value adjustment on investment properties (note 4) 201 91
Net Loss and Comprehensive Loss $ (1,538 ) $ (9,709 )

12
Summary Information – Q2 2014
Financial Statements
Choice Properties Real Estate Investment TrustConsolidated Statement of Cash Flow
Source: Choice Properties REIT, 2014 Second Quarter Report to Unitholders
(in thousands of Canadian dollars) (unaudited) Three months ended
June 30, 2014 Six months ended
June 30, 2014
Operating Activities
Net Loss $ (1,538 ) $ (9,709 )
Amortization of straight-line rent (8,713 ) (17,275 ) Amortization of tenant improvement allowances 2 452
Amortization of other assets 132 263
Net interest expense and other financing charges 134,724 212,926
Value of unit-based compensation granted (note 11) 501 830
Fair value adjustment on Exchangeable Units (11,085 ) 37,208
Fair value adjustment on investment properties (201 ) (91 )
Leasing capital expenditures (note 4) (122 ) (1,922 )
Interest received (note 13) 85 200
Net change in non-cash working capital (note 20) (27,093 ) (67,164 )
Cash Flows from Operating Activities 86,692 155,718
Investing Activities
Acquisitions of investment properties (note 3) (80,816 ) (96,555 )
Additions to investment properties (note 4) (7,132 ) (14,254 )
Additions to fixtures and equipment (196 ) (359 )
Cash Flows used in Investing Activities (88,144 ) (111,168 )
Financing Activities
Long term debt
Issued - Senior unsecured debentures net of debt placement costs (note 7) — 447,540
Retired - Transferor Notes (note 7) — (440,000 ) Credit facility net of debt placement costs (note 8) 89,981 89,981 Note receivable from related party - net (58,335 ) (24,003 ) Interest paid (13,260 ) (60,241 ) Distributions on Exchangeable Units — (73,219 ) Distributions to Unitholders (10,384 ) (21,145 ) Cash Flows from (used in) Financing Activities 8,002 (81,087 ) Change in cash and cash equivalents 6,550 (36,537 )
Cash and cash equivalents, beginning of period 8,318 51,405
Cash and Cash Equivalents, end of period $ 14,868 $ 14,868

13
Summary Information – Q2 2014
Portfolio Highlights
Source: Choice Properties REIT, 2014 Second Quarter Report to Unitholders
(Unaudi ted)
Quarter ended
June 30, 2014
Number of properties 456
Gross Leasable Area (sq. ft.) 37,600,000
Occupancy 97.7%
Remaining weighted average lease term ‐ yrs 12.40
Average base rent (per occupied sq ft) $ 14.02
$000's
Investment properties $ 7,524,823
Total assets $ 7,718,748
Debt (1) $ 6,671,271
Unitholder's Equity $ 840,759
Units outstanding (weighted average ‐ diluted) 379,658,338
FFO per unit (diluted), excl. accelerated amortization $ 0.228
AFFO per unit (diluted) $ 0.184
Distributions per unit $ 0.162501
Payout ratio (AFFO) 88.3%
(1) Includes Exchangeable Units and excludes trade payables

14
Summary Information – Q2 2014
GLA and Revenue by Province
Source: Choice Properties REIT, 2014 Second Quarter Report to Unitholders

15
Summary Information – Q2 2014
Third-Party GLA by Business Section
Source: Choice Properties REIT, 2014 Second Quarter Report to Unitholders
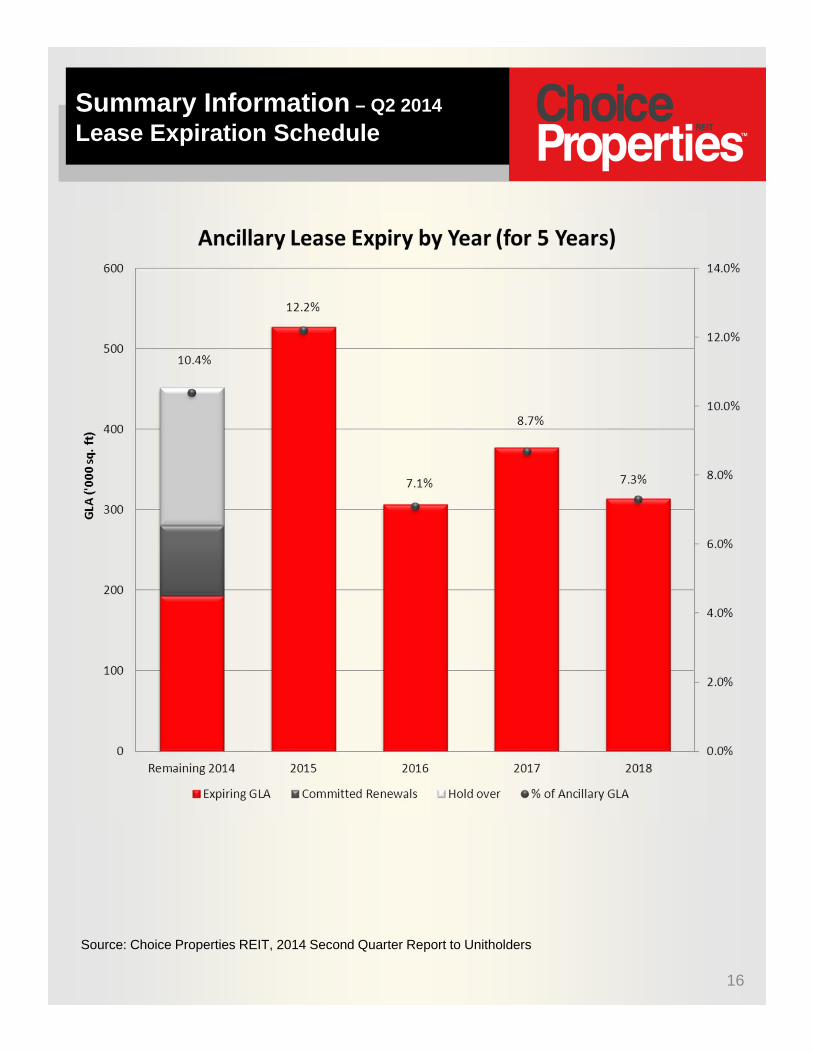
16
Summary Information – Q2 2014
Lease Expiration Schedule
Source: Choice Properties REIT, 2014 Second Quarter Report to Unitholders
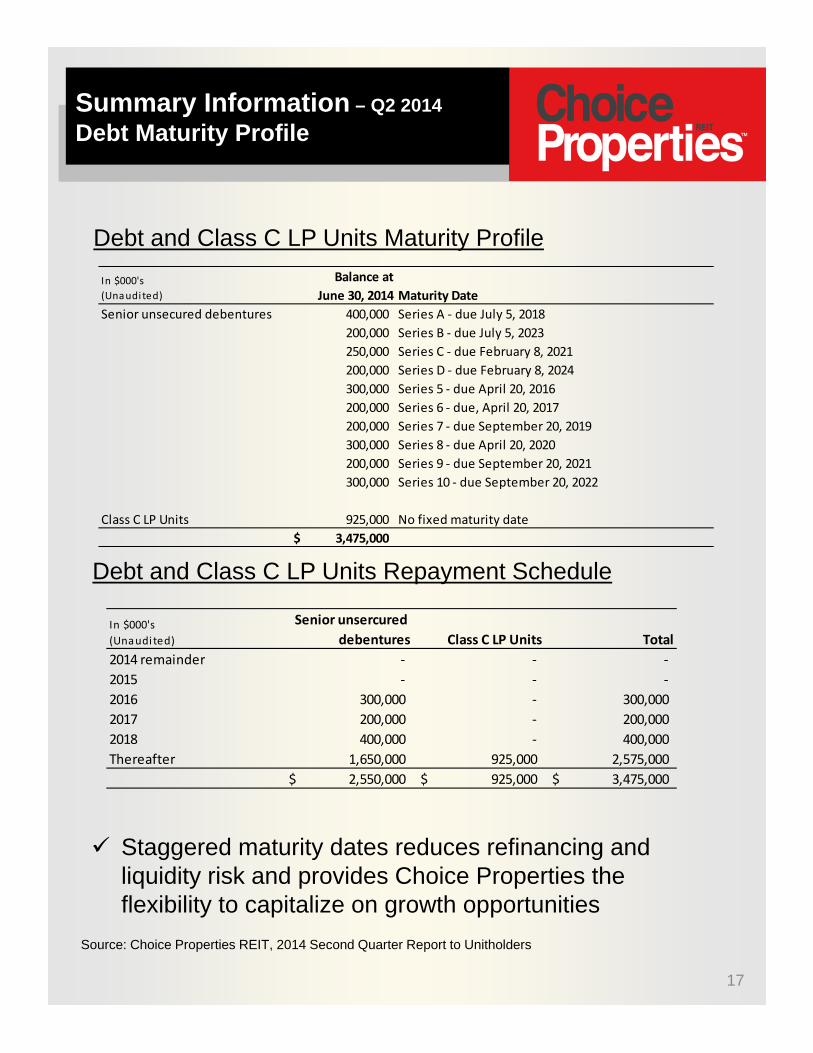
Debt and Class C LP Units Maturity Profile
17
Summary Information – Q2 2014
Debt Maturity Profile
Debt and Class C LP Units Repayment Schedule
Staggered maturity dates reduces refinancing and liquidity risk and provides Choice Properties the flexibility to capitalize on growth opportunities
Source: Choice Properties REIT, 2014 Second Quarter Report to Unitholders
Senior unsercured
debentures Class C LP Units Total
2014 remainder ‐ ‐ ‐
2015 ‐ ‐ ‐
2016 300,000 ‐ 300,000
2017 200,000 ‐ 200,000
2018 400,000 ‐ 400,000
Thereafter 1,650,000 925,000 2,575,000
2,550,000$ 925,000$ 3,475,000$
In $000's
(Unaudited)
In $000's
(Unaudited)
Balance at
June 30, 2014 Maturity Date
Senior unsecured debentures 400,000 Series A ‐ due July 5, 2018
200,000 Series B ‐ due July 5, 2023
250,000 Series C ‐ due February 8, 2021
200,000 Series D ‐ due February 8, 2024
300,000 Series 5 ‐ due April 20, 2016
200,000 Series 6 ‐ due, April 20, 2017
200,000 Series 7 ‐ due September 20, 2019
300,000 Series 8 ‐ due April 20, 2020
200,000 Series 9 ‐ due September 20, 2021
300,000 Series 10 ‐ due September 20, 2022
Class C LP Units 925,000 No fixed maturity date
3,475,000$

18
Summary Information – Q2 2014
Financial Covenants
Source: Choice Properties REIT, 2014 Second Quarter Report to Unitholders
Covenant Requirement Q2 2014
Debt to total assets Maximum ‐ 65% 46.3%(incl . Convertibe Debt and Class C LP Units )
Debt service coverage Minimum ‐ 1.5x 3.4x
Trust Indenture

19
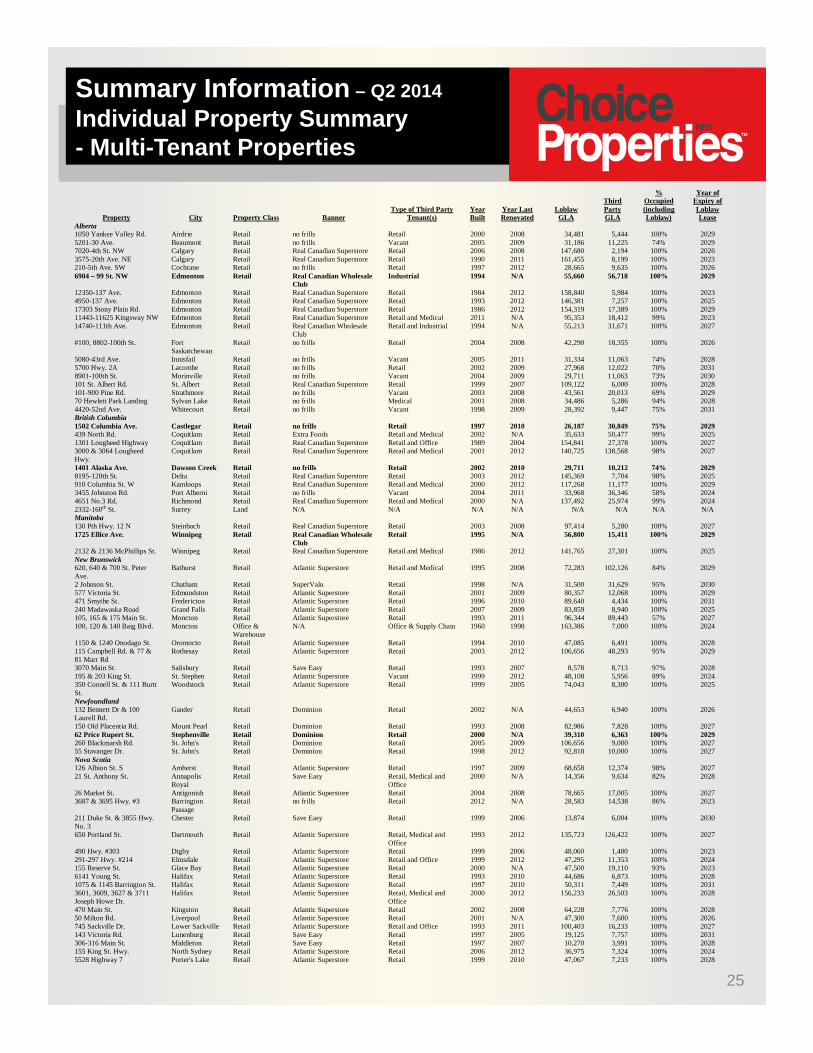
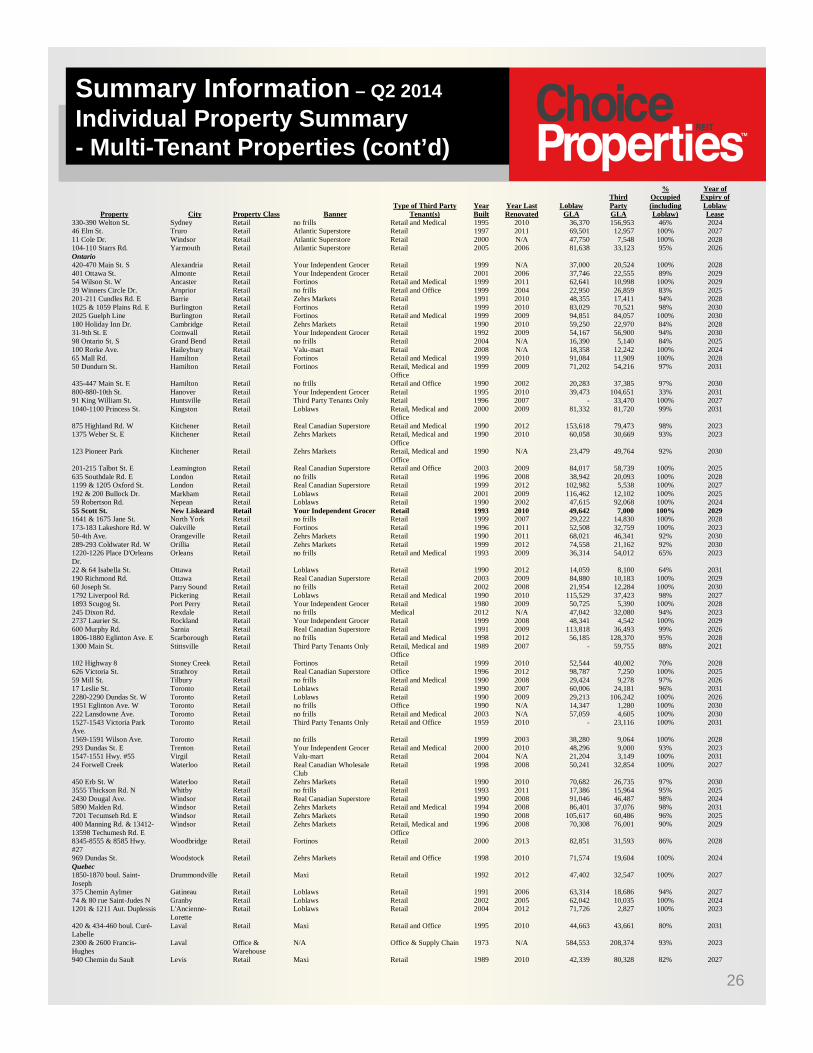
Summary Information – Q2 2014
Individual Property Summary
The tables set forth information concerning ChoiceProperties’ Properties as at June 30, 2014. The first table,“Stand-Alone Properties” summarizes all of the Propertiesthat are either a single-tenant retail, warehouse, industrialor office building or have a stand-alone store operatingunder a Loblaw-Owned Banner with no additional third-partytenants. The second table, “Multi-Tenant Properties”,summarizes each of the Properties that is anchored by astore or warehouse operating under a Loblaw-OwnedBanner and also contains one or more additional third-partytenants, as well as five properties that are not anchored by astore operating under a Loblaw-Owned Banner and a parcelof Land to be developed into a “Property With One or MoreAdditional Third-Party Tenants”.
Properties in BOLD font were acquired in the currentquarter
Source: Choice Properties REIT

20
Summary Information – Q2 2014
Individual Property Summary- Stand-Alone Properties
Property City Property
Class Banner Year Built Year Last Renovated GLA
Year of Expiry of Lease
Alberta 300 Veterans Blvd. NE Airdrie Retail Real Canadian Superstore 2005 2009 158,398 2025 55 Freeport Blvd. NE Calgary Warehouse N/A 2003 2009 499,837 2029 5858 Signal Hill Cntr SW Calgary Retail Real Canadian Superstore 1997 2009 122,147 2030 3633 Westwinds Dr. NE Calgary Retail Real Canadian Superstore 2005 2009 161,951 2025 15915 Macleod Trail SE Calgary Retail Real Canadian Superstore 1998 2012 144,531 2029 4700-130th Ave. SE Calgary Retail Real Canadian Superstore 2002 2012 151,559 2028 100 Country Village Rd. NE Calgary Retail Real Canadian Superstore 2004 2009 154,077 2028 2928-23rd St. NE Calgary Retail Real Canadian Wholesale Club 1996 N/A 50,000 2028 222-58th Ave. SE Calgary Retail Real Canadian Wholesale Club 1994 N/A 53,114 2027 7005-48th Ave. Camrose Retail Real Canadian Superstore 2001 N/A 139,498 2026 5335 – 55th St. Cold Lake Retail no frills 1999 2008 28,561 2029 4821 Calgary Trail NW Edmonton Retail Real Canadian Superstore 1984 2012 151,647 2030 9711-23rd Ave. NW Edmonton Retail Real Canadian Superstore 2000 2012 147,280 2026 4410-17th St. NW Edmonton Retail Real Canadian Superstore 2009 N/A 131,460 2023 4431-4th Ave. Edson Retail Extra Foods 1993 2003 39,123 2029 10702-83rd Ave. Grande Prairie Retail no frills 2010 N/A 33,375 2030 12225-99th St. Grande Prairie Retail Real Canadian Superstore 1993 2011 142,108 2028 1103-18 St. SE High River Retail Extra Foods 1995 2000 39,401 2028 3515 Mayor McGrath Dr. S Lethbridge Retail Real Canadian Superstore 2005 2009 164,227 2024 5031-44th St. Lloydminster Retail Real Canadian Superstore 1991 2012 108,529 2028 1792 Trans Canada Way SE Medicine Hat Retail Real Canadian Superstore 1993 2010 135,169 2024 9 Sandstone Gate Okotoks Retail no frills 1998 2008 31,084 2029 5561 Hwy. #53 Ponoka Retail Extra Foods 1995 2000 38,942 2027 15-6350-67th St. Red Deer Retail Real Canadian Wholesale Club 1997 N/A 53,089 2027 3 Clearview Market Way Red Deer Retail Your Independent Grocer 2012 N/A 32,617 2024 100-410 Baseline Rd. Sherwood Park Retail Real Canadian Superstore 1998 2010 136,180 2027 1-110 Campsite Rd. Spruce Grove Retail Real Canadian Superstore 2000 2010 134,941 2028 4734-50 Ave. Vegreville Retail no frills 2002 2007 40,093 2028 2601-14th Ave. Wainwright Retail no frills 2001 2007 39,922 2028 British Columbia 45779 Luckakuck Way Chilliwack Retail Real Canadian Superstore 1997 2010 130,022 2026 757 & 801 Ryan Rd. Courtenay Retail Real Canadian Superstore 1993 2012 102,025 2027 2100-17th St. N Cranbrook Retail Real Canadian Superstore 2003 N/A 132,090 2027 32136 Lougheed Hwy. Mission Retail Real Canadian Superstore 1997 2011 130,531 2024 6435 Metral Dr. Nanaimo Retail Real Canadian Superstore 2002 N/A 141,616 2026 2155 Ferry Ave. Prince George Retail Real Canadian Superstore 1995 N/A 139,265 2029 14650 – 104th Ave. Surrey Retail Real Canadian Superstore 2002 2011 147,420 2029 2755-190th St., 2456-188 St. & 18917-24th Ave.
Surrey Warehouse N/A 2009 N/A 407,000 2030
7550 King George Blvd. Surrey Retail Real Canadian Superstore 1990 2012 139,332 2028 3185, 3189 & 3191 Grandview Hwy.
Vancouver Retail Real Canadian Superstore 1990 2012 136,570 2027
350 SE Marine Dr. Vancouver Retail Real Canadian Superstore 1989 2011 621,177 2028 Manitoba 920 Victoria Ave. Brandon Retail Real Canadian Superstore 1992 2012 102,717 2027 15-1st Ave. NE Dauphin Retail Extra Foods 1998 2006 28,351 2024 1445 Main St. Winnipeg Retail Extra Foods 1981 2013 21,130 2023 550 Kenaston Blvd. Winnipeg Retail Real Canadian Superstore 1983 2012 86,240 2027 1578 Regent Ave. W Winnipeg Retail Real Canadian Superstore 2000 2012 139,695 2029 215 St. Anne's Rd. Winnipeg Retail Real Canadian Superstore 1981 2007 146,164 2027 1035 Gateway Rd. Winnipeg Retail Real Canadian Superstore 1981 2012 103,553 2027 80 Bison Dr. Winnipeg Retail Real Canadian Superstore 1999 2012 144,723 2029 New Brunswick 25 Savoie Ave. Atholville Retail Atlantic Superstore 2003 N/A 69,541 2031 168 Renfrew St. Dalhousie Retail Save Easy 2000 2007 13,800 2024 116 Main St. Fredericton Retail Atlantic Superstore 1995 2011 45,000 2029 408 King George Hwy. Miramichi Retail Atlantic Superstore 1994 2007 48,535 2026 520 St. George Blvd. Moncton Retail Atlantic Cash and Carry 1998 2009 20,035 2024 89 Trinity Dr. Moncton Retail Atlantic Superstore 2001 2011 89,134 2030 775 Frenette Ave. Moncton Warehouse N/A 2010 N/A 124,655 2031 85 Commerce St., RR # 4 Moncton Warehouse N/A 1995 2001 189,385 2025 52 rue Rochette Petit Rocher Retail Save Easy 2002 2007 10,800 2030 220 Main St. Plaster Rock Retail Save Easy 1999 N/A 6,500 2028 417, 425 & 429 Coverdale Rd. Riverview Retail Atlantic Superstore 1994 2011 87,799 2025 680 Somerset St. Saint John Retail Atlantic Superstore 1998 2010 51,076 2024 307 & 313 Main St. E Shediac Retail no frills 2000 2009 18,067 2023 232 Water St. & 49 Frederick St. St. Andrews Retail Save Easy 2000 2008 13,984 2029 44 Lansdowne Ave. S Sussex Retail Atlantic Superstore 2006 N/A 73,771 2025 3455 rue Principale Tracadie Retail Atlantic Superstore 2004 2012 68,594 2026 Newfoundland 166 Main Hwy. C.B.S. Retail Dominion 1994 2007 59,580 2027
21
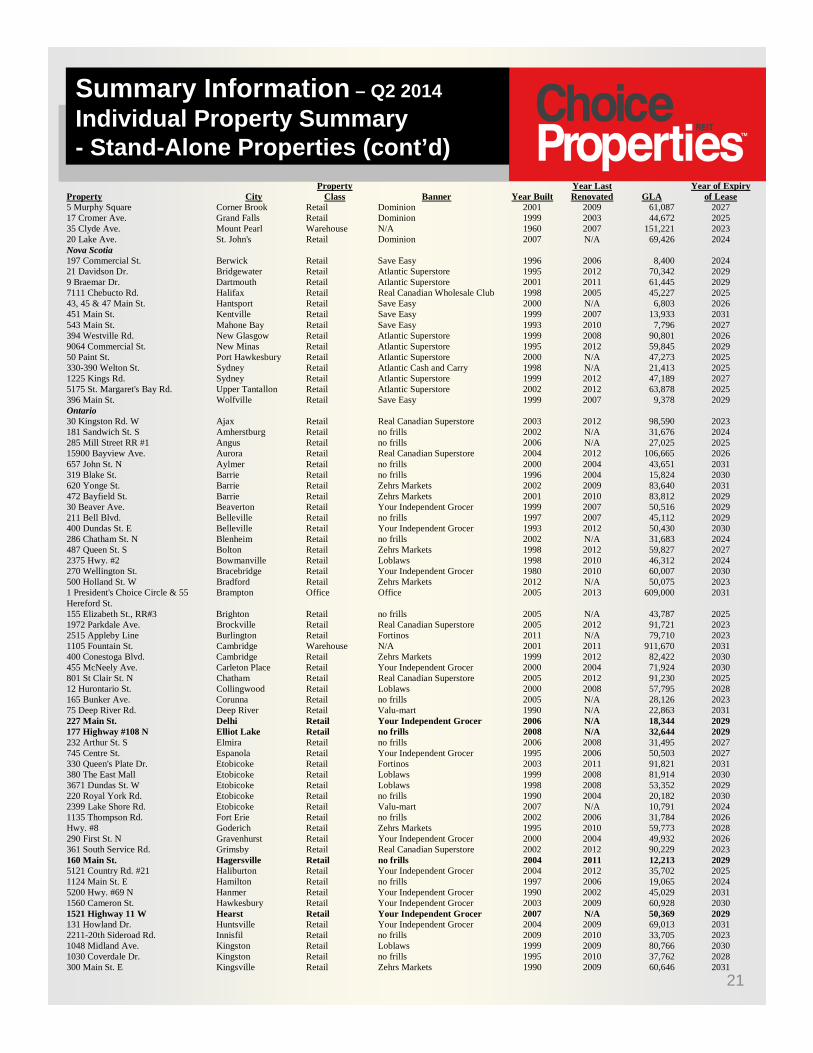
Summary Information – Q2 2014
Individual Property Summary- Stand-Alone Properties (cont’d)
Property City Property
Class Banner Year Built Year Last Renovated GLA
Year of Expiry of Lease
5 Murphy Square Corner Brook Retail Dominion 2001 2009 61,087 2027 17 Cromer Ave. Grand Falls Retail Dominion 1999 2003 44,672 2025 35 Clyde Ave. Mount Pearl Warehouse N/A 1960 2007 151,221 2023 20 Lake Ave. St. John's Retail Dominion 2007 N/A 69,426 2024 Nova Scotia 197 Commercial St. Berwick Retail Save Easy 1996 2006 8,400 2024 21 Davidson Dr. Bridgewater Retail Atlantic Superstore 1995 2012 70,342 2029 9 Braemar Dr. Dartmouth Retail Atlantic Superstore 2001 2011 61,445 2029 7111 Chebucto Rd. Halifax Retail Real Canadian Wholesale Club 1998 2005 45,227 2025 43, 45 & 47 Main St. Hantsport Retail Save Easy 2000 N/A 6,803 2026 451 Main St. Kentville Retail Save Easy 1999 2007 13,933 2031 543 Main St. Mahone Bay Retail Save Easy 1993 2010 7,796 2027 394 Westville Rd. New Glasgow Retail Atlantic Superstore 1999 2008 90,801 2026 9064 Commercial St. New Minas Retail Atlantic Superstore 1995 2012 59,845 2029 50 Paint St. Port Hawkesbury Retail Atlantic Superstore 2000 N/A 47,273 2025 330-390 Welton St. Sydney Retail Atlantic Cash and Carry 1998 N/A 21,413 2025 1225 Kings Rd. Sydney Retail Atlantic Superstore 1999 2012 47,189 2027 5175 St. Margaret's Bay Rd. Upper Tantallon Retail Atlantic Superstore 2002 2012 63,878 2025 396 Main St. Wolfville Retail Save Easy 1999 2007 9,378 2029 Ontario 30 Kingston Rd. W Ajax Retail Real Canadian Superstore 2003 2012 98,590 2023 181 Sandwich St. S Amherstburg Retail no frills 2002 N/A 31,676 2024 285 Mill Street RR #1 Angus Retail no frills 2006 N/A 27,025 2025 15900 Bayview Ave. Aurora Retail Real Canadian Superstore 2004 2012 106,665 2026 657 John St. N Aylmer Retail no frills 2000 2004 43,651 2031 319 Blake St. Barrie Retail no frills 1996 2004 15,824 2030 620 Yonge St. Barrie Retail Zehrs Markets 2002 2009 83,640 2031 472 Bayfield St. Barrie Retail Zehrs Markets 2001 2010 83,812 2029 30 Beaver Ave. Beaverton Retail Your Independent Grocer 1999 2007 50,516 2029 211 Bell Blvd. Belleville Retail no frills 1997 2007 45,112 2029 400 Dundas St. E Belleville Retail Your Independent Grocer 1993 2012 50,430 2030 286 Chatham St. N Blenheim Retail no frills 2002 N/A 31,683 2024 487 Queen St. S Bolton Retail Zehrs Markets 1998 2012 59,827 2027 2375 Hwy. #2 Bowmanville Retail Loblaws 1998 2010 46,312 2024 270 Wellington St. Bracebridge Retail Your Independent Grocer 1980 2010 60,007 2030 500 Holland St. W Bradford Retail Zehrs Markets 2012 N/A 50,075 2023 1 President's Choice Circle & 55 Hereford St.
Brampton Office Office 2005 2013 609,000 2031
155 Elizabeth St., RR#3 Brighton Retail no frills 2005 N/A 43,787 20251972 Parkdale Ave. Brockville Retail Real Canadian Superstore 2005 2012 91,721 2023 2515 Appleby Line Burlington Retail Fortinos 2011 N/A 79,710 2023 1105 Fountain St. Cambridge Warehouse N/A 2001 2011 911,670 2031 400 Conestoga Blvd. Cambridge Retail Zehrs Markets 1999 2012 82,422 2030 455 McNeely Ave. Carleton Place Retail Your Independent Grocer 2000 2004 71,924 2030 801 St Clair St. N Chatham Retail Real Canadian Superstore 2005 2012 91,230 2025 12 Hurontario St. Collingwood Retail Loblaws 2000 2008 57,795 2028 165 Bunker Ave. Corunna Retail no frills 2005 N/A 28,126 2023 75 Deep River Rd. Deep River Retail Valu-mart 1990 N/A 22,863 2031 227 Main St. Delhi Retail Your Independent Grocer 2006 N/A 18,344 2029 177 Highway #108 N Elliot Lake Retail no frills 2008 N/A 32,644 2029 232 Arthur St. S Elmira Retail no frills 2006 2008 31,495 2027 745 Centre St. Espanola Retail Your Independent Grocer 1995 2006 50,503 2027 330 Queen's Plate Dr. Etobicoke Retail Fortinos 2003 2011 91,821 2031 380 The East Mall Etobicoke Retail Loblaws 1999 2008 81,914 2030 3671 Dundas St. W Etobicoke Retail Loblaws 1998 2008 53,352 2029 220 Royal York Rd. Etobicoke Retail no frills 1990 2004 20,182 2030 2399 Lake Shore Rd. Etobicoke Retail Valu-mart 2007 N/A 10,791 2024 1135 Thompson Rd. Fort Erie Retail no frills 2002 2006 31,784 2026 Hwy. #8 Goderich Retail Zehrs Markets 1995 2010 59,773 2028 290 First St. N Gravenhurst Retail Your Independent Grocer 2000 2004 49,932 2026 361 South Service Rd. Grimsby Retail Real Canadian Superstore 2002 2012 90,229 2023 160 Main St. Hagersville Retail no frills 2004 2011 12,213 2029 5121 Country Rd. #21 Haliburton Retail Your Independent Grocer 2004 2012 35,702 2025 1124 Main St. E Hamilton Retail no frills 1997 2006 19,065 2024 5200 Hwy. #69 N Hanmer Retail Your Independent Grocer 1990 2002 45,029 2031 1560 Cameron St. Hawkesbury Retail Your Independent Grocer 2003 2009 60,928 2030 1521 Highway 11 W Hearst Retail Your Independent Grocer 2007 N/A 50,369 2029 131 Howland Dr. Huntsville Retail Your Independent Grocer 2004 2009 69,013 2031 2211-20th Sideroad Rd. Innisfil Retail no frills 2009 2010 33,705 2023 1048 Midland Ave. Kingston Retail Loblaws 1999 2009 80,766 2030 1030 Coverdale Dr. Kingston Retail no frills 1995 2010 37,762 2028 300 Main St. E Kingsville Retail Zehrs Markets 1990 2009 60,646 2031
22
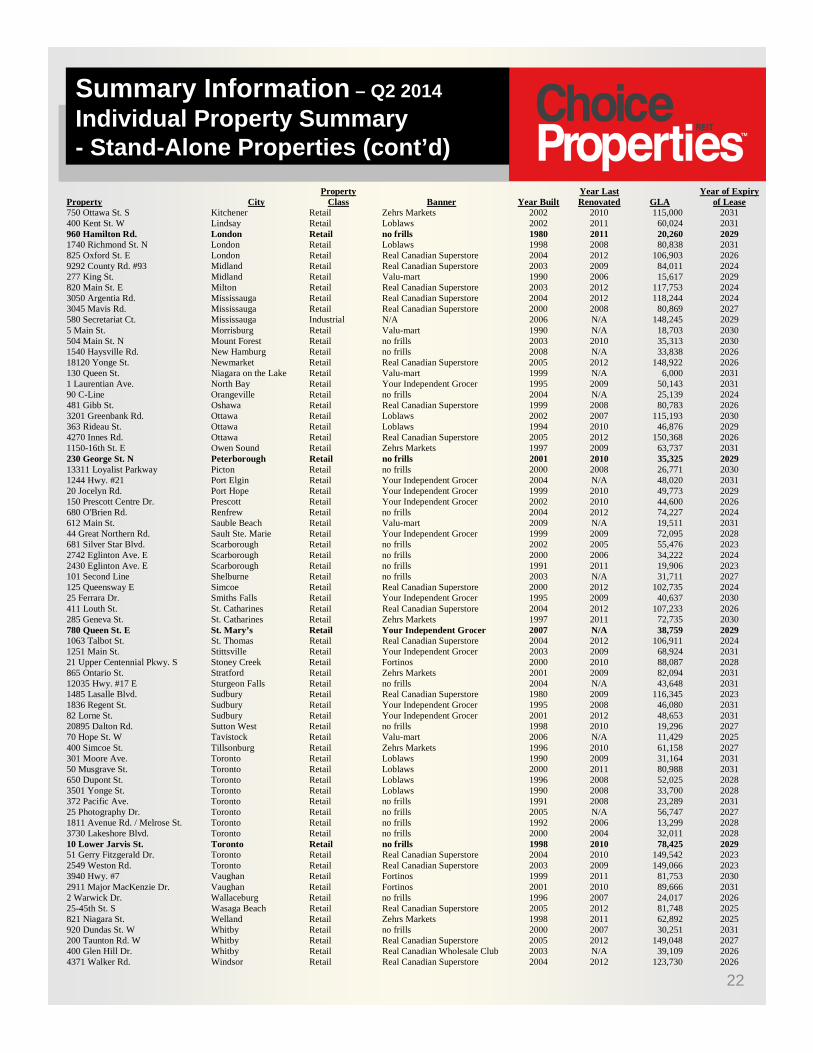
Summary Information – Q2 2014
Individual Property Summary- Stand-Alone Properties (cont’d)
Property City Property
Class Banner Year Built Year Last Renovated GLA
Year of Expiry of Lease
750 Ottawa St. S Kitchener Retail Zehrs Markets 2002 2010 115,000 2031 400 Kent St. W Lindsay Retail Loblaws 2002 2011 60,024 2031 960 Hamilton Rd. London Retail no frills 1980 2011 20,260 2029 1740 Richmond St. N London Retail Loblaws 1998 2008 80,838 2031 825 Oxford St. E London Retail Real Canadian Superstore 2004 2012 106,903 2026 9292 County Rd. #93 Midland Retail Real Canadian Superstore 2003 2009 84,011 2024 277 King St. Midland Retail Valu-mart 1990 2006 15,617 2029 820 Main St. E Milton Retail Real Canadian Superstore 2003 2012 117,753 2024 3050 Argentia Rd. Mississauga Retail Real Canadian Superstore 2004 2012 118,244 2024 3045 Mavis Rd. Mississauga Retail Real Canadian Superstore 2000 2008 80,869 2027 580 Secretariat Ct. Mississauga Industrial N/A 2006 N/A 148,245 2029 5 Main St. Morrisburg Retail Valu-mart 1990 N/A 18,703 2030 504 Main St. N Mount Forest Retail no frills 2003 2010 35,313 2030 1540 Haysville Rd. New Hamburg Retail no frills 2008 N/A 33,838 2026 18120 Yonge St. Newmarket Retail Real Canadian Superstore 2005 2012 148,922 2026 130 Queen St. Niagara on the Lake Retail Valu-mart 1999 N/A 6,000 2031 1 Laurentian Ave. North Bay Retail Your Independent Grocer 1995 2009 50,143 2031 90 C-Line Orangeville Retail no frills 2004 N/A 25,139 2024 481 Gibb St. Oshawa Retail Real Canadian Superstore 1999 2008 80,783 2026 3201 Greenbank Rd. Ottawa Retail Loblaws 2002 2007 115,193 2030 363 Rideau St. Ottawa Retail Loblaws 1994 2010 46,876 2029 4270 Innes Rd. Ottawa Retail Real Canadian Superstore 2005 2012 150,368 2026 1150-16th St. E Owen Sound Retail Zehrs Markets 1997 2009 63,737 2031 230 George St. N Peterborough Retail no frills 2001 2010 35,325 2029 13311 Loyalist Parkway Picton Retail no frills 2000 2008 26,771 2030 1244 Hwy. #21 Port Elgin Retail Your Independent Grocer 2004 N/A 48,020 2031 20 Jocelyn Rd. Port Hope Retail Your Independent Grocer 1999 2010 49,773 2029 150 Prescott Centre Dr. Prescott Retail Your Independent Grocer 2002 2010 44,600 2026 680 O'Brien Rd. Renfrew Retail no frills 2004 2012 74,227 2024 612 Main St. Sauble Beach Retail Valu-mart 2009 N/A 19,511 2031 44 Great Northern Rd. Sault Ste. Marie Retail Your Independent Grocer 1999 2009 72,095 2028 681 Silver Star Blvd. Scarborough Retail no frills 2002 2005 55,476 2023 2742 Eglinton Ave. E Scarborough Retail no frills 2000 2006 34,222 2024 2430 Eglinton Ave. E Scarborough Retail no frills 1991 2011 19,906 2023 101 Second Line Shelburne Retail no frills 2003 N/A 31,711 2027 125 Queensway E Simcoe Retail Real Canadian Superstore 2000 2012 102,735 2024 25 Ferrara Dr. Smiths Falls Retail Your Independent Grocer 1995 2009 40,637 2030 411 Louth St. St. Catharines Retail Real Canadian Superstore 2004 2012 107,233 2026 285 Geneva St. St. Catharines Retail Zehrs Markets 1997 2011 72,735 2030 780 Queen St. E St. Mary’s Retail Your Independent Grocer 2007 N/A 38,759 2029 1063 Talbot St. St. Thomas Retail Real Canadian Superstore 2004 2012 106,911 2024 1251 Main St. Stittsville Retail Your Independent Grocer 2003 2009 68,924 2031 21 Upper Centennial Pkwy. S Stoney Creek Retail Fortinos 2000 2010 88,087 2028865 Ontario St. Stratford Retail Zehrs Markets 2001 2009 82,094 203112035 Hwy. #17 E Sturgeon Falls Retail no frills 2004 N/A 43,648 20311485 Lasalle Blvd. Sudbury Retail Real Canadian Superstore 1980 2009 116,345 2023 1836 Regent St. Sudbury Retail Your Independent Grocer 1995 2008 46,080 2031 82 Lorne St. Sudbury Retail Your Independent Grocer 2001 2012 48,653 2031 20895 Dalton Rd. Sutton West Retail no frills 1998 2010 19,296 2027 70 Hope St. W Tavistock Retail Valu-mart 2006 N/A 11,429 2025 400 Simcoe St. Tillsonburg Retail Zehrs Markets 1996 2010 61,158 2027 301 Moore Ave. Toronto Retail Loblaws 1990 2009 31,164 2031 50 Musgrave St. Toronto Retail Loblaws 2000 2011 80,988 2031 650 Dupont St. Toronto Retail Loblaws 1996 2008 52,025 2028 3501 Yonge St. Toronto Retail Loblaws 1990 2008 33,700 2028 372 Pacific Ave. Toronto Retail no frills 1991 2008 23,289 2031 25 Photography Dr. Toronto Retail no frills 2005 N/A 56,747 2027 1811 Avenue Rd. / Melrose St. Toronto Retail no frills 1992 2006 13,299 2028 3730 Lakeshore Blvd. Toronto Retail no frills 2000 2004 32,011 2028 10 Lower Jarvis St. Toronto Retail no frills 1998 2010 78,425 2029 51 Gerry Fitzgerald Dr. Toronto Retail Real Canadian Superstore 2004 2010 149,542 2023 2549 Weston Rd. Toronto Retail Real Canadian Superstore 2003 2009 149,066 2023 3940 Hwy. #7 Vaughan Retail Fortinos 1999 2011 81,753 2030 2911 Major MacKenzie Dr. Vaughan Retail Fortinos 2001 2010 89,666 2031 2 Warwick Dr. Wallaceburg Retail no frills 1996 2007 24,017 2026 25-45th St. S Wasaga Beach Retail Real Canadian Superstore 2005 2012 81,748 2025 821 Niagara St. Welland Retail Zehrs Markets 1998 2011 62,892 2025 920 Dundas St. W Whitby Retail no frills 2000 2007 30,251 2031 200 Taunton Rd. W Whitby Retail Real Canadian Superstore 2005 2012 149,048 2027 400 Glen Hill Dr. Whitby Retail Real Canadian Wholesale Club 2003 N/A 39,109 2026 4371 Walker Rd. Windsor Retail Real Canadian Superstore 2004 2012 123,730 2026

23
Summary Information – Q2 2014
Individual Property Summary- Stand-Alone Properties (cont’d)
Property City Property
Class Banner Year Built Year Last Renovated GLA
Year of Expiry of Lease
Prince Edward Island 461-465 University Ave. Charlottetown Retail Atlantic Superstore 2000 2011 83,113 2029 509 Main St. Montague Retail Atlantic Superstore 2000 2007 39,310 2029 535 Granville St. Summerside Retail Atlantic Superstore 2002 2011 80,146 2029 Quebec 845 Ave. du Pont N Alma Retail Maxi 1992 2006 26,734 2026 472-4 ième rue E Amos Retail Maxi 2003 2008 43,521 2028 30 rue Racine Baie-Saint-Paul Retail Maxi 1997 2003 14,033 2023 175 boul. Sir-Wilfrid-Laurier Beloeil Retail Maxi 1997 2006 36,433 2026 1601 boul. de Pèrigny & 248 & 250 Ostiguy
Chambly Retail Maxi 2001 2012 47,944 2025
1160 boul. Louis-XIV Charlesbourg Retail Maxi 1990 2005 36,442 2029 114 boul. Saint Jean-Baptiste Chateauguay Retail Maxi 1984 2010 54,218 2027 885-3E rue Chibougamau Retail Maxi 2005 2006 36,774 2029 235 Route 338 Coteau-du-Lac Retail Provigo 2007 N/A 24,316 2024 1122-1128 rue du Sud Cowansville Retail Loblaws 2002 2005 51,998 2023 224 boul. Saint-Michel Dolbeau-Mistassini Retail Provigo 2000 N/A 27,849 2026 482 Route 138 Donnaconna Retail Maxi 2005 2010 37,756 2024 325-335 boul. Saint-Joseph Drummondville Retail Loblaws 2003 2007 67,491 2024 1 boul. Du Plateau Gatineau Retail Loblaws 1997 2009 127,582 2030 300 boul. Saint-Joseph Gatineau Retail Maxi 1994 2010 55,770 2026 130 Ave. Lépine Gatineau Retail Maxi & Cie 1997 2010 58,518 2031 85 rue Adrien-Robert Gatineau Retail Presto 2000 2002 22,523 2025 16900 Aut. Trans-Canada Kirkland Retail Provigo 2000 2009 82,680 2025 355 & 367 rue Principale Lachute Retail Maxi 2003 2010 45,668 2027 3500 rue Laval Lac-Mégantic Retail Maxi 2003 2010 43,506 2024 1950 boul. De La Concorde E Laval Retail Loblaws 1997 2002 82,223 2023 8475 rue Chartrand Laval Retail Maxi 2003 2006 35,339 2027 2090 boul. Des Laurentides Laval Retail Maxi & Cie 2000 2010 97,344 2025 3500 Saint-Martin O Laval Retail Maxi & Cie 1999 2009 73,740 2024 53-57 Place Quevillon Lebel-Sur-Quevillon Retail Provigo 1996 N/A 10,879 2029 1150 rue King-George Longueuil Retail Loblaws 1998 2010 78,219 2023 1350 rue Sherbrooke Magog Retail Loblaws 1996 2004 71,918 2026 170 rue Principale S Maniwaki Retail Maxi 2004 2012 42,979 2028 6767 boul. Newman Montreal Retail Loblaws 1999 2010 79,880 2025 3000-3100 rue Wellington Montreal Retail Maxi 1998 2010 35,279 2026 1757 boul. Marcel-Laurin Montreal Retail Maxi & Cie 1998 2010 80,331 2025 375 rue Jean-Talon O Montréal Retail Loblaws 1999 2012 77,583 20236600 rue Saint-Jacques Montréal Retail Loblaws 2002 2012 81,492 2024800 boul. Henri-Bourassa O Montréal Retail Loblaws 2002 2004 81,307 2023 2535 rue Masson Montréal Retail Maxi 1995 2006 29,638 2028 7605 Maurice-Duplessis Montréal Retail Maxi & Cie 2002 2010 75,856 2024 6825 Chemin de la Côte-des-Neiges
Montréal Retail Maxi & Cie 1998 2012 83,030 2024
50 Ave. du Mont-Royal O Montréal Retail Provigo 2002 2009 36,234 2030 8570 boul. Saint-Laurent Montréal Retail Provigo 1990 2001 17,930 2024 10455 boul. Saint-Laurent Montréal Retail Provido 1986 2005 17,841 2029 3175-3185 rue Beaubien E Montréal Retail Provigo 2001 2002 14,939 2023 390 Route 117 Mont-Tremblant Retail Maxi 1996 2007 33,822 2024 90-92 boul. Cardinal-Léger Pincourt Retail Maxi & Cie 2000 2010 97,502 2028 1877 rue Bilodeau Plessisville Retail Maxi 1996 2006 24,995 2025 815-819 Ave. Myrand Quebebc Retail Provigo 1986 2004 14,312 2028 4535-4545 boul. Henri-Bourassa Quebec Retail Loblaws 2002 2009 104,718 2023 491 rue Seigneuriale Quebec Retail Provigo 2001 2002 21,303 2024 350 rue Bouvier Québec Retail Maxi 2001 2012 46,718 2026 2225-2235 1ère Ave. Québec Retail Provigo 1990 2002 18,348 2024 3397-3399 rue Queen Rawdon Retail Maxi 2006 N/A 30,465 2023 86 boul. Brien Repentigny Retail Loblaws 2001 2004 101,295 2023 150 Ave. Saint-Alphonse Roberval Retail Maxi 2004 2006 43,378 2025 1074 Ave. Larivière Rouyn-Noranda Retail Maxi 2005 2008 36,629 2023 180 boul. Barrette Saguenay Retail Maxi 1995 2010 52,674 2025 2460 rue Cantin Saguenay Retail Presto 2000 2003 24,175 2025 2501 boul. Du Millénaire Saint-Basile-le-Grand Retail Maxi 2005 N/A 34,807 2024 1400 rue Roberval Saint-Bruno-de-
Montarville Retail Loblaws 1986 2004 53,610 2024
2840 boul. Des Promenades Sainte-Marthe-Sur-Le-Lac
Retail Maxi 2000 2006 35,552 2025
2000 boul. Casavant O Saint-Hyacinthe Retail Loblaws 2001 2004 64,303 2025 200 boul. Omer-Marcil Saint-Jean-Richelieu Retail Maxi & Cie 1998 2010 79,806 2027 1095 Saint-Isidore Saint-Lin-Laurentides Retail Provigo 2002 N/A 44,085 2024 150 rue Des Grandes-Fourches S Sherbrooke Retail Maxi 2001 2012 47,452 2027 3025 boul. De Portland Sherbrooke Retail Maxi & Cie 2000 2010 87,914 2030

24
Summary Information – Q2 2014
Individual Property Summary- Stand-Alone Properties (cont’d)
Property City Property
Class Banner Year Built Year Last Renovated GLA
Year of Expiry of Lease
169 rue Queen & 2 rue Speid Sherbrooke Retail Provigo 1999 N/A 16,383 2030 1100-13E Ave. N Sherbrooke Retail Provigo 1987 2007 28,447 2027 50 rue Victoria Sorel-Tracy Retail Provigo 1999 N/A 15,523 2025 8200 boul. Lacroix St-Georges Retail Maxi 2002 2012 52,133 2026 301 Chemin Kipawa Temiscaming Retail Provigo 1996 N/A 8,112 2028 2260 Chemin Gascon Terrebonne Retail Maxi 1992 2003 24,816 2024 390 Montée des Pionniers Terrebonne Retail Maxi 2004 2007 34,885 2023 7201 boul. Laurier Terrebonne Retail Maxi 2002 2012 35,572 2027 3725 boul. Des Forges Trois-Rivières Retail Loblaws 2003 N/A 66,279 2023 2332 boul. Barette Val D'Or Retail Loblaws 2001 2004 51,978 2024 60 rue Carignan Victoriaville Retail Loblaws 1986 2002 67,079 2024 118-120 boul. Arthabaska O Victoriaville Retail Maxi 2004 2010 42,910 2027 100 rue Des Oblats N Ville-Marie Retail Provigo 2005 N/A 24,483 2031 295 rue Saint-Georges Windsor Retail Provigo 2006 N/A 24,146 2026 Saskatchewan 30 Thatcher Dr. E Moose Jaw Retail Real Canadian Superstore 1995 2005 127,792 2027 591-15th St. E Prince Albert Retail Real Canadian Superstore 1992 2012 100,954 20292101 Fleming Rd. Regina Warehouse N/A 2011 2012 1,029,675 2028 2055 Prince of Wales Dr. Regina Retail Real Canadian Superstore 2000 2011 142,021 2029 4450 Rochdale Blvd. Regina Retail Real Canadian Superstore 2000 2011 142,021 2028 921 Broad St. Regina Retail Real Canadian Wholesale Club 1992 N/A 55,792 2027 1501 North Service Rd. E Swift Current Retail Real Canadian Wholesale Club 1999 N/A 51,241 2027 115 Souris Ave. NW Weyburn Retail Real Canadian Wholesale Club 1999 N/A 51,321 2031 Total 22,496,000
25
Summary Information – Q2 2014
Individual Property Summary- Multi-Tenant Properties
Property City Property Class Banner Type of Third Party
Tenant(s) Year Built
Year Last Renovated
Loblaw GLA
Third Party GLA
% Occupied (including Loblaw)
Year of Expiry of Loblaw Lease
Alberta 1050 Yankee Valley Rd. Airdrie Retail no frills Retail 2000 2008 34,481 5,444 100% 2029 5201-30 Ave. Beaumont Retail no frills Vacant 2005 2009 31,186 11,225 74% 2029 7020-4th St. NW Calgary Retail Real Canadian Superstore Retail 2006 2008 147,680 2,194 100% 2026 3575-20th Ave. NE Calgary Retail Real Canadian Superstore Retail 1990 2011 161,455 8,199 100% 2023 210-5th Ave. SW Cochrane Retail no frills Retail 1997 2012 28,665 9,635 100% 2026 6904 – 99 St. NW Edmonton Retail Real Canadian Wholesale
Club Industrial 1994 N/A 55,660 56,718 100% 2029
12350-137 Ave. Edmonton Retail Real Canadian Superstore Retail 1984 2012 158,840 5,984 100% 2023 4950-137 Ave. Edmonton Retail Real Canadian Superstore Retail 1993 2012 146,381 7,257 100% 2025 17303 Stony Plain Rd. Edmonton Retail Real Canadian Superstore Retail 1986 2012 154,319 17,389 100% 2029 11443-11625 Kingsway NW Edmonton Retail Real Canadian Superstore Retail and Medical 2011 N/A 95,353 18,412 99% 2023 14740-111th Ave. Edmonton Retail Real Canadian Wholesale
Club Retail and Industrial 1994 N/A 55,213 31,671 100% 2027
#100, 8802-100th St. Fort Saskatchewan
Retail no frills Retail 2004 2008 42,290 18,355 100% 2026
5080-43rd Ave. Innisfail Retail no frills Vacant 2005 2011 31,334 11,063 74% 2028 5700 Hwy. 2A Lacombe Retail no frills Retail 2002 2009 27,968 12,022 70% 2031 8901-100th St. Morinville Retail no frills Vacant 2004 2009 29,711 11,063 73% 2030 101 St. Albert Rd. St. Albert Retail Real Canadian Superstore Retail 1999 2007 109,122 6,000 100% 2028 101-900 Pine Rd. Strathmore Retail no frills Vacant 2003 2008 43,561 20,013 69% 2029 70 Hewlett Park Landing Sylvan Lake Retail no frills Medical 2001 2008 34,486 5,286 94% 2028 4420-52nd Ave. Whitecourt Retail no frills Vacant 1998 2009 28,392 9,447 75% 2031 British Columbia 1502 Columbia Ave. Castlegar Retail no frills Retail 1997 2010 26,187 30,849 75% 2029 439 North Rd. Coquitlam Retail Extra Foods Retail and Medical 2002 N/A 35,633 50,477 99% 2025 1301 Lougheed Highway Coquitlam Retail Real Canadian Superstore Retail and Office 1989 2004 154,841 27,378 100% 2027 3000 & 3064 Lougheed Hwy.
Coquitlam Retail Real Canadian Superstore Retail and Medical 2001 2012 140,725 138,568 98% 2027
1401 Alaska Ave. Dawson Creek Retail no frills Retail 2002 2010 29,711 10,212 74% 2029 8195-120th St. Delta Retail Real Canadian Superstore Retail 2003 2012 145,369 7,704 98% 2025 910 Columbia St. W Kamloops Retail Real Canadian Superstore Retail and Medical 2000 2012 117,268 11,177 100% 2029 3455 Johnston Rd. Port Alberni Retail no frills Vacant 2004 2011 33,968 36,346 58% 2024 4651 No.3 Rd. Richmond Retail Real Canadian Superstore Retail and Medical 2000 N/A 137,492 25,974 99% 2024 2332-160th St. Surrey Land N/A N/A N/A N/A N/A N/A N/A N/A Manitoba 130 Pth Hwy. 12 N Steinbach Retail Real Canadian Superstore Retail 2003 2008 97,414 5,280 100% 2027 1725 Ellice Ave. Winnipeg Retail Real Canadian Wholesale
Club Retail 1995 N/A 56,800 15,411 100% 2029
2132 & 2136 McPhillips St. Winnipeg Retail Real Canadian Superstore Retail and Medical 1986 2012 141,765 27,301 100% 2025 New Brunswick 620, 640 & 700 St. Peter Ave.
Bathurst Retail Atlantic Superstore Retail and Medical 1995 2008 72,283 102,126 84% 2029
2 Johnson St. Chatham Retail SuperValu Retail 1998 N/A 31,500 31,629 95% 2030 577 Victoria St. Edmundston Retail Atlantic Superstore Retail 2001 2009 80,357 12,068 100% 2029 471 Smythe St. Fredericton Retail Atlantic Superstore Retail 1996 2010 89,640 4,434 100% 2031 240 Madawaska Road Grand Falls Retail Atlantic Superstore Retail 2007 2009 83,859 8,940 100% 2025 105, 165 & 175 Main St. Moncton Retail Atlantic Superstore Retail 1993 2011 96,344 89,443 57% 2027 100, 120 & 140 Baig Blvd. Moncton Office &
Warehouse N/A Office & Supply Chain 1960 1998 163,386 7,000 100% 2024
1150 & 1240 Onodago St. Oromocto Retail Atlantic Superstore Retail 1994 2010 47,085 6,491 100% 2028 115 Campbell Rd. & 77 & 81 Marr Rd
Rothesay Retail Atlantic Superstore Retail 2003 2012 106,656 48,293 95% 2029
3070 Main St. Salisbury Retail Save Easy Retail 1993 2007 8,578 8,713 97% 2028 195 & 203 King St. St. Stephen Retail Atlantic Superstore Vacant 1999 2012 48,108 5,956 89% 2024 350 Connell St. & 111 Burtt St.
Woodstock Retail Atlantic Superstore Retail 1999 2005 74,043 8,300 100% 2025
Newfoundland 132 Bennett Dr & 100 Laurell Rd.
Gander Retail Dominion Retail 2002 N/A 44,653 6,940 100% 2026
150 Old Placentia Rd. Mount Pearl Retail Dominion Retail 1993 2008 82,986 7,828 100% 2027 62 Price Rupert St. Stephenville Retail Dominion Retail 2000 N/A 39,310 6,363 100% 2029 260 Blackmarsh Rd. St. John's Retail Dominion Retail 2005 2009 106,656 9,000 100% 2027 55 Stavanger Dr. St. John's Retail Dominion Retail 1998 2012 92,818 10,000 100% 2027 Nova Scotia 126 Albion St. S Amherst Retail Atlantic Superstore Retail 1997 2009 68,658 12,374 98% 2027 21 St. Anthony St. Annapolis
Royal Retail Save Easy Retail, Medical and
Office 2000 N/A 14,356 9,634 82% 2028
26 Market St. Antigonish Retail Atlantic Superstore Retail 2004 2008 78,665 17,005 100% 2027 3687 & 3695 Hwy. #3 Barrington
Passage Retail no frills Retail 2012 N/A 28,583 14,538 86% 2023
211 Duke St. & 3855 Hwy. No. 3
Chester Retail Save Easy Retail 1999 2006 13,874 6,004
100% 2030
650 Portland St. Dartmouth Retail Atlantic Superstore Retail, Medical and Office
1993 2012 135,723 126,422 100% 2027
490 Hwy. #303 Digby Retail Atlantic Superstore Retail 1999 2006 48,060 1,400 100% 2023 291-297 Hwy. #214 Elmsdale Retail Atlantic Superstore Retail and Office 1999 2012 47,295 11,353 100% 2024 155 Reserve St. Glace Bay Retail Atlantic Superstore Retail 2000 N/A 47,500 19,110 93% 2023 6141 Young St. Halifax Retail Atlantic Superstore Retail 1993 2010 44,686 6,873 100% 2028 1075 & 1145 Barrington St. Halifax Retail Atlantic Superstore Retail 1997 2010 50,311 7,449 100% 2031 3601, 3609, 3627 & 3711 Joseph Howe Dr.
Halifax Retail Atlantic Superstore Retail, Medical and Office
2000 2012 156,233 26,503 100% 2028
470 Main St. Kingston Retail Atlantic Superstore Retail 2002 2008 64,228 7,776 100% 2028 50 Milton Rd. Liverpool Retail Atlantic Superstore Retail 2001 N/A 47,300 7,600 100% 2026 745 Sackville Dr. Lower Sackville Retail Atlantic Superstore Retail and Office 1993 2011 100,403 16,233 100% 2027 143 Victoria Rd. Lunenburg Retail Save Easy Retail 1997 2005 19,125 7,757 100% 2031 306-316 Main St. Middleton Retail Save Easy Retail 1997 2007 10,270 3,991 100% 2028 155 King St. Hwy. North Sydney Retail Atlantic Superstore Retail 2006 2012 36,975 7,324 100% 2024 5528 Highway 7 Porter's Lake Retail Atlantic Superstore Retail 1999 2010 47,067 7,233 100% 2028
26
Summary Information – Q2 2014
Individual Property Summary- Multi-Tenant Properties (cont’d)
Property City Property Class Banner Type of Third Party
Tenant(s) Year Built
Year Last Renovated
Loblaw GLA
Third Party GLA
% Occupied (including Loblaw)
Year of Expiry of Loblaw Lease
330-390 Welton St. Sydney Retail no frills Retail and Medical 1995 2010 36,370 156,953 46% 2024 46 Elm St. Truro Retail Atlantic Superstore Retail 1997 2011 69,501 12,957 100% 2027 11 Cole Dr. Windsor Retail Atlantic Superstore Retail 2000 N/A 47,750 7,548 100% 2028 104-110 Starrs Rd. Yarmouth Retail Atlantic Superstore Retail 2005 2006 81,638 33,123 95% 2026 Ontario 420-470 Main St. S Alexandria Retail Your Independent Grocer Retail 1999 N/A 37,000 20,524 100% 2028 401 Ottawa St. Almonte Retail Your Independent Grocer Retail 2001 2006 37,746 22,555 89% 2029 54 Wilson St. W Ancaster Retail Fortinos Retail and Medical 1999 2011 62,641 10,998 100% 2029 39 Winners Circle Dr. Arnprior Retail no frills Retail and Office 1999 2004 22,950 26,859 83% 2025 201-211 Cundles Rd. E Barrie Retail Zehrs Markets Retail 1991 2010 48,355 17,411 94% 2028 1025 & 1059 Plains Rd. E Burlington Retail Fortinos Retail 1999 2010 83,029 70,521 98% 2030 2025 Guelph Line Burlington Retail Fortinos Retail and Medical 1999 2009 94,851 84,057 100% 2030 180 Holiday Inn Dr. Cambridge Retail Zehrs Markets Retail 1990 2010 59,250 22,970 84% 2028 31-9th St. E Cornwall Retail Your Independent Grocer Retail 1992 2009 54,167 56,900 94% 2030 98 Ontario St. S Grand Bend Retail no frills Retail 2004 N/A 16,390 5,140 84% 2025 100 Rorke Ave. Haileybury Retail Valu-mart Retail 2008 N/A 18,358 12,242 100% 2024 65 Mall Rd. Hamilton Retail Fortinos Retail and Medical 1999 2010 91,084 11,909 100% 2028 50 Dundurn St. Hamilton Retail Fortinos Retail, Medical and
Office 1999 2009 71,202 54,216 97% 2031
435-447 Main St. E Hamilton Retail no frills Retail and Office 1990 2002 20,283 37,385 97% 2030 800-880-10th St. Hanover Retail Your Independent Grocer Retail 1995 2010 39,473 104,651 33% 2031 91 King William St. Huntsville Retail Third Party Tenants Only Retail 1996 2007 - 33,470 100% 2027 1040-1100 Princess St. Kingston Retail Loblaws Retail, Medical and
Office 2000 2009 81,332 81,720 99% 2031
875 Highland Rd. W Kitchener Retail Real Canadian Superstore Retail and Medical 1990 2012 153,618 79,473 98% 2023 1375 Weber St. E Kitchener Retail Zehrs Markets Retail, Medical and
Office 1990 2010 60,058 30,669 93% 2023
123 Pioneer Park Kitchener Retail Zehrs Markets Retail, Medical and Office
1990 N/A 23,479 49,764 92% 2030
201-215 Talbot St. E Leamington Retail Real Canadian Superstore Retail and Office 2003 2009 84,017 58,739 100% 2025 635 Southdale Rd. E London Retail no frills Retail 1996 2008 38,942 20,093 100% 2028 1199 & 1205 Oxford St. London Retail Real Canadian Superstore Retail 1999 2012 102,982 5,538 100% 2027 192 & 200 Bullock Dr. Markham Retail Loblaws Retail 2001 2009 116,462 12,102 100% 2025 59 Robertson Rd. Nepean Retail Loblaws Retail 1990 2002 47,615 92,068 100% 2024 55 Scott St. New Liskeard Retail Your Independent Grocer Retail 1993 2010 49,642 7,000 100% 2029 1641 & 1675 Jane St. North York Retail no frills Retail 1999 2007 29,222 14,830 100% 2028 173-183 Lakeshore Rd. W Oakville Retail Fortinos Retail 1996 2011 52,508 32,759 100% 2023 50-4th Ave. Orangeville Retail Zehrs Markets Retail 1990 2011 68,021 46,341 92% 2030 289-293 Coldwater Rd. W Orillia Retail Zehrs Markets Retail 1999 2012 74,558 21,162 92% 2030 1220-1226 Place D'Orleans Dr.
Orleans Retail no frills Retail and Medical 1993 2009 36,314 54,012 65% 2023
22 & 64 Isabella St. Ottawa Retail Loblaws Retail 1990 2012 14,059 8,100 64% 2031 190 Richmond Rd. Ottawa Retail Real Canadian Superstore Retail 2003 2009 84,880 10,183 100% 2029 60 Joseph St. Parry Sound Retail no frills Retail 2002 2008 21,954 12,284 100% 2030 1792 Liverpool Rd. Pickering Retail Loblaws Retail and Medical 1990 2010 115,529 37,423 98% 2027 1893 Scugog St. Port Perry Retail Your Independent Grocer Retail 1980 2009 50,725 5,390 100% 2028 245 Dixon Rd. Rexdale Retail no frills Medical 2012 N/A 47,042 32,080 94% 2023 2737 Laurier St. Rockland Retail Your Independent Grocer Retail 1999 2008 48,341 4,542 100% 2029 600 Murphy Rd. Sarnia Retail Real Canadian Superstore Retail 1991 2009 113,818 36,493 99% 2026 1806-1880 Eglinton Ave. E Scarborough Retail no frills Retail and Medical 1998 2012 56,185 128,370 95% 2028 1300 Main St. Stittsville Retail Third Party Tenants Only Retail, Medical and
Office 1989 2007 - 59,755 88% 2021
102 Highway 8 Stoney Creek Retail Fortinos Retail 1999 2010 52,544 40,002 70% 2028 626 Victoria St. Strathroy Retail Real Canadian Superstore Office 1996 2012 98,787 7,250 100% 2025 59 Mill St. Tilbury Retail no frills Retail and Medical 1990 2008 29,424 9,278 97% 2026 17 Leslie St. Toronto Retail Loblaws Retail 1990 2007 60,006 24,181 96% 2031 2280-2290 Dundas St. W Toronto Retail Loblaws Retail 1990 2009 29,213 106,242 100% 2026 1951 Eglinton Ave. W Toronto Retail no frills Office 1990 N/A 14,347 1,280 100% 2030 222 Lansdowne Ave. Toronto Retail no frills Retail and Medical 2003 N/A 57,059 4,605 100% 2030 1527-1543 Victoria Park Ave.
Toronto Retail Third Party Tenants Only Retail and Office 1959 2010 - 23,116 100% 2031
1569-1591 Wilson Ave. Toronto Retail no frills Retail 1999 2003 38,280 9,064 100% 2028 293 Dundas St. E Trenton Retail Your Independent Grocer Retail and Medical 2000 2010 48,296 9,000 93% 2023 1547-1551 Hwy. #55 Virgil Retail Valu-mart Retail 2004 N/A 21,204 3,149 100% 2031 24 Forwell Creek Waterloo Retail Real Canadian Wholesale
Club Retail 1998 2008 50,241 32,854 100% 2027
450 Erb St. W Waterloo Retail Zehrs Markets Retail 1990 2010 70,682 26,735 97% 2030 3555 Thickson Rd. N Whitby Retail no frills Retail 1993 2011 17,386 15,964 95% 2025 2430 Dougal Ave. Windsor Retail Real Canadian Superstore Retail 1990 2008 91,046 46,487 98% 2024 5890 Malden Rd. Windsor Retail Zehrs Markets Retail and Medical 1994 2008 86,401 37,076 98% 2031 7201 Tecumseh Rd. E Windsor Retail Zehrs Markets Retail 1990 2008 105,617 60,486 96% 2025 400 Manning Rd. & 13412-13598 Techumesh Rd. E
Windsor Retail Zehrs Markets Retail, Medical and Office
1996 2008 70,308 76,001 90% 2029
8345-8555 & 8585 Hwy. #27
Woodbridge Retail Fortinos Retail 2000 2013 82,851 31,593 86% 2028
969 Dundas St. Woodstock Retail Zehrs Markets Retail and Office 1998 2010 71,574 19,604 100% 2024 Quebec 1850-1870 boul. Saint-Joseph
Drummondville Retail Maxi Retail 1992 2012 47,402 32,547 100% 2027
375 Chemin Aylmer Gatineau Retail Loblaws Retail 1991 2006 63,314 18,686 94% 2027 74 & 80 rue Saint-Judes N Granby Retail Loblaws Retail 2002 2005 62,042 10,035 100% 2024 1201 & 1211 Aut. Duplessis L'Ancienne-
Lorette Retail Loblaws Retail 2004 2012 71,726 2,827 100% 2023
420 & 434-460 boul. Curé-Labelle
Laval Retail Maxi Retail and Office 1995 2010 44,663 43,661 80% 2031
2300 & 2600 Francis-Hughes
Laval Office & Warehouse
N/A Office & Supply Chain 1973 N/A 584,553 208,374 93% 2023
940 Chemin du Sault Levis Retail Maxi Retail 1989 2010 42,339 80,328 82% 2027

27
Summary Information – Q2 2014
Individual Property Summary- Multi-Tenant Properties (cont’d)
Property City Property Class Banner Type of Third Party
Tenant(s) Year Built
Year Last Renovated
Loblaw GLA
Third Party GLA
% Occupied (including Loblaw)
Year of Expiry of Loblaw Lease
2665 Chemin de Chambly Longueuil Retail Maxi & Cie Retail and Office 1984 2010 97,649 35,417 100% 2025 2925 & 3165 rue Rachel E Montréal Retail Loblaws Retail 2000 2009 74,723 13,312 100% 2027 7600 rue Sherbrooke E Montréal Retail Loblaws Retail 1998 2010 81,020 7,042 100% 2023 4777 & 4849 boul. Saint-Jean
Montréal Retail Loblaws Retail 1998 2004 71,080 7,633 100% 2023
6750-6800 rue Jean-Talon E Montréal Retail Maxi Retail 2002 2012 46,369 24,987 100% 2023 8305 & 8405 Ave. Papineau Montréal Retail Maxi & Cie Retail 1997 2012 87,812 7,674 100% 2026 5585 & 5595 Monkland Ave.
Montréal Retail Provigo Office 1990 2006 9,728 8,558 93% 2031
7701-7749 boul. Maurice-Duplessis
Montréal Retail Third Party Tenants Only Retail and Medical 2004 2005 - 42,378 84% 2020
10200 boul. Pie IX Montréal Nord Retail Maxi & Cie Retail 2001 2008 80,917 2,454 100% 2024 1041, 1065 & 1067 boul. Pie XI N
Quebec Retail Maxi Retail and Office 1995 2012 38,432 19,851 96% 2027
125 rue de la Fayette Repentigny Retail Third Party Tenants Only Retail 2003 N/A - 28,197 100% 2018 44 rue Craig & 35 rue du Collège S
Richmond Retail Maxi Retail 2004 2006 41,136 1,471 100% 2027
1075 & 1101-1155 boul. Talbot
Saguenay Retail Loblaws Retail 2003 N/A 65,881 8,557 100% 2023
701 & 801 rue Principale Saint-Agathe-des-Monts
Retail Provigo Retail 2002 N/A 43,780 7,118 100% 2023
1643 & 1753 boul. D'Youville
Shawinigan Retail Maxi Retail 1986 2010 45,552 3,095 100% 2025
2650-6 ième Ave. Shawinigan Retail Maxi Retail 1986 2010 44,015 7,923 100% 2025 470 rue Wellington S Sherbrooke Retail Presto Retail 1982 2002 23,812 11,120 100% 2027 1024-1030 boul. Vachon N Ste-Marie Retail Maxi Retail 1993 2006 35,536 4,378 100% 2023 501 & 555 Ave. Saint-Charles
Vaudreuil-Dorion
Retail Loblaws Retail 2001 2006 63,004 6,908 100% 2024
Saskatchewan 137 King St. Estevan Retail no frills Retail 2010 N/A 36,134 15,747 100% 2031 620 Saskatchewan Ave. Melfort Retail Extra Foods Retail 1985 2011 40,678 18,328 92% 2029 2901 & 2921-8th St. E Saskatoon Retail Real Canadian Superstore Retail 1991 2012 141,752 8,123 97% 2030 411 Confederation Dr. Saskatoon Retail Real Canadian Superstore Retail and Office 1979 2012 144,664 9,437 100% 2027 Total 10,759,000 4,327,000 Total Portfolio 36,400,000