
SUMMARISED PROVISIONAL CONSOLIDATED FINANCIAL RESULTS ATTACQ SUMMARISED PROVISIONAL CONSOLIDATED...
36
FINANCIAL RESULTS for the year ended 30 June 2019 SUMMARISED PROVISIONAL CONSOLIDATED
Transcript of SUMMARISED PROVISIONAL CONSOLIDATED FINANCIAL RESULTS ATTACQ SUMMARISED PROVISIONAL CONSOLIDATED...

FINANCIAL RESULTSfor the year ended 30 June 2019
SUMMARISED PROVISIONAL CONSOLIDATED

ATTACQ SUMMARISED PROVISIONAL CONSOLIDATED FINANCIAL RESULTS FOR THE YEAR ENDED 30 JUNE 2019 1 /
Commentary
Highlights • Full year dividend per share of 81.5 cents, increased by 10.1%, exceeding guidance
• Trading density growth in retail portfolio of 6.8%, with Mall of Africa having increased by 13.1%
• South African portfolio has a weighted average lease expiry of 6.5 years
• Interest cover ratio improved to 1.85 times from 1.78 times
• Seven buildings completed in Waterfall with a further nine buildings under construction
• Contribution to distributable earnings by Investment in MAS increased by 37.5%
• Reduction in Rest of Africa exposure with the disposal of interest in Achimota Retail Centre
IntroductionAttacq is a South African-based REIT, with a vision of delivering sustainable income and long-term capital growth through a focused approach in real estate investments and developments. The quality South African portfolio is dominant in its respective nodes, ensuring its defensiveness in a subdued economy and sets Attacq apart.
The group’s business model is based on four key drivers, namely the South African portfolio, Developments at Waterfall, Investment in MAS Real Estate Inc. (MAS) and the Rest of Africa retail investments. Attacq’s strategy is to exit the Rest of Africa retail investments in an orderly manner.
Attacq is listed on the Johannesburg Stock Exchange (JSE) and is included in the FTSE/JSE SAPY Index and FTSE/JSE SA REIT Index. Attacq is also the only property company included in the FTSE/JSE Responsible Investment Top 30 Index.
The group has restated its prior year annual financial statements. For more information, refer to the paragraph below titled Restatement of Attacq’s prior year annual financial statements.
General overviewAttacq’s board of directors (the board) has declared a dividend of 41.0 cents per share (cps) for the six months ended 30 June 2019. This brings the full year dividend to 81.5cps (2018: 74.0cps), resulting in a year-on-year growth of 10.1%, exceeding the market guidance provided in September 2018 of between 7.5% and 9.5%.
In a challenging economic environment, the South African portfolio performed well, supported by pleasing trading growth from the Mall of Africa and revenue earned from the seven newly completed buildings in Waterfall. This, combined with strong growth in dividends received from MAS, resulted in distributable earnings increasing by 17.1% to R664.1 million (restated 2018: R567.2 million). Included in distributable earnings is cash received of R89.5 million (2018: R46.7 million) in respect of interest income from AttAfrica Limited (AttAfrica) shareholder loans. Following the disposal of Achimota Retail Centre, the value of the Rest of Africa retail investments (excluding cash balances) has reduced to 2.4% of the group’s gross assets.
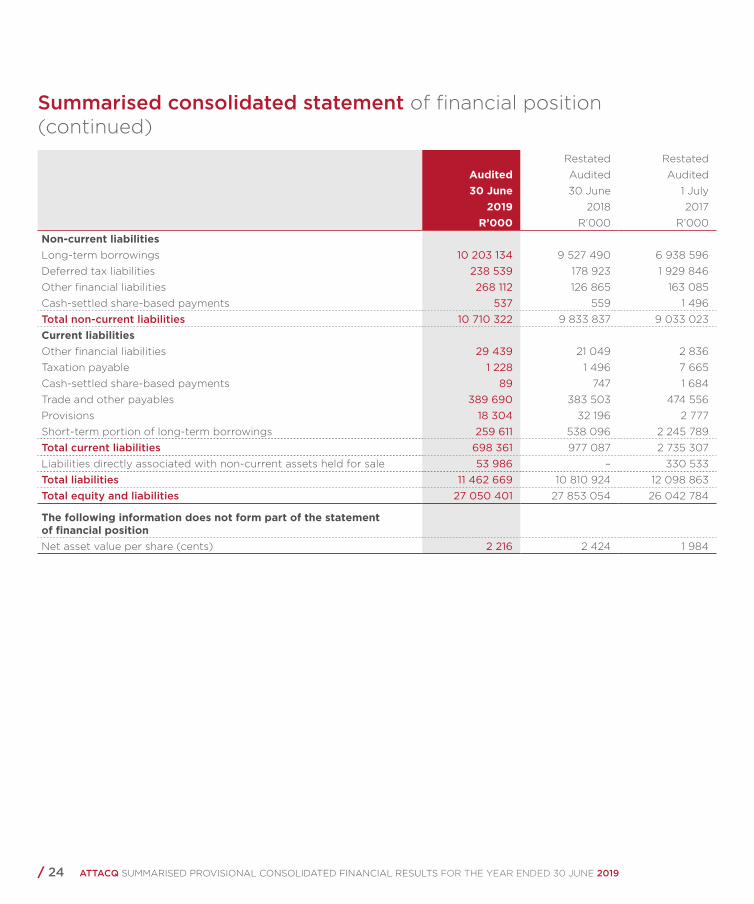
The net asset value per share (NAVPS) as at 30 June 2019 declined by 8.6% to R22.16 (2018: R24.24) due to impairments to the Rest of Africa retail investment, negative fair value adjustments on certain investment properties, as well as the effect of paying out a full 2018 year maiden dividend in October 2018 and the interim dividend in April 2019.
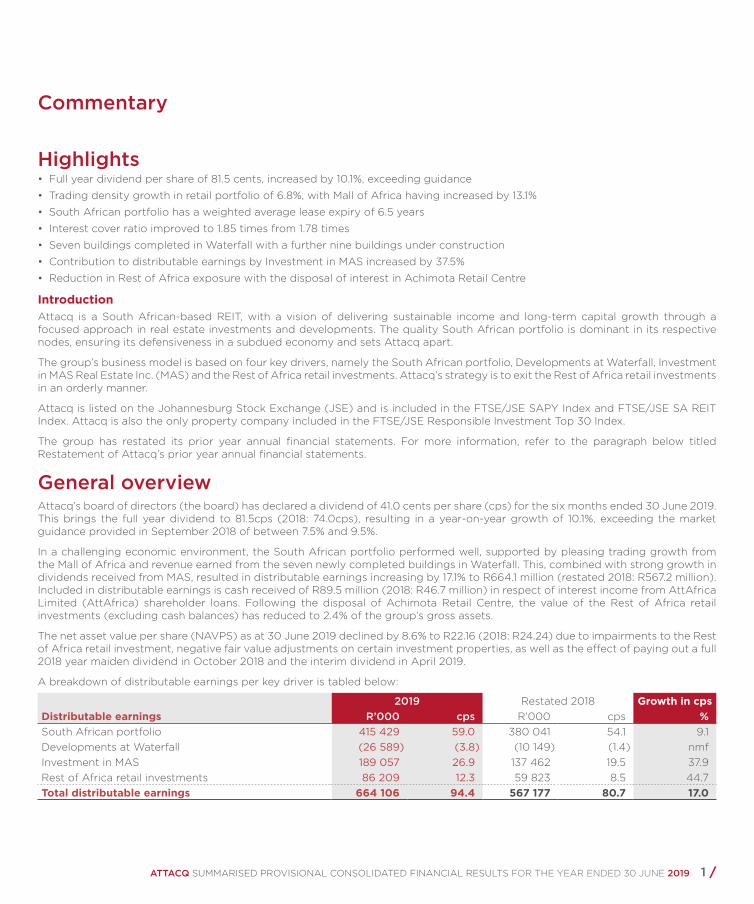
A breakdown of distributable earnings per key driver is tabled below:
2019 Restated 2018 Growth in cpsDistributable earnings R’000 cps R’000 cps %South African portfolio 415 429 59.0 380 041 54.1 9.1Developments at Waterfall (26 589) (3.8) (10 149) (1.4) nmfInvestment in MAS 189 057 26.9 137 462 19.5 37.9Rest of Africa retail investments 86 209 12.3 59 823 8.5 44.7Total distributable earnings 664 106 94.4 567 177 80.7 17.0
/ 2 ATTACQ SUMMARISED PROVISIONAL CONSOLIDATED FINANCIAL RESULTS FOR THE YEAR ENDED 30 JUNE 2019
South African portfolioOverviewAttacq’s operational portfolio consists of retail, office and mixed-use, light industrial and hotel properties. During the year ended 30 June 2019, the distributable earnings from the South African portfolio increased by 9.1% to 59.0cps (2018: 54.1cps). The value of the existing South African portfolio is R20.5 billion (2018: R20.9 billion), comprising 75.6% (2018: 75.2%) of total gross assets.
The portfolio’s weighted average lease expiry is 6.5 years as at 30 June 2019 (2018: 7.0 years). The average growth in trading densities in the retail portfolio for the year ended 30 June 2019 was 6.8% (2018: 5.1%). The Mall of Africa performed particularly well with density growth of 13.1% (2018: 10.5%), with an improved rent to sales ratio of 9.1% (2018: 9.6%).
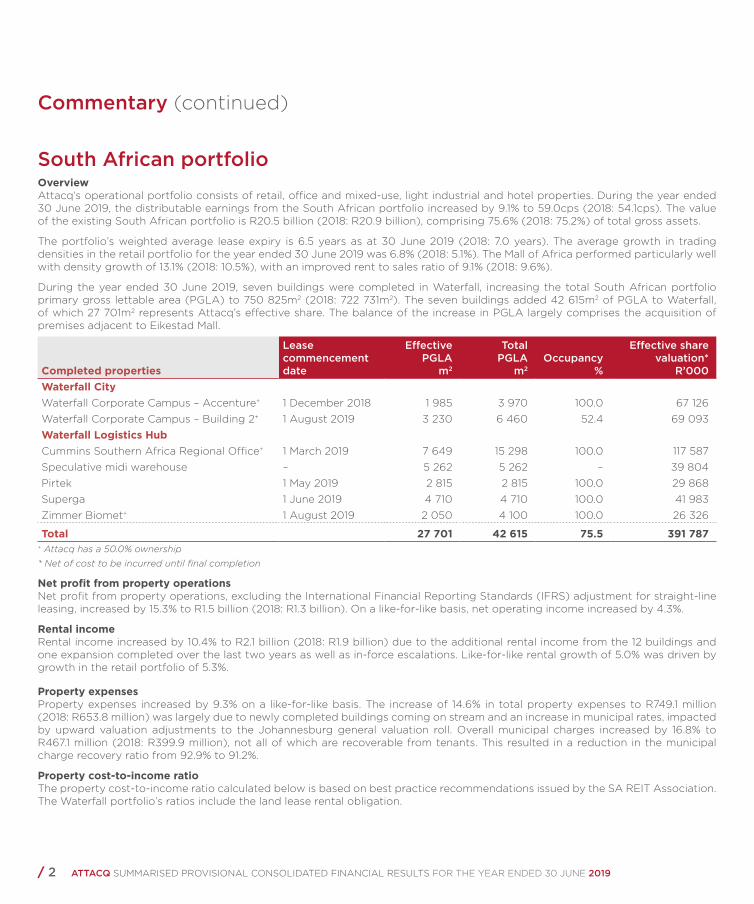
During the year ended 30 June 2019, seven buildings were completed in Waterfall, increasing the total South African portfolio primary gross lettable area (PGLA) to 750 825m2 (2018: 722 731m2). The seven buildings added 42 615m2 of PGLA to Waterfall, of which 27 701m2 represents Attacq’s effective share. The balance of the increase in PGLA largely comprises the acquisition of premises adjacent to Eikestad Mall.
Completed properties
Leasecommencementdate
EffectivePGLA
m2
TotalPGLA
m2Occupancy
%
Effective sharevaluation*
R’000Waterfall CityWaterfall Corporate Campus – Accenture+ 1 December 2018 1 985 3 970 100.0 67 126Waterfall Corporate Campus – Building 2+ 1 August 2019 3 230 6 460 52.4 69 093Waterfall Logistics HubCummins Southern Africa Regional Office+ 1 March 2019 7 649 15 298 100.0 117 587Speculative midi warehouse – 5 262 5 262 – 39 804Pirtek 1 May 2019 2 815 2 815 100.0 29 868Superga 1 June 2019 4 710 4 710 100.0 41 983Zimmer Biomet+ 1 August 2019 2 050 4 100 100.0 26 326
Total 27 701 42 615 75.5 391 787+ Attacq has a 50.0% ownership
* Net of cost to be incurred until final completion
Net profit from property operationsNet profit from property operations, excluding the International Financial Reporting Standards (IFRS) adjustment for straight-line leasing, increased by 15.3% to R1.5 billion (2018: R1.3 billion). On a like-for-like basis, net operating income increased by 4.3%.
Rental incomeRental income increased by 10.4% to R2.1 billion (2018: R1.9 billion) due to the additional rental income from the 12 buildings and one expansion completed over the last two years as well as in-force escalations. Like-for-like rental growth of 5.0% was driven by growth in the retail portfolio of 5.3%.
Property expensesProperty expenses increased by 9.3% on a like-for-like basis. The increase of 14.6% in total property expenses to R749.1 million (2018: R653.8 million) was largely due to newly completed buildings coming on stream and an increase in municipal rates, impacted by upward valuation adjustments to the Johannesburg general valuation roll. Overall municipal charges increased by 16.8% to R467.1 million (2018: R399.9 million), not all of which are recoverable from tenants. This resulted in a reduction in the municipal charge recovery ratio from 92.9% to 91.2%.
Property cost-to-income ratioThe property cost-to-income ratio calculated below is based on best practice recommendations issued by the SA REIT Association. The Waterfall portfolio’s ratios include the land lease rental obligation.
Commentary (continued)

ATTACQ SUMMARISED PROVISIONAL CONSOLIDATED FINANCIAL RESULTS FOR THE YEAR ENDED 30 JUNE 2019 3 /
Property cost-to-income ratio 2019
%
Restated*2018
%Waterfall portfolioNet cost-to-income ratio 20.9 21.9Gross cost-to-income ratio 35.8 35.9Non-Waterfall portfolioNet cost-to-income ratio 18.3 15.7Gross cost-to-income ratio 37.1 34.2Total South African portfolioNet cost-to-income ratio 19.8 18.9Gross cost-to-income ratio 36.4 35.1
* Restated due to the deconsolidation of Nieuwtown and Majestic
VacanciesOverall portfolio vacancies, measured in terms of PGLA, decreased by 9 244m2 to 46 418m2 when compared with 30 June 2018, largely due to the Dis-Chem warehouse lease commencement and leases concluded in Gateway West with Sage and Spaces.
The overall vacancy rate reduced to 6.2% from 7.7%. Vacancies not yet filled largely refer to 2 Eglin, Brooklyn Bridge Office Park, Gateway West and two speculative developments, namely the midi warehouse (5 262m2) and Waterfall Corporate Campus - Building 2 (3 230m2). Subsequent to year end, 6 594m2 of vacant space was let.
2019 2018 Restated*Sector vacancies % PGLA m2 % PGLA m2
Retail 2.9 8 562 1.7 4 946 Office and mixed-use 11.8 32 594 16.7 42 198Light industrial 3.2 5 262 5.3 8 518 Hotel – – – –Portfolio vacancy 6.2 46 418 7.7 55 662Less: filled post year-end 0.9 6 594 3.0 21 791Less: 2 Eglin 2.8 20 732 2.9 20 732Adjusted portfolio vacancy 2.5 19 092 1.8 13 139Waterfall 1.4 10 610 0.6 4 573Other 1.1 8 482 1.2 8 566
* Restated due to the deconsolidation of Nieuwtown and Majestic
Leases amounting to 24 498m2 (3.3% of total PGLA) expired during the year, of which 18 420m2 has been leased at a 0.7% increase in rental rates (weighted on the average rental rate per square metre) and a weighted average lease escalation rate of 5.0%.
Lease renewalsPGLA
m2Success rate
%
Expiring rentalrate increase*
%Escalation rate*
% Retail 14 944 79.0 1.6 4.5 Office and mixed-use 3 476 89.4 2.8 7.6Portfolio 18 420 80.6 0.7 5.0
* Based on new and renewed leases pertaining to leases that expired during the financial year
/ 4 ATTACQ SUMMARISED PROVISIONAL CONSOLIDATED FINANCIAL RESULTS FOR THE YEAR ENDED 30 JUNE 2019
Edcon restructureAttacq’s effective Edcon Limited (Edcon) exposure for the South African portfolio, (excluding Newtown Junction as it is equity accounted), will settle at 21 019m2 of PGLA by 1 October 2019 (gross monthly rental of R3.1 million), which represents 2.8% of the group’s PGLA. This follows a reduction of 3 159m2 to 24 356m2 as at 30 June 2019.
By participating in Edcon’s restructure programme, which commenced on 1 April 2019, Attacq will over 24 months subscribe for equity and convertible notes in Edcon at a total subscription price of R30.1 million. For the period ended 30 June 2019, this amounted to R4.1 million, by which distributable earnings and the investment have also been reduced.
ValuationsThe capitalisation rates (cap rates) for the June 2019 completed building valuations remained largely unchanged. Valuation inputs (i.e. long-term vacancy rates, rental reversions and market rental growth rates) were revised in light of the prevailing macro-economic conditions resulting in a negative fair value adjustment of R176.1 million (2018: positive R457.0 million). This excludes the IFRS adjustment for straight-line leasing.
The main contributors to the negative fair value adjustment are 2 Eglin, Brooklyn Bridge Office Park, Eikestad Mall, Mall of Africa and Torre Industries. The fair value adjustments for the retail centres were negatively impacted by the capital expenditure on reconfigurations and refurbishments. During the year, Torre Industries Limited (Torre Industries) underwent a corporate restructure. A net purchase consideration of R77.0 million was secured with a third party and a settlement agreement was reached with Torre Industries for early termination of their lease.
All income producing properties were valued on the discounted cash flow (DCF) methodology, except for 2 Eglin which was valued on the income capitalisation methodology due to the high vacancy level.
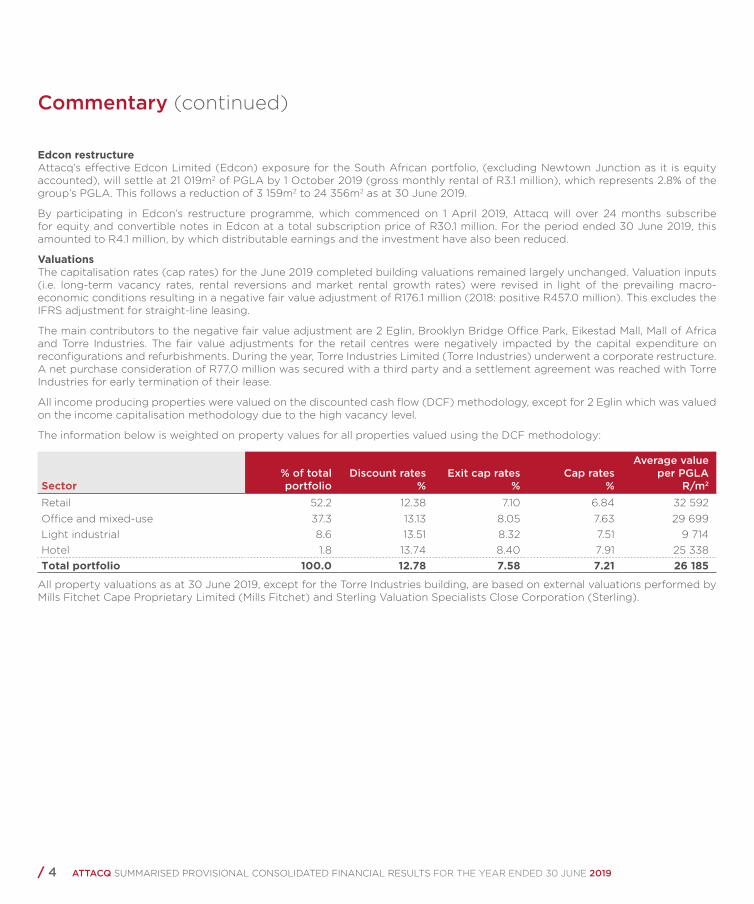
The information below is weighted on property values for all properties valued using the DCF methodology:
Sector% of total portfolio
Discount rates%
Exit cap rates %
Cap rates %
Average value per PGLA
R/m2
Retail 52.2 12.38 7.10 6.84 32 592Office and mixed-use 37.3 13.13 8.05 7.63 29 699Light industrial 8.6 13.51 8.32 7.51 9 714Hotel 1.8 13.74 8.40 7.91 25 338Total portfolio 100.0 12.78 7.58 7.21 26 185
All property valuations as at 30 June 2019, except for the Torre Industries building, are based on external valuations performed by Mills Fitchet Cape Proprietary Limited (Mills Fitchet) and Sterling Valuation Specialists Close Corporation (Sterling).
Commentary (continued)

ATTACQ SUMMARISED PROVISIONAL CONSOLIDATED FINANCIAL RESULTS FOR THE YEAR ENDED 30 JUNE 2019 5 /
Developments at WaterfallOverviewWaterfall’s location and ease of access creates an attractive value proposition for the continued development of a new city and logistics hub in the centre of Gauteng. Waterfall has 948 786m2 (2018: 957 008m2) of developable bulk remaining.
The group’s distributable earnings were negatively impacted by the holding costs relating to developments under construction, infrastructure and development rights. Holding costs include rates and taxes, marketing, security, and property owners’ association levies. For the year ended 30 June 2019, the impact thereof on DEPS was a reduction of 3.8 cents (2018: 1.4 cents).
The total asset value of Developments at Waterfall, including the value of the Attacq Sanlam joint venture (Waterfall Junction), remained largely unchanged at R2.3 billion (2018: R2.3 billion). Whilst these assets do not contribute positively to distributable earnings, it is a platform for future economic benefits via the development of new properties.
Developments at Waterfall2019
R’0002018
R’000
Developments under construction 929 469 527 592Development rights 500 428 901 428Infrastructure and services 787 682 685 875Waterfall Junction 111 620 143 803
Total 2 329 199 2 258 698
Developments under constructionDevelopments under construction increased to R929.5 million (2018: R527.6 million) as a result of capital expenditure and fair value adjustments based on the progress of the developments. The value of developments under construction as at 30 June 2019 is based on external valuations performed by Mills Fitchet and Sterling adjusted for costs still to be incurred to final completion.
The following developments were under construction as at 30 June 2019. Attacq’s attributable share of the total of 72 353m2 PGLA is 48 338m2.
DevelopmentsLand
parcel
Anticipatedpractical
completiondate
Lease commencement
date
EffectivePGLA
m2*
TotalPGLA
m2*
Pre-let% based ontotal PGLA
Waterfall CityDeloitte head office+ 10 Q3 FY20 1 April 2020 21 250 42 500 100.0The Ingress – PSG Wealth 10 Q1 FY20 1 August 2019 4 371 4 371 100.0The Ingress – building 2 10 Q2 FY20 – 4 360 4 360 –Waterfall Corporate Campus – ContinuitySA+ 10B Q2 FY20 1 March 2020 2 765 5 530 100.0Waterfall Courtyard Hotel 10 Q2 FY21 1 January 2021 6 236 6 236 100.0Waterfall Point 15 Q2 FY20 Sectional title
sales and letting9 356 9 356 92.4#
Total 48 338 72 353 89.5
* Estimated PGLA of development, subject to change upon final re-measurement post completion + Attacq has a 50.0% ownership# Based on pre-sales and pre-lets
/ 6 ATTACQ SUMMARISED PROVISIONAL CONSOLIDATED FINANCIAL RESULTS FOR THE YEAR ENDED 30 JUNE 2019
Deloitte head office – land parcel 10The Deloitte head office development is a 50/50 joint venture between Attacq and Atterbury Property Holdings Proprietary Limited and its subsidiaries. The total cost of the project is R1.5 billion. The development is targeting silver United States Green Building Council’s (USGBC) Leadership in Energy and Environmental Design (LEED) (as built and commissioning) certification.
The Ingress – land parcel 10The Ingress is a five-building office park prominently located at the entrance to Waterfall City. Phase I consists of offices for PSG Wealth, who took occupation on 1 August 2019, as well as a speculative building. The remaining three buildings (approximately 11 700m2) will be developed in a phased approach subject to market demand. The total development cost is estimated at R570.0 million. The development is targeting a four-star Green Building Council of South Africa (GBCSA) (by design and as built) certification.
Waterfall Corporate Campus Office Park – land parcel 10BWaterfall Corporate Campus is a 50/50 joint venture with Zenprop Property Holdings Proprietary Limited (Zenprop). The development will comprise of seven office buildings with a centrally located communal facility which includes a conference facility and restaurant. The estimated total PGLA for this development is 35 000m2 with an approximate total development cost of R880.0 million. The first three buildings (16 300m2) are completed and construction has commenced on the next building which will be occupied by ContinuitySA. The remaining buildings will be developed in a phased approach subject to market demand. All buildings are targeting a minimum four-star GBCSA (by design and as built) certification.
Waterfall Ext 124 which includes Courtyard Hotel – land parcel 10Ext 124 comprises three office buildings and a “new concept” 4-star Courtyard Hotel which will be leased and operated by the City Lodge Hotel Group. The total PGLA is estimated at 32 000m2 at an estimated total development cost of R925.0 million. Construction of the 10-storey, 168-key hotel has commenced at an approximate development cost of R1.3 million per key. Construction of the remaining precinct will be in a phased approach subject to market demand. This development was previously to be developed as a 50/50 joint venture, whereas Attacq is now the sole developer. Each building is targeting a minimum four-star GBCSA (by design and as built) certification.
Waterfall Point – land parcel 15Waterfall Point is an A-grade office park with four buildings of approximately 2 350m2 each. The office park is a sectional title scheme which caters for both investment by Attacq and businesses who wish to invest in their own premises. Attacq currently holds two buildings as investment property which are 100.0% pre-let. Two of the buildings have been classified as inventory, with 84.9% of PGLA pre-sold. Recognition of the revenue and cost of sales on the pre-sold inventory is on a percentage completion basis.
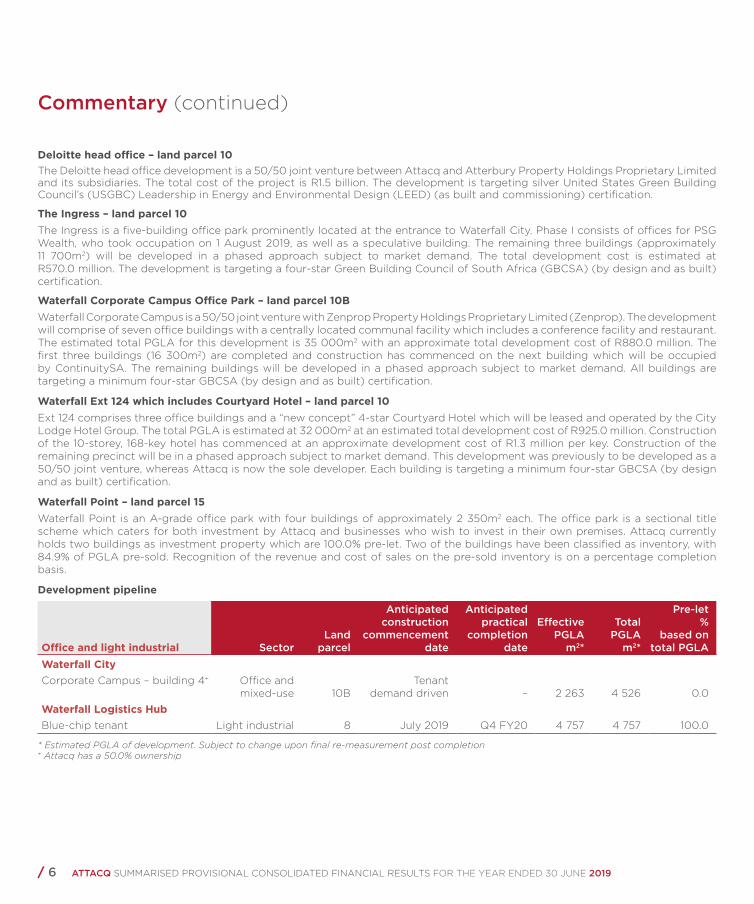
Development pipeline
Office and light industrial SectorLand
parcel
Anticipated construction
commencement date
Anticipated practical
completion date
EffectivePGLA
m2*
TotalPGLA
m2*
Pre-let%
based on total PGLA
Waterfall CityCorporate Campus – building 4+ Office and
mixed-use 10BTenant
demand driven – 2 263 4 526 0.0Waterfall Logistics HubBlue-chip tenant Light industrial 8 July 2019 Q4 FY20 4 757 4 757 100.0
* Estimated PGLA of development. Subject to change upon final re-measurement post completion + Attacq has a 50.0% ownership
Commentary (continued)
ATTACQ SUMMARISED PROVISIONAL CONSOLIDATED FINANCIAL RESULTS FOR THE YEAR ENDED 30 JUNE 2019 7 /
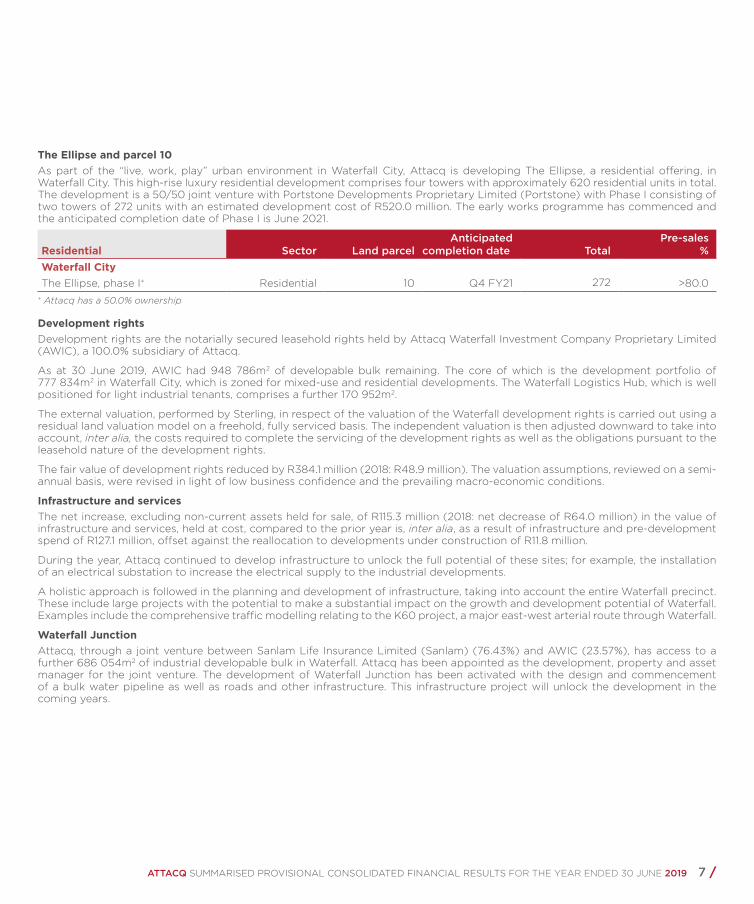
The Ellipse and parcel 10As part of the “live, work, play” urban environment in Waterfall City, Attacq is developing The Ellipse, a residential offering, in Waterfall City. This high-rise luxury residential development comprises four towers with approximately 620 residential units in total. The development is a 50/50 joint venture with Portstone Developments Proprietary Limited (Portstone) with Phase I consisting of two towers of 272 units with an estimated development cost of R520.0 million. The early works programme has commenced and the anticipated completion date of Phase I is June 2021.
Residential Sector Land parcelAnticipated
completion date Total Pre-sales
%Waterfall CityThe Ellipse, phase I+ Residential 10 Q4 FY21 272 >80.0
+ Attacq has a 50.0% ownership
Development rights Development rights are the notarially secured leasehold rights held by Attacq Waterfall Investment Company Proprietary Limited (AWIC), a 100.0% subsidiary of Attacq.
As at 30 June 2019, AWIC had 948 786m2 of developable bulk remaining. The core of which is the development portfolio of 777 834m2 in Waterfall City, which is zoned for mixed-use and residential developments. The Waterfall Logistics Hub, which is well positioned for light industrial tenants, comprises a further 170 952m2.
The external valuation, performed by Sterling, in respect of the valuation of the Waterfall development rights is carried out using a residual land valuation model on a freehold, fully serviced basis. The independent valuation is then adjusted downward to take into account, inter alia, the costs required to complete the servicing of the development rights as well as the obligations pursuant to the leasehold nature of the development rights.
The fair value of development rights reduced by R384.1 million (2018: R48.9 million). The valuation assumptions, reviewed on a semi-annual basis, were revised in light of low business confidence and the prevailing macro-economic conditions.
Infrastructure and servicesThe net increase, excluding non-current assets held for sale, of R115.3 million (2018: net decrease of R64.0 million) in the value of infrastructure and services, held at cost, compared to the prior year is, inter alia, as a result of infrastructure and pre-development spend of R127.1 million, offset against the reallocation to developments under construction of R11.8 million.
During the year, Attacq continued to develop infrastructure to unlock the full potential of these sites; for example, the installation of an electrical substation to increase the electrical supply to the industrial developments.
A holistic approach is followed in the planning and development of infrastructure, taking into account the entire Waterfall precinct. These include large projects with the potential to make a substantial impact on the growth and development potential of Waterfall. Examples include the comprehensive traffic modelling relating to the K60 project, a major east-west arterial route through Waterfall.
Waterfall JunctionAttacq, through a joint venture between Sanlam Life Insurance Limited (Sanlam) (76.43%) and AWIC (23.57%), has access to a further 686 054m2 of industrial developable bulk in Waterfall. Attacq has been appointed as the development, property and asset manager for the joint venture. The development of Waterfall Junction has been activated with the design and commencement of a bulk water pipeline as well as roads and other infrastructure. This infrastructure project will unlock the development in the coming years.

/ 8 ATTACQ SUMMARISED PROVISIONAL CONSOLIDATED FINANCIAL RESULTS FOR THE YEAR ENDED 30 JUNE 2019
Investment in MASOverviewThe investment in MAS contributed R189.1 million (2018: R137.5 million) to the group’s distributable earnings including cash dividends received of R185.6 million (2018: R151.1 million).
Attacq’s shareholding in MAS remained unchanged at 22.8% (2018: 22.8%). The market value of Attacq’s investment based on the MAS share price as at 28 June 2019 of R20.90 (2018: R21.00) equates to R3.2 billion (2018: R3.1 billion), which is in line with Attacq’s equity accounted investment at 30 June 2019 of R3.2 billion (2018: R3.1 billion).
MAS achieved a 59.6% increase in net rental income to EUR51.6 million and a 41.9% increase in DEPS from 6.35 euro cps to 9.01 euro cps, driven by acquisitions of investment property, its Prime Kapital investment joint venture and its real estate equity securities portfolio. Investment property, including assets held for sale, increased by 52.4% to EUR964.7 million from EUR632.8 million.
MAS’ management focus on the recycling of capital out of mature assets into higher-yielding properties resulted in the disposal of its low-yielding hotel assets at New Waverley, Edinburgh, for EUR43.3 million at yields of 4.1%. During the year, the following income-producing properties were acquired, adding a total of 178 240m2 GLA to MAS’ property portfolio.
Property LocationGLA
m2
Acquisition valuation
EUR’millionFlensburg Galerie Shopping Centre Flensburg, Germany 25 540 62.6Militari Shopping Centre Bucharest, Romania 56 200 95.0Atrium Mall Shopping Centre Arad, Romania 28 600 40.5Romania retail portfolio Nine properties, Romania 67 900 109.1
The Prime Kapital development joint venture pipeline comprises ten projects with an estimated total development cost of EUR783.0 million and GLA of 615 000m2. Seven of these assets have either commenced with construction or are at design and permitting stage and two are expected to be completed by December 2019. During the year, MAS announced an extension of the development joint venture by an additional two years to 2025.
Plans are under way to extend and refurbish the retail assets of the investment joint venture between MAS and Prime Kapital, namely Nova Park (Poland), Burgas Mall and Stara Zagora Mall (both Bulgaria) and Militari Shopping Centre. Approximately 57 000m2 of GLA can be added to improve the fashion and leisure offerings of the centres and strengthen their regionally-dominant positions.
Attacq has the following hedges in place in respect of expected future MAS dividends:
MAS dividend periodAnticipated timing of
receipt Amount hedged
EUR’million Fixed rateAmount hedged
R’millionFinal FY19 October 2019 5.1 R18.10 92.3Interim FY20 March 2020 2.7 R17.29 46.0
For further information in respect of MAS’ results, refer to the MAS website at www.masrei.com.
Commentary (continued)
ATTACQ SUMMARISED PROVISIONAL CONSOLIDATED FINANCIAL RESULTS FOR THE YEAR ENDED 30 JUNE 2019 9 /
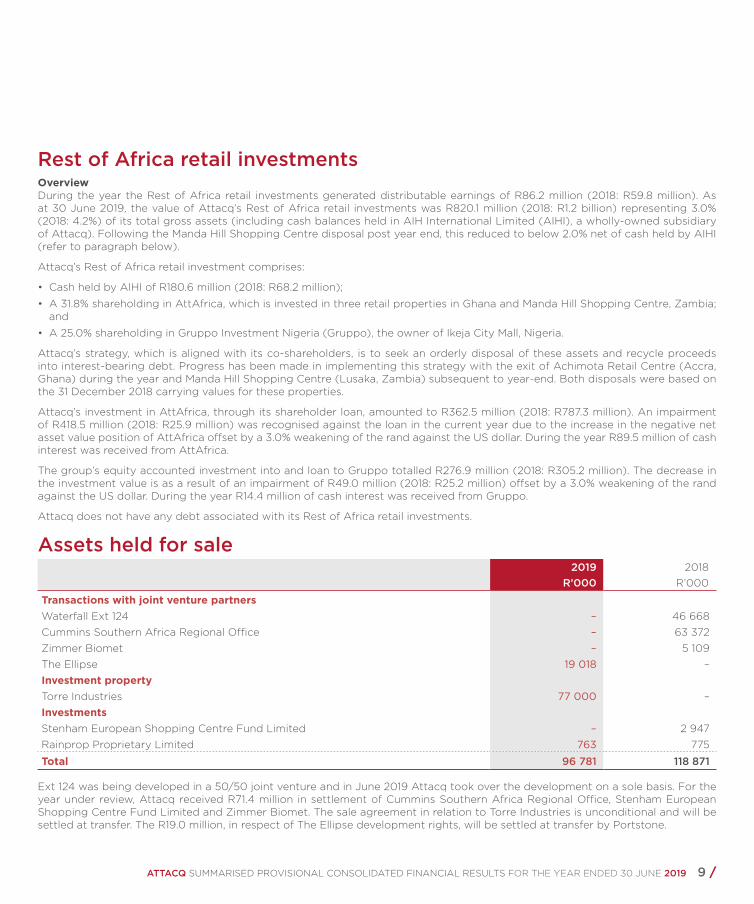
Rest of Africa retail investmentsOverviewDuring the year the Rest of Africa retail investments generated distributable earnings of R86.2 million (2018: R59.8 million). As at 30 June 2019, the value of Attacq’s Rest of Africa retail investments was R820.1 million (2018: R1.2 billion) representing 3.0% (2018: 4.2%) of its total gross assets (including cash balances held in AIH International Limited (AIHI), a wholly-owned subsidiary of Attacq). Following the Manda Hill Shopping Centre disposal post year end, this reduced to below 2.0% net of cash held by AIHI (refer to paragraph below).
Attacq’s Rest of Africa retail investment comprises:
• Cash held by AIHI of R180.6 million (2018: R68.2 million);
• A 31.8% shareholding in AttAfrica, which is invested in three retail properties in Ghana and Manda Hill Shopping Centre, Zambia; and
• A 25.0% shareholding in Gruppo Investment Nigeria (Gruppo), the owner of Ikeja City Mall, Nigeria.
Attacq’s strategy, which is aligned with its co-shareholders, is to seek an orderly disposal of these assets and recycle proceeds into interest-bearing debt. Progress has been made in implementing this strategy with the exit of Achimota Retail Centre (Accra, Ghana) during the year and Manda Hill Shopping Centre (Lusaka, Zambia) subsequent to year-end. Both disposals were based on the 31 December 2018 carrying values for these properties.
Attacq’s investment in AttAfrica, through its shareholder loan, amounted to R362.5 million (2018: R787.3 million). An impairment of R418.5 million (2018: R25.9 million) was recognised against the loan in the current year due to the increase in the negative net asset value position of AttAfrica offset by a 3.0% weakening of the rand against the US dollar. During the year R89.5 million of cash interest was received from AttAfrica.
The group’s equity accounted investment into and loan to Gruppo totalled R276.9 million (2018: R305.2 million). The decrease in the investment value is as a result of an impairment of R49.0 million (2018: R25.2 million) offset by a 3.0% weakening of the rand against the US dollar. During the year R14.4 million of cash interest was received from Gruppo.
Attacq does not have any debt associated with its Rest of Africa retail investments.
Assets held for sale 2019 2018
R’000 R’000
Transactions with joint venture partnersWaterfall Ext 124 – 46 668Cummins Southern Africa Regional Office – 63 372Zimmer Biomet – 5 109The Ellipse 19 018 –Investment propertyTorre Industries 77 000 –InvestmentsStenham European Shopping Centre Fund Limited – 2 947Rainprop Proprietary Limited 763 775
Total 96 781 118 871
Ext 124 was being developed in a 50/50 joint venture and in June 2019 Attacq took over the development on a sole basis. For the year under review, Attacq received R71.4 million in settlement of Cummins Southern Africa Regional Office, Stenham European Shopping Centre Fund Limited and Zimmer Biomet. The sale agreement in relation to Torre Industries is unconditional and will be settled at transfer. The R19.0 million, in respect of The Ellipse development rights, will be settled at transfer by Portstone.
/ 10 ATTACQ SUMMARISED PROVISIONAL CONSOLIDATED FINANCIAL RESULTS FOR THE YEAR ENDED 30 JUNE 2019
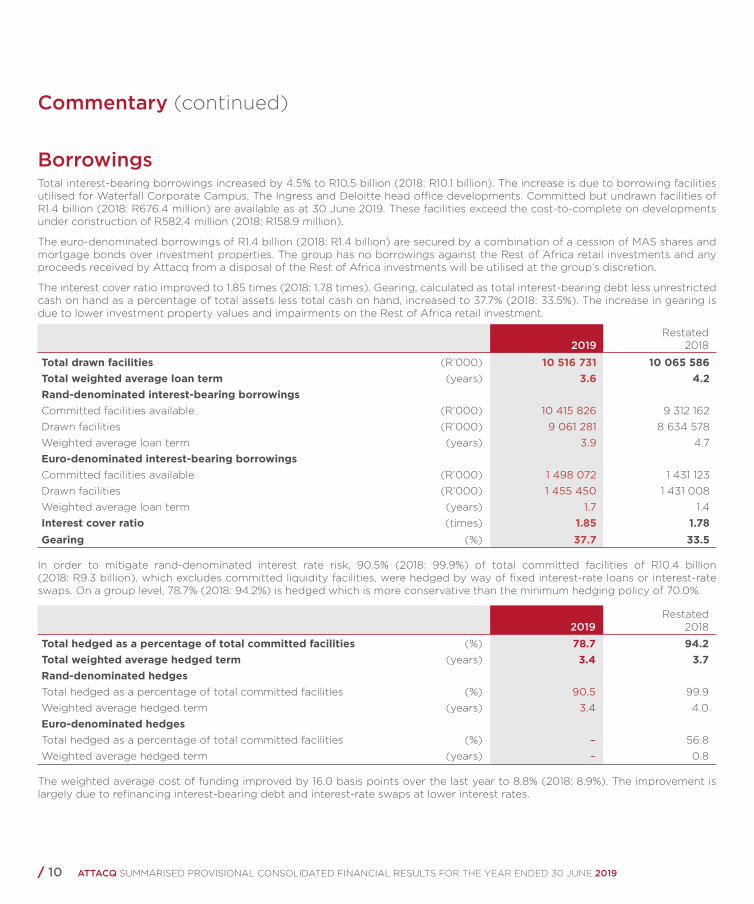
BorrowingsTotal interest-bearing borrowings increased by 4.5% to R10.5 billion (2018: R10.1 billion). The increase is due to borrowing facilities utilised for Waterfall Corporate Campus, The Ingress and Deloitte head office developments. Committed but undrawn facilities of R1.4 billion (2018: R676.4 million) are available as at 30 June 2019. These facilities exceed the cost-to-complete on developments under construction of R582.4 million (2018: R158.9 million).
The euro-denominated borrowings of R1.4 billion (2018: R1.4 billion) are secured by a combination of a cession of MAS shares and mortgage bonds over investment properties. The group has no borrowings against the Rest of Africa retail investments and any proceeds received by Attacq from a disposal of the Rest of Africa investments will be utilised at the group’s discretion.
The interest cover ratio improved to 1.85 times (2018: 1.78 times). Gearing, calculated as total interest-bearing debt less unrestricted cash on hand as a percentage of total assets less total cash on hand, increased to 37.7% (2018: 33.5%). The increase in gearing is due to lower investment property values and impairments on the Rest of Africa retail investment.
2019Restated
2018
Total drawn facilities (R’000) 10 516 731 10 065 586Total weighted average loan term (years) 3.6 4.2Rand-denominated interest-bearing borrowingsCommitted facilities available (R’000) 10 415 826 9 312 162Drawn facilities (R’000) 9 061 281 8 634 578Weighted average loan term (years) 3.9 4.7Euro-denominated interest-bearing borrowingsCommitted facilities available (R’000) 1 498 072 1 431 123Drawn facilities (R’000) 1 455 450 1 431 008Weighted average loan term (years) 1.7 1.4Interest cover ratio (times) 1.85 1.78Gearing (%) 37.7 33.5
In order to mitigate rand-denominated interest rate risk, 90.5% (2018: 99.9%) of total committed facilities of R10.4 billion (2018: R9.3 billion), which excludes committed liquidity facilities, were hedged by way of fixed interest-rate loans or interest-rate swaps. On a group level, 78.7% (2018: 94.2%) is hedged which is more conservative than the minimum hedging policy of 70.0%.
2019Restated
2018
Total hedged as a percentage of total committed facilities (%) 78.7 94.2Total weighted average hedged term (years) 3.4 3.7Rand-denominated hedgesTotal hedged as a percentage of total committed facilities (%) 90.5 99.9Weighted average hedged term (years) 3.4 4.0Euro-denominated hedgesTotal hedged as a percentage of total committed facilities (%) – 56.8Weighted average hedged term (years) – 0.8
The weighted average cost of funding improved by 16.0 basis points over the last year to 8.8% (2018: 8.9%). The improvement is largely due to refinancing interest-bearing debt and interest-rate swaps at lower interest rates.
Commentary (continued)

ATTACQ SUMMARISED PROVISIONAL CONSOLIDATED FINANCIAL RESULTS FOR THE YEAR ENDED 30 JUNE 2019 11 /
2019%
Restated2018
%
Total weighted average cost of debt 8.8 8.9Rand-denominated weighted average cost of debt 9.9 10.0Weighted average floating interest rate 9.0 8.8Premium for hedging 0.9 1.2Euro-denominated weighted average cost of debt 1.9 2.4Weighted average floating interest rate 1.9 2.3Premium for hedging – 0.1
A total of R259.6 million (2018: R538.1 million) of the group’s interest-bearing debt is due for repayment in the next 12 months. Interest-bearing debt of R54.0 million (2018: Rnil) is secured by investment property currently classified as non-current assets held for sale and will be settled upon transfer of the Torre Industries property.
During the past year, Attacq successfully refinanced a total of R2.2 billion of the group’s interest-bearing debt which includes the Brooklyn Bridge Office Park Proprietary Limited (BBOP) funding (R330.3 million), one of the tranches in the Attacq Retail Fund Proprietary Limited (ARF) and Lynnwood Bridge Office Park Proprietary Limited (LBOP) syndicated loan (R397.8 million) and the euro denominated funding (R1.5 billion).
Due to lower forward interest rates, an increase in other financial liabilities of R135.8 million (2018: decrease in other financial liabilities of R40.7 million) was recorded on the mark-to-market valuation of interest rate swaps.

/ 12 ATTACQ SUMMARISED PROVISIONAL CONSOLIDATED FINANCIAL RESULTS FOR THE YEAR ENDED 30 JUNE 2019
ProspectsIn September 2018, guidance was provided for dividend per share (DPS) growth of between 7.5% and 9.5% for the year ended 30 June 2019; and between 13.0% and 15.0% for the year ending 30 June 2020. Attacq achieved DPS growth of 10.1% for the year ended 30 June 2019, creating a higher DPS base. Furthermore, the board’s decision not to distribute rental income relating to the 40.9% of Edcon leases will negatively impact distribution for the year ending 30 June 2020. Taking these factors into account, Attacq is targeting DPS growth of between 8.0% and 10.0% for the year ending 30 June 2020.
This guidance is based on the following assumptions:
• Achieving forecasted rental income based on contractual terms and anticipated market-related renewals• Tenants will be able to absorb the recovery of rising utility costs and municipal rates• The expected roll-out of the current and budgeted development portfolio• MAS meeting its three-year dividend target• No unforeseen circumstances such as major corporate tenant failures or deterioration of the macro-economic environment
The prospects have not been reviewed or reported on by Attacq’s auditors.
Restatement of Attacq’s prior year annual financial statementsDeconsolidation of Nieuwtown Property Development Company Proprietary Limited (Nieuwtown) and Majestic Offices Proprietary Limited (Majestic)The group has a 50.0% shareholding in Nieuwtown and Majestic. The group was considered to have control over both Nieuwtown and Majestic because of its 50.0% ownership as well as performing the asset management function on behalf of both companies. As a result, Nieuwtown and Majestic were consolidated in the group annual financial statements for all previous reporting dates since inception.
When Attacq relinquished the asset management function, Nieuwtown and Majestic were deconsolidated by the group with effect from 1 July 2018.
The decision to consolidate Nieuwtown and Majestic in prior years was reviewed together with the accounting treatment appropriate with the change in asset managers referred to above. Following the review, it was determined that the performance of the asset management function in conjunction with a 50.0% shareholding does not by itself result in control. It was therefore concluded that Attacq had joint control with its co-shareholder prior to 1 July 2018.
The impact of this error is that the group has restated the prior year annual financial statements by deconsolidating Nieuwtown and Majestic and accounting for these investments as associates in terms of IFRS 11: Joint Arrangements.
Error in treatment of non-controlling interest of Nieuwtown in calculating distributable earningsWhile preparing the restated prior year annual financial statements as referred to above, it was observed that the non-cash intercompany transactions attributable to the non-controlling interest in respect of Nieuwtown were not adjusted for in the calculation of distributable earnings. This error was corrected by effecting the prior year restatement of deconsolidating Nieuwtown and accounting for this investment as an associate in terms of IFRS 11: Joint Arrangements.
Adjustment to headline earnings as a result of the deconsolidation of Nieuwtown and MajesticIn accordance with Circular 4/2018: Headline Earnings issued by the South African Institute of Chartered Accountants, an adjustment should be made for the headline earnings of an investment in associates. Due to the deconsolidation of Nieuwtown and Majestic and the resulting equity accounting for these investments, an adjustment to headline earnings is required to reflect the headline earnings of the underlying associates.
Commentary (continued)
ATTACQ SUMMARISED PROVISIONAL CONSOLIDATED FINANCIAL RESULTS FOR THE YEAR ENDED 30 JUNE 2019 13 /
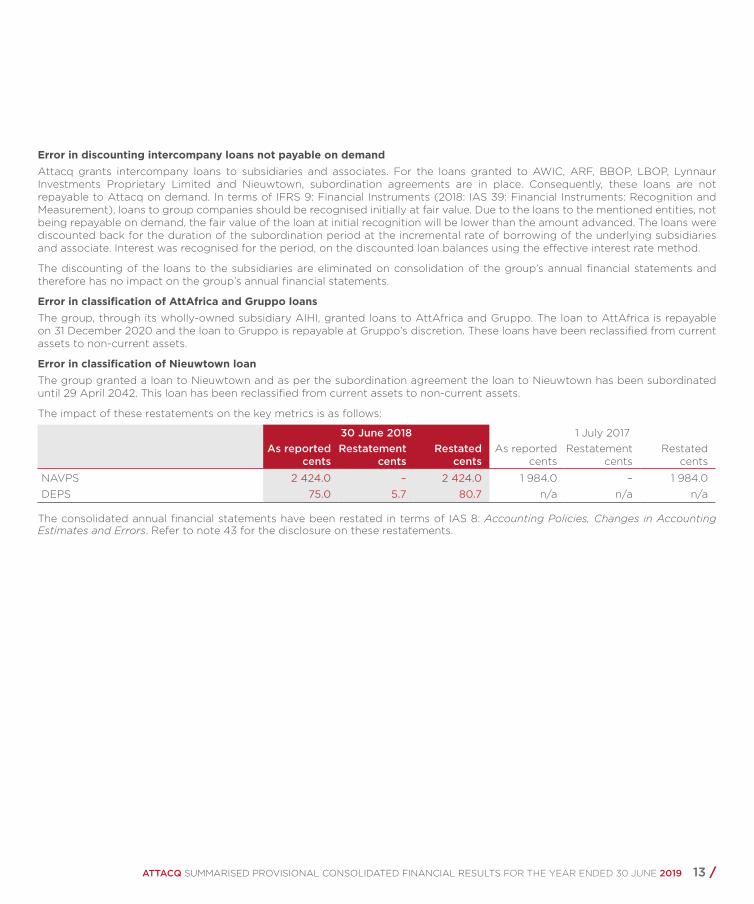
Error in discounting intercompany loans not payable on demandAttacq grants intercompany loans to subsidiaries and associates. For the loans granted to AWIC, ARF, BBOP, LBOP, Lynnaur Investments Proprietary Limited and Nieuwtown, subordination agreements are in place. Consequently, these loans are not repayable to Attacq on demand. In terms of IFRS 9: Financial Instruments (2018: IAS 39: Financial Instruments: Recognition and Measurement), loans to group companies should be recognised initially at fair value. Due to the loans to the mentioned entities, not being repayable on demand, the fair value of the loan at initial recognition will be lower than the amount advanced. The loans were discounted back for the duration of the subordination period at the incremental rate of borrowing of the underlying subsidiaries and associate. Interest was recognised for the period, on the discounted loan balances using the effective interest rate method.
The discounting of the loans to the subsidiaries are eliminated on consolidation of the group’s annual financial statements and therefore has no impact on the group’s annual financial statements.
Error in classification of AttAfrica and Gruppo loansThe group, through its wholly-owned subsidiary AIHI, granted loans to AttAfrica and Gruppo. The loan to AttAfrica is repayable on 31 December 2020 and the loan to Gruppo is repayable at Gruppo’s discretion. These loans have been reclassified from current assets to non-current assets.
Error in classification of Nieuwtown loanThe group granted a loan to Nieuwtown and as per the subordination agreement the loan to Nieuwtown has been subordinated until 29 April 2042. This loan has been reclassified from current assets to non-current assets.
The impact of these restatements on the key metrics is as follows:
30 June 2018 1 July 2017As reported
centsRestatement
centsRestated
centsAs reported
centsRestatement
centsRestated
cents
NAVPS 2 424.0 – 2 424.0 1 984.0 – 1 984.0DEPS 75.0 5.7 80.7 n/a n/a n/a
The consolidated annual financial statements have been restated in terms of IAS 8: Accounting Policies, Changes in Accounting Estimates and Errors. Refer to note 43 for the disclosure on these restatements.
/ 14 ATTACQ SUMMARISED PROVISIONAL CONSOLIDATED FINANCIAL RESULTS FOR THE YEAR ENDED 30 JUNE 2019
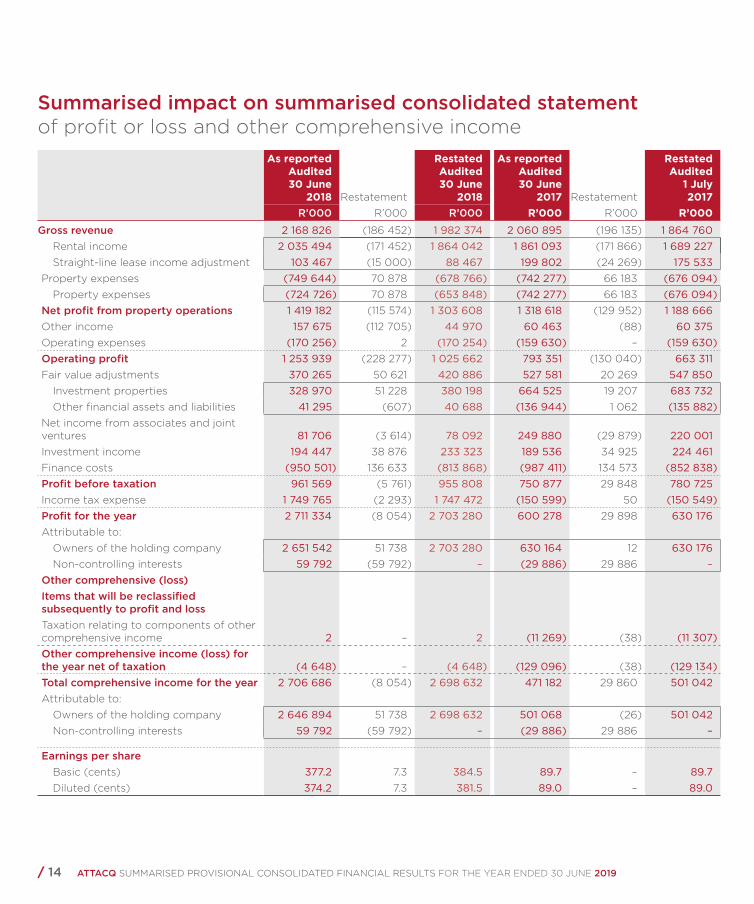
Summarised impact on summarised consolidated statement of profit or loss and other comprehensive income
As reported Audited30 June
2018 Restatement
RestatedAudited30 June
2018
As reported Audited30 June
2017 Restatement
RestatedAudited
1 July2017
R’000 R’000 R’000 R’000 R’000 R’000Gross revenue 2 168 826 (186 452) 1 982 374 2 060 895 (196 135) 1 864 760
Rental income 2 035 494 (171 452) 1 864 042 1 861 093 (171 866) 1 689 227 Straight-line lease income adjustment 103 467 (15 000) 88 467 199 802 (24 269) 175 533
Property expenses (749 644) 70 878 (678 766) (742 277) 66 183 (676 094)Property expenses (724 726) 70 878 (653 848) (742 277) 66 183 (676 094)
Net profit from property operations 1 419 182 (115 574) 1 303 608 1 318 618 (129 952) 1 188 666 Other income 157 675 (112 705) 44 970 60 463 (88) 60 375 Operating expenses (170 256) 2 (170 254) (159 630) – (159 630)Operating profit 1 253 939 (228 277) 1 025 662 793 351 (130 040) 663 311Fair value adjustments 370 265 50 621 420 886 527 581 20 269 547 850
Investment properties 328 970 51 228 380 198 664 525 19 207 683 732 Other financial assets and liabilities 41 295 (607) 40 688 (136 944) 1 062 (135 882)
Net income from associates and joint ventures 81 706 (3 614) 78 092 249 880 (29 879) 220 001 Investment income 194 447 38 876 233 323 189 536 34 925 224 461 Finance costs (950 501) 136 633 (813 868) (987 411) 134 573 (852 838)Profit before taxation 961 569 (5 761) 955 808 750 877 29 848 780 725Income tax expense 1 749 765 (2 293) 1 747 472 (150 599) 50 (150 549)Profit for the year 2 711 334 (8 054) 2 703 280 600 278 29 898 630 176Attributable to:
Owners of the holding company 2 651 542 51 738 2 703 280 630 164 12 630 176Non-controlling interests 59 792 (59 792) – (29 886) 29 886 –
Other comprehensive (loss) Items that will be reclassified subsequently to profit and lossTaxation relating to components of other comprehensive income 2 – 2 (11 269) (38) (11 307)Other comprehensive income (loss) for the year net of taxation (4 648) – (4 648) (129 096) (38) (129 134)Total comprehensive income for the year 2 706 686 (8 054) 2 698 632 471 182 29 860 501 042 Attributable to:
Owners of the holding company 2 646 894 51 738 2 698 632 501 068 (26) 501 042 Non-controlling interests 59 792 (59 792) – (29 886) 29 886 –
Earnings per share Basic (cents) 377.2 7.3 384.5 89.7 – 89.7 Diluted (cents) 374.2 7.3 381.5 89.0 – 89.0
ATTACQ SUMMARISED PROVISIONAL CONSOLIDATED FINANCIAL RESULTS FOR THE YEAR ENDED 30 JUNE 2019 15 /
As reported Audited30 June
2018 Restatement
RestatedAudited30 June
2018
As reported Audited30 June
2017 Restatement
RestatedAudited
1 July2017
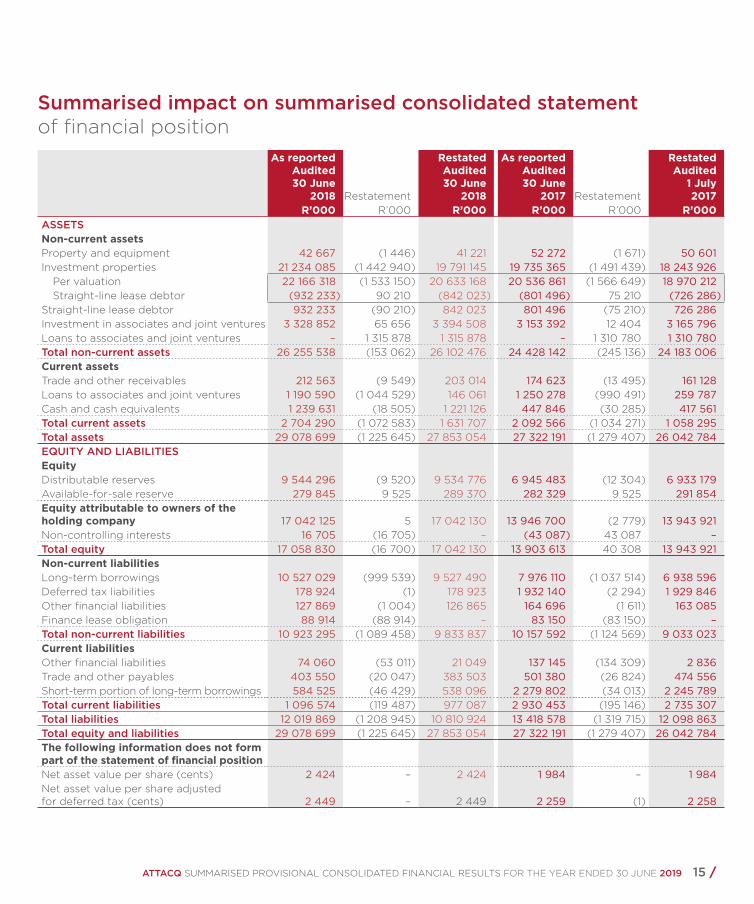
R’000 R’000 R’000 R’000 R’000 R’000ASSETSNon-current assetsProperty and equipment 42 667 (1 446) 41 221 52 272 (1 671) 50 601 Investment properties 21 234 085 (1 442 940) 19 791 145 19 735 365 (1 491 439) 18 243 926
Per valuation 22 166 318 (1 533 150) 20 633 168 20 536 861 (1 566 649) 18 970 212 Straight-line lease debtor (932 233) 90 210 (842 023) (801 496) 75 210 (726 286)
Straight-line lease debtor 932 233 (90 210) 842 023 801 496 (75 210) 726 286 Investment in associates and joint ventures 3 328 852 65 656 3 394 508 3 153 392 12 404 3 165 796 Loans to associates and joint ventures – 1 315 878 1 315 878 – 1 310 780 1 310 780 Total non-current assets 26 255 538 (153 062) 26 102 476 24 428 142 (245 136) 24 183 006 Current assetsTrade and other receivables 212 563 (9 549) 203 014 174 623 (13 495) 161 128 Loans to associates and joint ventures 1 190 590 (1 044 529) 146 061 1 250 278 (990 491) 259 787 Cash and cash equivalents 1 239 631 (18 505) 1 221 126 447 846 (30 285) 417 561 Total current assets 2 704 290 (1 072 583) 1 631 707 2 092 566 (1 034 271) 1 058 295 Total assets 29 078 699 (1 225 645) 27 853 054 27 322 191 (1 279 407) 26 042 784 EQUITY AND LIABILITIESEquityDistributable reserves 9 544 296 (9 520) 9 534 776 6 945 483 (12 304) 6 933 179 Available-for-sale reserve 279 845 9 525 289 370 282 329 9 525 291 854 Equity attributable to owners of the holding company 17 042 125 5 17 042 130 13 946 700 (2 779) 13 943 921 Non-controlling interests 16 705 (16 705) – (43 087) 43 087 – Total equity 17 058 830 (16 700) 17 042 130 13 903 613 40 308 13 943 921 Non-current liabilitiesLong-term borrowings 10 527 029 (999 539) 9 527 490 7 976 110 (1 037 514) 6 938 596 Deferred tax liabilities 178 924 (1) 178 923 1 932 140 (2 294) 1 929 846 Other financial liabilities 127 869 (1 004) 126 865 164 696 (1 611) 163 085 Finance lease obligation 88 914 (88 914) – 83 150 (83 150) – Total non-current liabilities 10 923 295 (1 089 458) 9 833 837 10 157 592 (1 124 569) 9 033 023 Current liabilitiesOther financial liabilities 74 060 (53 011) 21 049 137 145 (134 309) 2 836 Trade and other payables 403 550 (20 047) 383 503 501 380 (26 824) 474 556 Short-term portion of long-term borrowings 584 525 (46 429) 538 096 2 279 802 (34 013) 2 245 789 Total current liabilities 1 096 574 (119 487) 977 087 2 930 453 (195 146) 2 735 307 Total liabilities 12 019 869 (1 208 945) 10 810 924 13 418 578 (1 319 715) 12 098 863 Total equity and liabilities 29 078 699 (1 225 645) 27 853 054 27 322 191 (1 279 407) 26 042 784 The following information does not form part of the statement of financial positionNet asset value per share (cents) 2 424 – 2 424 1 984 – 1 984 Net asset value per share adjusted for deferred tax (cents) 2 449 – 2 449 2 259 (1) 2 258
Summarised impact on summarised consolidated statement of financial position
/ 16 ATTACQ SUMMARISED PROVISIONAL CONSOLIDATED FINANCIAL RESULTS FOR THE YEAR ENDED 30 JUNE 2019
As reported Audited30 June
2018 Restatement
RestatedAudited30 June
2018
As reported Audited30 June
2017 Restatement
RestatedAudited
1 July2017
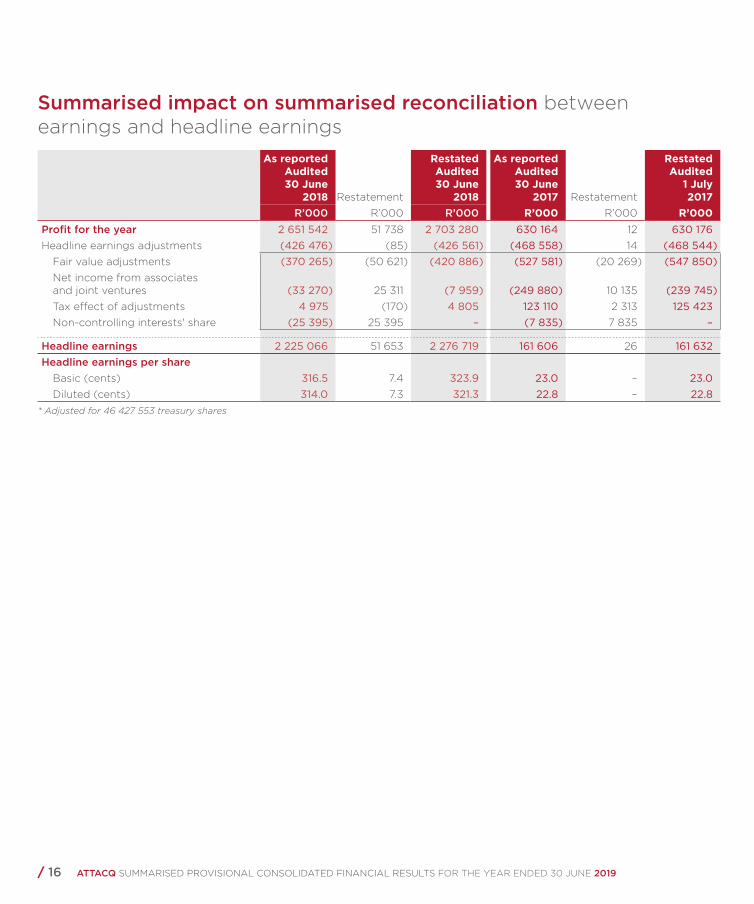
R’000 R’000 R’000 R’000 R’000 R’000Profit for the year 2 651 542 51 738 2 703 280 630 164 12 630 176Headline earnings adjustments (426 476) (85) (426 561) (468 558) 14 (468 544)
Fair value adjustments (370 265) (50 621) (420 886) (527 581) (20 269) (547 850)Net income from associates and joint ventures (33 270) 25 311 (7 959) (249 880) 10 135 (239 745)Tax effect of adjustments 4 975 (170) 4 805 123 110 2 313 125 423 Non-controlling interests' share (25 395) 25 395 – (7 835) 7 835 –
Headline earnings 2 225 066 51 653 2 276 719 161 606 26 161 632Headline earnings per share
Basic (cents) 316.5 7.4 323.9 23.0 – 23.0Diluted (cents) 314.0 7.3 321.3 22.8 – 22.8
* Adjusted for 46 427 553 treasury shares
Summarised impact on summarised reconciliation between earnings and headline earnings

ATTACQ SUMMARISED PROVISIONAL CONSOLIDATED FINANCIAL RESULTS FOR THE YEAR ENDED 30 JUNE 2019 17 /
As reported Audited30 June
2018 Restatement
RestatedAudited30 June
2018
As reported Audited30 June
2017 Restatement
RestatedAudited
1 July2017
R’000 R’000 R’000 R’000 R’000 R’000Cash flow generated from operating activities 380 762 3 827 384 589 124 022 (6 653) 117 369
Cash generated from operations 1 019 788 (108 193) 911 595 1 033 295 (119 200) 914 095 Investment income 119 625 (1 790) 117 835 60 303 (2 696) 57 607Finance costs (899 312) 113 810 (785 502) (934 930) 115 243 (819 687)
Cash flow (utilised in) generated from investing activities (119 105) 3 075 (116 030) 310 427 5 534 315 961
Property and equipment acquired (2 874) 346 (2 528) (27 319) 1 395 (25 924)Investment properties acquired (738 927) 2 729 (736 198) (1 098 009) 4 139 (1 093 870)
Cash flow generated from (utilised in) financing activities 530 128 4 878 535 006 (423 884) (11 806) (435 690)
Long-term borrowings repaid (2 895 275) 21 093 (2 874 182) (3 254 770) 9 604 (3 245 166)Loans to associates and joint ventures (advanced) repaid 130 649 (16 215) 114 434 468 643 8 875 477 518 Loss of control of subsidiary – – – – (30 285) (30 285)
Total cash movement for the year 791 785 11 780 803 565 10 565 (12 925) (2 360)Cash at the beginning of the year 447 846 (30 285) 417 561 437 281 (17 360) 419 921 Total cash at the end of the year 1 239 631 (18 505) 1 221 126 447 846 (30 285) 417 561
Summarised impact on summarised consolidated statement of cash flows

/ 18 ATTACQ SUMMARISED PROVISIONAL CONSOLIDATED FINANCIAL RESULTS FOR THE YEAR ENDED 30 JUNE 2019
Summarised impact on summarised reconciliation of profit for the year to distributable earnings
As reportedAudited3O June
2018 Restatement
RestatedAudited30 June
2018R’000 R’000 R'000
Profit for the year attributable to Attacq’s shareholders 2 651 542 51 738 2 703 280 Fair value adjustments (370 265) (50 621) (420 886)Net income from associates and joint ventures (81 706) 3 614 (78 092)Non-controlling interests' share of fair value adjustments (25 395) 25 395 – Straight-line lease income adjustments (95 967) 7 500 (88 467)
Adjustment for net non-cash interest from associates (87 613) (40 666) (128 279)Depreciation and amortisation 40 335 (571) 39 764 Finance lease interest 3 784 (3 784) – Write-off of other trade and receivable 52 492 (4 520) 47 972 Write-off of loan, net of non-controlling interest (56 178) 56 178 – Non-cash interest accrued 7 536 (7 536) – Deferred taxation (1 771 676) 2 293 (1 769 383)Actual finance lease payments (773) 773 – Distributable earnings for the year 527 384 39 793 567 177
Distributable earnings per share Basic (cents) 75.0 5.7 80.7 Diluted (cents) 74.4 5.6 80.0
ATTACQ SUMMARISED PROVISIONAL CONSOLIDATED FINANCIAL RESULTS FOR THE YEAR ENDED 30 JUNE 2019 19 /
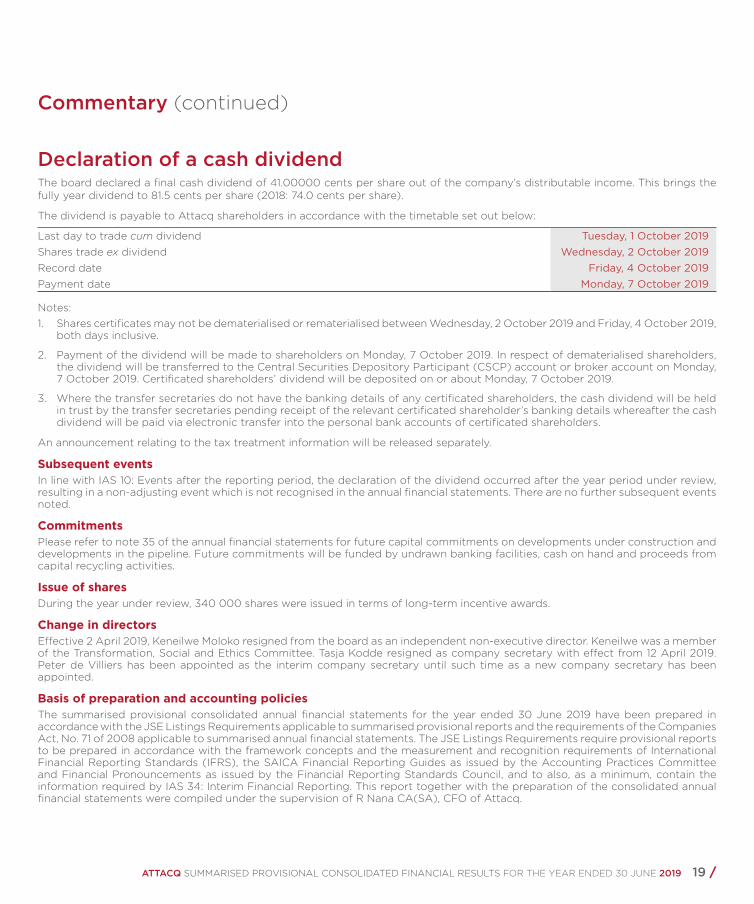
Declaration of a cash dividend The board declared a final cash dividend of 41.00000 cents per share out of the company’s distributable income. This brings the fully year dividend to 81.5 cents per share (2018: 74.0 cents per share).
The dividend is payable to Attacq shareholders in accordance with the timetable set out below:
Last day to trade cum dividend Tuesday, 1 October 2019Shares trade ex dividend Wednesday, 2 October 2019Record date Friday, 4 October 2019Payment date Monday, 7 October 2019
Notes: 1. Shares certificates may not be dematerialised or rematerialised between Wednesday, 2 October 2019 and Friday, 4 October 2019,
both days inclusive.
2. Payment of the dividend will be made to shareholders on Monday, 7 October 2019. In respect of dematerialised shareholders, the dividend will be transferred to the Central Securities Depository Participant (CSCP) account or broker account on Monday, 7 October 2019. Certificated shareholders’ dividend will be deposited on or about Monday, 7 October 2019.
3. Where the transfer secretaries do not have the banking details of any certificated shareholders, the cash dividend will be held in trust by the transfer secretaries pending receipt of the relevant certificated shareholder’s banking details whereafter the cash dividend will be paid via electronic transfer into the personal bank accounts of certificated shareholders.
An announcement relating to the tax treatment information will be released separately.
Subsequent eventsIn line with IAS 10: Events after the reporting period, the declaration of the dividend occurred after the year period under review, resulting in a non-adjusting event which is not recognised in the annual financial statements. There are no further subsequent events noted.
CommitmentsPlease refer to note 35 of the annual financial statements for future capital commitments on developments under construction and developments in the pipeline. Future commitments will be funded by undrawn banking facilities, cash on hand and proceeds from capital recycling activities.
Issue of sharesDuring the year under review, 340 000 shares were issued in terms of long-term incentive awards.
Change in directorsEffective 2 April 2019, Keneilwe Moloko resigned from the board as an independent non-executive director. Keneilwe was a member of the Transformation, Social and Ethics Committee. Tasja Kodde resigned as company secretary with effect from 12 April 2019. Peter de Villiers has been appointed as the interim company secretary until such time as a new company secretary has been appointed.
Basis of preparation and accounting policiesThe summarised provisional consolidated annual financial statements for the year ended 30 June 2019 have been prepared in accordance with the JSE Listings Requirements applicable to summarised provisional reports and the requirements of the Companies Act, No. 71 of 2008 applicable to summarised annual financial statements. The JSE Listings Requirements require provisional reports to be prepared in accordance with the framework concepts and the measurement and recognition requirements of International Financial Reporting Standards (IFRS), the SAICA Financial Reporting Guides as issued by the Accounting Practices Committee and Financial Pronouncements as issued by the Financial Reporting Standards Council, and to also, as a minimum, contain the information required by IAS 34: Interim Financial Reporting. This report together with the preparation of the consolidated annual financial statements were compiled under the supervision of R Nana CA(SA), CFO of Attacq.
Commentary (continued)
/ 20 ATTACQ SUMMARISED PROVISIONAL CONSOLIDATED FINANCIAL RESULTS FOR THE YEAR ENDED 30 JUNE 2019
The accounting policies applied in the preparation of the consolidated annual financial statements, from which the summarised consolidated annual financial statements were derived, are in terms of IFRS and are consistent with the accounting policies applied in the preparation of the previous consolidated annual financial statements, with the exception of the following:
• the adoption of new and revised standards i.e. IFRS 9: Financial Instruments and IFRS 15: Revenue from contracts with customers which became effective during the year. Other than the enhanced disclosures required, the amendments to the applicable accounting standards and adoption thereof did not have a material impact on the group’s annual financial statements.
• Accounting error corrected by deconsolidating Nieuwtown and Majestic.
• Accounting error corrected on previous treatment of non-controlling interest of Nieuwtown in calculating distributable earnings.
• Accounting error in discounting intercompany loans not payable on demand.
• Accounting error in classification of AttAfrica and Gruppo loans.
• Accounting error in classification in Nieuwtown loan.
HEPS for the year ended 30 June 2018 has been restated in respect of the deconsolidating of Nieuwtown and Majestic.
The consolidated annual financial statements have been restated in terms of IAS 8: Accounting Policies, Changes in Accounting Estimates and Errors. Refer to note 43 of the consolidated annual financial statements for the disclosure on these restatements.
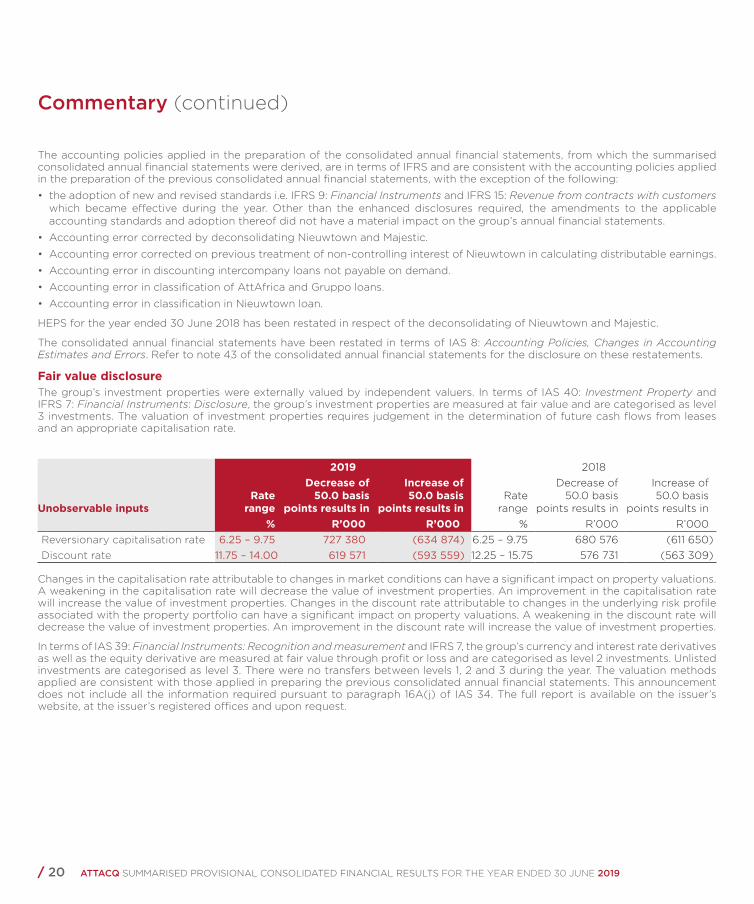
Fair value disclosureThe group’s investment properties were externally valued by independent valuers. In terms of IAS 40: Investment Property and IFRS 7: Financial Instruments: Disclosure, the group’s investment properties are measured at fair value and are categorised as level 3 investments. The valuation of investment properties requires judgement in the determination of future cash flows from leases and an appropriate capitalisation rate.
2019 2018
Unobservable inputsRate
range
Decrease of 50.0 basis
points results in
Increase of 50.0 basis
points results in Rate
range
Decrease of 50.0 basis
points results in
Increase of 50.0 basis
points results in % R’000 R’000 % R’000 R’000
Reversionary capitalisation rate 6.25 – 9.75 727 380 (634 874) 6.25 – 9.75 680 576 (611 650)Discount rate 11.75 – 14.00 619 571 (593 559) 12.25 – 15.75 576 731 (563 309)
Changes in the capitalisation rate attributable to changes in market conditions can have a significant impact on property valuations. A weakening in the capitalisation rate will decrease the value of investment properties. An improvement in the capitalisation rate will increase the value of investment properties. Changes in the discount rate attributable to changes in the underlying risk profile associated with the property portfolio can have a significant impact on property valuations. A weakening in the discount rate will decrease the value of investment properties. An improvement in the discount rate will increase the value of investment properties.
In terms of IAS 39: Financial Instruments: Recognition and measurement and IFRS 7, the group’s currency and interest rate derivatives as well as the equity derivative are measured at fair value through profit or loss and are categorised as level 2 investments. Unlisted investments are categorised as level 3. There were no transfers between levels 1, 2 and 3 during the year. The valuation methods applied are consistent with those applied in preparing the previous consolidated annual financial statements. This announcement does not include all the information required pursuant to paragraph 16A(j) of IAS 34. The full report is available on the issuer’s website, at the issuer’s registered offices and upon request.
Commentary (continued)
ATTACQ SUMMARISED PROVISIONAL CONSOLIDATED FINANCIAL RESULTS FOR THE YEAR ENDED 30 JUNE 2019 21 /
Audit reportThe auditor, Deloitte & Touche, has issued its opinion on Attacq’s audited consolidated annual financial statements for the year ended 30 June 2019. The audit was conducted in accordance with International Standards on Auditing. Deloitte & Touche has issued an unmodified opinion.
A copy of the auditor’s report together with a copy of the audited consolidated annual financial statements is available for inspection at the company’s registered office and on the company’s website (www.attacq.co.za).
These summarised provisional consolidated annual financial statements have been derived from the group’s audited consolidated annual financial statements and are consistent in all material respects with the group’s audited consolidated annual financial statements for the year ended 30 June 2019, but are not themselves audited. The directors take full responsibility for the preparation of these summarised provisional consolidated annual financial results and confirm that the financial information has been correctly extracted from the underlying audited consolidated annual financial statements. Any reference to future financial information included in this announcement has not been reviewed or reported on by the auditor. The auditor does not necessarily report on all the information contained in this announcement. Shareholders are advised that, in order to obtain a full understanding of the nature of the auditor’s engagement, they should obtain a copy of the auditor’s report together with the audited consolidated annual financial statements for the year ended as at 30 June 2019 from the company’s registered office or from the company’s website.
On behalf of the board
P Tredoux M HammanChairman CEO
10 September 2019
/ 22 ATTACQ SUMMARISED PROVISIONAL CONSOLIDATED FINANCIAL RESULTS FOR THE YEAR ENDED 30 JUNE 2019
RestatedAudited Audited30 June 30 June
2019 2018R’000 R’000
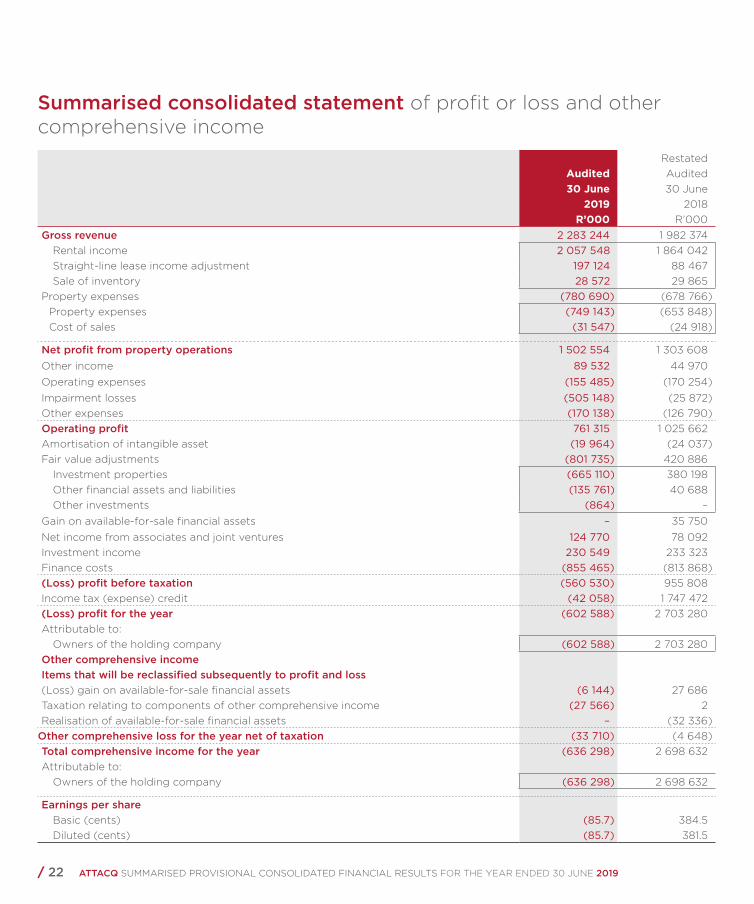
Gross revenue 2 283 244 1 982 374 Rental income 2 057 548 1 864 042 Straight-line lease income adjustment 197 124 88 467 Sale of inventory 28 572 29 865
Property expenses (780 690) (678 766)Property expenses (749 143) (653 848)Cost of sales (31 547) (24 918)
Net profit from property operations 1 502 554 1 303 608 Other income 89 532 44 970 Operating expenses (155 485) (170 254)Impairment losses (505 148) (25 872)Other expenses (170 138) (126 790)Operating profit 761 315 1 025 662 Amortisation of intangible asset (19 964) (24 037)Fair value adjustments (801 735) 420 886
Investment properties (665 110) 380 198 Other financial assets and liabilities (135 761) 40 688 Other investments (864) –
Gain on available-for-sale financial assets – 35 750 Net income from associates and joint ventures 124 770 78 092 Investment income 230 549 233 323 Finance costs (855 465) (813 868)(Loss) profit before taxation (560 530) 955 808 Income tax (expense) credit (42 058) 1 747 472 (Loss) profit for the year (602 588) 2 703 280 Attributable to:
Owners of the holding company (602 588) 2 703 280 Other comprehensive incomeItems that will be reclassified subsequently to profit and loss(Loss) gain on available-for-sale financial assets (6 144) 27 686 Taxation relating to components of other comprehensive income (27 566) 2 Realisation of available-for-sale financial assets – (32 336)
Other comprehensive loss for the year net of taxation (33 710) (4 648)Total comprehensive income for the year (636 298) 2 698 632 Attributable to:
Owners of the holding company (636 298) 2 698 632
Earnings per share Basic (cents) (85.7) 384.5 Diluted (cents) (85.7) 381.5
Summarised consolidated statement of profit or loss and other comprehensive income
ATTACQ SUMMARISED PROVISIONAL CONSOLIDATED FINANCIAL RESULTS FOR THE YEAR ENDED 30 JUNE 2019 23 /
Restated RestatedAudited Audited Audited30 June 30 June 1 July
2019 2018 2017R’000 R’000 R’000
ASSETSNon-current assets
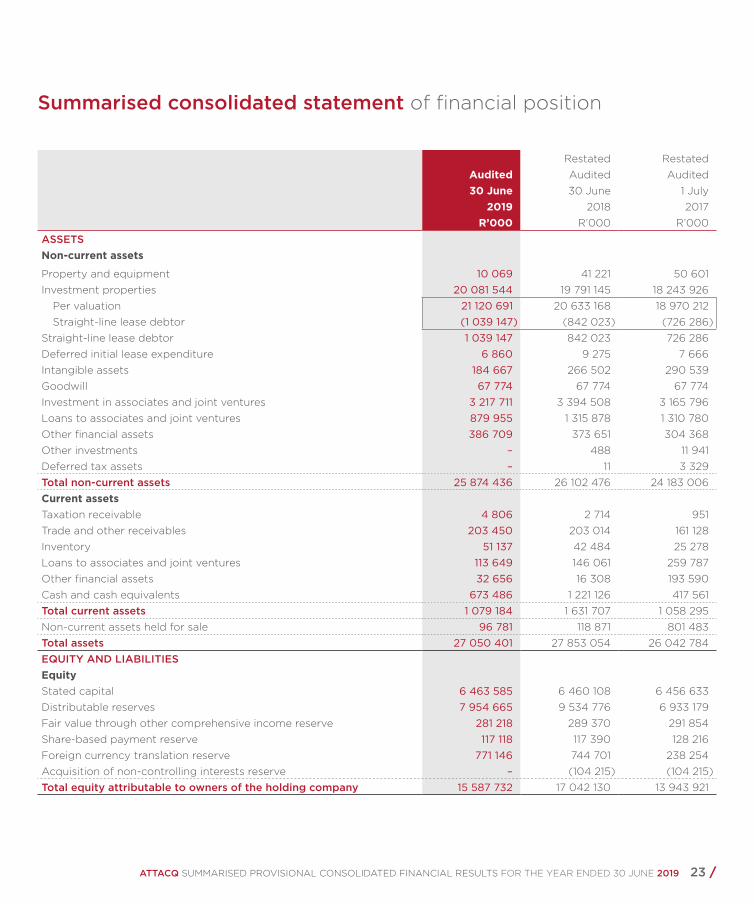
Property and equipment 10 069 41 221 50 601 Investment properties 20 081 544 19 791 145 18 243 926
Per valuation 21 120 691 20 633 168 18 970 212 Straight-line lease debtor (1 039 147) (842 023) (726 286)
Straight-line lease debtor 1 039 147 842 023 726 286 Deferred initial lease expenditure 6 860 9 275 7 666 Intangible assets 184 667 266 502 290 539 Goodwill 67 774 67 774 67 774 Investment in associates and joint ventures 3 217 711 3 394 508 3 165 796 Loans to associates and joint ventures 879 955 1 315 878 1 310 780 Other financial assets 386 709 373 651 304 368 Other investments – 488 11 941 Deferred tax assets – 11 3 329 Total non-current assets 25 874 436 26 102 476 24 183 006 Current assetsTaxation receivable 4 806 2 714 951 Trade and other receivables 203 450 203 014 161 128 Inventory 51 137 42 484 25 278 Loans to associates and joint ventures 113 649 146 061 259 787 Other financial assets 32 656 16 308 193 590 Cash and cash equivalents 673 486 1 221 126 417 561 Total current assets 1 079 184 1 631 707 1 058 295 Non-current assets held for sale 96 781 118 871 801 483 Total assets 27 050 401 27 853 054 26 042 784 EQUITY AND LIABILITIESEquityStated capital 6 463 585 6 460 108 6 456 633 Distributable reserves 7 954 665 9 534 776 6 933 179 Fair value through other comprehensive income reserve 281 218 289 370 291 854 Share-based payment reserve 117 118 117 390 128 216 Foreign currency translation reserve 771 146 744 701 238 254 Acquisition of non-controlling interests reserve – (104 215) (104 215)Total equity attributable to owners of the holding company 15 587 732 17 042 130 13 943 921
Summarised consolidated statement of financial position
/ 24 ATTACQ SUMMARISED PROVISIONAL CONSOLIDATED FINANCIAL RESULTS FOR THE YEAR ENDED 30 JUNE 2019
Restated RestatedAudited Audited Audited30 June 30 June 1 July
2019 2018 2017R’000 R’000 R’000
Non-current liabilitiesLong-term borrowings 10 203 134 9 527 490 6 938 596 Deferred tax liabilities 238 539 178 923 1 929 846 Other financial liabilities 268 112 126 865 163 085 Cash-settled share-based payments 537 559 1 496 Total non-current liabilities 10 710 322 9 833 837 9 033 023 Current liabilitiesOther financial liabilities 29 439 21 049 2 836 Taxation payable 1 228 1 496 7 665 Cash-settled share-based payments 89 747 1 684 Trade and other payables 389 690 383 503 474 556 Provisions 18 304 32 196 2 777 Short-term portion of long-term borrowings 259 611 538 096 2 245 789 Total current liabilities 698 361 977 087 2 735 307 Liabilities directly associated with non-current assets held for sale 53 986 – 330 533 Total liabilities 11 462 669 10 810 924 12 098 863 Total equity and liabilities 27 050 401 27 853 054 26 042 784
The following information does not form part of the statement of financial positionNet asset value per share (cents) 2 216 2 424 1 984
Summarised consolidated statement of financial position (continued)
ATTACQ SUMMARISED PROVISIONAL CONSOLIDATED FINANCIAL RESULTS FOR THE YEAR ENDED 30 JUNE 2019 25 /
RestatedAudited Audited30 June 30 June
2019 2018R’000 R’000
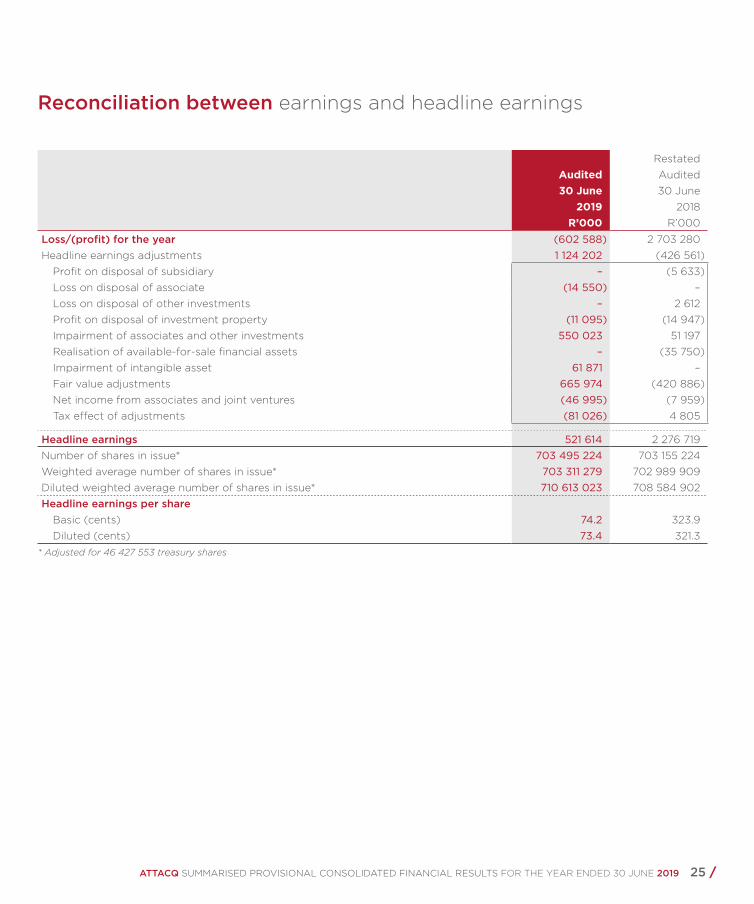
Loss/(profit) for the year (602 588) 2 703 280 Headline earnings adjustments 1 124 202 (426 561)
Profit on disposal of subsidiary – (5 633)Loss on disposal of associate (14 550) – Loss on disposal of other investments – 2 612 Profit on disposal of investment property (11 095) (14 947)Impairment of associates and other investments 550 023 51 197 Realisation of available-for-sale financial assets – (35 750)Impairment of intangible asset 61 871 – Fair value adjustments 665 974 (420 886)Net income from associates and joint ventures (46 995) (7 959)Tax effect of adjustments (81 026) 4 805
Headline earnings 521 614 2 276 719 Number of shares in issue* 703 495 224 703 155 224 Weighted average number of shares in issue* 703 311 279 702 989 909 Diluted weighted average number of shares in issue* 710 613 023 708 584 902 Headline earnings per share
Basic (cents) 74.2 323.9 Diluted (cents) 73.4 321.3
* Adjusted for 46 427 553 treasury shares
Reconciliation between earnings and headline earnings

/ 26 ATTACQ SUMMARISED PROVISIONAL CONSOLIDATED FINANCIAL RESULTS FOR THE YEAR ENDED 30 JUNE 2019
RestatedAudited Audited30 June 30 June
2019 2018R’000 R’000
Cash flow generated from operating activities 653 327 384 589 Cash generated from operations 1 170 806 911 595 Investment income 186 552 117 835Dividend income 191 045 170 504Finance costs (868 330) (785 502)Settlement of cash-settled share-based payments (14 389) – Taxation paid (12 357) (29 843)
Cash flow utilised in investing activities (819 409) (116 030)Property and equipment acquired (3 591) (2 528)Property and equipment disposed – 284 Investment properties acquired (907 330) (736 198)Investment properties disposed – 62 584 Associates and joint ventures acquired – (2 667)Associates and joint ventures disposed 96 179 253 977 Other investments disposed – 11 969 Other financial assets (raised) repaid (27 072) 98 074 Additions to deferred initial lease expenditure (3 536) (3 804)Cash flow relating to non-current assets held for sale 25 941 202 279
Cash flow (utilised in) generated from financing activities (381 558) 535 006Capital raised 3 477 3 475 Dividends paid (805 250) –Settlement of share-based payment – (13 678)Long-term borrowings raised 1 599 898 3 358 695 Long-term borrowings repaid (1 194 443) (2 874 182)Loans to associates and joint ventures repaid 884 114 434 Loss of control of subsidiary – – Other financial liabilities raised (repaid) 13 876 (53 738)
Total cash movement for the year (547 640) 803 565 Cash at the beginning of the year 1 221 126 417 561 Total cash at the end of the year 673 486 1 221 126
Summarised consolidated statement of cash flows

ATTACQ SUMMARISED PROVISIONAL CONSOLIDATED FINANCIAL RESULTS FOR THE YEAR ENDED 30 JUNE 2019 27 /
Stat
ed
cap
ital
Dis
trib
utab
lere
serv
esFV
OC
Ire
serv
e
Shar
e-b
ased
pay
men
tre
serv
e
Fore
ign
cur
renc
ytr
ansl
atio
nre
serv
e
Acq
uisi
tio
n o
f no
n-co
ntro
lling
inte
rest
s r
eser
ve
Eq
uity
att
rib
utab
leto
ow
ners
of
the
hold
ing
co
mp
any
No
n-co
ntro
lling
inte
rest
sTo
tal
equi
tyR
’00
0R
’00
0R
’00
0R
’00
0R
’00
0R
’00
0R
’00
0R
’00
0R
’00
0A
udit
ed b
alan
ce a
s re
po
rted
at
1 Ju
ly 2
017
6 4
56 6
33
6
94
5 4
83
2
82
329
1
28 2
16
23
8 2
54
(10
4 2
15)
13
94
6 7
00
(
43
08
7) 1
3 9
03
613
R
esta
tem
ent
– (
12 3
04
)9
525
––
–(2
779
)4
3 0
87
40
30
8B
alan
ce a
t 1
July
20
17 –
re
stat
ed 6
456
63
3
6 9
33
179
2
91
854
1
28 2
16
23
8 2
54
(10
4 2
15)
13
94
3 9
21
–
13
94
3 9
21
Tota
l co
mp
rehe
nsiv
e in
com
e –
2
70
3 2
80
(
4 6
48
) –
–
–
2
69
8 6
32
–
2 6
98
63
2 P
rofi
t fo
r th
e p
erio
d –
2
70
3 2
80
–
–
–
–
2
70
3 2
80
–
2
70
3 2
80
O
ther
co
mp
reh
ensi
ve
pro
fit
–
–
(4
64
8)
–
–
–
(4
64
8)
–
(4
64
8)
Fo
reig
n c
urr
ency
tra
nsl
atio
n
rese
rve
–
–
–
–
50
6 4
47
–
50
6 4
47
–
50
6 4
47
Der
eco
gn
itio
n o
f n
on
-co
ntr
olli
ng
inte
rest
–
–
–
–
–
–
–
–
–
Issu
e o
f sh
ares
3 4
75
–
–
–
–
–
3 4
75
–
3 4
75
Pre
sent
val
ue o
f lo
ans
to
ass
oci
ate
– (
48
954
)–
––
– (
48
954
)–
(4
8 9
54)
Der
eco
gni
tio
n o
f re
serv
es
due
to
sal
e o
f su
bsi
dia
ry –
(
59 6
98
) 2
16
4
–
–
–
(57
53
4)
–
(57
53
4)
Tran
sfer
bet
wee
n re
serv
es –
6
96
9
–
(15
077
) –
–
(
8 1
08
) –
(
8 1
08
)S
ettl
emen
t o
f sh
are-
bas
ed
pay
men
t tr
ansa
ctio
n –
–
–
(
14 9
61)
–
–
(14
96
1) –
(
14 9
61)
Rec
og
nit
ion
of
shar
e-b
ased
p
aym
ent
rese
rve
–
–
–
19
212
–
–
1
9 2
12
–
19
212
U
naud
ited
bal
ance
at
30
Jun
e 20
18 –
res
tate
d 6
46
0 1
08
9
53
4 7
76
28
9 3
70
117
39
0
74
4 7
01
(10
4 2
15)
17
04
2 13
0
–
17
04
2 13
0
IFR
S 9
res
tate
men
ts 8
0 5
18
(9
8 2
80
) (
17 7
62)
(17
76
2)B
alan
ce a
t
30 J
une
2018
– r
esta
ted
6 4
60
10
8
9 6
15 2
94
1
91
09
0
117
39
0
74
4 7
01
(10
4 2
15)
17
024
36
8
–
17
024
36
8
Tota
l co
mp
rehe
nsiv
e in
com
e–
(6
02
588
) (
33 7
10)
––
– (
636
29
8)
– (
636
29
8)
Pro
fit
for
the
per
iod
– (
60
2 58
8)
––
––
(6
02
588
)–
(6
02
588
)O
ther
co
mp
reh
ensi
ve lo
ss–
– (
33 7
10)
––
– (
33 7
10)
– (
33 7
10)
Fo
reig
n c
urr
ency
tra
nsl
atio
n
rese
rve
––
––
26
44
5 –
26
44
5 –
26
44
5 Is
sue
of
shar
es 3
477
–
––
––
3 4
77
– 3
477
S
ettl
emen
t o
f sh
are-
bas
ed
pay
men
t tr
ansa
ctio
n–
––
(14
86
7)–
– (
14 8
67)
– (
14 8
67)
Div
iden
ds
– (
80
5 25
0)
––
––
(8
05
250
)–
(8
05
250
)Tr
ansf
er o
f re
serv
e o
n
dis
po
sal o
f in
vest
men
ts –
(
123
838
) 1
23 8
38
–
–
–
–
–
–
Tran
sfer
of
rese
rve
fro
m
acq
uisi
tio
n o
f no
n-co
ntro
lling
in
tere
st r
eser
ve –
(
104
215
) –
–
–
1
04
215
–
–
–
Tr
ansf
er o
f sh
are-
bas
ed
pay
men
t re
serv
e o
n ve
stin
g –
7
44
4
–
(7
44
4)
–
–
–
–
–
Pre
sent
val
ue o
f lo
ans
to
ass
oci
ate
(32
18
2) (
32 1
82)
(32
18
2)R
eco
gn
itio
n o
f sh
are-
bas
ed
pay
men
t re
serv
e–
––
22
039
–
– 2
2 0
39
– 2
2 0
39
Bal
ance
at
30 J
une
2019
6 4
63
585
7 9
54 6
65
28
1 21
8
117
118
771
14
6
– 1
5 58
7 73
2 –
15
587
732
Summarised consolidated statement of changes in equity
/ 28 ATTACQ SUMMARISED PROVISIONAL CONSOLIDATED FINANCIAL RESULTS FOR THE YEAR ENDED 30 JUNE 2019
RetailOffice and mixed use Industrial Hotel
Waterfall developments Head office SA Total SA
MASEuropean Rest of Africa
Head office Global Total
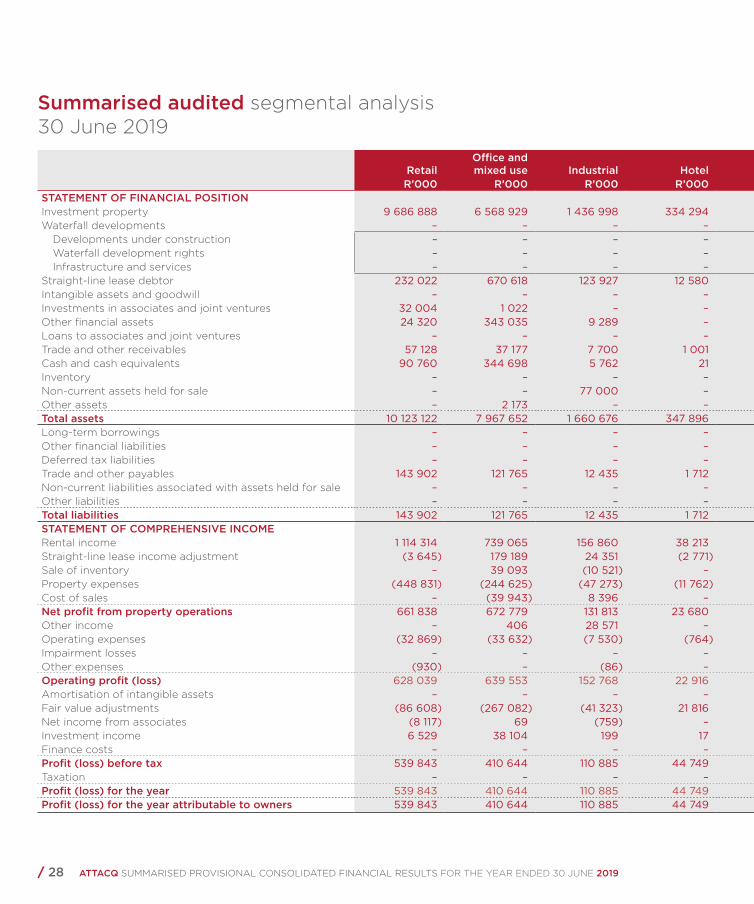
R’000 R’000 R’000 R’000 R’000 R’000 R’000 R’000 R’000 R’000 R’000STATEMENT OF FINANCIAL POSITIONInvestment property 9 686 888 6 568 929 1 436 998 334 294 – 5 000 18 032 109 – – – 18 032 109Waterfall developments – – – – 2 049 435 – 2 049 435 – – – 2 049 435
Developments under construction – – – – 791 276 – 791 276 – – – 791 276Waterfall development rights – – – – 495 972 – 495 972 – – – 495 972Infrastructure and services – – – – 762 187 – 762 187 – – – 762 187
Straight-line lease debtor 232 022 670 618 123 927 12 580 – – 1 039 147 – – – 1 039 147Intangible assets and goodwill – – – – – 252 441 252 441 – – – 252 441Investments in associates and joint ventures 32 004 1 022 – – – 1 191 34 217 3 183 494 – – 3 217 711Other financial assets 24 320 343 035 9 289 – – 33 237 409 881 9 484 – – 419 365Loans to associates and joint ventures – – – – 111 620 242 540 354 160 – 639 444 – 993 604Trade and other receivables 57 128 37 177 7 700 1 001 97 018 3 354 203 378 – – 72 203 450Cash and cash equivalents 90 760 344 698 5 762 21 971 50 650 492 862 – – 180 624 673 486Inventory – – – – 51 137 – 51 137 – – – 51 137Non-current assets held for sale – – 77 000 – 19 018 763 96 781 – – – 96 781Other assets – 2 173 – – – 19 562 21 735 – – – 21 735Total assets 10 123 122 7 967 652 1 660 676 347 896 2 329 199 608 738 23 037 283 3 192 978 639 444 180 696 27 050 401Long-term borrowings – – – – – 9 007 294 9 007 294 – – 1 455 451 10 462 745Other financial liabilities – – – – – 297 551 297 551 – – – 297 551Deferred tax liabilities – – – – – 100 019 100 019 138 520 – – 238 539Trade and other payables 143 902 121 765 12 435 1 712 62 752 30 906 373 472 – 16 218 – 389 690Non-current liabilities associated with assets held for sale – – – – – 53 986 53 986 – – – 53 986Other liabilities – – – – 10 925 7 978 18 903 – – 1 255 20 158Total liabilities 143 902 121 765 12 435 1 712 73 677 9 497 734 9 851 225 138 520 16 218 1 456 706 11 462 669STATEMENT OF COMPREHENSIVE INCOMERental income 1 114 314 739 065 156 860 38 213 – 9 096 2 057 548 – – – 2 057 548Straight-line lease income adjustment (3 645) 179 189 24 351 (2 771) – – 197 124 – – – 197 124Sale of inventory – 39 093 (10 521) – – – 28 572 – – – 28 572Property expenses (448 831) (244 625) (47 273) (11 762) – 3 348 (749 143) – – – (749 143)Cost of sales – (39 943) 8 396 – – – (31 547) – – – (31 547)Net profit from property operations 661 838 672 779 131 813 23 680 – 12 444 1 502 554 – – – 1 502 554Other income – 406 28 571 – – 3 898 32 875 21 164 33 313 2 180 89 532Operating expenses (32 869) (33 632) (7 530) (764) – (80 690) (155 485) – – – (155 485)Impairment losses – – – – (29 975) (55 865) (85 840) – (419 308) – (505 148)Other expenses (930) – (86) – (26 589) (66 823) (94 428) – (75 710) – (170 138)Operating profit (loss) 628 039 639 553 152 768 22 916 (56 564) (187 036) 1 199 676 21 164 (461 705) 2 180 761 315Amortisation of intangible assets – – – – – (19 964) (19 964) – – – (19 964)Fair value adjustments (86 608) (267 082) (41 323) 21 816 (291 913) (137 979) (803 089) – – 1 354 (801 735)Net income from associates (8 117) 69 (759) – (1 758) (67 380) (77 945) 204 037 (1 322) – 124 770Investment income 6 529 38 104 199 17 – 66 760 111 609 – 118 940 – 230 549Finance costs – – – – – (820 681) (820 681) (1 003) – (33 781) (855 465)Profit (loss) before tax 539 843 410 644 110 885 44 749 (350 235) (1 166 280) (410 394) 224 198 (344 087) (30 247) (560 530)Taxation – – – – – (26 111) (26 111) (14 287) – (1 660) (42 058)Profit (loss) for the year 539 843 410 644 110 885 44 749 (350 235) (1 192 391) (436 505) 209 911 (344 087) (31 907) (602 588)Profit (loss) for the year attributable to owners 539 843 410 644 110 885 44 749 (350 235) (1 192 391) (436 505) 209 911 (344 087) (31 907) (602 588)
Summarised audited segmental analysis30 June 2019
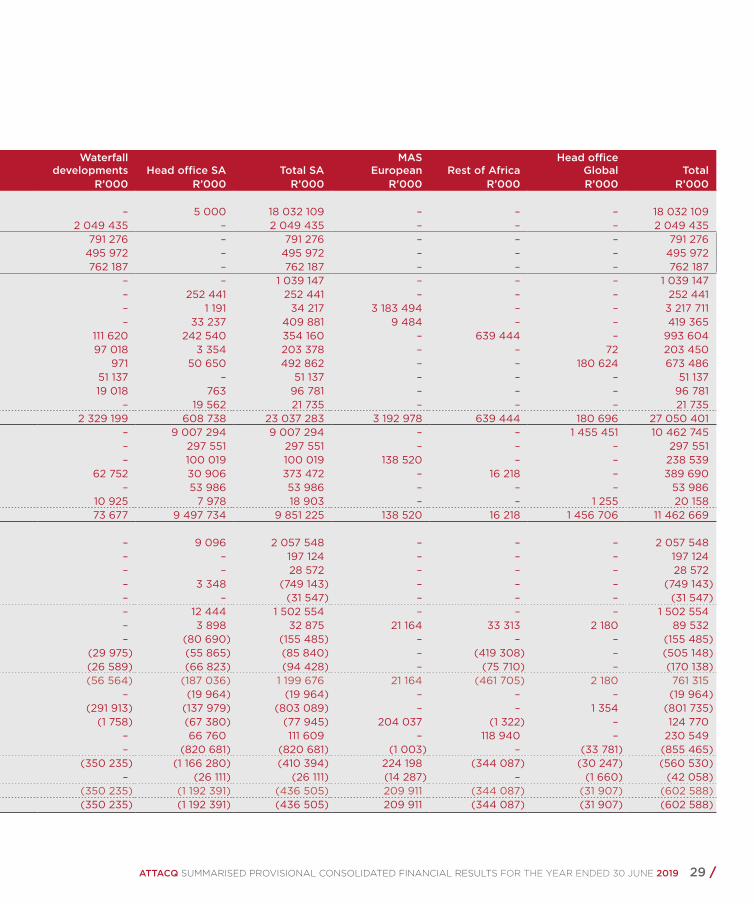
ATTACQ SUMMARISED PROVISIONAL CONSOLIDATED FINANCIAL RESULTS FOR THE YEAR ENDED 30 JUNE 2019 29 /
RetailOffice and mixed use Industrial Hotel
Waterfall developments Head office SA Total SA
MASEuropean Rest of Africa
Head office Global Total
R’000 R’000 R’000 R’000 R’000 R’000 R’000 R’000 R’000 R’000 R’000STATEMENT OF FINANCIAL POSITIONInvestment property 9 686 888 6 568 929 1 436 998 334 294 – 5 000 18 032 109 – – – 18 032 109Waterfall developments – – – – 2 049 435 – 2 049 435 – – – 2 049 435
Developments under construction – – – – 791 276 – 791 276 – – – 791 276Waterfall development rights – – – – 495 972 – 495 972 – – – 495 972Infrastructure and services – – – – 762 187 – 762 187 – – – 762 187
Straight-line lease debtor 232 022 670 618 123 927 12 580 – – 1 039 147 – – – 1 039 147Intangible assets and goodwill – – – – – 252 441 252 441 – – – 252 441Investments in associates and joint ventures 32 004 1 022 – – – 1 191 34 217 3 183 494 – – 3 217 711Other financial assets 24 320 343 035 9 289 – – 33 237 409 881 9 484 – – 419 365Loans to associates and joint ventures – – – – 111 620 242 540 354 160 – 639 444 – 993 604Trade and other receivables 57 128 37 177 7 700 1 001 97 018 3 354 203 378 – – 72 203 450Cash and cash equivalents 90 760 344 698 5 762 21 971 50 650 492 862 – – 180 624 673 486Inventory – – – – 51 137 – 51 137 – – – 51 137Non-current assets held for sale – – 77 000 – 19 018 763 96 781 – – – 96 781Other assets – 2 173 – – – 19 562 21 735 – – – 21 735Total assets 10 123 122 7 967 652 1 660 676 347 896 2 329 199 608 738 23 037 283 3 192 978 639 444 180 696 27 050 401Long-term borrowings – – – – – 9 007 294 9 007 294 – – 1 455 451 10 462 745Other financial liabilities – – – – – 297 551 297 551 – – – 297 551Deferred tax liabilities – – – – – 100 019 100 019 138 520 – – 238 539Trade and other payables 143 902 121 765 12 435 1 712 62 752 30 906 373 472 – 16 218 – 389 690Non-current liabilities associated with assets held for sale – – – – – 53 986 53 986 – – – 53 986Other liabilities – – – – 10 925 7 978 18 903 – – 1 255 20 158Total liabilities 143 902 121 765 12 435 1 712 73 677 9 497 734 9 851 225 138 520 16 218 1 456 706 11 462 669STATEMENT OF COMPREHENSIVE INCOMERental income 1 114 314 739 065 156 860 38 213 – 9 096 2 057 548 – – – 2 057 548Straight-line lease income adjustment (3 645) 179 189 24 351 (2 771) – – 197 124 – – – 197 124Sale of inventory – 39 093 (10 521) – – – 28 572 – – – 28 572Property expenses (448 831) (244 625) (47 273) (11 762) – 3 348 (749 143) – – – (749 143)Cost of sales – (39 943) 8 396 – – – (31 547) – – – (31 547)Net profit from property operations 661 838 672 779 131 813 23 680 – 12 444 1 502 554 – – – 1 502 554Other income – 406 28 571 – – 3 898 32 875 21 164 33 313 2 180 89 532Operating expenses (32 869) (33 632) (7 530) (764) – (80 690) (155 485) – – – (155 485)Impairment losses – – – – (29 975) (55 865) (85 840) – (419 308) – (505 148)Other expenses (930) – (86) – (26 589) (66 823) (94 428) – (75 710) – (170 138)Operating profit (loss) 628 039 639 553 152 768 22 916 (56 564) (187 036) 1 199 676 21 164 (461 705) 2 180 761 315Amortisation of intangible assets – – – – – (19 964) (19 964) – – – (19 964)Fair value adjustments (86 608) (267 082) (41 323) 21 816 (291 913) (137 979) (803 089) – – 1 354 (801 735)Net income from associates (8 117) 69 (759) – (1 758) (67 380) (77 945) 204 037 (1 322) – 124 770Investment income 6 529 38 104 199 17 – 66 760 111 609 – 118 940 – 230 549Finance costs – – – – – (820 681) (820 681) (1 003) – (33 781) (855 465)Profit (loss) before tax 539 843 410 644 110 885 44 749 (350 235) (1 166 280) (410 394) 224 198 (344 087) (30 247) (560 530)Taxation – – – – – (26 111) (26 111) (14 287) – (1 660) (42 058)Profit (loss) for the year 539 843 410 644 110 885 44 749 (350 235) (1 192 391) (436 505) 209 911 (344 087) (31 907) (602 588)Profit (loss) for the year attributable to owners 539 843 410 644 110 885 44 749 (350 235) (1 192 391) (436 505) 209 911 (344 087) (31 907) (602 588)
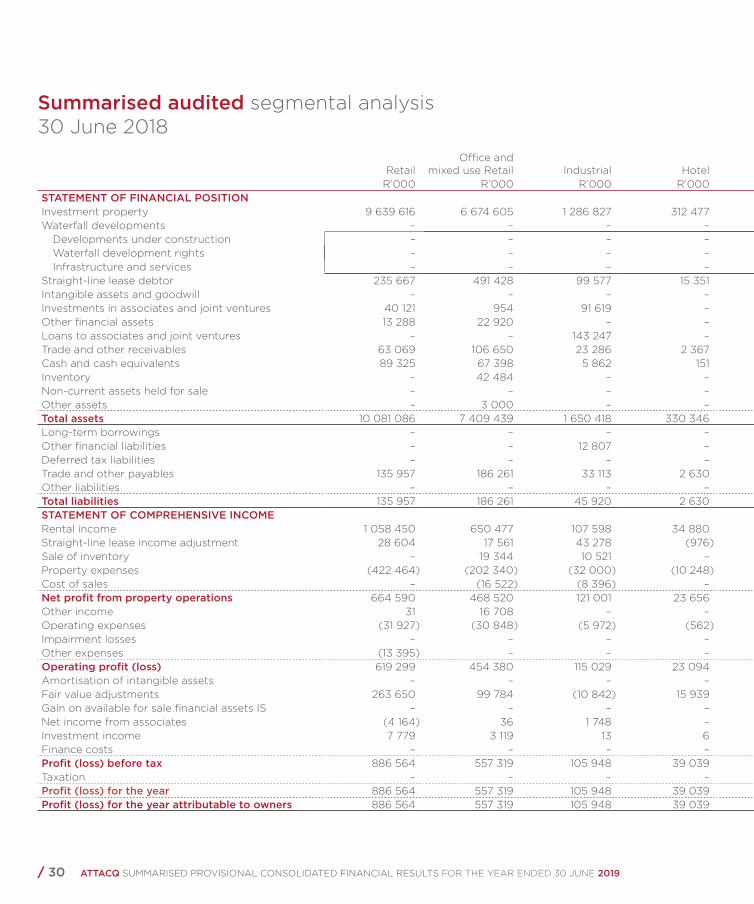
/ 30 ATTACQ SUMMARISED PROVISIONAL CONSOLIDATED FINANCIAL RESULTS FOR THE YEAR ENDED 30 JUNE 2019
Summarised audited segmental analysis 30 June 2018
RetailOffice and
mixed use Retail Industrial HotelWaterfall
developments Head office SA Total SAMAS
European Rest of AfricaHead office
Global TotalR’000 R’000 R’000 R’000 R’000 R’000 R’000 R’000 R’000 R’000 R’000
STATEMENT OF FINANCIAL POSITIONInvestment property 9 639 616 6 674 605 1 286 827 312 477 – 5 000 17 918 525 – – – 17 918 525Waterfall developments – – – – 1 872 620 – 1 872 620 – – – 1 872 620
Developments under construction – – – – 346 441 – 346 441 – – – 346 441Waterfall development rights – – – – 879 324 – 879 324 – – – 879 324Infrastructure and services – – – – 646 855 – 646 855 – – – 646 855
Straight-line lease debtor 235 667 491 428 99 577 15 351 – – 842 023 – – – 842 023Intangible assets and goodwill – – – – – 334 276 334 276 – – – 334 276Investments in associates and joint ventures 40 121 954 91 619 – – 68 038 200 732 3 145 828 47 948 – 3 394 508Other financial assets 13 288 22 920 – – – 353 751 389 959 – – – 389 959Loans to associates and joint ventures – – 143 247 – – 274 163 417 410 – 1 044 529 – 1 461 939Trade and other receivables 63 069 106 650 23 286 2 367 – 7 587 202 959 – – 55 203 014Cash and cash equivalents 89 325 67 398 5 862 151 – 990 152 1 152 888 – – 68 238 1 221 126Inventory – 42 484 – – – – 42 484 – – – 42 484Non-current assets held for sale – – – – 115 149 775 115 924 – – 2 947 118 871Other assets – 3 000 – – – 50 709 53 709 – – – 53 709Total assets 10 081 086 7 409 439 1 650 418 330 346 1 987 769 2 084 451 23 543 509 3 145 828 1 092 477 71 240 27 853 054Long-term borrowings – – – – – 8 634 578 8 634 578 – – 1 431 008 10 065 586Other financial liabilities – – 12 807 – – 133 393 146 200 – – 1 714 147 914Deferred tax liabilities – – – – – 48 840 48 840 130 083 – – 178 923Trade and other payables 135 957 186 261 33 113 2 630 – 25 531 383 492 – – 11 383 503Other liabilities – – – – 25 476 8 026 33 502 – – 1 496 34 998Total liabilities 135 957 186 261 45 920 2 630 25 476 8 850 368 9 246 612 130 083 – 1 434 229 10 810 924STATEMENT OF COMPREHENSIVE INCOMERental income 1 058 450 650 477 107 598 34 880 – 12 637 1 864 042 – – – 1 864 042Straight-line lease income adjustment 28 604 17 561 43 278 (976) – – 88 467 – – – 88 467Sale of inventory – 19 344 10 521 – – – 29 865 – – – 29 865Property expenses (422 464) (202 340) (32 000) (10 248) – 13 204 (653 848) – – – (653 848)Cost of sales – (16 522) (8 396) – – – (24 918) – – – (24 918)Net profit from property operations 664 590 468 520 121 001 23 656 – 25 841 1 303 608 – – – 1 303 608Other income 31 16 708 – – – 23 017 39 756 – 5 214 – 44 970Operating expenses (31 927) (30 848) (5 972) (562) – (95 767) (165 076) – – (5 178) (170 254)Impairment losses – – – – – – – – (25 872) – (25 872)Other expenses (13 395) – – – (49 649) (1 773) (64 817) – (57 618) (4 355) (126 790)Operating profit (loss) 619 299 454 380 115 029 23 094 (49 649) (48 682) 1 113 471 – (78 276) (9 533) 1 025 662Amortisation of intangible assets – – – – – (24 037) (24 037) – – – (24 037)Fair value adjustments 263 650 99 784 (10 842) 15 939 11 667 40 887 421 085 – – (199) 420 886Gain on available for sale financial assets IS – – – – – 35 750 35 750 – – – 35 750Net income from associates (4 164) 36 1 748 – – (284) (2 664) 68 774 908 11 074 78 092Investment income 7 779 3 119 13 6 – 98 005 108 922 – 120 619 3 782 233 323Finance costs – – – – – (779 960) (779 960) – – (33 908) (813 868)Profit (loss) before tax 886 564 557 319 105 948 39 039 (37 982) (678 321) 872 567 68 774 43 251 (28 784) 955 808Taxation – – – – – 1 842 193 1 842 193 (93 297) – (1 424) 1 747 472Profit (loss) for the year 886 564 557 319 105 948 39 039 (37 982) 1 163 872 2 714 760 (24 523) 43 251 (30 208) 2 703 280Profit (loss) for the year attributable to owners 886 564 557 319 105 948 39 039 (37 982) 1 163 872 2 714 760 (24 523) 43 251 (30 208) 2 703 280
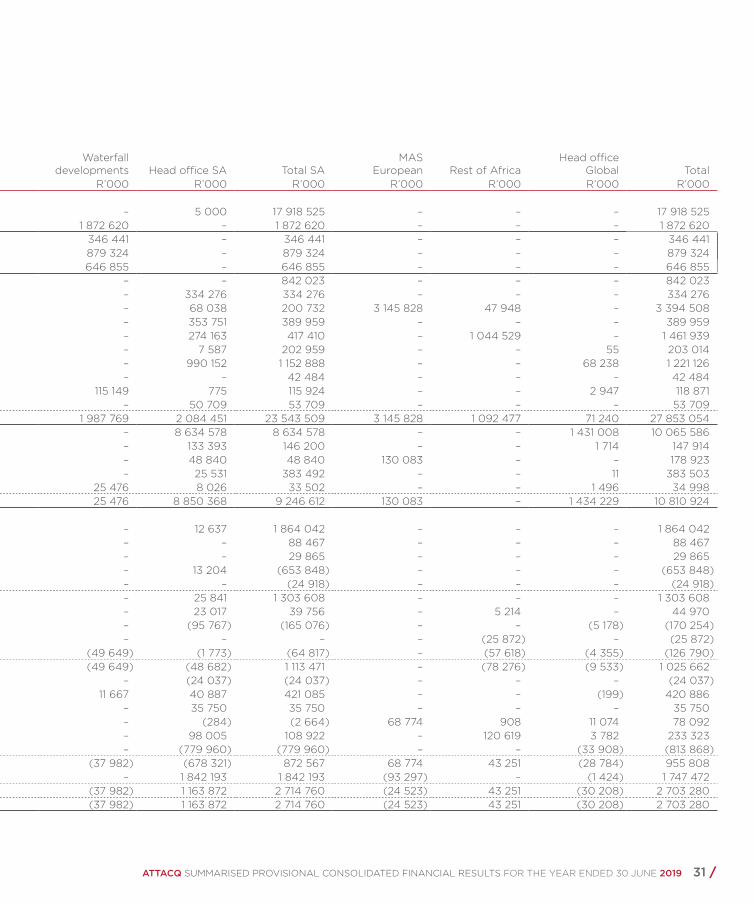
ATTACQ SUMMARISED PROVISIONAL CONSOLIDATED FINANCIAL RESULTS FOR THE YEAR ENDED 30 JUNE 2019 31 /
RetailOffice and
mixed use Retail Industrial HotelWaterfall
developments Head office SA Total SAMAS
European Rest of AfricaHead office
Global TotalR’000 R’000 R’000 R’000 R’000 R’000 R’000 R’000 R’000 R’000 R’000
STATEMENT OF FINANCIAL POSITIONInvestment property 9 639 616 6 674 605 1 286 827 312 477 – 5 000 17 918 525 – – – 17 918 525Waterfall developments – – – – 1 872 620 – 1 872 620 – – – 1 872 620
Developments under construction – – – – 346 441 – 346 441 – – – 346 441Waterfall development rights – – – – 879 324 – 879 324 – – – 879 324Infrastructure and services – – – – 646 855 – 646 855 – – – 646 855
Straight-line lease debtor 235 667 491 428 99 577 15 351 – – 842 023 – – – 842 023Intangible assets and goodwill – – – – – 334 276 334 276 – – – 334 276Investments in associates and joint ventures 40 121 954 91 619 – – 68 038 200 732 3 145 828 47 948 – 3 394 508Other financial assets 13 288 22 920 – – – 353 751 389 959 – – – 389 959Loans to associates and joint ventures – – 143 247 – – 274 163 417 410 – 1 044 529 – 1 461 939Trade and other receivables 63 069 106 650 23 286 2 367 – 7 587 202 959 – – 55 203 014Cash and cash equivalents 89 325 67 398 5 862 151 – 990 152 1 152 888 – – 68 238 1 221 126Inventory – 42 484 – – – – 42 484 – – – 42 484Non-current assets held for sale – – – – 115 149 775 115 924 – – 2 947 118 871Other assets – 3 000 – – – 50 709 53 709 – – – 53 709Total assets 10 081 086 7 409 439 1 650 418 330 346 1 987 769 2 084 451 23 543 509 3 145 828 1 092 477 71 240 27 853 054Long-term borrowings – – – – – 8 634 578 8 634 578 – – 1 431 008 10 065 586Other financial liabilities – – 12 807 – – 133 393 146 200 – – 1 714 147 914Deferred tax liabilities – – – – – 48 840 48 840 130 083 – – 178 923Trade and other payables 135 957 186 261 33 113 2 630 – 25 531 383 492 – – 11 383 503Other liabilities – – – – 25 476 8 026 33 502 – – 1 496 34 998Total liabilities 135 957 186 261 45 920 2 630 25 476 8 850 368 9 246 612 130 083 – 1 434 229 10 810 924STATEMENT OF COMPREHENSIVE INCOMERental income 1 058 450 650 477 107 598 34 880 – 12 637 1 864 042 – – – 1 864 042Straight-line lease income adjustment 28 604 17 561 43 278 (976) – – 88 467 – – – 88 467Sale of inventory – 19 344 10 521 – – – 29 865 – – – 29 865Property expenses (422 464) (202 340) (32 000) (10 248) – 13 204 (653 848) – – – (653 848)Cost of sales – (16 522) (8 396) – – – (24 918) – – – (24 918)Net profit from property operations 664 590 468 520 121 001 23 656 – 25 841 1 303 608 – – – 1 303 608Other income 31 16 708 – – – 23 017 39 756 – 5 214 – 44 970Operating expenses (31 927) (30 848) (5 972) (562) – (95 767) (165 076) – – (5 178) (170 254)Impairment losses – – – – – – – – (25 872) – (25 872)Other expenses (13 395) – – – (49 649) (1 773) (64 817) – (57 618) (4 355) (126 790)Operating profit (loss) 619 299 454 380 115 029 23 094 (49 649) (48 682) 1 113 471 – (78 276) (9 533) 1 025 662Amortisation of intangible assets – – – – – (24 037) (24 037) – – – (24 037)Fair value adjustments 263 650 99 784 (10 842) 15 939 11 667 40 887 421 085 – – (199) 420 886Gain on available for sale financial assets IS – – – – – 35 750 35 750 – – – 35 750Net income from associates (4 164) 36 1 748 – – (284) (2 664) 68 774 908 11 074 78 092Investment income 7 779 3 119 13 6 – 98 005 108 922 – 120 619 3 782 233 323Finance costs – – – – – (779 960) (779 960) – – (33 908) (813 868)Profit (loss) before tax 886 564 557 319 105 948 39 039 (37 982) (678 321) 872 567 68 774 43 251 (28 784) 955 808Taxation – – – – – 1 842 193 1 842 193 (93 297) – (1 424) 1 747 472Profit (loss) for the year 886 564 557 319 105 948 39 039 (37 982) 1 163 872 2 714 760 (24 523) 43 251 (30 208) 2 703 280Profit (loss) for the year attributable to owners 886 564 557 319 105 948 39 039 (37 982) 1 163 872 2 714 760 (24 523) 43 251 (30 208) 2 703 280
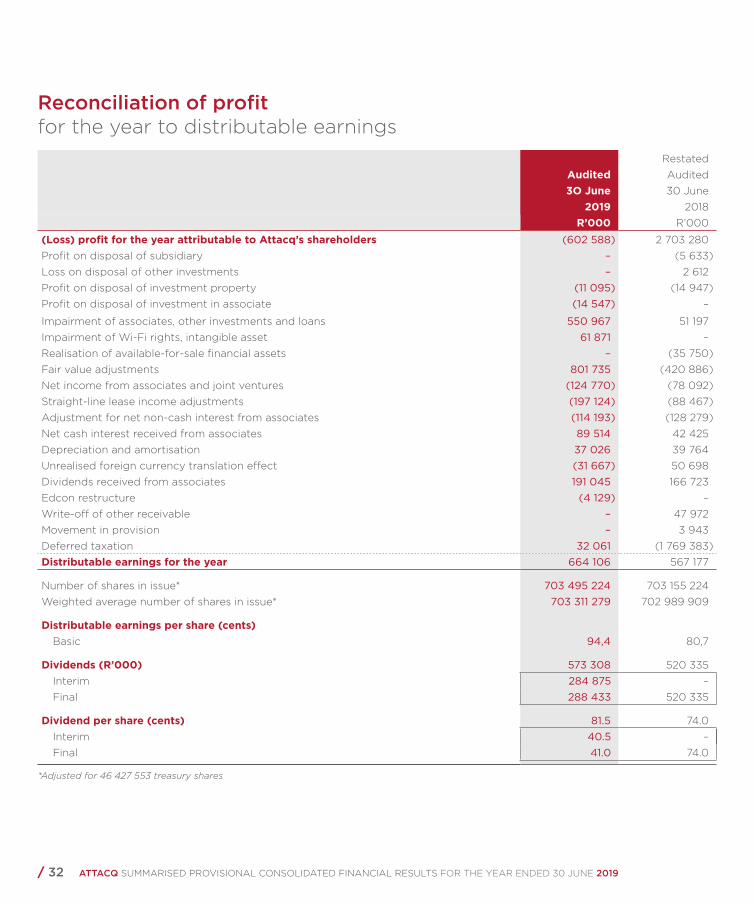
/ 32 ATTACQ SUMMARISED PROVISIONAL CONSOLIDATED FINANCIAL RESULTS FOR THE YEAR ENDED 30 JUNE 2019
Reconciliation of profit for the year to distributable earnings
RestatedAudited Audited3O June 30 June
2019 2018R’000 R’000
(Loss) profit for the year attributable to Attacq’s shareholders (602 588) 2 703 280Profit on disposal of subsidiary – (5 633)Loss on disposal of other investments – 2 612Profit on disposal of investment property (11 095) (14 947)Profit on disposal of investment in associate (14 547) –
Impairment of associates, other investments and loans 550 967 51 197Impairment of Wi-Fi rights, intangible asset 61 871 –Realisation of available-for-sale financial assets – (35 750)Fair value adjustments 801 735 (420 886)Net income from associates and joint ventures (124 770) (78 092)Straight-line lease income adjustments (197 124) (88 467)Adjustment for net non-cash interest from associates (114 193) (128 279)Net cash interest received from associates 89 514 42 425Depreciation and amortisation 37 026 39 764Unrealised foreign currency translation effect (31 667) 50 698Dividends received from associates 191 045 166 723Edcon restructure (4 129) –Write-off of other receivable – 47 972Movement in provision – 3 943Deferred taxation 32 061 (1 769 383)Distributable earnings for the year 664 106 567 177
Number of shares in issue* 703 495 224 703 155 224Weighted average number of shares in issue* 703 311 279 702 989 909
Distributable earnings per share (cents)Basic 94,4 80,7
Dividends (R’000) 573 308 520 335Interim 284 875 –Final 288 433 520 335
Dividend per share (cents) 81.5 74.0Interim 40.5 –Final 41.0 74.0
*Adjusted for 46 427 553 treasury shares

Independent non-executive directorsP Tredoux (Chairman)HR El Haimer (Lead independent)MM du ToitIN MkhariBT NagleS Shaw-TaylorJHP van der Merwe
Executive directorsM Hamman (CEO)R Nana (CFO)JR van Niekerk (COO)
Interim Company secretaryPL de Villiers (CIO)
Attacq Limited (Incorporated in the Republic of South Africa)(Registration number 1997/000543/06)JSE share code: ATTISIN: ZAE000177218(Approved as a REIT by the JSE)(Attacq or company or group)
Registered officeATT House, 2nd FloorMaxwell Office Park37 Magwa CrescentWaterfall City2090
Postal addressPostNet suite 016Private Bag X81Halfway House1685
Transfer secretariesComputershare Investor Services Proprietary LimitedRosebank Towers, 15 Biermann Avenue, Rosebank, 2196(PO Box 61051, Marshalltown, 2107)
SponsorJava Capital
Company contact detailsHead of Investor Relations Head of MarketingBI Botha MPP PatelLandline number: 087 845 1112 Landline number: 087 845 [email protected] [email protected]
ATT House, 2nd Floor, Maxwell Office Park, 37 Magwa Crescent, Waterfall City, 2090+27 87 845 1136 | +27 10 549 1050 | [email protected]