Sumitomo Heavy Industries, Ltd. - · PDF fileSumitomo Heavy Industries, Ltd. ... Inquiries...
34
Sumitomo Heavy Industries, Ltd. CONSOLIDATED REPORT FY 2005, 1H For the Six-Month Period to September 30, 2005 Note: All financial information has been prepared in accordance with generally accepted accounting principles in Japan. This document has been translated from the Japanese original as a guide to non-Japanese investors and contains forward-looking statements that are based on managements’ estimates, assumptions and projections at the time of publication. A number of factors could cause actual results to differ materially from expectations. Amounts shown in this financial statement have been rounded down to the nearest million yen.
Transcript of Sumitomo Heavy Industries, Ltd. - · PDF fileSumitomo Heavy Industries, Ltd. ... Inquiries...

Sumitomo Heavy Industries, Ltd.
CONSOLIDATED REPORT FY 2005, 1H
For the Six-Month Period to September 30, 2005
Note: All financial information has been prepared in accordance with generally accepted accounting principles in Japan. This document has been translated from the Japanese original as a guide to non-Japanese investors and contains forward-looking statements that are based on managements’ estimates, assumptions and projections at the time of publication. A number of factors could cause actual results to differ materially from expectations. Amounts shown in this financial statement have been rounded down to the nearest million yen.
Consolidated Results
1
Consolidated Results FY 2005 1H
November 10, 2005
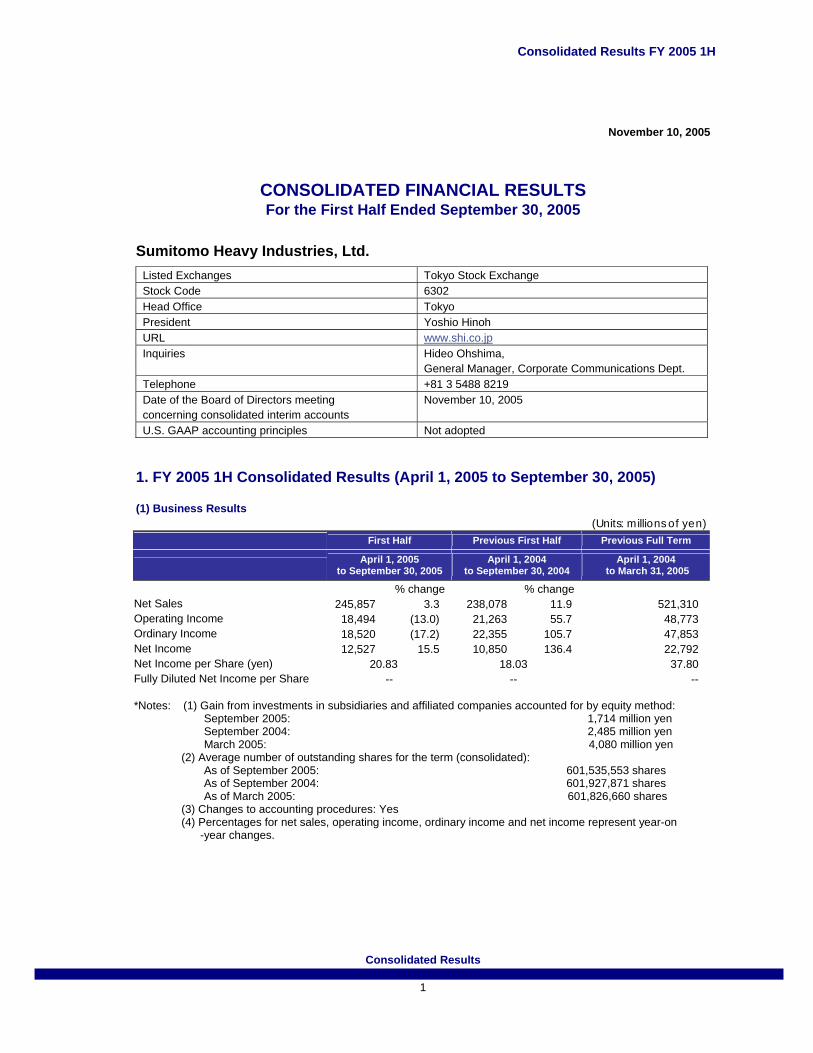
CONSOLIDATED FINANCIAL RESULTS For the First Half Ended September 30, 2005
Sumitomo Heavy Industries, Ltd.
Listed Exchanges Tokyo Stock Exchange Stock Code 6302 Head Office Tokyo President Yoshio Hinoh URL www.shi.co.jp Inquiries Hideo Ohshima,
General Manager, Corporate Communications Dept. Telephone +81 3 5488 8219 Date of the Board of Directors meeting concerning consolidated interim accounts
November 10, 2005
U.S. GAAP accounting principles Not adopted 1. FY 2005 1H Consolidated Results (April 1, 2005 to September 30, 2005) (1) Business Results (Units: millions of yen)
First Half Previous First Half Previous Full Term
April 1, 2005 to September 30, 2005
April 1, 2004 to September 30, 2004
April 1, 2004 to March 31, 2005
% change % change Net Sales 245,857 3.3 238,078 11.9 521,310 Operating Income 18,494 (13.0) 21,263 55.7 48,773 Ordinary Income 18,520 (17.2) 22,355 105.7 47,853 Net Income 12,527 15.5 10,850 136.4 22,792 Net Income per Share (yen) 20.83 18.03 37.80 Fully Diluted Net Income per Share -- -- -- *Notes: (1) Gain from investments in subsidiaries and affiliated companies accounted for by equity method:
September 2005: 1,714 million yen September 2004: 2,485 million yen March 2005: 4,080 million yen
(2) Average number of outstanding shares for the term (consolidated): As of September 2005: 601,535,553 shares As of September 2004: 601,927,871 shares As of March 2005: 601,826,660 shares
(3) Changes to accounting procedures: Yes (4) Percentages for net sales, operating income, ordinary income and net income represent year-on -year changes.

Consolidated Results
2
Consolidated Results FY 2005 1H
(2) Financial Position (Units: millions of yen)
End of First Half End of Previous First Half
End of Previous Full Year
As of Sept. 30, 2005 As of Sept. 30, 2004 As of March 31, 2005
Total Assets 562,609 558,334 569,771 Shareholders’ Equity 148,252 124,255 137,156 Equity Ratio (%) 26.4 22.3 24.1 Shareholders’ Equity per Share (yen) 246.50 206.45 227.90 *Notes: Number of shares outstanding at the end of the period (consolidated):
As of September 30, 2005: 601,419,314 shares As of September 30, 2004: 601,871,903 shares As of March 31, 2005: 601,644,571 shares
(3) Cash Flows
(Units: millions of yen) First Half Previous First Half Previous Full Year
April 1, 2005 to September 30, 2005
April 1, 2004 to September 30, 2004
April 1, 2004 to March 31, 2005
Cash Flow from Operating Activities 25,638 26,104 45,451 Cash Flow from Investing Activities (2,010) (3,493) (6,087) Cash Flow from Financing Activities (25,944) (34,532) (46,490) Cash and Cash Equivalents at Period End 46,988 45,763 49,108
(4) Scope of Consolidation and Application of equity method: Number of consolidated subsidiaries: 90 Number of non-consolidated subsidiaries accounted for by the equity method: 2 Number of affiliates accounted for by the equity method: 8
(5) Changes in the scope of consolidation and Application of equity method:
Consolidated subsidiaries: (New) 1 (Removed) 2 Equity method: (New) -- (Removed) --
2. FY 2006 Consolidated Forecasts (April 1, 2005 to March 31, 2006)
(Units: millions of yen) Full Year April 1, 2005 to March 31, 2006 Net Sales 540,000 Ordinary Income 41,000 Net Income 23,500 *Notes: (1) Projected net income per share for FY2005 (ending March 31, 2006): ...................................39.07 yen (2) Please consult page 10 of 3. Outlook for Fiscal Year in III. Business Results and Financial Position section for further information concerning the projections.

Consolidated Results
3
Consolidated Results FY 2005 1H
I. State of the Group
E
nviro
nmen
tal P
rote
ctio
n Fa
cilit
ies,
Plan
ts &
Oth
ers
S
hip,
Ste
el S
truct
ure
& O
ther
spec
ializ
ed E
quip
men
t
Indu
stria
l Mac
hine
ry
Sum
itom
o H
eavy
Indu
strie
s (P
aren
t Com
pany
)
C
onst
ruct
ion
Mac
hine
r y
M
ass-
Prod
uced
Mac
hine
ry
Seisa Gear Ltd.
Sumitomo NACCO Materials Handling Co., Ltd.
SHI Plastics Machinery
Sumitomo (S.H.I.) Construction Machinery Sales Co., Ltd.
Shin Nippon Machinery Co., Ltd.
Sumitomo Heavy Industries Engineering & Services Co., Ltd.
Sumitomo Heavy Industries Techno-Fort Co., Ltd.
Sumitomo Heavy Industries Marine & Engineering Co., Ltd.
Sumiju Environmental Engineering, Inc.
Nihon Spindle Mfg.Co., Ltd.
Izumi Food Machinery Co. Ltd.
Lightwell Co., Ltd.
Sumitomo Machinery Corporation of America
Sumitomo (SHI) Cyclo Drive Germany, GmbH
Sumitomo (SHI) Cyclo Drive Asia Pacific PTE. Ltd.
Sumitomo (SHI) Cyclo Drive China, Ltd.
Sumitomo Heavy Industries PTC Sales Co., LTD.
SHI Plastics Machinery, Inc. of America
Sumitomo Eaton Nova Corporation
Sumitomo (S.H.I.) Construction Machinery Co., Ltd.
Hitachi Sumitomo Heavy Industries Construction Crane Co., Ltd.
Link-Belt Construction Equipment Company
Sumitomo (S.H.I.) Construction Machinery Co., Ltd
Sumitomo (S.H.I.) Construction Machinery Manufacturing Co., Ltd.
Sumitomo Heavy Industries Himatex Co., Ltd.
Consolidated Results
4
Consolidated Results FY 2005 1H
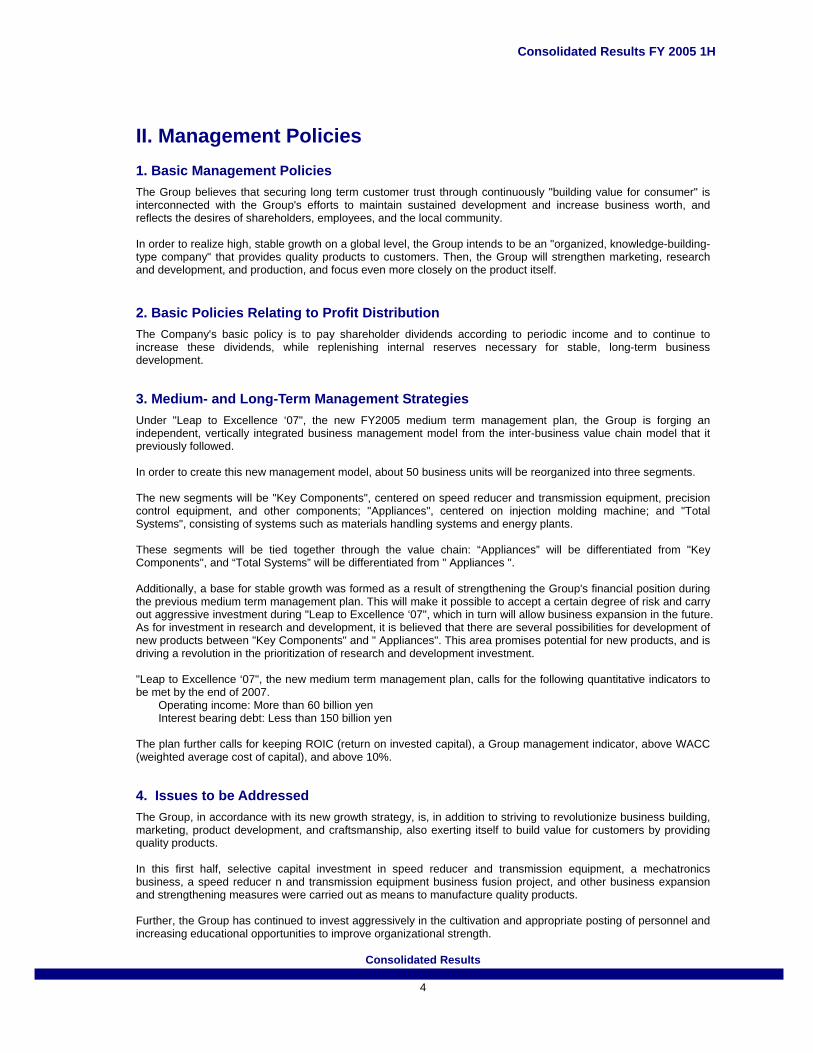
II. Management Policies 1. Basic Management Policies The Group believes that securing long term customer trust through continuously "building value for consumer" is interconnected with the Group's efforts to maintain sustained development and increase business worth, and reflects the desires of shareholders, employees, and the local community. In order to realize high, stable growth on a global level, the Group intends to be an "organized, knowledge-building-type company" that provides quality products to customers. Then, the Group will strengthen marketing, research and development, and production, and focus even more closely on the product itself. 2. Basic Policies Relating to Profit Distribution The Company's basic policy is to pay shareholder dividends according to periodic income and to continue to increase these dividends, while replenishing internal reserves necessary for stable, long-term business development. 3. Medium- and Long-Term Management Strategies Under "Leap to Excellence ‘07", the new FY2005 medium term management plan, the Group is forging an independent, vertically integrated business management model from the inter-business value chain model that it previously followed. In order to create this new management model, about 50 business units will be reorganized into three segments. The new segments will be "Key Components", centered on speed reducer and transmission equipment, precision control equipment, and other components; "Appliances", centered on injection molding machine; and "Total Systems", consisting of systems such as materials handling systems and energy plants. These segments will be tied together through the value chain: “Appliances” will be differentiated from "Key Components", and “Total Systems” will be differentiated from " Appliances ". Additionally, a base for stable growth was formed as a result of strengthening the Group's financial position during the previous medium term management plan. This will make it possible to accept a certain degree of risk and carry out aggressive investment during "Leap to Excellence ‘07", which in turn will allow business expansion in the future. As for investment in research and development, it is believed that there are several possibilities for development of new products between "Key Components" and " Appliances". This area promises potential for new products, and is driving a revolution in the prioritization of research and development investment. "Leap to Excellence ‘07", the new medium term management plan, calls for the following quantitative indicators to be met by the end of 2007.
Operating income: More than 60 billion yen Interest bearing debt: Less than 150 billion yen
The plan further calls for keeping ROIC (return on invested capital), a Group management indicator, above WACC (weighted average cost of capital), and above 10%. 4. Issues to be Addressed
The Group, in accordance with its new growth strategy, is, in addition to striving to revolutionize business building, marketing, product development, and craftsmanship, also exerting itself to build value for customers by providing quality products. In this first half, selective capital investment in speed reducer and transmission equipment, a mechatronics business, a speed reducer n and transmission equipment business fusion project, and other business expansion and strengthening measures were carried out as means to manufacture quality products. Further, the Group has continued to invest aggressively in the cultivation and appropriate posting of personnel and increasing educational opportunities to improve organizational strength.

Consolidated Results
5
Consolidated Results FY 2005 1H
Finally, the new personnel system introduced last Fiscal Year was firmly established, with clearly delineated objectives for each employee's position and performance evaluations based on those objectives which allows the Group to promote an organizational structure that provides increased job satisfaction. 5. Basic Approach to Corporate Governance and the Status of its Implementation (1) Basic Approach to Corporate Governance In order to increase business worth and, starting with stockholders, raise the confidence of customers, Company employees, the community, and other stakeholders, the Company is establishing an efficient and highly transparent management system as the basis of corporate governance. (2) Status of Corporate Governance Implementation A. Condition of upgrades to compliance and risk management within the internal control system The Company has adopted the auditor system. Within this framework, it introduced the executive officer system in 1999, separating business management functions and supervisory functions. The board of directors is small, consisting of only 9 directors, of which 1 member is elected from outside of the Company. The board works hard to insure that management remains transparent and that management supervisory functions are strengthened. The board of directors deliberates items specified by commercial law. Important management issues are also selected beforehand for discussion. In addition, the Compensation Committee, an advisory body to the board of directors, half of whose members come from outside the Company, was established in order to insure transparency and the appropriateness of the directors' compensation. The Auditing Committee consists of 4 auditors (of which 2 are external auditors). The organizational audit carried out by the directors and auditors checks for both legitimacy and appropriateness. In addition, the Group periodically holds meetings with auditors from the Company and its affiliates in order to exchange auditing related information and allow the Group's auditing functions to be carried out fully. Moreover, an Auditing Committee Executive Office, a staff organization subordinate to the Auditing Committee, was established to support the Auditing Committee. There are 16 executive officers (including 8 who serve concurrently as directors) elected to take responsibility for business management. The Group established an Executive Committee, comprised of executive officers, as well as a Group Management Committee, consisting of the presidents of the Company and its primary related companies, and it is carrying out performance management from a consolidated base and following-up management measures. Finally, a Management Strategy Meeting, comprised of the president of the Company and other Company executive officers and held in principle weekly, was established. In addition to serving as a forum for the advance deliberation of items for resolution at the meeting of the board, the Meeting also deliberates key management items within the scope of its authority as delegated by the board.

Consolidated Results
6
Consolidated Results FY 2005 1H
The Company's corporate governance system can be graphically represented as shown below.
Stockholders
Accounting A
uditor
Audit Officers/ Audit Committee
Board of Directors
President
Operating Divisions Affiliated Companies
Executive Committee
Group Management Committee
Management Strategy Meeting
Ethical Committee
Compensation Committee
Auditor Officers/Audit Committee of Affiliated Companies
Internal Management Promotion Section
Internal Audit Section
Internal check
Auditing
Oversight Oversight
Audit-ing

Consolidated Results
7
Consolidated Results FY 2005 1H
B. Condition of upgrades to compliance and risk management within the internal control system The Company instigated a code of ethics, established an Ethics Committee, and established an internal hotline for reporting unethical behavior in its efforts to maintain and improve respect for law, fairness, and ethical practice in its business activities. The comprehensive risk management system introduced in 2001 was also reinforced and enhanced. Starting in 2004, a Group-wide effort to build and enhance an internal control system that would function to unify business ethics and risk management activities was undertaken. In August of 2004, a risk management office was reorganized within the internal control promotion office as a promotional organization for this activity, and an internal control promotion organization was established within the operations division. In October of the same year, a compliance manual was formulated, and thorough dissemination of compliance throughout the Group was emphasized. By March of 2005, awareness-training activities had been undertaken throughout the entire Group, and throughout the Group's affiliated companies. Given this background, the current incident involving the violation of Japan's Antimonopoly Law has been taken seriously. In addition to a resolution to strictly observe Japan's Antimonopoly Law that was passed at the meeting of the board of directors this July, a message of strict compliance has been sent out repeatedly. In addition, the existing internal control promotion organization, which has the inherent function of strongly promoting compliance, was further expanded. Further concrete management efforts to emphasize compliance, in addition to carrying out the re-education of all employees concerning Japan's Antimonopoly Law, required all officers and managers (except for auditors) to study and sign a compliance and Antimonopoly Law observance pledge book, and the "Ethics Hotline", a previously established internal reporting system, has been enhanced by including an external lawyer as the point of contact. In order to enhance compliance where business operations related to public works projects are concerned, in addition to each business division self-checking bids for conformity with compliance issues, a new organization was also created within the Company to monitor orders. Finally, in order to guarantee the effectiveness of these compliance programs, a compliance monitoring function was added to the audit office, the results of which are reported to the board of directors each quarter. 6. Items concerning the Parent Company, etc. Not applicable as the company has no parent company.

Consolidated Results
8
Consolidated Results FY 2005 1H
III. Business Results and Financial Position 1. Business Results
Despite rising costs of materials such as steel and crude oil, Japan's economy in this first half was characterized by a steady revival of business activity with increases in private capital investment, following a recovery in business revenues, and increases in personal consumption. Overseas, business activity expanded in the United States and China, and to a degree in Europe, where activity showed modest recovery. Against this backdrop, the new mid-term management plan "Leap to Excellence ‘07" was launched. Due to measures in progress to improve profitability, this first half became the third accounting period to post continued increases in both sales and profits (interim simple profit base), and first half net sales and profits posted at the highest levels on record.
As regards orders received, the Construction Machinery segment expanded considerably on the back of strong order
volume from North America. However, due to a slump in demand for bridges, environment-related works, and other government related demand, orders received totaled 282.4 billion yen, a year-on-year decrease.
Net sales increased 3% year-on-year to 245.9 billion yen, the result of strong overseas sales centering on North America. Strong sales were registered in Construction Machinery segment, the turbines & pumps, and forging presses for automobiles in Industrial Machinery segment. The Mass-Produced Machinery segment also experienced strong sales growth in speed reducer and transmission equipment. Regards operating profit and loss, income from the Construction Machinery and Industrial Machinery segment increased. However, a relative year-on-year loss appears in operating income as a result of one-time sales in the real estate section in the previous interim. In the absence of real estate sales in this term, operating income decreased relatively 13% year-on-year to 18.5 billion yen. Non-operating profit and loss also decreased as earnings on the equity method decreased. Ordinary income posted 18.5 billion yen, a year on year decrease of 17%. Extraordinary profits posted at 12.5 billion yen, a year on year increase of 15% and record result for the Company, as a result of major improvements following the absence of the time differential for change in the standard pension benefit plan, which had been depreciating for a 5 year period ending last year, and the absence of losses on disposals of fixed assets. Following these management results, the Company has resolved to pay out a dividend of 2.50 yen per share semiannually. Results for each division are as follows. Mass Produced Machinery Segment Private capital investment in Japan stregnthened since the last accounting period, and overseas business activity improved greatly. Results, especially from activities targeted at the United States, power transmission & controls business showed steady improvement. Plastic machinery business sales in Japan, centering on automobile-related machinery, were steady. However overseas sales decreased, due to a decline in IT-related investment. Precision control equipment and components business sales increased markedly in cyrogenics, precision forged parts and machine tools, and other areas. Orders received totaled 106.1 billion yen, roughly the same year-on-year, while net sales reached 103.6 billion yen, a year-on-year increase of 5%. Operating income posted 13.1 billion yen, a year-on-year decrease of 2.6 billion yen, as sales for plastic machinery fell.

Consolidated Results
9
Consolidated Results FY 2005 1H
Environmental Protection Facilities, Plants, and Others Segment Rising crude oil prices and increasing electric power demand worldwide resulted in an increase for the energy plant segment, however orders for public works construction decreased, and overall orders in the segment registered 37.4 billion yen, a year-on-year decrease of 19%. Net sales totaled 31.9 billion yen, showing a year-on -year decrease of 7%, as this interim had nothing to replace the effect of the real estate section's sale of part of the land from the Tanashi plant during the previous first half. Operating income posted at 0.1 billion yen, a year-on-year decrease of 2.5 billion yen. Ship, Steel Structure and Other Specialized Equipment Segment Shipbuilding orders for 5 Aframax tankers were awarded, the same number year-on-year, and as ship prices rose, order revenue levels showed an increase. However steel structure and process equipment group orders decreased substantially, and orders for the entire segment totaled 43.9 billion yen, a year on year decrease of 8% . Net sales for the entire segment was 24.3 billion yen, a year-on-year decrease of 4%, as an increase in shipbuilding sales following the delivery of 3 Aframax tankers, however, was offset by a decrease in ship repairs. Operating losses registered 1.3 billion yen, a year-on-year deterioration of 0.7 billion yen, due to the influence of increases in the costs of steel and other raw materials. Industrial Machinery Segment Orders for forging presses for the automobile industry grew, while orders for large cranes also increased after reinvesting in the iron mill. Furthermore, turbines and pumps, centered on overseas business, also remained strong. Orders received totaled 32.8 billion yen, almost the same year-on-year, and net sales reached 27.3 billion yen, a year on year increase of 7%. Operating income nearly doubled year-on-year to 3.1 billion yen, following focus on marketing and exhaustive project management. Construction Machinery Segment Hydraulic excavator sales showed significant expansion overseas, centering on North America. Sales of mobile cranes for construction were also strong, supported by the vigorous market in North America. Orders received rose 11% year-on-year to 62.2 billion yen, and net sales registered 58.9 billion yen, a year on year increase of 8%. Operating income registered 3.5 billion yen, a year on year increase of 1.5 billion yen. 2. Financial Position Due to a steady recovery in collection of trade receivables, total assets posted 562.6 billion yen, a year-on-year decrease of 7.2 billion yen. As a result of asset reduction efforts, interest-bearing debt posted 145.9 billion yen, a year-on-year decrease of 23.3 billion yen, or 25.9% of total assets, a year on year decrease of 3.8 points. Stockholder's equity results for this first half were strong, posting 148.3 billion yen, a year-on-year increase of 11.1 billion yen, and stockholder's equity ratio, at 26.4%, showed a year on year improvement of 2.3 points. Cash flows from operating activities totaled 25.6 billion yen, roughly the same as the previous year. Though corporate tax paid showed a year on year increase, we recorded steady progress in collection of trade receivables.

Consolidated Results
10
Consolidated Results FY 2005 1H
Cash flows from investing activities declined to 2 billion yen, a year on year decrease of 1.5 billion yen, despite income as a result of the clearing off distributions from overseas subsidiary companies from the previous accounting period. Cash flows from financing activities posted a decrease of 25.9 billion yen due to repayment of loans. As a result of the foregoing, cash and cash equivalents at the end of this interim accounting period registered 47 billion yen, a year on year decrease of 2.1 billion yen. Cash Flow Indicators
22000033 22000044 22000055
IInntteerriimm FFuullll YYeeaarr IInntteerriimm FFuullll YYeeaarr IInntteerriimm
Shareholders’ equity ratio 17.1 19.7 22.3 24.1 26.4
Shareholders’ equity ratio at market value 25.0 30.7 35.1 44.6 86.1
Years to debt redemption 3.9 2.8 3.5 3.7 2.8
Interest coverage ratio 14.7 19.5 16.1 15.0 18.9 (Notes)
1. Indicators calculated using the following formulae. Stockholders' equity ratio: Shareholders' equity/Total assets Stockholders’ equity ratio at market value: Market capitalization/Total assets Years to debt redemption: Interest-bearing debt/Operating cash flow Interest coverage ratio: Operating cash flow/Interest payments 2. All are calculated based on consolidated financial figures. 3. Interest-bearing debt indicates all liabilities posted in the balance sheets on which the Company pays interest.
3. Outlook for the Fiscal Year As for the future business environment, there is some uncertainty, due to rising material costs and hesitant public investment. However, the Group will move forward to achieve the goals of the new medium term management plan "Leap to Excellence ‘07", and steadily carry out related management measures. The outlook for this year's performance are as follows. (Units: billions of yen)
CCoonnssoolliiddaatteedd AAmmoouunntt NNoonn--ccoonnssoolliiddaatteedd AAmmoouunntt
Net sales 540.0 Net sales 265.0
Operating income 45.0 Operating income 19.0
Ordinary income 41.0 Ordinary income 17.0
Net income 23.5 Net income 9.0 *Expectations and outlooks for future performance are rational judgments made based on the information currently available. Therefore, actual results may vary from written expectations and outlooks due to changes in various factors. Please see Business Risks section for detailed information about those factors.
Consolidated Results
11
Consolidated Results FY 2005 1H
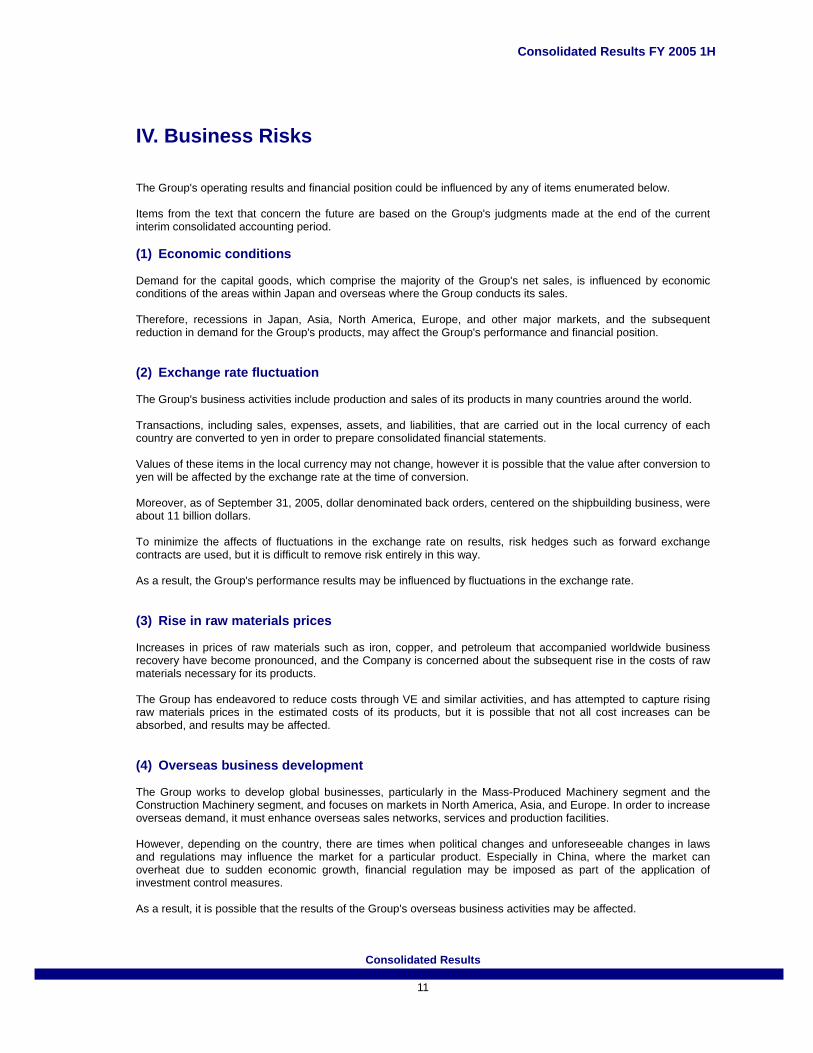
IV. Business Risks The Group's operating results and financial position could be influenced by any of items enumerated below. Items from the text that concern the future are based on the Group's judgments made at the end of the current interim consolidated accounting period. (1) Economic conditions Demand for the capital goods, which comprise the majority of the Group's net sales, is influenced by economic conditions of the areas within Japan and overseas where the Group conducts its sales. Therefore, recessions in Japan, Asia, North America, Europe, and other major markets, and the subsequent reduction in demand for the Group's products, may affect the Group's performance and financial position. (2) Exchange rate fluctuation The Group's business activities include production and sales of its products in many countries around the world. Transactions, including sales, expenses, assets, and liabilities, that are carried out in the local currency of each country are converted to yen in order to prepare consolidated financial statements. Values of these items in the local currency may not change, however it is possible that the value after conversion to yen will be affected by the exchange rate at the time of conversion. Moreover, as of September 31, 2005, dollar denominated back orders, centered on the shipbuilding business, were about 11 billion dollars. To minimize the affects of fluctuations in the exchange rate on results, risk hedges such as forward exchange contracts are used, but it is difficult to remove risk entirely in this way. As a result, the Group's performance results may be influenced by fluctuations in the exchange rate. (3) Rise in raw materials prices Increases in prices of raw materials such as iron, copper, and petroleum that accompanied worldwide business recovery have become pronounced, and the Company is concerned about the subsequent rise in the costs of raw materials necessary for its products. The Group has endeavored to reduce costs through VE and similar activities, and has attempted to capture rising raw materials prices in the estimated costs of its products, but it is possible that not all cost increases can be absorbed, and results may be affected. (4) Overseas business development The Group works to develop global businesses, particularly in the Mass-Produced Machinery segment and the Construction Machinery segment, and focuses on markets in North America, Asia, and Europe. In order to increase overseas demand, it must enhance overseas sales networks, services and production facilities. However, depending on the country, there are times when political changes and unforeseeable changes in laws and regulations may influence the market for a particular product. Especially in China, where the market can overheat due to sudden economic growth, financial regulation may be imposed as part of the application of investment control measures. As a result, it is possible that the results of the Group's overseas business activities may be affected.

Consolidated Results
12
Consolidated Results FY 2005 1H
(5) Product quality All of the Group's products are manufactured according to an exacting quality standard. None the less, not every product produced by the Group can be free of defects, and there is no guarantee that situations will not arise in which the Group will have to bear the burden of guarantee construction. In addition, the Group carries product liability compensation insurance, but there is no guarantee that this insurance will cover all compensation amounts. If the sums involved in guarantee construction and product liability compensation obligations borne by the Group as a result of problems with product quality are large, then they could have an adverse influence on the Group's performance results and financial position. (6) Effects of impairment accounting On March 31, 2002, the Company revaluated its land used for business purposes in accordance with Japan's Law Concerning Land Revaluation (Law No. 34, dated March 31, 1998) and Law Amending the Law Concerning Land Revaluation (Law No. 19, dated March 31, 2001) on the basis. The difference between the book value of land at the end of the last accounting period and its value after the revaluation was 19.2 billion yen, a decrease of 18%. If the value of the land further depreciates in the future, there is a possibility it will register as a depreciation of fixed assets. When the decrease is registered, it may be reflected in the Group's performance results. (7) Environmental protection The Group, in accordance with its Group Environmental Policy, devotes itself to the reduction of environmental impact, such as by avoiding environmental risks and minimizing waste. Although the group has an exhaustive system in place to prevent environmental pollution, there is always the possibility that environmental pollution could occur due to unexpected circumstances. If environmental pollution were to occur, the large costs involved might affect the Group's performance results. (8) Disasters In order to prevent or reduce to the smallest extent possible damages arising from disasters such as fire, earthquake, typhoon, and storms and flooding, the Group carries out inspections and training and has installed a communications system. Nonetheless, physical damages and injuries resulting from disasters may impact the Group's activities. Moreover, there is no insurance that can provide complete coverage of damages from disasters.

Consolidated Results
13
Consolidated Results FY 2005 1H
V. Consolidated Financial Statements (1) Consolidated Income Statements
(Units: millions of yen)
First Half Previous First Half
April 1, 2005 to September 30, 2005
April 1, 2004 to September 30, 2004
Change
Previous Fiscal Year
April 1, 2004 to, March 31, 2005
Amount % Amount % Amount Amount % Net sales
245,857 100.0 238,078 100.0 7,778 521,310 100.0
Cost of sales 193,564 78.7 184,300 77.4 9,264 407,512 78.2
Gross profit
52,292 21.3 53,778 22.6 (1,486) 113,798 21.8
Selling, general & administrative expenses
33,799 32,516 1,283 65,025
Operating income 18,494 7.5 21,263 8.9 (2,769) 48,773 9.4
Interest income 33 74 (40) 172
Dividend income 296 208 88 289
Equity in earnings of unconsolidated subsidiaries and affiliated companies
1,714 2,485 (771) 4,080
Collection of allowance for doubtful accounts
407 387 20 561
Interest expense 1,293 1,609 (316) 2,995
Other-net (1,130) (453) (677) (3,026) Gain on sale of securities 661 -- 661 506 Gain on sale of property,
plant and equipment -- 1,134 (1,134) 1,575
Amortization of prior service cost -- -- -- 2,515

Consolidated Results
14
Consolidated Results FY 2005 1H
(Units: millions of yen)
First Half Previous First Half
April 1, 2005 to September 30, 2005
April 1, 2004 to September 30, 2004
Change Previous
Fiscal Year April 1, 2004 to, March
31, 2005
Amount % Amount % Amount Amount %
Provision for retirement benefits to directors, statutory auditors and corporate officers
257 -- 257 488
Impairment losses 229 -- 229 --
Loss on valuation of affiliated companies 77 -- 77 --
Amortization of net transition obligation of severance and retirement benefits
-- 2,792 (2,792) 5,584
Loss on disposal of property, plant and equipment
-- 1,925 (1,925) 1,925
Loss from reorganization of business -- 724 (724) 2,810
Loss from liquidation of subsidiaries -- -- -- 3,053
Other income (expenses) 125 (3,216) 3,341 (10,185)
Income before income taxes 18,619 7.6 18,047 7.6 572 38,588 7.4
Corporate income tax current 6,404 3,378 3,026 13,415
Corporate income tax deferred (490) 3,784 (4,275) 2,406
Minority interests in consolidated subsidiaries
(178) (35) (144) 26
Net income 12,527 5.1 10,850 4.6 1,677 22,792 4.4

Consolidated Results
15
Consolidated Results FY 2005 1H
(2) Consolidated Statements of Surplus (Units: millions of yen)
Term
Item
First Half April 1, 2005 to September 30,
2005
Previous First Half
April 1, 2004 to September 30,
2004
Y/Y change
Previous Fiscal Year
April 1, 2004 to March 31, 2005
Capital Surplus
Capital surplus at the beginning of term 16,803 16,800 2 16,800
Increase in capital surplus 1 1 (0) 2 Gain on disposition of treasury stock 1 1 (0) 2
Capital surplus at the end of term 16,804 16,802 2 16,803
Retained earnings Retained earnings at the beginning of term 42,677 19,848 22,829 19,848
Increase in retained earnings 12,789 10,943 1,846 23,027
Net income 12,527 10,850 1,677 22,792
Increase owing to merger 117 -- 117 -- Increase from transfer from
revaluation reserve for land 145 93 52 235
Decrease in retained earnings 2,701 88 2,614 198
Dividends 1,805 -- 1,805 --
Bonuses for directors 42 13 29 13 Return of retirement allowance
of overseas subsidiaries 839 -- 839 --
Decrease due to increase in numbers of consolidated subsidiaries
12 -- 12 --
Decrease due to decrease in numbers of consolidated subsidiaries
-- 39 (39) 149
Decrease due to increase in numbers of consolidated subsidiaries and companies accounted for by the equity method
-- 35 (35) 35
Other 4 -- 4 -- Retained earnings at the end of
term 52,765 30,704 22,061 42,677

Consolidated Results
16
Consolidated Results FY 2005 1H
(3) Consolidated Balance Sheets for the FY 2005 First Half (Units: millions of yen)
End of First Half End of Previous
Consolidated Fiscal Year
End of Previous First Half
As of September 30, 2005 As of March 31, 2005
Y/Y change As of September
30, 2004
Amount Amount Change Amount Assets Cash and deposits 47,504 49,636 (2,132) 46,271 Notes and account
receivable 133,469 151,618 (18,149) 129,834 Inventories 100,451 88,859 11,593 103,930 Deferred income taxes 8,589 7,838 751 7,123 Other 17,320 20,151 (2,832) 18,584 Allowance for doubtful
accounts (1,626) (1,937) 311 (2108) Current assets 305,707 316,166 (10,458) 303,634 Buildings and structure 41,588 42,046 (458) 43,142 Equipment and
transportation tools 18,627 18,362 264 19,575 Land 114,898 115,536 (639) 115,968 Construction in progress 2,020 1,462 558 3,780 Other 3,741 3,583 158 3,719 Tangible assets 180,873 180,990 (117) 186,184 Intangible assets 4,259 3,995 265 3,450 Investment securities 47,925 41,544 6,381 37,487 Deferred income taxes 9,176 11,498 (2,322) 11,490 Other 20,630 20,443 187 23,021 Allowance for doubtful
accounts (5,962) (4,864) (1,097) (6,932) Investments and other
assets 71,770 68,621 3,149 65,065
Fixed assets 256,902 253,605 3,297 254,700 Total assets 562,609 569,771 (7,162) 558,334

Consolidated Results
17
Consolidated Results FY 2005 1H
(Units: millions of yen)
End of First Half End of Previous
Consolidated Fiscal Year
End of Previous First Half
As of September 30, 2005 As of March 31, 2005
Y/Y change As of September
30, 2004
Amount Amount Change Amount
Liabilities Notes and accounts payable 128,326 134,439 (6,113) 126,780 Short-term debt payable 33,980 44,883 (10,904) 46,480 Commercial paper 15,000 11,500 3,500 15,000 Long-term debt within one
year 39,646 52,471 (12,825) 47,826 Bond redemption within
one year 1,000 1,000 -- 3,000 Advance payments
received on contracts 40,327 27,417 12,910 37,658 Allowance for guaranteed
construction 3,729 2,940 790 2,735 Allowance for loss on
ordered construction 411 -- 411 -- Allowance for loss on
liquidation of subsidiaries
1,939 -- 1,939 200
Other 29,559 35,704 (6,145) 26,456 Current liabilities 293,918 310,356 (16,438) 306,134 Bond 10,000 10,000 -- 1,000
Long-term debt due after one year 46,284 49,373 (3,090) 68,165
Employees’ severance and retirement benefits 21,868 20,049 1,819 18,429
Allowance for directors’ retirement benefits 938 629 309 --
Deferred income taxes on revaluation 33,679 31,055 2,625 31,152
Allowance for loss on liquidation of subsidiaries
-- 1,881 (1,881) --
Other 4,293 5,444 (1,151) 5,234 Long-term liabilities 117,061 118,430 (1,369) 123,979 Total liabilities 410,979 428,786 (17,807) 430,112 Minority interests 3,379 3,829 (450) 3,966 Stockholders’ equity
Common stock: Paid in capital 30,872 30,872 -- 30,872 Capital surplus 16,804 16,803 1 16,802 Retained earnings 52,765 42,677 10,088 30,704 Revaluation reserve for land 42,396 45,265 (2,869) 45,407 Unrealized gains on securities 7,495 4,476 3,020 4,074
Foreign currency translation adjustments (1,758) (2,741) 983 (3,492)
Treasury stock (321) (195) (126) (111) Total stockholders’ equity 148,252 137,156 11,096 124,255 Liabilities minority interest,
and stockholders’ equity 562,609 569,771 (7,162) 558,334
Consolidated Results
18
Consolidated Results FY 2005 1H
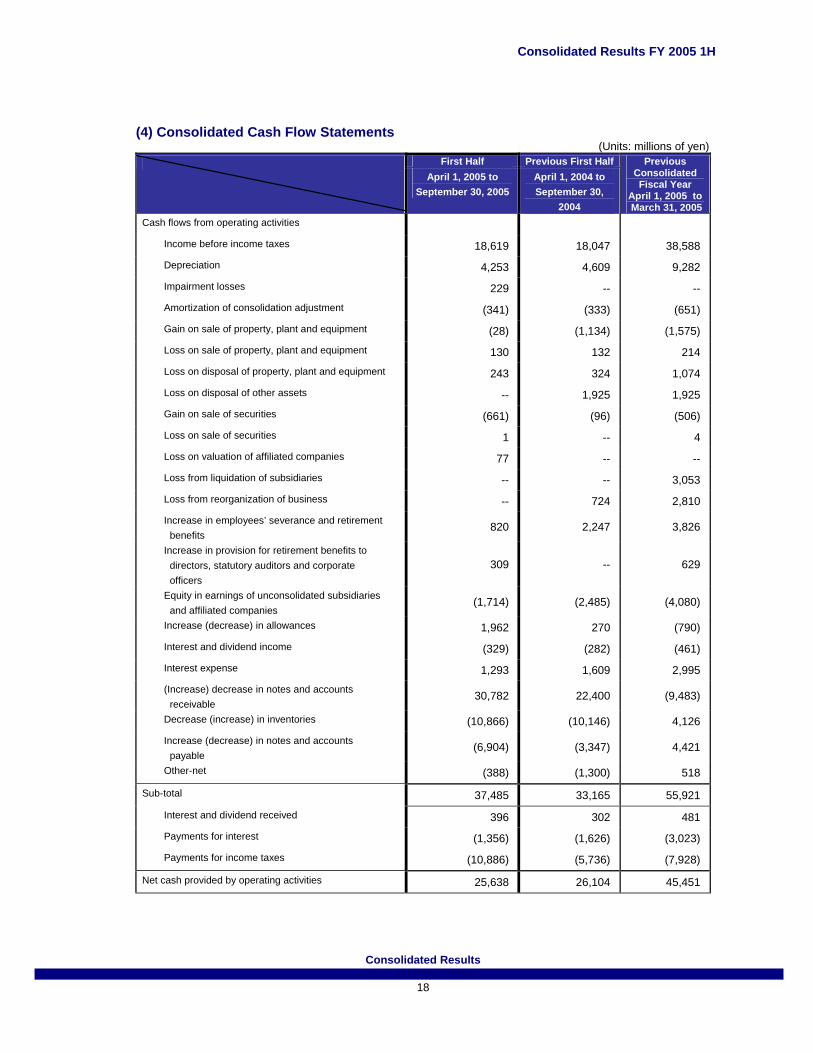
(4) Consolidated Cash Flow Statements (Units: millions of yen)
First Half Previous First Half April 1, 2005 to
September 30, 2005 April 1, 2004 to September 30,
2004
Previous Consolidated Fiscal Year
April 1, 2005 to March 31, 2005
Cash flows from operating activities
Income before income taxes 18,619 18,047 38,588 Depreciation 4,253 4,609 9,282
Impairment losses 229 -- --
Amortization of consolidation adjustment (341) (333) (651) Gain on sale of property, plant and equipment (28) (1,134) (1,575) Loss on sale of property, plant and equipment 130 132 214
Loss on disposal of property, plant and equipment 243 324 1,074
Loss on disposal of other assets -- 1,925 1,925 Gain on sale of securities (661) (96) (506)
Loss on sale of securities 1 -- 4 Loss on valuation of affiliated companies 77 -- --
Loss from liquidation of subsidiaries -- -- 3,053
Loss from reorganization of business -- 724 2,810 Increase in employees’ severance and retirement
benefits 820 2,247 3,826
Increase in provision for retirement benefits to directors, statutory auditors and corporate officers
309 -- 629
Equity in earnings of unconsolidated subsidiaries and affiliated companies
(1,714) (2,485) (4,080)
Increase (decrease) in allowances 1,962 270 (790)
Interest and dividend income (329) (282) (461)
Interest expense 1,293 1,609 2,995 (Increase) decrease in notes and accounts
receivable 30,782 22,400 (9,483)
Decrease (increase) in inventories (10,866) (10,146) 4,126
Increase (decrease) in notes and accounts payable
(6,904) (3,347) 4,421
Other-net (388) (1,300) 518
Sub-total 37,485 33,165 55,921
Interest and dividend received 396 302 481 Payments for interest (1,356) (1,626) (3,023)
Payments for income taxes (10,886) (5,736) (7,928)
Net cash provided by operating activities 25,638 26,104 45,451

Consolidated Results
19
Consolidated Results FY 2005 1H
(Units: millions of yen) First Half Previous First Half
April 1, 2005 to September 30,
2005
April 1, 2004 to September 30,
2004
Previous Consolidated Fiscal Year
April 1, 2005 to March 31, 2005
Cash flows from investing activities Decrease in time deposits 29 295 256
Purchase of securities (610) (30) (2,338) Proceeds from sale of securities 893 1,355 2,758
Disbursements for investment in affiliates (1,080) (183) (494) Proceeds from liquidation of affiliates 1,528 33 65
Payments for purchases of property, plant and equipment
(4,960) (6,226) (10,178)
Proceeds from sale of property, plant and equipment
854 1,418 3,257
Proceeds from refund of investment 1,462 -- --
Payments for long-term loans receivables (32) (223) (344)
Collection of long-term loans receivables 320 152 936 Other-net (415) (83) (5)
Net cash used in investing activities (2,010) (3,493) (6,087)
Cash flows from financing activities Decrease in short-term loans (11,563) (24,102) (25,355)
Increase in commercial paper 3,500 5,000 1,500 Proceeds from long-term debt 17,580 1,630 2,930
Repayments for long-term debt (33,495) (16,474) (31,916)
Proceeds from issue of bonds -- -- 10,000 Payment for redemption of bonds -- (542) (3,521) Proceeds from sale of treasury stock 2 2 4
Disbursement for acquisition of treasury stock (127) (39) (124) Dividends paid (1,805) -- -- Payment of dividends for minority stockholders (36) (8) (8)
Net cash used in financing activities (25,944) (34,532) (46,490)
Effect of exchange rate changes on cash and cash equivalents
162 29 1
Decrease in cash and cash equivalents (2,153) (11,892) (7,125) Cash and cash equivalents at the beginning of term 49,108 57,678 57,678
Increase due to new consolidation 3 -- --
Increase due to merger and acquisition 215 -- --
Net decrease from the change in consolidated companies (184) (23) (1,446)
Cash and cash equivalents at the end of term 46,988 45,763 49,108

Consolidated Results
20
Consolidated Results FY 2005 1H
VI. Significant Items Forming the Basis for Preparation of Interim Consolidated Financial Statements
1. Items concerning scope of consolidation
Number of subsidiaries: 90 companies Names of major consolidated subsidiaries Sumitomo (S.H.I.) Construction Machinery Co., Ltd., Shin Nippon Machinery Co., Ltd., Seisa Gear, Ltd., Sumitomo Heavy Industries Marine & Engineering Co., Ltd., Sumitomo Heavy Industries PTC Sales Co., Ltd. Sumiju Environmental Engineering, Inc., Link-Belt Construction Equipment Company, Sumitomo Machinery Corporation of America, and Sumitomo (SHI) Cyclo Drive Germany, GmbH Non-consolidated subsidiaries (Shin Nichizo Engineering Co., Ltd. etc.) are small companies, and their combined total assets, sales, net income (amount corresponding to equity holding) and retained earnings (amount corresponding to equity holding) all have no important impact on first half consolidated financial statements.
2. Application of equity method Number of non-consolidated subsidiaries accounted for by equity method: 2 companies Number of affiliated companies not accounted for by the equity method: 8 companies Names of major companies accounted for by equity method. Sumitomo Eaton Nova Corporation, and Nihon Spindle Mfg. Co., Ltd. Subsidiaries (Shin Nichizo Engineering Co., Ltd. etc.) and affiliated companies (Toa Koki Co., Ltd. etc.) that are not accounted for by the equity method have been excluded from the application of the equity method because they have minimal impact on first half consolidated net income and consolidated retained earnings, and have little importance in terms of overall group.
3. Changes in scope of consolidation and application of equity method This interim consolidated accounting period, in addition to adding SM-Cyclo De Argentina S.A., a company which increased in importance, to the scope of consolidation, Ohtsuka Tech, which was completely liquidated, and Sumiju Structural Engineering & Construction, Ltd, which decreased in importance, were both removed from the scope of consolidation.
4. Fiscal years of consolidated subsidiaries The consolidated overseas companies, Link-Belt Construction Equipment Company, Sumitomo Machinery Corporation of America, Sumitomo (SHI) Cyclo Drive Germany, GmbH, etc. have a first half account settlement date of June 30. When preparing first half consolidated financial statements, first half financial statement as of that date were used, and in the case of important transactions that occurred between that date and the first half consolidated account settlement date, necessary adjustments were made on a consolidated basis.
5. Accounting standards (1) Valuation criteria and valuation methods for major assets
1) Securities
Bonds held to maturity Amortized cost method Other marketable securities With fair market value ・・・Market value method based on quoted market price on first half consolidated account settlement date (Appraisal differences are dealt with by means of the direct capital influx method, with cost of securities sold calculated with the moving average method.) Without fair market value ・・・Stated at cost determined by the moving average method

Consolidated Results
21
Consolidated Results FY 2005 1H
2) Inventories Work in process: Principally stated at cost based on specific cost method Finished products, semi-finished products, raw materials and spplies: Principally stated at cost based on the total average method As for products in Construction Machinery segment are principally stated at cost or market, whichever is lower based on specific cost method.
(2) Methods of depreciation for major depreciable assets
1) Property, plant and equipment The Company computes depreciation by the declining balance method. Furthermore, as for useful life and residual value, the standard used is principally the same as the method stipulated in the income tax code. However, the Company and some consolidated subsidiaries apply the straight-line method to buildings acquired after April 1, 1998 (excluding equipment belonging to buildings). 2) Intangible fixed assets Depreciation is computed by the straight-line method. Furthermore, as for useful life and residual value, the standard used is principally the same as the method stipulated in the income tax code. However, in the case of software used by the Company itself, the straight-line method based on the period of possible use within the Company (5 years) is adopted.
(3) Criteria for appropriation of important allowance
1) Allowance for doubtful accounts To prepare s against credit losses, the Company makes additions to this allowance on the basis of loan loss ratios for standard loans, and on an individual basis for loans considered unlikely to be repaid in full, recording an amount equivalent to that thought to be irretrievable. 2) Allowance for guaranteed construction In preparation for disbursements for expenses for gratuitous repair made after product delivery, allowances for guarantee construction are recorded based on historical results and the like. 3) Allowance for losses on ordered construction As for undelivered construction orders for which it is estimated, at the end of the interim consolidated accounting period, that extensive losses are likely to occur after the interim consolidated accounting period, and for which a rational estimate of the amount of said losses is possible, the estimated amount of losses that are expected to occur after this first half are recorded. 4) Employees’ severance and retirement benefits To provide for employees’ accrued retirement benefits, the Company charged to income the amount recognized as having been incurred at the end of the first half consolidated accounting period based on the projected amounts of the liability for accrued retirement benefit liabilities and pension assets at the end of the consolidated accounting fiscal year. Additionally, the Company accounts for past service liability as expenses in the consolidated accounting year in which they occurred. Consolidated subsidiaries account for past service liability as expenses calculated by the straight line method, based on a fixed number of years (mainly 12 years) within the average remaining employee service time when they occurred. Actuarial differences are amortized on a straight-line basis over a period which falls within the average estimated remaining years of service (12 years) of the participants commencing the year following.

Consolidated Results
22
Consolidated Results FY 2005 1H
5) Accrued retirement benefits to directors and corporate officers As for accrued retirement benefits to directors and corporate officers, the retirement benefits system has been abolished within the Company and some of its consolidated subsidiaries: the amount recorded as an allowance for retirement benefits is determined on the basis of compensation commensurate with work performance during the term of duty. 6) Allowances for losses on the reorganization of affiliates An amount equal to the estimated losses associated with the liquidation of an unconsolidated domestic subsidiary, which has entered liquidation proceedings, has been recorded.
(4) Procedure of important lease transaction
For financial lease where ownership of leased properties is not recognized to transfer to borrower, an accounting procedure pursuant to common methods for lease transaction is adopted.
(5) Derivatives and hedging activities
1) Hedge accounting methods The Company uses deferral hedge accounting. In the case of Interest-rate swaps, if conditions for a special application are met, the special application is adopted. In addition, as for foreign currency futures contract, if conditions for appropriation are fulfilled, appropriation treatment is adopted. 2) Hedging measures and hedged items Hedging instruments Hedged items
Forward foreign exchange contracts Foreign currency-denominated liabilities and planned transactions Interest-rate swaps Loans
3) Hedging policy Based on the “Market Risk Management Rule” provided for by the board of directors, the Company aims at the decrease of the risk, and therefore does not engage in any speculative transactions. 4) Method of evaluating effectiveness of hedging The fluctuations in the total sum and the quotation for fair value hedging and the fluctuation in the total sum and quotation for cashflows hedging are compared every 6 months, and, based on the amount of the fluctuation for each, hedge effectiveness is evaluated. The Company does not evaluate the effectiveness of hedging interest-rate swaps by special applications.
(6) Other important items forming the basis for preparation of consolidated financial
statements 1) Method of accounting for consumption tax, etc. The Company adopts the tax exclusion method. 2) Adoption of a consolidated tax payment system A consolidated tax payment system has been adopted.
5. Fund range in the statement of cash flows
Funds in the statement of cash flows (cash and cash equivalents) comprise cash in hand, deposits withdrawable at any time, and easily cashable short -term investment with little risk and maturity date coming within three months from the acquisition date.

Consolidated Results
23
Consolidated Results FY 2005 1H
Changes in Accounting Method Allowances for losses on ordered construction The recording method has changed: from this interim consolidated financial period, if there are undelivered construction orders for which it is estimated, at the end of the interim consolidated financial period, that extensive losses are likely to occur after the interim consolidated financial period, and for which a rational estimate of the amount of the losses is possible, then the estimated amount of the losses which are expected to occur after the first half will be recorded under allowances for losses on construction orders. This change is believed to firmly establish said allowances as accounting practices. It was made in order to improve financial reporting and to further improve the balancing of period profits and losses. As a result, in comparison with previous methods, the cost of sales increased by 411 million yen, while operating profit, ordinary profit, and interim net income before taxes and other adjustments were all decreased by the same amount. Accrued retirement benefits for directors and corporate officers The recording method has changed: previously, retirement benefits for directors at some domestic consolidated subsidiaries were recorded at the time of retirement. However, this interim consolidated financial period, the retirement benefit system is abolished, and the amount recorded for directors’ retirement benefit allowances is determined on the basis of compensation commensurate with work performance during the term of duty, in the hopes of further improving financial health. The sum of 29 million yen incurred this interim consolidated financial period as a result of this change is recorded under selling, general, and administrative expenses, and the corresponding sum of 257 million yen from last financial year is recorded under extraordinary expenses. As a result of the above, in comparison with former methods, operating income and ordinary income were each decreased by 29 million yen, and interim net income before taxes was decreased by 286 million yen. Accounting standard for losses on fixed assets Starting this interim consolidated financial period, the "Accounting Standards for Losses on Fixed Assets" ("Opinion Concerning the Establishment of Accounting Standards for Losses on Fixed Assets" (Business Accounting Council, August 9, 2002) and "Guidelines for Adopting Accounting Standards for Losses on Fixed Assets" (Guidelines for Adopting Business Accounting Standards No. 6, October 31, 2003)) will be adopted. As a result of the above, net income before taxes and other adjustments posted a decrease of 229 million yen.

Consolidated Results
24
Consolidated Results FY 2005 1H
Notes to the Consolidated Balance Sheet (Units: millions of yen)
Current First Half Previous First Half PPrreevviioouuss FFuullll YYeeaarr
1. Total depreciation on tangible fixed assets
166,807
2. Total depreciation on tangible fixed assets
39,960
6,978 3. Total depreciation on tangible fixed assets
148
4. Total depreciation on tangible fixed assets
6,095
5,985 224 224
1. Total depreciation on tangible fixed assets
169,478
1. Total depreciation on tangible fixed assets
40,160
8,309 1. Total depreciation on tangible fixed assets
411
1. Total depreciation on tangible fixed assets
7,141
7,009 589 589
1. Total depreciation on tangible fixed assets
164,541
1. Total depreciation on tangible fixed assets
40,101
7,940 1. Total depreciation on tangible fixed assets
338
1. Total depreciation on tangible fixed assets
6,970
6,848 194 194
Notes to the Consolidated Statement of Income
The Company recorded the following impairment loss in the current interim consolidated period.
Application Category Location Amount Idle Land Kurashiki-shi,
Okayama prefecture 229 million yen
The above-mentioned land was previously held as company housing for employees, but the housing has since been dismantled, and it has become an idle asset. There was no utilization plan, and, due to depreciation of the value of the land, it has been recorded as an impairment loss. To make the impairment loss decision, business segments are as the basis, and, as idle property for which future use is not anticipated, it is grouped as an individual real estate unit. Furthermore, the collectible value amount is measured by net sales worth.

Consolidated Results
25
Consolidated Results FY 2005 1H
VII. Marketable Securities Current First Half (As of September 30, 2005) 1) Other marketable securities with market value (Millions of yen)
Acquisition Price Value on the
interim Balance Sheets
Difference
Stock 8,096 20,640 12,544 2) Other Marketable Securities without market value (Millions of yen)
Value on the Consolidated Balance Sheets Bonds held to maturity Unlisted bond 10 Total 10 Other marketable securities Unlisted stock 4,674 Other 1,016 Total 5,690
Previous First Half (As of September 30, 2004) 1) Other marketable securities with market value (Millions of yen)
Acquisition Price Value on the
interim Balance Sheets
Difference
Stock 7,078 13,897 6,819 Bond 8 10 2 Other 13 11 (2) Total 7,099 13,918 6,819
2) Other Marketable Securities without market value (Millions of yen)
Value on the Consolidated Balance Sheets Bonds held to maturity Unlisted bond 10 Total 10 Other marketable securities Unlisted stock 5,518 Other 1,024 Total 6,542

Consolidated Results
26
Consolidated Results FY 2005 1H
Previous Fiscal Year (As of March 31, 2005) 1) Other marketable securities with market value (Millions of yen)
Acquisition Price Value on the
interim Balance Sheets
Difference
Stock 8,232 15,717 7,486
2) Other Marketable Securities without market value (Millions of yen)
Value on the Consolidated Balance Sheets Bonds held to maturity Unlisted bond 10 Total 10 Other marketable securities Unlisted stock 4,775 Other 1,024 Total 5,800

Consolidated Results
27
Consolidated Results FY 2005 1H
VIII. Segment Information 1. Segment Information by Business Current First Half (April 1, 2005 to September 30, 2005)
(Units: millions of yen) SSeeggmmeenntt
IItteemm
AA
BB
CC
DD
EE TToottaall FF CCoonnssoolliiddaa--
ttiioonn
Net sales (1) Sales to external customers
103,566 31,853 24,281 27,274 58,882 245,857 -- 245,857
(2) Internal sales between segments or exchanges
680 1,313 229 125 35 2,382 2,382 --
Total 104,246 33,166 24,509 27,400 58,918 248,239 2,382 245,857 Operating expenses 91,182 33,093 25,783 24,297 55,381 229,736 2,373 227,363
Operating income/loss 13,064 73 (1,274) 3,102 3,537 18,502 9 18,494
Segments: A: Mass-Produced Machinery B: Environmental Protection Facilities, Plants & Others C: Ship, Steel Structure & Other Specialized Equipment D: Industrial Machinery E: Construction Machinery F: Cancellation or general Previous First Half (April 1, 2004 to September 30, 2004)
(Units: millions of yen) SSeeggmmeenntt
IItteemm
AA
BB
CC
DD
EE TToottaall FF CCoonnssoolliiddaa--
ttiioonn
Net sales (1) Sales to external customers
98,654 34,255 25,265 25,429 54,476 238,078 -- 238,078
(2) Internal sales between segments or exchanges
491 1,193 281 137 37 2,138 2,138 --
Total 99,145 35,447 25,546 25,566 54,512 240,217 2,138 238,078 Operating expenses 83,491 32,826 26,110 24,005 52,523 218,956 2,140 216,815
Operating income/loss 15,654 2,621 (564) 1,561 1,989 21,261 2 21,263
Segments: A: Mass-Produced Machinery B: Environmental Protection Facilities, Plants & Others C: Ship, Steel Structure & Other Specialized Equipment D: Industrial Machinery E: Construction Machinery F: Cancellation or general

Consolidated Results
28
Consolidated Results FY 2005 1H
Previous Full Year (April 1, 2004 to March 31, 2005)
(Units: millions of yen) SSeeggmmeenntt
IItteemm
AA
BB
CC
DD
EE TToottaall FF CCoonnssoolliiddaa--
ttiioonn
Net sales (1) Sales to external customers
205,091 87,937 65,288 54,008 108,985 521,310 -- 521,310
(2) Internal sales between segments or exchanges
1,253 2,653 553 397 69 4,926 4,926 --
Total 206,345 90,591 65,842 54,405 109,054 526,236 4,926 521,310 Operating expenses 175,930 83,497 65,364 49,571 103,093 477,454 4,917 472,537
Operating income/loss 30,415 7,094 478 4,834 5,961 48,782 9 48,773
Segments: A: Mass-Produced Machinery B: Environmental Protection Facilities, Plants & Others C: Ship, Steel Structure & Other Specialized Equipment D: Industrial Machinery E: Construction Machinery F: Cancellation or general Notes: 1. Business segment depends on sales total segment 2. Main products of each business segment Businesses Main Products Mass-Produced Machinery Power Transmission Equipment, Plastic Injection Molding Machines,
Laser Processing Systems, Defense Equipment, Cryogenic Equipment, Precision XY Stages, Cyclotrons for Medical Use
Environmental Protection Facilities, Plants & Others
Water and Sewage Treatment Systems, Industrial Waste Treatment Facilities, Chemical Process Equipment & Plants, Software, Real Estate
Ship, Steel Structure & Other Specialized Equipment
Ships, Bridge & Steel Structures
Industrial Machinery Forging Machines, Material Handling Systems, Turbines, Pumps Construction Machinery Hydraulic Excavators, Mobile Cranes 3. Changes in Accounting Method Allowances for losses on ordered construction The recording method has changed: from this interim consolidated financial period, if there are undelivered construction orders for which it is estimated, at the end of the interim consolidated financial period, that extensive losses are likely to occur after the interim consolidated financial period, and for which a rational estimate of the amount of the losses is possible, then the estimated amount of the losses which are expected to occur after the first half will be recorded under allowances for losses on construction orders. As a result, in comparison with former method, "Ship, Steel Structure and Other specialized equipment" operating expenses and operating losses each increased by 411 million yen.

Consolidated Results
29
Consolidated Results FY 2005 1H
Accrued retirement benefits to directors and corporate officers The recording method has changed: previously, retirement benefits for company officers at some domestic consolidated subsidiaries were recorded at the time of retirement. However, this interim consolidated financial period, the retirement benefit system is abolished, and the amount recorded for company officer retirement benefit allowances is determined on the basis of compensation commensurate with work performance during the term of duty, in the hopes of further improving financial health. As a result of the above, in comparison with former method, operating expenses increased by 29 million yen, and operating income decreased by the same amount. Effect by segment is as follows.
(Units: millions of yen) SSeeggmmeenntt
IItteemm
MMaassss--
PPrroodduucceedd MMaacchhiinneerryy
EEnnvviirroonnmmeenn
ttaall PPrrootteeccttiioonn FFaacciilliittiieess,, PPllaannttss && OOtthheerrss
SShhiipp,, SStteeeell SSttrruuccttuurree &&
OOtthheerr SSppeecciiaalliizzeedd EEqquuiippmmeenntt
IInndduussttrriiaall MMaacchhiinneerryy
CCoonnssttrruuccttiioonn
MMaacchhiinneerryy TToottaall
Increase in operating expenses 9 5 3 3 9 29
Decrease in operating expenses 9 5 3 3 9 29

Consolidated Results
30
Consolidated Results FY 2005 1H
2. Segment Information by Geographical Area Current First Half (April 1, 2005 to September 30, 2005)
(Units: millions of yen) SSeeggmmeenntt
IItteemm
JJaappaann
NNoorrtthh
AAmmeerriiccaa
OOtthheerrss TToottaall
CCaanncceellllaa--ttiioonn oorr ggeenneerraall
CCoonnssoolliiddaa--ttiioonn
Net sales (1) Sales to external customers 207,537 25,556 12,764 245,857 -- 245,857
(2) Internal sales between segments or exchanges
13,068 416 1,260 14,744 14,744 --
Total 220,605 25,972 14,023 260,601 14,744 245,857
Operating expenses 205,079 24,052 13,093 242,224 14,861 227,363
Operating income 15,526 1,920 931 18,377 117 18,494
Previous First Half (April 1, 2004 to September 30, 2004)
(Units: millions of yen) SSeeggmmeenntt
IItteemm
JJaappaann
NNoorrtthh
AAmmeerriiccaa
OOtthheerrss TToottaall
CCaanncceellllaa--ttiioonn oorr ggeenneerraall
CCoonnssoolliiddaa--ttiioonn
Net sales (1) Sales to external customers 207,917 19,368 10,793 238,078 -- 238,078
(2) Internal sales between segments or exchanges
13,335 502 1,421 15,259 15,259 --
Total 221,252 19,870 12,214 253,337 15,259 238,078
Operating expenses 201,506 19,084 11,243 231,833 15,018 216,815
Operating income 19,747 786 971 21,504 241 21,263

Consolidated Results
31
Consolidated Results FY 2005 1H
Previous Full Year (April 1, 2004 to March 31, 2005) (Units: millions of yen)
SSeeggmmeenntt IItteemm
JJaappaann
NNoorrtthh
AAmmeerriiccaa
OOtthheerrss TToottaall
CCaanncceellllaa--ttiioonn oorr ggeenneerraall
CCoonnssoolliiddaa--ttiioonn
Net sales (1) Sales to external customers 458,947 39,535 22,829 521,310 -- 521,310
(2) Internal sales between segments or exchanges
23,920 872 2,894 27,685 27,685 --
Total 482,867 40,406 25,723 548,996 27,685 521,310
Operating expenses 437,675 38,390 23,963 500,027 27,490 472,537
Operating income 45,192 2,017 1,760 48,968 195 48,773
Notes: 1. Countries and regions classified by geographical proximity. 2. Countries and regions belonging to each classification: North America: USA, and Canada Others: UK, Germany, Singapore, and China
3. Changes in Accounting Method Allowances for losses on ordered construction The recording method has changed: after this interim consolidated financial period, if there are undelivered construction orders for which it is estimated, at the end of the interim consolidated financial period, that extensive losses are likely to occur after the interim consolidated financial period, and for which a rational estimate of the amount of the losses is possible, then the estimated amount of the losses which are expected to occur after the first half will be recorded under allowances for losses on construction orders. As a result, in comparison with former method, operating expenses for "Japan" increased by 411 million yen, and operating income decreased by the same amount. Accrued retirement benefits to directors and corporate officers The recording method has changed: previously, retirement benefits for company officers at some domestic consolidated subsidiaries were recorded at the time of retirement. However, this interim consolidated financial period, the retirement benefit system is abolished, and the amount recorded for company officer retirement benefit allowances is determined on the basis of compensation commensurate with work performance during the term of duty, in the hopes of further improving financial health. As a result of the above, in comparison with former method, operating expenses for "Japan" increased by 29 million yen, and operating income decreased by the same amount.

Consolidated Results
32
Consolidated Results FY 2005 1H
3. Overseas Sales Current First Half (April 1, 2005 to September 30, 2005)
(Units: millions of yen) North
America Asia Others Total
I. Overseas sales 41,348 30,669 29,629 101,646
II. Consolidated sales 245,857
III. Overseas sales ratio(%) 16.8 12.5 12.1 41.3
Previous First Half (April 1, 2004 to September 30, 2004)
(Units: millions of yen) North
America Asia Others Total
I. Overseas sales 35,724 31,061 29,380 96,165
II. Consolidated sales 238,078
III. Overseas sales ratio(%) 15.0 13.0 12.3 40.4 Previous Full Year (April 1, 2004 to March 31, 2005)
(Units: millions of yen) North
America Asia Others Total
I. Overseas sales 78,471 63,126 56,211 197,807
II. Consolidated sales 521,310
III. Overseas sales ratio(%) 15.1 12.1 10.8 37.9
Notes: 1. Countries and regions classified by geographical proximity. 2. Countries and regions belonging to each classification: North America: USA, and Canada Asia: Singapore, and China Others: UK, and Germany 3. Sales are from the Company and subsidiaries’ countries and regions other than Japan.
Consolidated Results
33
Consolidated Results FY 2005 1H
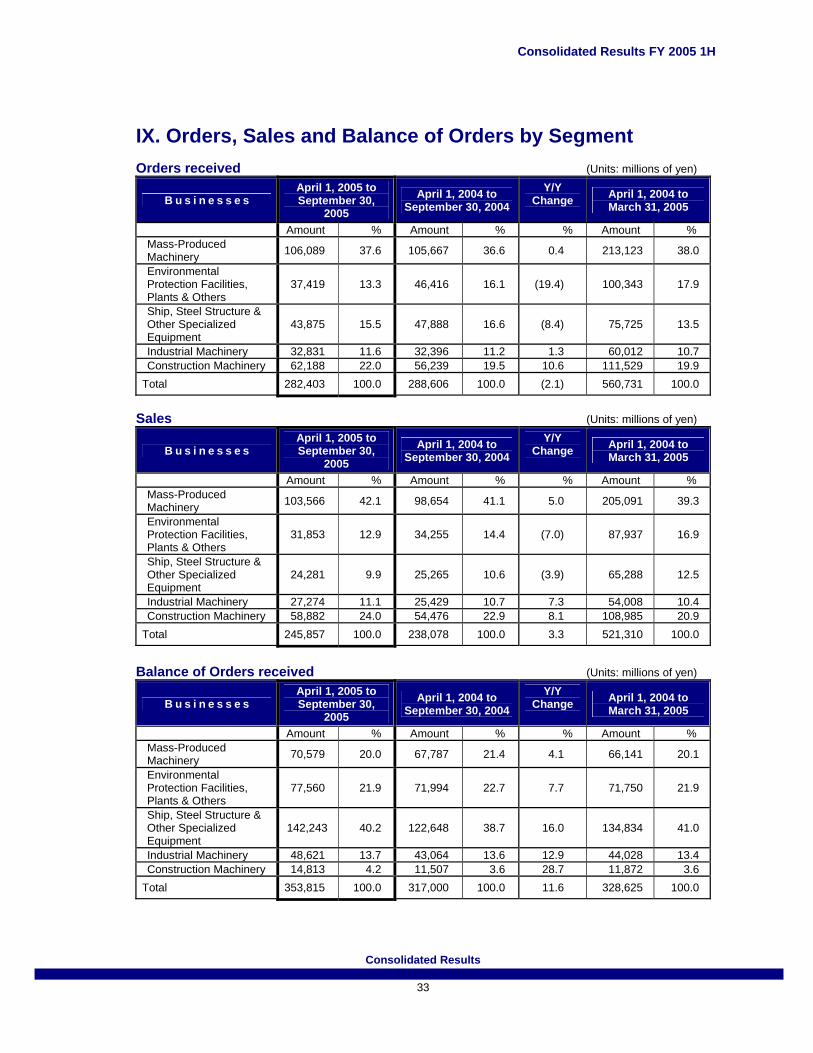
IX. Orders, Sales and Balance of Orders by Segment Orders received (Units: millions of yen)
B u s i n e s s e s April 1, 2005 to September 30,
2005 April 1, 2004 to
September 30, 2004 Y/Y
Change
April 1, 2004 to March 31, 2005
Amount % Amount % % Amount % Mass-Produced Machinery 106,089 37.6 105,667 36.6 0.4 213,123 38.0
Environmental Protection Facilities, Plants & Others
37,419 13.3 46,416 16.1 (19.4) 100,343 17.9
Ship, Steel Structure & Other Specialized Equipment
43,875 15.5 47,888 16.6 (8.4) 75,725 13.5
Industrial Machinery 32,831 11.6 32,396 11.2 1.3 60,012 10.7 Construction Machinery 62,188 22.0 56,239 19.5 10.6 111,529 19.9
Total 282,403 100.0 288,606 100.0 (2.1) 560,731 100.0
Sales (Units: millions of yen)
B u s i n e s s e s April 1, 2005 to September 30,
2005 April 1, 2004 to
September 30, 2004 Y/Y
Change
April 1, 2004 to March 31, 2005
Amount % Amount % % Amount % Mass-Produced Machinery 103,566 42.1 98,654 41.1 5.0 205,091 39.3
Environmental Protection Facilities, Plants & Others
31,853 12.9 34,255 14.4 (7.0) 87,937 16.9
Ship, Steel Structure & Other Specialized Equipment
24,281 9.9 25,265 10.6 (3.9) 65,288 12.5
Industrial Machinery 27,274 11.1 25,429 10.7 7.3 54,008 10.4 Construction Machinery 58,882 24.0 54,476 22.9 8.1 108,985 20.9
Total 245,857 100.0 238,078 100.0 3.3 521,310 100.0
Balance of Orders received (Units: millions of yen)
B u s i n e s s e s April 1, 2005 to September 30,
2005 April 1, 2004 to
September 30, 2004 Y/Y
Change
April 1, 2004 to March 31, 2005
Amount % Amount % % Amount % Mass-Produced Machinery 70,579 20.0 67,787 21.4 4.1 66,141 20.1
Environmental Protection Facilities, Plants & Others
77,560 21.9 71,994 22.7 7.7 71,750 21.9
Ship, Steel Structure & Other Specialized Equipment
142,243 40.2 122,648 38.7 16.0 134,834 41.0
Industrial Machinery 48,621 13.7 43,064 13.6 12.9 44,028 13.4 Construction Machinery 14,813 4.2 11,507 3.6 28.7 11,872 3.6
Total 353,815 100.0 317,000 100.0 11.6 328,625 100.0