Sulphur Extraction at Bryan Mound -...
35
SANDIA REPORT SAND2015-6827 Unlimited Release Printed August 2015 Sulphur Extraction at Bryan Mound Carolyn L. Kirby and Anna S. Lord Prepared by Sandia National Laboratories Albuquerque, New Mexico 87185 and Livermore, California 94550 Sandia National Laboratories is a multi-program laboratory managed and operated by Sandia Corporation, a wholly owned subsidiary of Lockheed Martin Corporation, for the U.S. Department of Energy's National Nuclear Security Administration under contract DE-AC04-94AL85000. Approved for public release; further dissemination unlimited.
Transcript of Sulphur Extraction at Bryan Mound -...

SANDIA REPORT SAND2015-6827 Unlimited Release Printed August 2015
Sulphur Extraction at Bryan Mound Carolyn L. Kirby and Anna S. Lord Prepared by Sandia National Laboratories Albuquerque, New Mexico 87185 and Livermore, California 94550
Sandia National Laboratories is a multi-program laboratory managed and operated by Sandia Corporation, a wholly owned subsidiary of Lockheed Martin Corporation, for the U.S. Department of Energy's National Nuclear Security Administration under contract DE-AC04-94AL85000. Approved for public release; further dissemination unlimited.

2
Issued by Sandia National Laboratories, operated for the United States Department of Energy by Sandia Corporation. NOTICE: This report was prepared as an account of work sponsored by an agency of the United States Government. Neither the United States Government, nor any agency thereof, nor any of their employees, nor any of their contractors, subcontractors, or their employees, make any warranty, express or implied, or assume any legal liability or responsibility for the accuracy, completeness, or usefulness of any information, apparatus, product, or process disclosed, or represent that its use would not infringe privately owned rights. Reference herein to any specific commercial product, process, or service by trade name, trademark, manufacturer, or otherwise, does not necessarily constitute or imply its endorsement, recommendation, or favoring by the United States Government, any agency thereof, or any of their contractors or subcontractors. The views and opinions expressed herein do not necessarily state or reflect those of the United States Government, any agency thereof, or any of their contractors. Printed in the United States of America. This report has been reproduced directly from the best available copy. Available to DOE and DOE contractors from U.S. Department of Energy Office of Scientific and Technical Information P.O. Box 62 Oak Ridge, TN 37831 Telephone: (865) 576-8401 Facsimile: (865) 576-5728 E-Mail: [email protected] Online ordering: http://www.osti.gov/scitech Available to the public from U.S. Department of Commerce National Technical Information Service 5301 Shawnee Rd Alexandria, VA 22312 Telephone: (800) 553-6847 Facsimile: (703) 605-6900 E-Mail: [email protected] Online order: http://www.ntis.gov/search

3
SAND200X-XXXX Unlimited Release
Printed August 2015
Sulphur Extraction at Bryan Mound
Carolyn L. Kirby and Anna S. Lord
Sandia National Laboratories P.O. Box 5800
Albuquerque, New Mexico 87185-MS0750
ABSTRACT The Bryan Mound caprock was subjected to extensive sulphur mining prior to the development of the Strategic Petroleum Reserve. Undoubtedly, the mining has modified the caprock integrity. Cavern wells at Bryan Mound have been subject to a host of well integrity concerns with many likely compromised by the cavernous caprock, surrounding corrosive environment (H2SO4), and associated elevated residual temperatures all of which are a product of the mining activities. The intent of this study was to understand the sulphur mining process and how the mining has affected the stability of the caprock and how the compromised caprock has influenced the integrity of the cavern wells. After an extensive search to collect pertinent information through state agencies, literature searches, and the Sandia SPR library, a better understanding of the caprock can be inferred from the knowledge gained. Specifically, the discovery of the original ore reserve map goes a long way towards modeling caprock stability. In addition the gained knowledge of sulphur mining – subsidence, superheated corrosive waters, and caprock collapse - helps to better predict the post mining effects on wellbore integrity.

4
This page intentionally left blank

5
CONTENTS
Abstract ................................................................................................................................3
1. Introduction .....................................................................................................................8
2. Approach ..........................................................................................................................8
3. Geology of Caprock Sulphur ...........................................................................................9 3.1 Sulphur Formation .................................................................................................. 9 3.2 Bryan Mound Caprock Sulphur ............................................................................ 10
4. Frasch Sulphur Mining History .....................................................................................13 4.1 Conventional Mining Techniques ......................................................................... 13 4.2 Frasch Mining ....................................................................................................... 13
5. Bryan Mound Sulphur Mining History ..........................................................................16
6. Subsidence .....................................................................................................................19
7. Discussion ......................................................................................................................20
8. Summary ........................................................................................................................29
References ..........................................................................................................................30
Distribution ........................................................................................................................33
FIGURES Figure 1. Map of Texas salt domes showing area of sulphur mineralization. (Seni et al, 1985 – with permission from UT-BEG) ............................................................................12 Figure 2. Casing string detail for caprock sulphur production well (after Myers, 1968, as taken from Seni et al 1985 with permission from UT-BEG). ............................................15 Figure 3 Freeport Sulphur 1935 Ore Reserves map. .........................................................17 Figure 4. Map of the Bryan Mound salt dome, overlying caprock (elevation in color), SPR caverns, and the 1935 sulphur ore map (black lines). ................................................22 Figure 5. Plot of recorded cavern well loss circulation zones encountered during drilling. (No information for the original Dow Chemical cavern wells 1-5) ...................................23 Figure 6. Caprock temperatures logged within the Bryan Mound caprock. Temperature in F. (from Sattler, 2004) .......................................................................................................28
TABLES Table 1. Driller’s log from Gulf Development Company Well no. 4 (from Vail, 1912) .18 Table 2. List of cavern wells, top of salt, top of caprock, lost circulation zones, gas encountered, and pertinent notes. All measurements are depth. ........................................24 Table 3. Most recent temperature measurements as of June, 2015. .................................27

6
This page intentionally left blank

7
NOMENCLATURE DOE Department of Energy F Fahrenheit LPG Liquefied petroleum gas psi Pounds per square inch SNL Sandia National Laboratories TECQ Texas Commission on Environmental Quality TRRC Texas Railroad Commission

8
1. INTRODUCTION The Bryan Mound caprock was subjected to extensive sulphur mining prior to the
development of the Strategic Petroleum Reserve. Undoubtedly, the mining has modified
the caprock integrity. Cavern wells at Bryan Mound have been subject to a host of well
integrity concerns with many likely compromised by the cavernous caprock, surrounding
corrosive environment (H2SO4), and associated elevated residual temperatures all of
which are a product of the mining activities.
The intent of this study was to develop a map that identifies where the bulk of the sulphur
extraction occurred, which could be used as an analog to imply the location of the most
crumbled and cavernous regions within the caprock. What is known is the location of
many of the sulphur wells drilled, but what is not well understood is the production
success or ore volume of each well along with an understanding of the geologic sulphur
distribution within the caprock. The creation of an ore extraction map would help to
improve the Bryan Mound geomechanics model and the cavern well integrity predictions.
This paper presents the geology of caprock sulphur, the sulphur mining process, the
sulphur mining history at Bryan Mound, also known as Bryan Heights, as well as a
discussion on how the information collected through state agencies, literature searches,
and the Sandia SPR library advances our understanding of the Bryan mound caprock
structure and environment.
2. APPROACH The approach to collect pertinent sulphur production data was to (1) search the Texas
State agencies records, (2) scour the published literature, and (3) comb through the
Sandia Strategic Petroleum Reserve physical library for possible misplaced and/or
currently unknown relevant documents.
State agencies contacted were the Texas Railroad Commission (TRRC) and the Texas
Commission on Environmental Quality (TCEQ). After contacting the TRRC, the state
agency that regulates the oil and gas industry, gas utilities, pipeline safety, safety in the

9
liquefied petroleum gas (LPG) industry, and surface coal and uranium mining, it was
discovered that this agency does not have sulphur production records from the 1900’s.
After 1981 any records of this type were regulated by TCEQ and sulphur wells were
classified as Class III wells, which are underground injection wells. The TECQ does not
have any information on sulphur wells drilled at Bryan Mound. Although the TCEQ
currently is the state agency responsible for permitting injection wells for sulphur
recovery, Bryan Mound was mined prior to TECQ’s issuance of these permits and over-
site. Any actual production records were only required to be held by the operator.
Freeport Sulphur was the main operator on the Bryan Mound dome and has maintained a
policy of confidentiality from the very beginning. This has hampered site
characterizations in later years. DOE and Freeport were in litigation concerning the
condemnation of the site during the 1980’s and the outcome of that litigation is unknown
at this time, suffice to say that Sandia never received records of sulphur production:
tonnage extracted from each well.
Research for this project had to take another direction - contacting retired Sandians,
making contact with colleagues at the University of Texas at Austin - Bureau of
Economic Geology, looking through old records in the Sandia Strategic Petroleum
Reserve Library, and an internet literature search (searching on both spellings of sulphur
and sulfur). A number of key publications from the early 1900’s describe the history of
Bryan Mound and the fundamentals of the sulphur mining that took place.
3. GEOLOGY OF CAPROCK SULPHUR 3.1 Sulphur Formation Only about 20 percent of the salt domes in the Gulf Coast contain sulphur within their
overlying caprocks. A caprock is formed from the dissolution of the underlying salt and
consists of the impurities remaining after dissolution. Caprock generally is comprised of
anhydrite and layering of its diagenetic products gypsum and limestone, in addition to
such compounds as sulfate. Elemental sulphur is formed from the bacterial reduction of

10
sulfate (Kyle, 2002). Sulphur present in caprocks, available for mining, is native sulphur
distributed throughout the different strata of the caprock, “occasionally it is in a more or
less continuous bed, but it usually fills seams, fissures, and cavities, or is disseminated
through the porous limestone” (Baker, 1935). The sulphur associated limestone portion of
caprock is naturally honeycombed or vuggy and fractured, but this does not necessarily
mean the sulphur deposits are universal throughout the entire caprock. Sulphur also can
occur in the anhydrite but cannot be mined because this rock lacks the necessary porosity.
The minable sulphur only occurs in the porous limestone (Baker, 1935).
In general, sulphur deposits are found between the anhydrite/gypsum below and the
limestone above. Sulphur deposits within the caprock are never uniform. Some salt
domes exhibit sulphur across the entire caprock while others have deposits concentrated
around the edges of the dome and smaller volumes of ore scattered over the top. The
sulphur zones may also be present in one or more horizons. There is no correlation
between the thicknesses of the anhydrite/limestone zones to the thickness of the sulphur
regions. On some domes, the alteration within the deposit is not complete from gypsum
to limestone and sulphur and is a matrix in unequal quantities, both laterally and
vertically. This type of mineralization is very prevalent at Bryan Mound, where this can
either be noted in all the deposits across the entirety of the caprock or in only along the
edges of a deposit (Myers, 1968).
3.2 Bryan Mound Caprock Sulphur Prior to 1904 seven wells were drilled for petroleum exploration over Bryan Mound.
During this exploration for oil and gas, large quantities of sulphur were discovered
dispersed through the gypsum and limestone layers at a depth between 700 and 900 feet
over 300 acres (Kennedy 1926).
Bryan Mound is considered a medium sized dome with the sulphur ore concentrated
around the periphery of the dome with smaller quantities deposited intermittently across
the rest of the dome (see Figure 1). Bryan Mound caprock is an example of where the
alteration to sulphur is incomplete universally across the dome and quantities of

11
limestone, sulphur, and gypsum are present in unequal distributions both laterally and
vertically throughout (Myers, 1968).
The caprock at Bryan Mound is circular in shape, with the shallowest elevation
documented at -682 ft located in the northwest region. The greatest thickness of caprock
is over the northwest region with a thickness exceeding 400 ft (Lord, 2007). The caprock
has been characterized in several reports as having three units (Hogan, 1980; Kennedy,
1926). The three unit division of caprock is very typical in Gulf Coast Salt Domes. Hogan
(1980) describes the caprock as follows:
Unit 1 (uppermost) consists of limestone with water or sulphur-filled pore space.
Unit 2 (middle) is a transition zone and consists of limestone, gypsum, sulphur and
anhydrite.
Unit 3 (lowermost) consists of anhydrite.
The sulphur deposits are dominant within the middle cavernous unit. Crystalline sulphur
is found within these voids, along fractures, and as stalactites and plates. Drilled wells
indicate that sulphur is unevenly distributed throughout the unit. No two wells were
similar in sulphur content (Kennedy, 1926).

12
Figure 1. Map of Texas salt domes showing area of sulphur mineralization. (Seni et al, 1985 – with permission from UT-BEG)
13
4. FRASCH SULPHUR MINING HISTORY
Native sulphur was known to the ancients as brimstone or “the stone that
burns” -Warren, 2005
Sulphur has long been a sought after commodity since the days of early man. Sulphur
has been used as a fumigant, in medicine, as a bleaching agent, in incendiary weapons, in
gun powder, and as sulphuric acid (Warren, 2005). By the early 1900’s with the
introduction of the Frasch mining process it became economic to extract sulphur from the
caprocks of salt domes along the Gulf Coast. The caprock over the Bryan Mound salt
dome was the second dome to be mined for sulphur along the Gulf Coast.
4.1 Conventional Mining Techniques
When sulphur was discovered in the Gulf Coast area in conjunction with the drilling for
oil, typical sulphur mining techniques were employed with disastrous results and death.
Noxious gases, overlying gumbo and quicksand, petroleum, and flows of underground
water charged with hydrogen sulfide prohibited conventional underground mining of the
sulphur. Understandably, the sulphur remained untouched until another method could be
devised (Hawkins and Jirik, 1966; Seni et al., 1984; Kyle 2002).
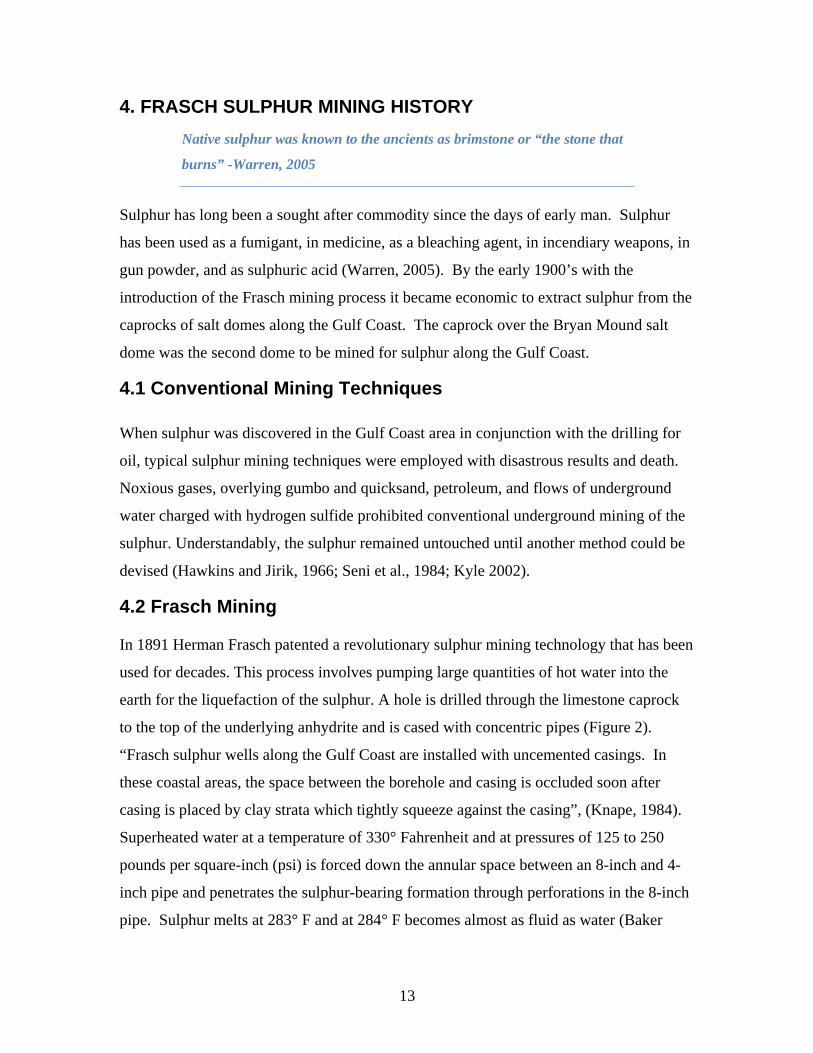
4.2 Frasch Mining In 1891 Herman Frasch patented a revolutionary sulphur mining technology that has been
used for decades. This process involves pumping large quantities of hot water into the
earth for the liquefaction of the sulphur. A hole is drilled through the limestone caprock
to the top of the underlying anhydrite and is cased with concentric pipes (Figure 2).
“Frasch sulphur wells along the Gulf Coast are installed with uncemented casings. In
these coastal areas, the space between the borehole and casing is occluded soon after
casing is placed by clay strata which tightly squeeze against the casing”, (Knape, 1984).
Superheated water at a temperature of 330° Fahrenheit and at pressures of 125 to 250
pounds per square-inch (psi) is forced down the annular space between an 8-inch and 4-
inch pipe and penetrates the sulphur-bearing formation through perforations in the 8-inch
pipe. Sulphur melts at 283° F and at 284° F becomes almost as fluid as water (Baker

14
1935). After about two or three days the melted sulphur runs to the bottom of the well and
is then forced several hundred feet up the 4-inch pipe by the pressure of the water pumps
and the head of water. When sufficient melted sulphur has accumulated, a part of the
water flow is discontinued and air is forced down a 1-1/4-inch pipe at a pressure of about
500 psi. The melted sulphur is forced to the surface by the air pressure and is carried by
centrifugal pumps through steam-heated lines to storage bins. (Vail, 1912; Baker, 1935;
Bartlett, 1946; Ellison, 1971; Seni et al., 1985)
To obtain one long ton of sulphur 500 to 900 cubic feet of compressed air and 1,500 to
7,000 gallons of hot water are required (Ellison 1971). This is a continuous process - the
water and air must flow 24 hours a day for the life of the well. One well is able to remove
the sulphur from an area of about one-half acre (Baker 1935). Normally two to four wells
are required to deplete sulphur bearing limestone underlying one surface acre (Hawkins
and Jirik, 1966). Wells are typically placed 50 to 100 feet apart. Separate wells must be
drilled in a location, away from the sulphur wells, to remove the excess cooled water
from the sulphur-bearing zone. These “bleed-off” wells reduce the injection pressure
required to circulate the superheated water. Bleed-off water can be reused in the system
(Ellison, 1971; Knape, 1984). These wells add to the hydrology of the upper segments of
the overlying lithology.
The productive life of a sulphur well may range from a few days to several months,
depending upon subsurface conditions related to the circulation of hot water, molten
sulphur and subsidence. Subsidence can cause shifts in formations overlying the mining
area that result in crushed or sheared well pipes and the collapse of well bores, thereby
ending the useful life of wells (Hawkins and Jirik, 1966). The early wells were also
affected by the corrosive action from the sulphur itself. A change to zinc and aluminum
tubing and compressed air added to the system alleviated the tubing failures (Vail, 1912).
Other operating problems encountered were tubing separation and a loss of the well due
to subsidence.
15
Figure 2. Casing string detail for caprock sulphur production well (after Myers, 1968, as taken from Seni et al 1985 with permission from UT-BEG).
As sulphur is withdrawn, the limestone naturally becomes more porous and cavernous.
The rock is unable to support the weight of the overlying formations and begins to break
down and subside (Marx 1935). The collapse of the mined rock fills the voids once the
sulphur has been melted and removed, this results in sealing off the mined areas and
ideally confines the hot water to the mineable portions of the caprock. In some areas,

16
subsidence has not been entirely effective in preventing the escape of hot water, resulting
in increased mining cost. As cavities develop, collapse and subsidence of the strata may
cause breakage of pipe and damage to surface installations. When a well was lost, the
Freeport Sulphur company would pump sawdust with the superheated water and be able
to extend the life of the well and extract additional tonnage from that well. Mining
practices evolved to injecting mud to fill and plug possible channels of escape. This
reduced the need for increased hot water and lessened some of the dangers of collapse
and subsidence. “The injection of the mud has resulted in increased tonnage per well and
higher thermal efficiency” (Marx 1935). When a well was lost, the operator would
dynamite the well and allow the overburden to fill in the hole. At this time in history there
were no regulated processes to abandon a well. All wells are eventually lost to
subsidence.
5. BRYAN MOUND SULPHUR MINING HISTORY Bryan Mound was the second dome along the Gulf Coast to be mined for sulphur using
the Frasch process. Bryan Mound was initially explored for oil, but the small quantities
of oil discovered did not make the site attractive for oil recovery.
However, logs of those 16 drilled oil exploration holes showed the presence of large
sections of sulphur (See Table 1 for an example). Eleven sulphur test wells were drilled in
1910. Sulphur in commercial quantity was found in 10 of the test wells between a depth
700 and 900 feet. Freeport Sulphur became the dome operator from 1912 to 1935 and
initially reported that “about 760 ft. of gravel, ‘gumbo’ and caprock were encountered;
then about 150 ft. of sulphur-bearing limestone, dolomite and gypsum; there were some
beds of pure sulphur varying in thickness from a few inches to 7 ft.; the sulphur ceased at
from 900 to 1100 ft., being succeeded by pure gypsum and rock salt, to which no
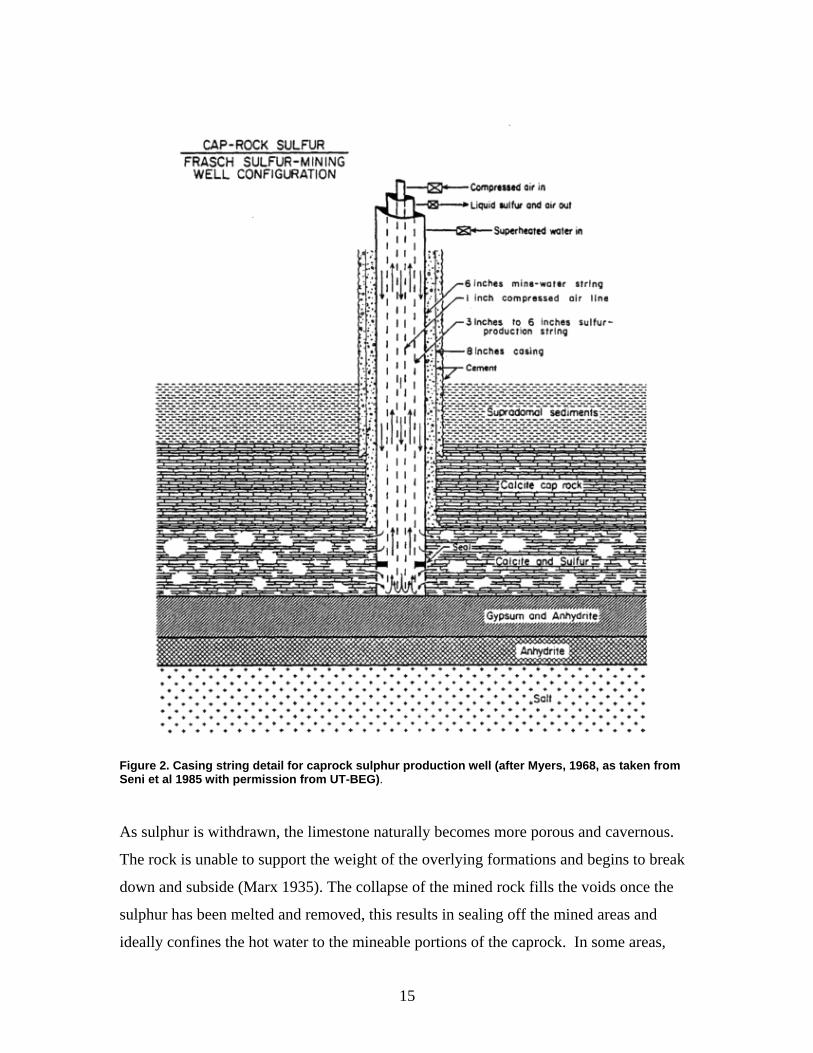
commercial importance is at present attached” (Vail, 1912). A 1935 ore reserve map
(Figure 3) shows the location of the approximately 300 acres of economical sulphur
available for mining.
17
Figure 3 Freeport Sulphur 1935 Ore Reserves map.
18
During the life of Bryan Mound, 1897 wells were drilled, resulting in a total production
of about 5,000,000 long tons, or slightly over 2,600 long tons per well (this statistic is
simple math) (Bartlett, 1946). Halbouty (1979) gives a total production of sulphur
mining for Bryan Mound of 5,006,248 long tons. With the additional 19 wells drilled by
Monsanto and 42 Hooker wells we have a total of 1958 wells drilled or re-worked for a
total production of 2556 long tons per well. Hooker extracted sulphur at slightly deeper
depths, near 1,000 feet, within previously worked zones. Actual records of individual
sulphur well production at Bryan Mound are simply not available. Some reports indicate
there were over 2000 sulphur wells that were “steamed”.
The porous nature of the sulphur-bearing rock requires an enormous volume of
superheated water for melting the sulphur. According to Kennedy (1926), the average
daily consumption of water at Bryan Mound in the early production years was 7,000,000
gallons. In actuality, Bryan Mound is said to have used 9,000,000 gallons per day
(Bartlett 1946).
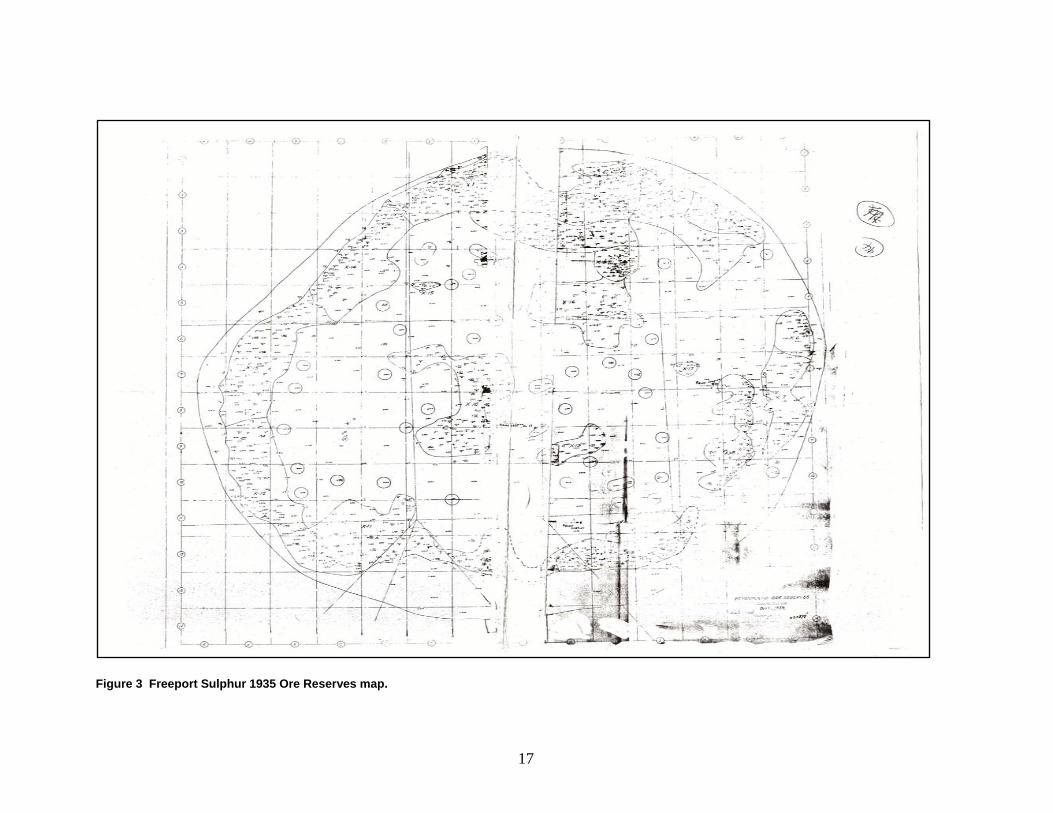
Table 1. Driller’s log from Gulf Development Company Well no. 4 (from Vail, 1912) Depth (feet) Lithology
818-884 Limerock, sulphur and gypsum
844-900 Gypsum and sulphur
900-920 Gypsum and small amount of sulphur
920-925 Limerock and sulphur
925-960 Gypsum and small amount of sulphur
960-988 Limerock and sulphur
988-997 Gypsum
997-1034 Limerock and pyrites
1034-1039 Sand rock

19
1039-1067 Salt rock
1067-1086 Salt rock
* Note - Hole lost all water at about 915 ft. And while working the hole, a small amount of black sulphur water would flow. The rock in this hole was badly broken and considerable core was ground up, amounting in all to 62 ft.
6. SUBSIDENCE
Subsidence from sulphur mining is dependent on the distribution of sulphur deposits both
laterally and vertically as well as the zones actually mined. The dip of the sulphur beds
mined has the greatest impact to surface subsidence distribution. If production zones are
flat lying then subsidence typically is caused by large horizontal movement and displays
at the surface as broad subsidence bowls. Roughly circular collapse features occur from
mining of thick sulphur beds at steep dips (Mullican, 1988). Sulphur deposits at Bryan
Mound are generally flat lying and therefore display larger horizontal than vertical
displacement. An additional contributor to subsidence related to sulphur mining was the
dynamiting of sulphur wells once they were lost (see section 4.2).
Subsidence at Bryan Mound has been noted in early literature. Kennedy (1926) states the
mound rose to an elevation of about 23 feet and covered an area of approximately 400
acres. “Since operations have been in progress, the surface has sunk about 2 feet”. In
Sawtelle’s ‘Salt Dome Statistics’ (1936) he records the elevation of Bryan Mound at 20
feet. In 1980, Hogan reported the dome was at an elevation of 19 feet. Current elevation
has dropped nearly a foot since 1985. There are no published subsidence records from
Freeport Sulphur or Dow Chemical (operator of the first brine caverns mined on the
dome). Notable surface features were the occurrence of Blue Lake to the north and
northwest where a considerable amount of mining occurred and Mud Lake to the
southeast. Both Lakes were not present when mining initiated.

20
7. DISCUSSION It is thought that having a better understanding of the sulphur mining process, the extent
of extraction, along with sulphur ore location would aid in caprock integrity modeling
and cavern well integrity predictions. The sulphur information that was able to be
collected and assembled certainly helps towards beginning to understand the extent of the
mining damage done to the Bryan Mound caprock.
Sulphur crystalizes within voids and fractures and once the sulphur is removed open
space is left behind. With the weight of the overburden the voids collapse and fill with
surrounded crumbled rock which may be expressed as subsidence at the surface. It can be
presumed that the vast amount of the broken up caprock is within the mapped sulphur ore
regions.
Each well had the capacity to remove sulphur from a one-half acre area. It typically took
2 to 4 wells to deplete one acre of sulphur reserves. Over 2000 wells were drilled.
However, it is presumed that not every well drilled was a successful producer based on
the lack of continuity across the sulphur deposit. In addition, some wells collapsed before
production could begin. It can be assumed that the majority of the mining activity
occurred within these mapped ore regions. Out of the 2000 plus wells drilled Sandia only
has approximately 600 of those wells in their database; therefore making it difficult to
compare the actual sulphur well location to the mapped reserves.
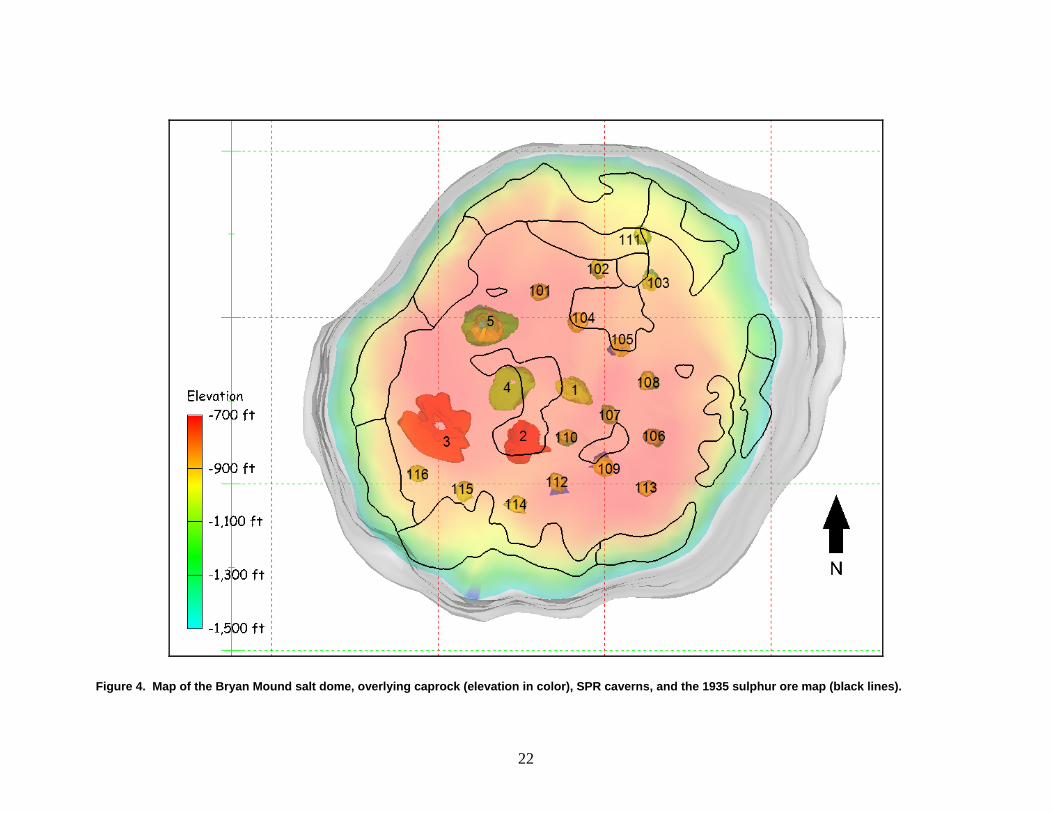
Figure 4 displays the Bryan Mound salt dome, overlying caprock colored by depth, the
SPR caverns, and the 1935 mapped sulphur ore reserves. The map allows for the
comparison of the sulphur ore regions to the locations of the existing SPR caverns.
Caprock regions affected by sulphur mining can impact drilling. It is almost certain that
the sulphur extraction impacted the natural fracture system of the caprock and that the
crumbled rock within the mined regions caused issues while drilling the cavern wells.
Circulation was lost in the upper caprock, the caprock/salt interface, and in some cases,
down to 50 to 100 feet within the salt. It should be noted that it is probable that lost

21
circulation zones encountered in the upper salt actually occurred within the caprock. A
change in mud once reaching the salt zone could cause a breakdown in the mudcake
accumulated within the caprock zone, giving the impression of loss of circulation within
the salt (Hogan, 1980).
Well completion records (Louis Records and Assoc., 1979; Williams-Fenix & Scisson,
1979-1980; Jacobs/D’Apolonia Engineers, 1982-1983) for the wells drilled for DOE
(drilling information for the original Dow Chemical cavern wells 1-5 was not found)
indicate that many of the cavern wells had problems during drilling and the loss
circulation zones encountered within the caprock affected 11 of the cavern wells while
being drilled. However, in total, 21 wells out of 38 experienced loss of circulation within
either the caprock, salt/cap interface, or salt. Figure 5 displays a plot of the cavern well
loss circulation zones relative to the ore reserve map. Table 2 lists the cavern wells and
notes if loss circulation zones were encountered and if so at what depths. In general,
across a variety of salt domes, it is common to see loss circulation zones at caprock/salt
interfaces. Also caprocks by nature are fractured and faulted and loss circulation zones
can occur without the influence of sulphur mining. The cavern wells that were not
plagued with drilling issues are all wells from caverns 101, 105, 112, and 113.
22
Figure 4. Map of the Bryan Mound salt dome, overlying caprock (elevation in color), SPR caverns, and the 1935 sulphur ore map (black lines).

23
Figure 5. Plot of recorded cavern well loss circulation zones encountered during drilling. (No information for the original Dow Chemical cavern wells 1-5)

24
Table 2. List of cavern wells, top of salt, top of caprock, lost circulation zones, gas encountered, and pertinent notes. All measurements are depth. Bryan Mound Caverns TOP OF CAPROCK TOP OF SALT LOST CIRCULATION ZONE(S) GAS ENCOUNTERED ADDITIONAL NOTESBM101A UNK UNK none recorded
BM101C UNK UNK none recorded 3360 Took 90 hrs to drill thru CR (bit record)
BM102A UNK UNK 874', 944' ‐ 1046', 1023' ‐ 1067' Casing stuck at 809'
BM102C 824' 1080' none recorded
BM103B 852' 1080' 691', 735', 887', 981' ‐ 1280' Bulk Density Log showed S at 1050'‐1070'
BM103C UNK UNK 1010' ‐ 1036', 1075' ‐ 1081' DP, Well gained mud from 103B at 939'
BM104A UNK UNK 829' ‐ 984', 988' ‐ 1061', 1122'
BM104B 750' 1074' 976', 1055'
BM104C 760' 1077' 1062', 1118' ‐ 1154'
BM105B 784' 1083' none recorded Sulphur zone: 784‐1020
BM105C 722' 1091' none recorded "Junk" in hole at 820'
BM106A 729' 1083' 1040' ‐ 1110'
BM106B 730' 1084' none recorded
BM106C 728' 1082' none recorded
BM107A UNK UNK none recorded
BM107B 760' 1089' 954' ‐ 1089' Gas in Salt
BM107C 720' 1084' 964', 1091' 1685', 1707', 2052' Washout at 1086'‐1092'
BM108A 752' 1086' 1132', 1153'
BM108B UNK 1090' none recorded 707', 3958' S zone indicated at 940' ‐ 1070'
BM108C 745' 1086' 824' ‐ 885'
BM109A 720' 1085' none recorded
BM109B 725' 1085' 26" bit stuck at 740'
BM109C 730' 1085' 900' This is an extremely gassy cavern 7 separate "kicks"
KEY
UNK ‐ Unknown ‐ Drilling program had changed
DP ‐ Drilling program changed, geophysical logging not done

25
Table 2 (continued). List of cavern wells, top of salt, top of caprock, lost circulation zones, gas encountered, and pertinent notes. All measurements are depth. Bryan Mound Caverns TOP OF CAPROCK TOP OF SALT LOST CIRCULATION ZONE(S) GAS ENCOUNTERED ADDITIONAL NOTESBM110A 762' 1090' none recorded Drilling was changed on A while B was experiencing losses
BM110B 766' 1093' 1080' ‐ 1235'
BM110C 770' 1100' 1096', 1103'
BM111A 938' 1093' In Salt at 4510'
BM111B 918' 1099' 951'
BM112A UNK UNK
BM112C 747' 1079' none recorded
BM113A 845' 1081' none recorded
BM113B 846' 1079' none recorded
BM114A 858' 1084' 1022' ‐ 1026', 1026' ‐ 1034'
BM114B 863 1085' 1023' ‐ 1080'
BM115A 866' 1092' 965' ‐ 987', 1056' ‐ 1064',
1078' ‐ 1080', 1130' ‐ 1220
BM115B 863' 1080' 1056' ‐ 1064', 1078' ‐ 1080'
BM116A 918' 1100' 992' ‐ 1016', 1026' ‐ 1035' Soft zone between 1055' and 1085'
BM116B 868' 1100' 1054' ‐ 1087', 1122' ‐ 1303' 1303' 1441'
KEY
UNK ‐ Unknown ‐ Drilling program had changed
DP ‐ Drilling program changed, geophysical logging not done .

26
The process of sulphur mining used superheated water, which resulted in residual high
temperatures measured within the caprock zone (Hogan, 1980). Sattler and others (2004)
presented concerns of corrosion to the well casing and cement due to the superheated water. The
effect of high temperature in the presence of hydrogen sulfide and sulfate is extremely corrosive
waters. The waters themselves do not necessarily affect caprock stability, but do impact casing
and cement integrity. Examples of the impact of corrosion are, (1) in 1978 an abandoned brine
well that was plugged spewed hot steamy water caused by corrosion of the pipe and cement plug
and (2) in 1982 Cavern 4 lost oil from a failed cemented casing and abundant heated caprock
fluid was found in the cavern (Schmit/Louis Records, 1978; Hogan, 1980).
Sattler and others (2004) created a map of the temperature distribution within the caprock
(Figure 6) to help predict which wells may be at a higher risk to corrosion due to greater
exposure to superheated waters. The distribution of maximum temperature across the dome
correlates to a fault mapped by Neal in 1994. What the temperature distribution indicates, and
was recognized by Sattler and others (2004), is that fluid flow and convection is occurring across
the caprock and for that reason, the distribution of temperature does not correlate to the heavy
mined regions along the periphery of the dome. Table 3 provides a listing of the most recent
temperature measurements for the Bryan Mound cavern wells. The temperature distribution is
similar to what Sattler plotted with the coolest temperatures measured at caverns 114, 115, 116,
and 111, whereas the hottest temperature is measured at cavern 106.

27
Table 3. Most recent temperature measurements as of June, 2015.
Cavern Date Temperature
(degF)
Depth
(feet)
BM005 1/13/2015 151 820’
BM101 7/18/2013 151 840'
BM102 4/9/2013 148 880'
BM103 12/7/2007 153 910'
BM104 6/15/2015 143 850'
BM105 5/23/2012 148 840'
BM106 2/28/2012 161 730'
BM107 8/22/2011 153 780'
BM108 3/1/2011 157 760'
BM109 2/28/2011 160 730'
BM110 4/30/2013 157 780'
BM111 9/6/2011 140 990'
BM112 6/15/2015 153 780'
BM113 3/12/2012 154 730'
BM114 10/30/2012 131 900'
BM115 7/26/2012 131 1000'
BM116 9/15/2011 131 930'

28
Figure 6. Caprock temperatures logged within the Bryan Mound caprock. Temperature in F. (from Sattler, 2004)

29
8. SUMMARY
In summary, a definitive conclusion on the caprock integrity cannot be formed from the paucity
of data available. What can be inferred from the information Sandia was able to collect is the
location of the mapped sulphur ore reserve and that the mapped sulphur ore regions most likely
represent the most heavily mined regions of the caprock. Within those regions the caprock is
likely to be more crumbled, fractured, and cavernous than other regions of the caprock, which
were exposed to less mining activity. However, caprock by nature is fractured and vuggy and
drilling issues are common from one dome to the next. The lost circulation zones noted at Bryan
Mound, specifically within the caprock, in general do correlate to the mapped ore zones. Three
out of the four caverns that had no issues with drilling are within regions outside the mapped ore
zones. Water temperature within the caprock is still elevated and the temperature distribution
does not correlate to the mined regions, but were not expected to, because of fluid flow through
fractures. However, the hottest waters do correlate to a fault mapped by Neal (1994). Knowing
the temperature distribution helps predict which wells are more prone to failure by corrosion,
with the Cavern 106 wells located in the most corrosive region.
The cavern wells at Bryan Mound have had a high number of integrity concerns, compared to the
other SPR sites. The insight gained from understanding the sulphur mining process and the
resultant artifacts from the mining, especially at Bryan Mound, does help towards creating a
better caprock model and prediction of cavern well integrity.
30
REFERENCES Baker, C.L. 1935, “Sulphur in Texas”, Mineral Resource Circulars No.4, The University of
Texas at Austin, Bureau of Economic Geology, p. 2.
Bartlett, Z.W., 1946, “Salt and sulphur resources of Texas”, in Proceedings and transactions of
the Texas Academy of Science, v. 29, pp. 186-191.
Ellison, S.P. Jr., 1971, “Sulfur in Texas”, Handbook No.2, The University of Texas at Austin,
Bureau of Economic Geology. p. 48.
Halbouty, M.T., 1979, “Salt Domes Gulf Region, United States and Mexico”, Second Edition,
Gulf Publishing Company pp. 140, 149.
Hawkins, M.E. and Jirik,C.J., 1966, “Salt Domes in Texas, Louisiana, Mississippi, Alabama, and
Offshore Tidelands: A Survey”. Bureau of Mines Information Circular 8313, United States
Department of the Interior. pp. 26-36.
Hogan, R.G., “Strategic Petroleum Reserve (SPR) Geological Site Characterization Report,
Bryan Mound Salt Dome”, SAND80-7111. Sandia National Laboratories, Albuquerque, NM,
October 1980.
Jacobs/D’Appolonia Engineers, 1982, “Well History – Well No. 116B Bryan Mound Site,
Strategic Petroleum Reserve”, Houston Texas.
Kennedy, W., 1926, “The Bryan Heights Salt Dome, Brazoria County, Texas”, American
Association of Petroleum Geologists Special Volumes – SP 1 – Geology of Salt Dome Oil
Fields, pp. 678-690.

31
Kirby, C.L., 2015, “Sulphur Extraction at Bryan Mound: Personnel Contact List”, memo to A.S.
Lord, Sandia National Laboratories, Albuquerque, NM, August 7, 2015.
Kyle, J.R., 2002, “A century of fire and brimstone: the rise and fall of the Frasch sulphur
industry of the Gulf of Mexico Basin”, Scott, P.W. & Bristow, C.M. (eds) Industrial Minerals
and Extractive Industry Geology. Geological Society, London, pp. 189-198.
Lord, A.S., 2007, “An Updated Three-Dimensional Site Characterization Model of the Bryan
Mound Strategic Petroleum Reserve Site, Texas” p.35.
Louis Records and Associates, Inc., 1979, Well History Records, Caverns BM106, BM107,
BM108, BM109, BM110.
Marx, A.H., 1936, “Hoskins Mound Salt Dome, Brazoria County, Texas”, Bulletin of the
American Association of Petroleum Geologists, Vol. 20, No. 2, pp. 155-178.
Mullican, W.F. III, 1988, “Subsidence and Collapse at Texas Salt Domes”, Geological Circular
88-2, The University of Texas at Austin, Bureau of Economic Geology, p. 30.
Myers, J.C., 1968, “Gulf Coast Sulfur Resources”, in Fourth Forum on Geology of Industrial
Minerals, Austin, Texas, The University of Texas at Austin, Bureau of Economic Geology, pp.
57-65.
Neal, J.T., Magorian, T.R., Ahmad, S., 1994, “Strategic Petroleum Reserve (SPR) Additional
Geologic Site Characterization Studies Bryan Mound Salt Dome, Texas” SAND94-2331, Sandia
National Laboratories, Albuquerque, NM, p.113.

32
Petroleum Operations and Support Service, Inc. 1983, “Brian Mound Cavern 4 Well Failure
Report”, Document 159830176, March 1983, p. 55.
Sawtelle, G.G., 1936, “Salt Dome Statistics”, Bulletin of the American Association of Petroleum
Geologists, Vol.20, No.6, pp.726-735.
Sattler, A.R., Rautman, C.A., Ehgartner, B.L., Sobolik, S.R., 2004, “Casing Damage and
Corrosion (What was done)”, Presentation: Sandia National Laboratories, Albuquerque, NM.
Schmit, G., 1978, “Old Sulphur Well – Control Operation – Bryan Mound”, Memorandum to
Louis Records & Associates.
Seni, S.J., Mullican, W.F. III, Hamlin, H.S., 1985,Texas Salt Domes: Natural Resources, Storage
Caverns, and Extraction Technology”. Contract Report for Texas Department of Water
Resources under Interagency Contract No. IAC (84-85)-1019. The University of Texas at Austin,
Bureau of Economic Geology, Austin, TX. p. 161.
Vail, R.H., 1912, “A New Sulphur Operation in the South”, The Engineering and Mining
Journal, Vol. 94, No. 10, pp. 449-453.
Warren, J.K., 2006, “Evaporites: Sediments, Resources and Hydrocarbons”, Springer-Verlag,
Berlin Heidelberg, Germany, p. 1035.

33
DISTRIBUTION External Distribution Electronic copies to: Wayne Elias ([email protected]) for distribution to DOE SPR Program Office, Washington, D.C. U.S. Department of Energy Office of Fossil Energy Forrestal Building 1000 Independence Ave., SW Washington, DC 20585 Diane Willard ([email protected]) for distribution to DOE and FFPO SPR Project Management Office, New Orleans, LA. U.S. Department of Energy Strategic Petroleum Reserve Project Management Office 900 Commerce Road East New Orleans, LA 70123 Sandia Distribution 1 MS 0706 Borns, David (electronic copy) 1 MS 0735 Webb, Erik K (electronic copy) 1 MS 0750 Halloran, Amy Randolph (electronic copy) 1 MS 0899 Technical Library (electronic copy) 5 MS 0750 Strategic Petroleum Reserve Library (printed copy)

34